measurement of w44+ and w density ratio in jt-60ut. nakano and h. kubo japan atomic energy agency...
TRANSCRIPT
T. Nakano and H. Kubo Japan Atomic Energy Agency
Acknowledge to J. Yanagibayashi at Kyoto Univ.
A. Sasaki at JAEA
Measurement of W44+ and W45+ density ratio in JT-60U
2P3/2
W45+ :3d104s
W46+ :3d10
2P1/2 (2.24 eV) 電離
励起
(電子衝突)
(イオン衝突)
自然放出
=
!
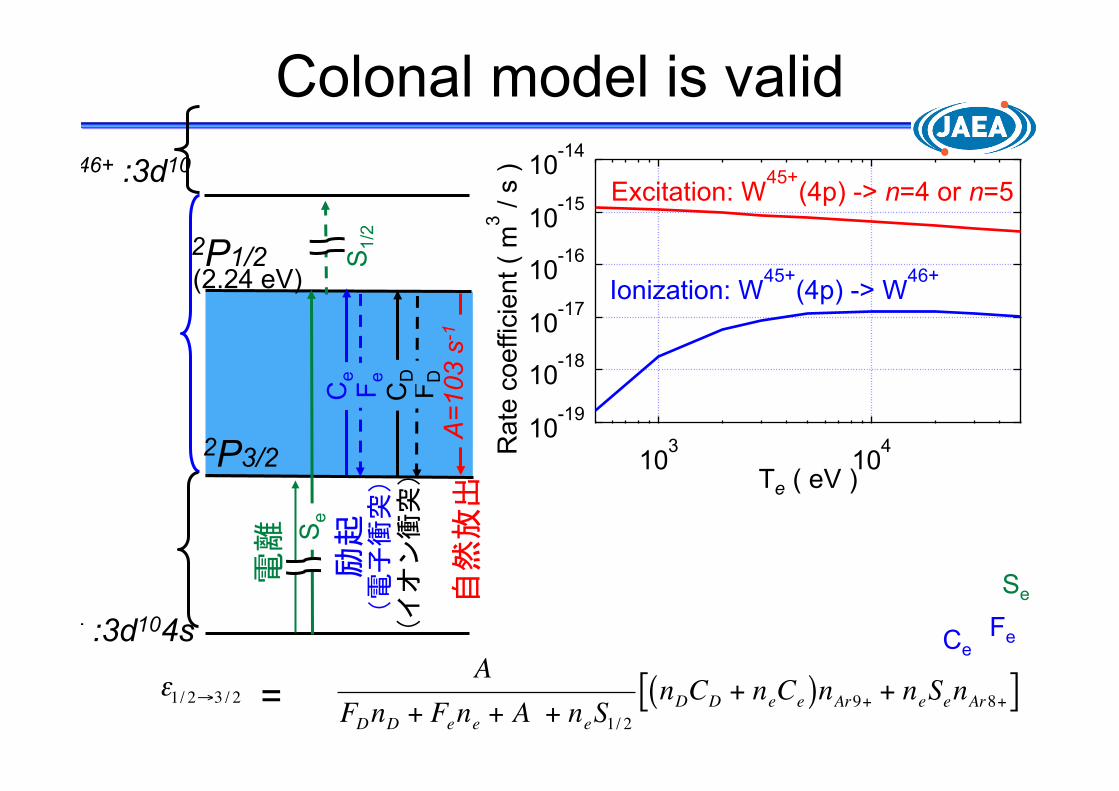
AFDnD + Fene + A + neS1/ 2
nDCD + neCe( )nAr9+ + neSenAr8+[ ]
!
"1/ 2#3 / 2
A=1
03 s
-1
F D
CD
F e
Ce
Se
S1/
2
FD CD Fe Ce
Se
S1/2
Colonal model is valid
10-19
10-18
10-17
10-16
10-15
10-14
Ra
te c
oeffic
ient (
m3 / s
)
103
104
Te ( eV )
Ionization: W45+
(4p) -> W46+
Excitation: W45+
(4p) -> n=4 or n=5
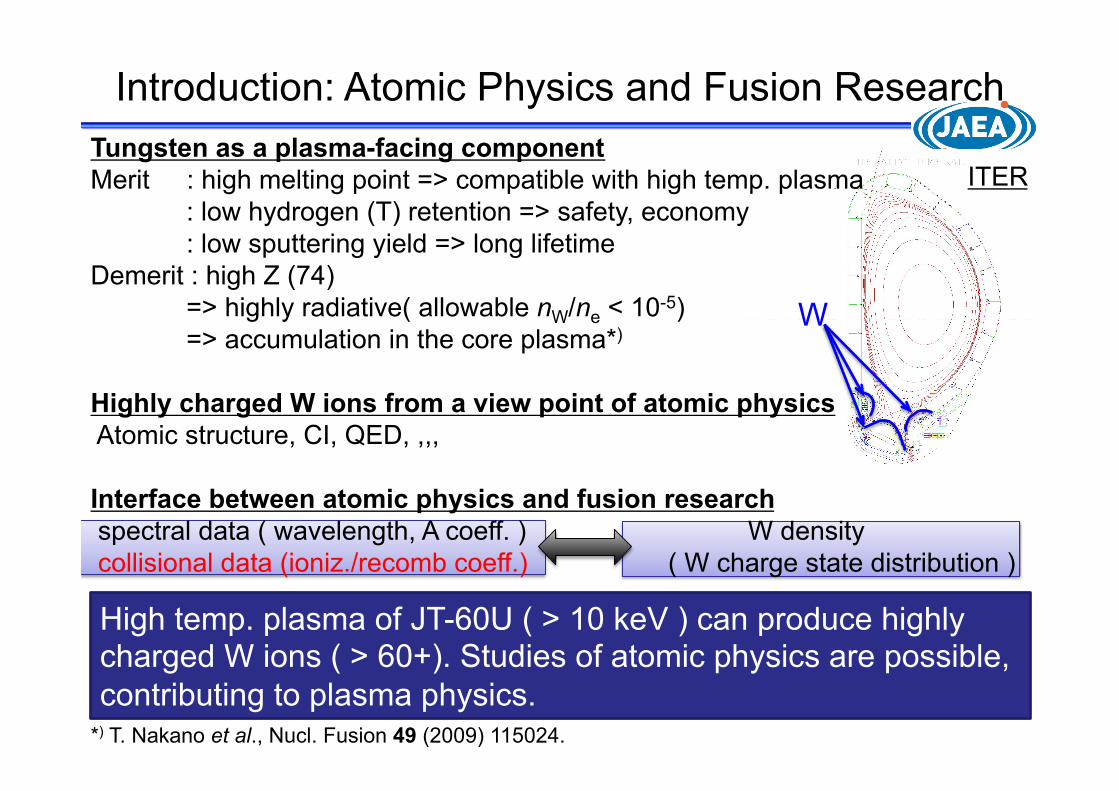
Tungsten as a plasma-facing component Merit : high melting point => compatible with high temp. plasma
: low hydrogen (T) retention => safety, economy : low sputtering yield => long lifetime
Demerit : high Z (74) => highly radiative( allowable nW/ne < 10-5) => accumulation in the core plasma*)
Highly charged W ions from a view point of atomic physics Atomic structure, CI, QED, ,,, Interface between atomic physics and fusion research spectral data ( wavelength, A coeff. ) W density collisional data (ioniz./recomb coeff.) ( W charge state distribution )
ITER
W
*) T. Nakano et al., Nucl. Fusion 49 (2009) 115024.
High temp. plasma of JT-60U ( > 10 keV ) can produce highly charged W ions ( > 60+). Studies of atomic physics are possible, contributing to plasma physics.
Introduction: Atomic Physics and Fusion Research
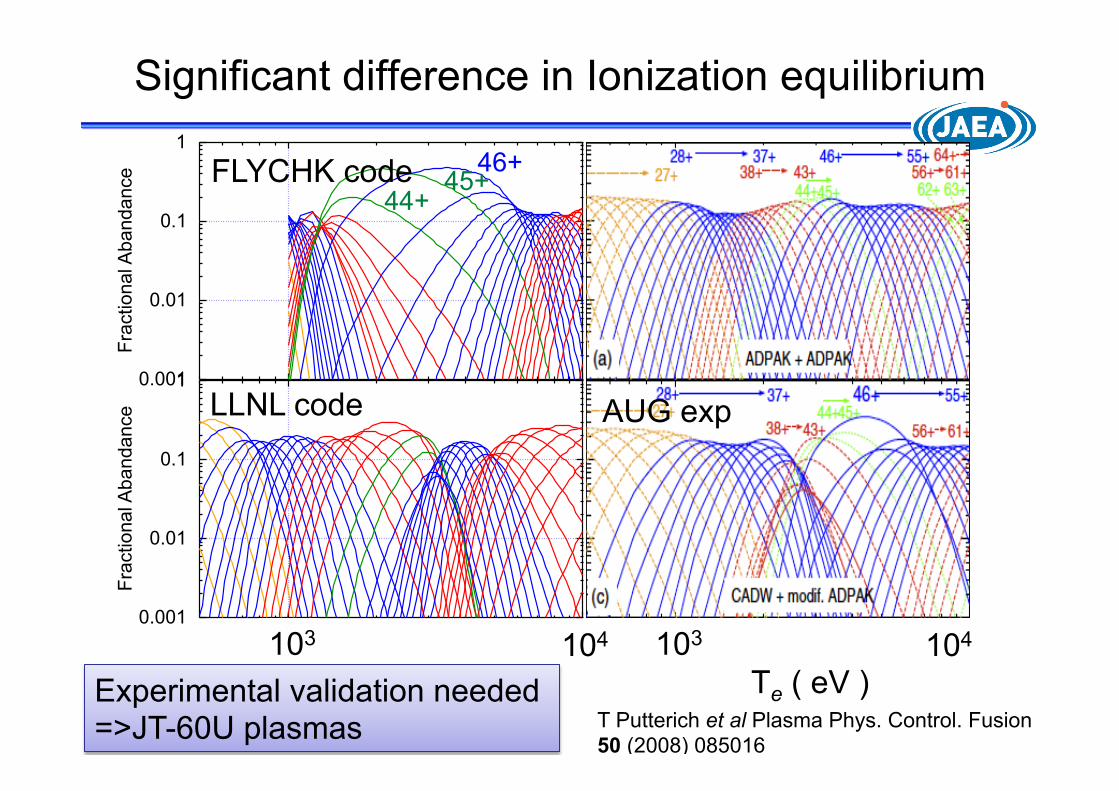
Significant difference in Ionization equilibrium
0.001
0.01
0.1
1F
ractio
na
l A
ba
nd
an
ce
0.001
0.01
0.1
1
Fra
ctio
na
l Ab
an
da
nce
103
104
Te ( eV ) Te ( eV ) Te ( eV )
103 104 103 104
FLYCHK code
LLNL code
T Putterich et al Plasma Phys. Control. Fusion 50 (2008) 085016
Experimental validation needed =>JT-60U plasmas
44+ 45+
46+
AUG exp
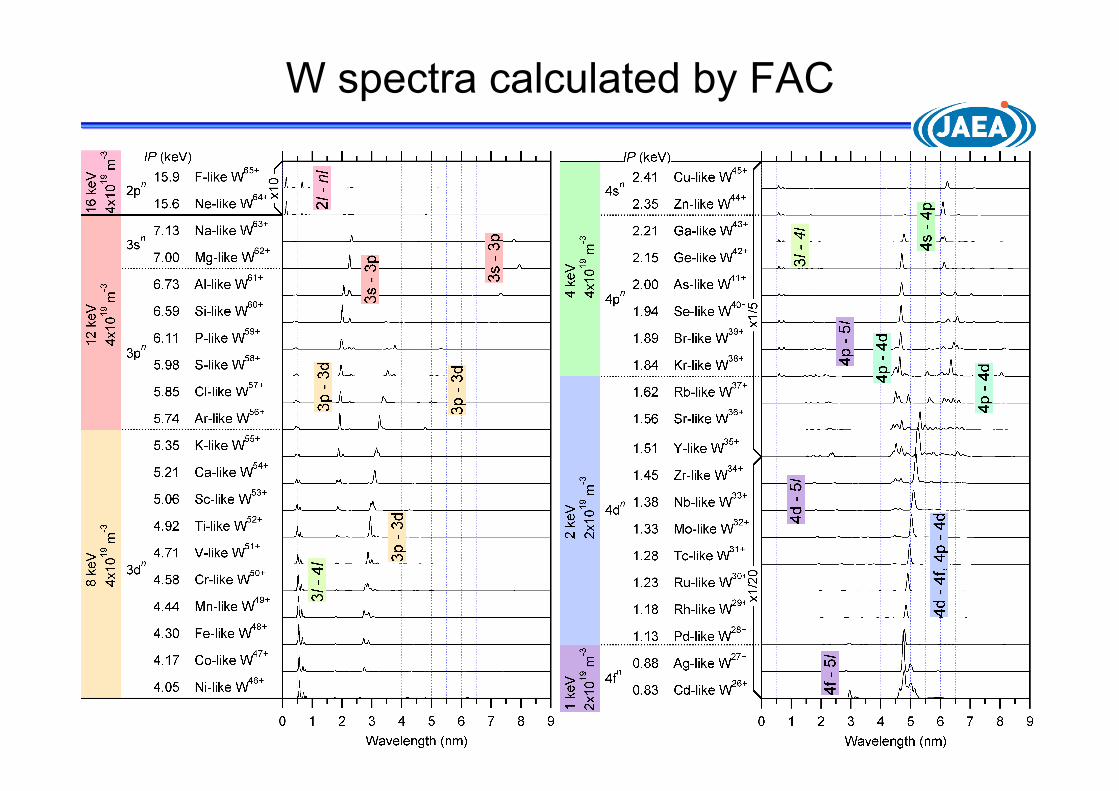
W spectra calculated by FAC
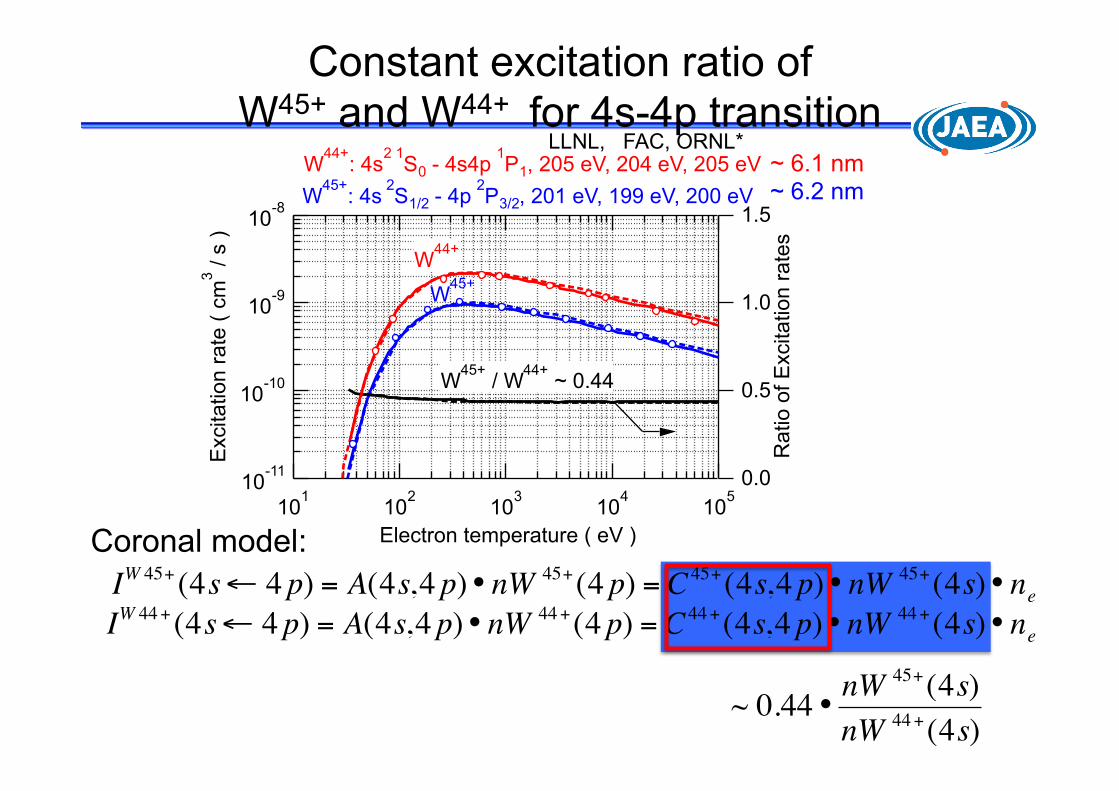
Constant excitation ratio of W45+ and W44+ for 4s-4p transition
!
IW 44+(4s" 4 p) = A(4s,4 p)• nW 44+(4 p) = C44+(4s,4 p)• nW 44+(4s)• ne
!
IW 45+(4s" 4 p) = A(4s,4 p)• nW 45+(4 p) = C45+(4s,4 p)• nW 45+(4s)• ne
!
~ 0.44 •nW 45+(4s)nW 44+(4s)
Coronal model:
~ 6.1 nm ~ 6.2 nm
10-11
10-10
10-9
10-8
Excitation r
ate
( c
m3 / s
)
101
102
103
104
105
Electron temperature ( eV )
1.5
1.0
0.5
0.0
Ra
tio o
f E
xcitation r
ate
s
W44+
: 4s2 1
S0 - 4s4p 1P1, 205 eV, 204 eV, 205 eV
W45+
: 4s 2
S1/2 - 4p 2P3/2, 201 eV, 199 eV, 200 eV
W44+
W45+
W45+
/ W44+
~ 0.44
LLNL, FAC, ORNL*

10-11
10-10
10-9
10-8
Excitation r
ate
( c
m3 / s
)
101
102
103
104
105
Electron temperature ( eV )
1.5
1.0
0.5
0.0
Ratio o
f E
xcitation r
ate
s
W44+
: 4s2 1
S0 - 4s4p 3P1, 90.2 eV
W45+
: 4s 2
S1/2 - 4p 2P1/2, 96 eV
W44+
W45+
W45+
/ W44+
~ 0.67
Constant excitation ratio of W45+ and W44+ for 4s-4p transition
!
IW 44+(4s" 4 p) = A(4s,4 p)• nW 44+(4 p) = C44+(4s,4 p)• nW 44+(4s)• ne
!
IW 45+(4s" 4 p) = A(4s,4 p)• nW 45+(4 p) = C45+(4s,4 p)• nW 45+(4s)• ne
!
~ 0.67•nW 45+(4s)nW 44+(4s)
Coronal model:
~ 13.3 nm ~ 12.7 nm
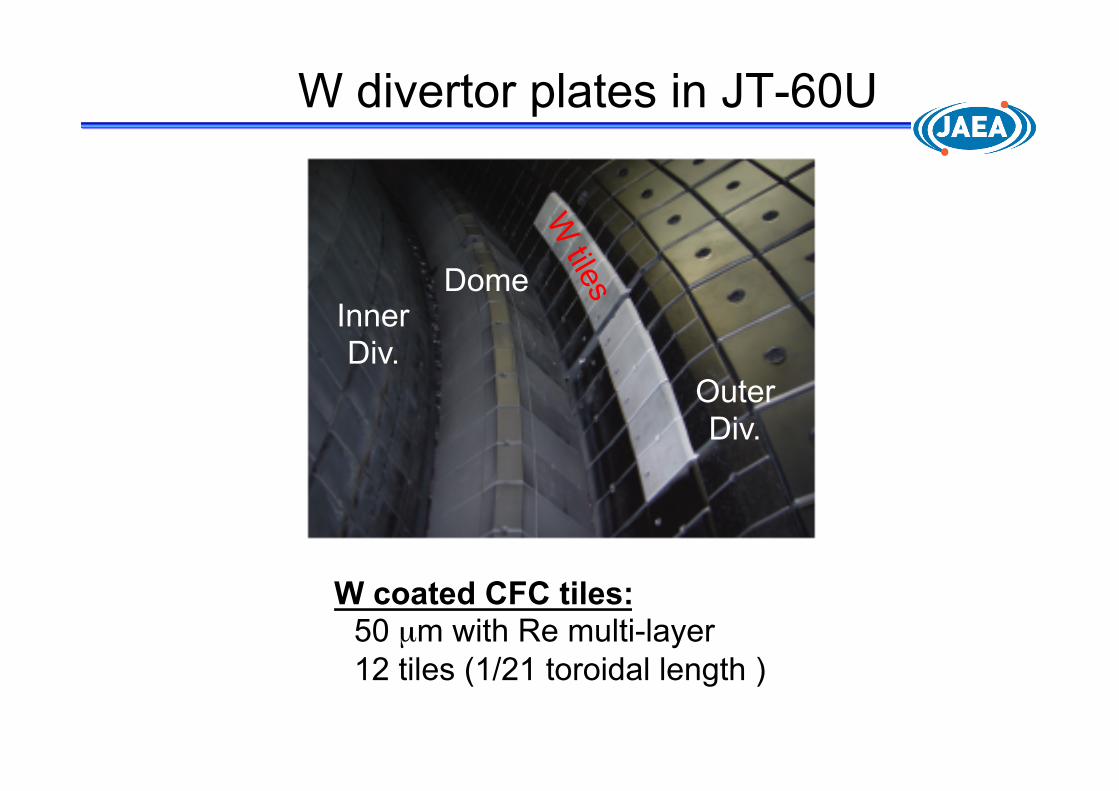
W divertor plates in JT-60U
W coated CFC tiles: 50 µm with Re multi-layer 12 tiles (1/21 toroidal length )
Dome Inner Div.
Outer Div.
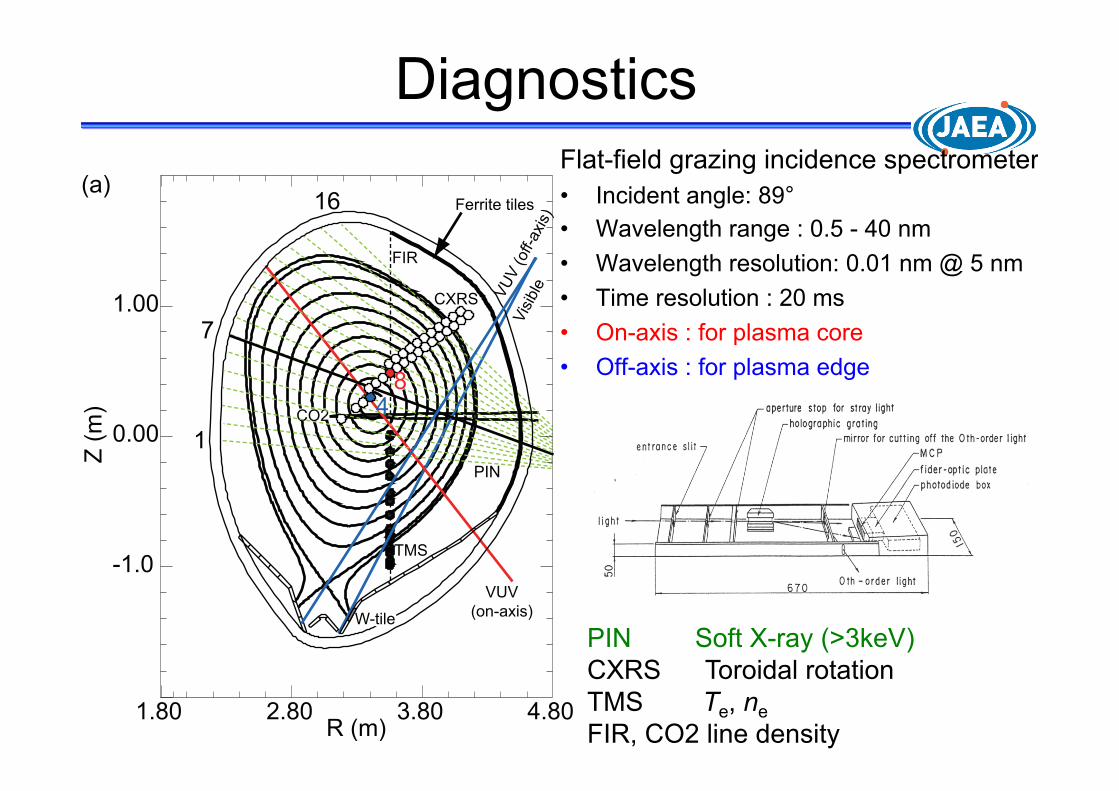
Diagnostics Flat-field grazing incidence spectrometer • Incident angle: 89° • Wavelength range : 0.5 - 40 nm • Wavelength resolution: 0.01 nm @ 5 nm • Time resolution : 20 ms • On-axis : for plasma core • Off-axis : for plasma edge
TMS
CO2
FIR
Visib
le
VUV(on-axis)
VUV
(off-
axis)
16
7
1PIN
48
CXRS
1.80 2.80 3.80 4.80R (m)
-1.0
0.00
1.00
Z (m
)
W-tile
(a)Ferrite tiles
PIN Soft X-ray (>3keV) CXRS Toroidal rotation TMS Te, ne FIR, CO2 line density
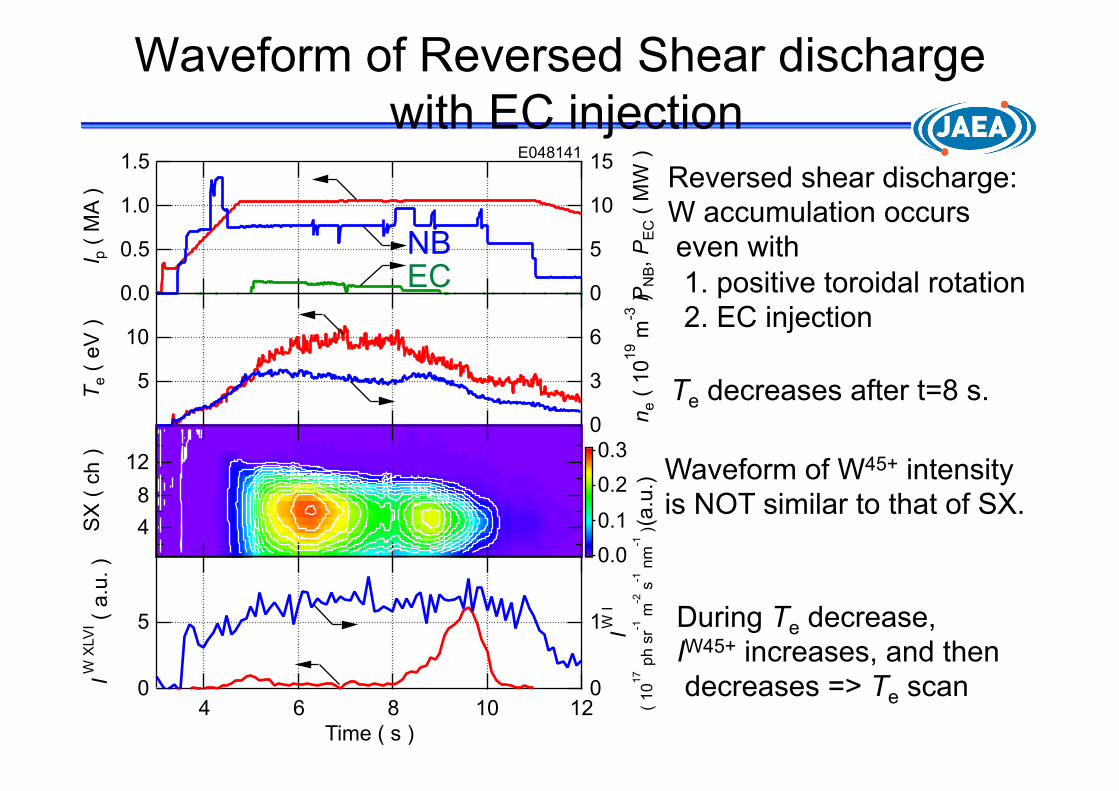
Waveform of Reversed Shear discharge with EC injection
1.5
1.0
0.5
0.0
I p (
MA
)
15
10
5
0 PN
B, P
EC (
MW
)E048141
12
8
4SX
( c
h ) 0.3
0.2
0.1
0.0
(a.u
.)
10
5
Te (
eV
)
6
3
0 ne (
10
19 m
-3 )
5
0
I W
XLV
I ( a
.u. )
1210864
Time ( s )
1
0
I W I
( 1
017 p
h s
r-1 m
-2 s
-1 n
m-1
)
EC NB
Reversed shear discharge: W accumulation occurs even with 1. positive toroidal rotation 2. EC injection
Te decreases after t=8 s.
Waveform of W45+ intensity is NOT similar to that of SX.
During Te decrease, IW45+ increases, and then decreases => Te scan
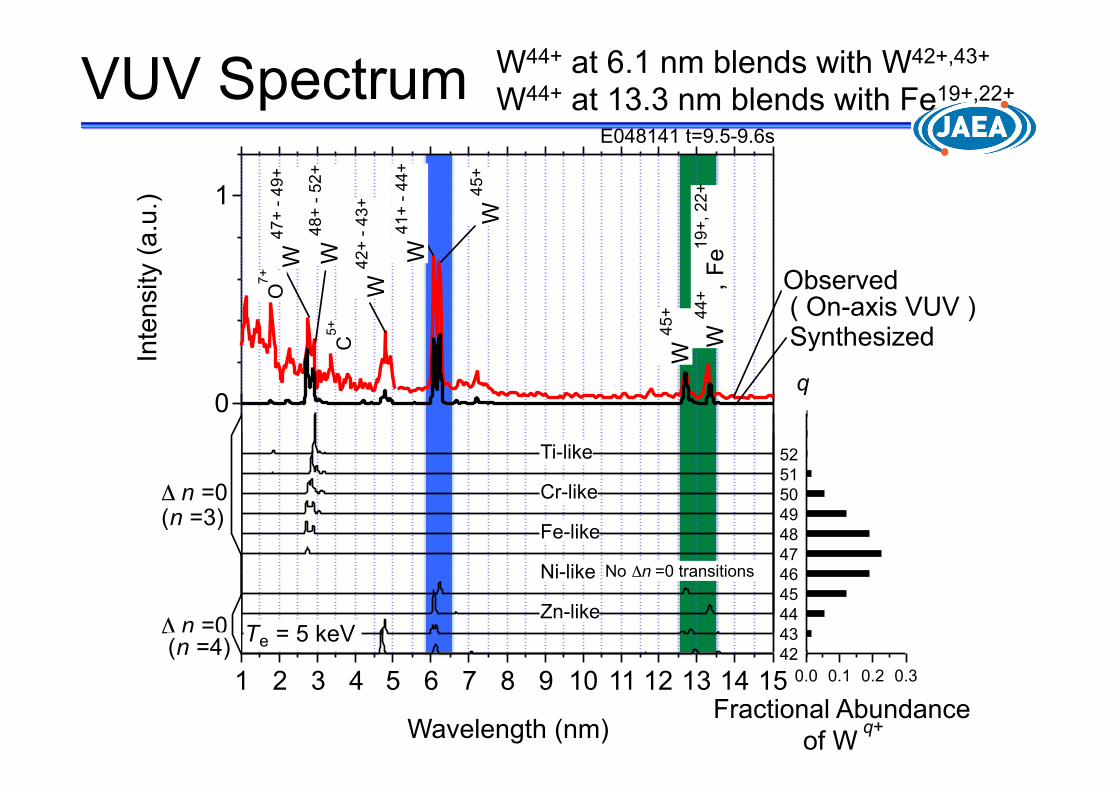
VUV Spectrum
1
0
Inte
nsity (
a.u
.)
151413121110987654321
Wavelength (nm)
0.30.20.10.0
Fractional Abundance
52
51
50
49
48
47
46
45
44
43
42
Ti-like
Cr-like
Fe-like
Zn-like
q
W 4
7+
- 4
9+
W 4
8+
- 5
2+
W 4
5+
W 4
1+
- 4
4+
W 4
2+
- 4
3+
Te = 5 keV
! n =0
! n =0
of W q+
Observed
Synthesized
(n =4)
(n =3)
E048141 t=9.5-9.6s
O7+
C5+
( On-axis VUV )
Ni-like No !n =0 transitions
W 4
5+
W 4
4+,
Fe
19+
, 2
2+
W44+ at 6.1 nm blends with W42+,43+
W44+ at 13.3 nm blends with Fe19+,22+
1.5
1.0
0.5
0.0
I p ( M
A )
15
10
5
0 PN
B, P
EC (
MW
)E048141
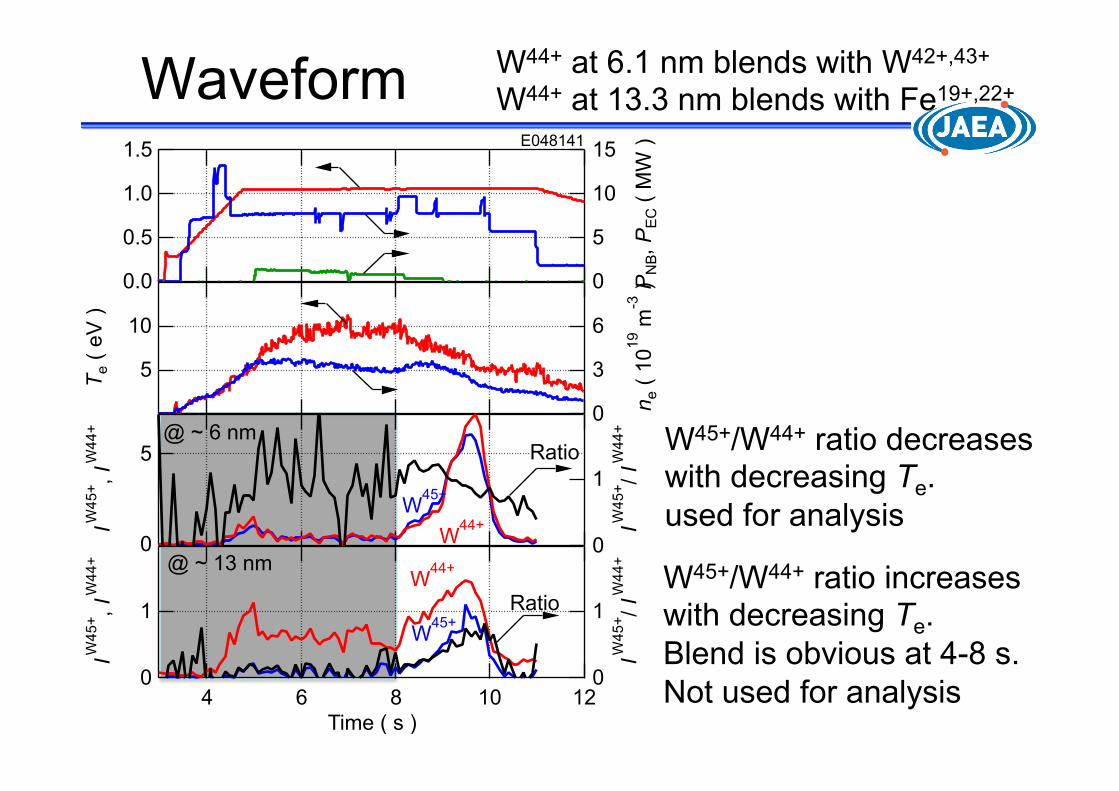
Waveform
W45+/W44+ ratio increases with decreasing Te. Blend is obvious at 4-8 s. Not used for analysis
W45+/W44+ ratio decreases with decreasing Te. used for analysis
10
5T e (
eV ) 6
3
0 n e (
1019
m-3
)
5
0
I W45
+ , I W
44+
1
0
I W45
+ / I W
44+
W44+W45+
Ratio @ ~ 6 nm
1
0
I W45
+ , I W
44+
1210864Time ( s )
1
0
I W45
+ / I W
44+
W44+
W45+Ratio
@ ~ 13 nm
W44+ at 6.1 nm blends with W42+,43+
W44+ at 13.3 nm blends with Fe19+,22+
0.001
2
4
0.01
2
4
0.1
2
4
1
W4
4+, W
45
+ fra
ctio
nal A
bandance
103
2 3 4 5 6 7 8 9
104
Electron temperature ( eV )
0.1
1
10
100R
el d
ensity r
atio (
W45
+ / W
44
+ )
LLNL
FLYCHK
ASDEX-U
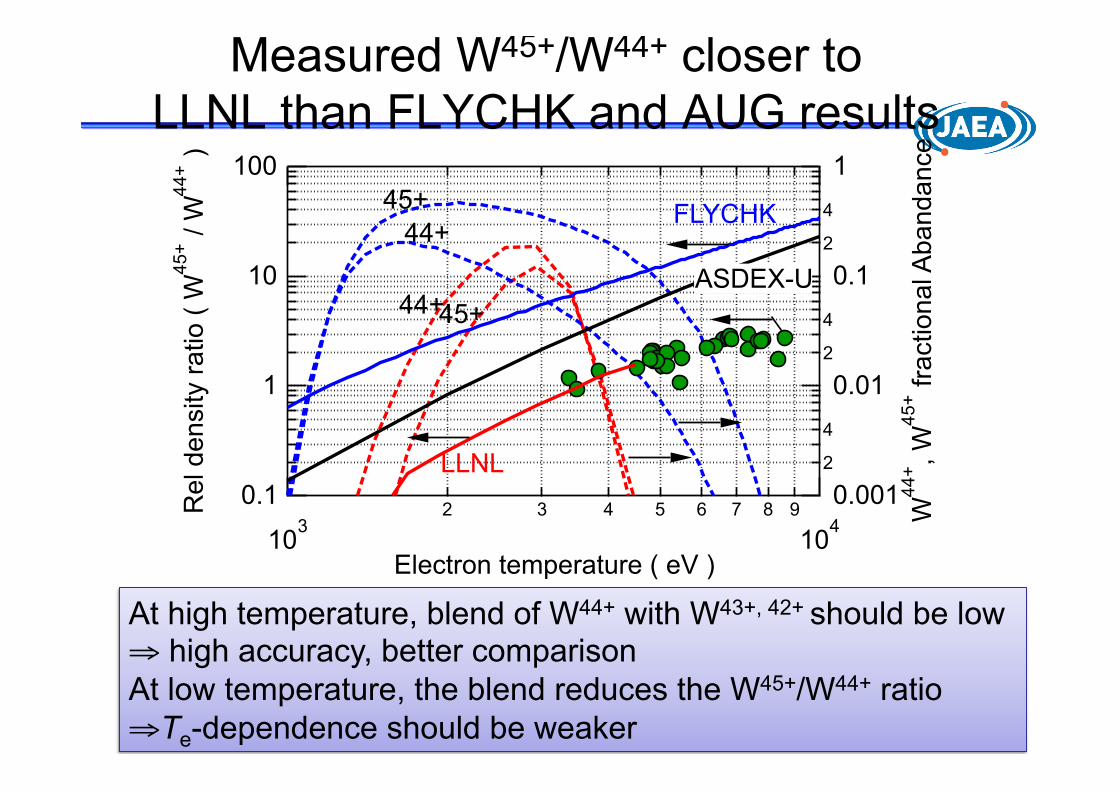
Measured W45+/W44+ closer to LLNL than FLYCHK and AUG results
At high temperature, blend of W44+ with W43+, 42+ should be low ⇒ high accuracy, better comparison At low temperature, the blend reduces the W45+/W44+ ratio ⇒ Te-dependence should be weaker
44+ 45+
45+ 44+

103
2 3 4 5 6 7 8 9
104
Electron temperature ( eV )
0.1
1
10
100R
el d
ensity r
atio (
W45
+ / W
44
+ )
LLNL
FLYCHK
ASDEX-U
Measured W45+/W44+ closer to LLNL than FLYCHK and AUG results
At high temperature, blend of W44+ with W43+, 42+ should be low ⇒ high accuracy, better comparison At low temperature, the blend reduces the W45+/W44+ ratio ⇒ Te-dependence should be weaker

70
60
50
40
Mean Ion C
harg
e
2015105
Te ( 103 eV )
ALICE ATOMIC AVERROES CORA_H7 CORD_H7 CRETIN FLYCHK JATOM SCRAMCA SCRAM_H SCSF
Results from the 6th NLTE code comparison workshop through the courtesy of A. Sasaki
NLTE workshop: code-code comparison under fix conditions ⇒ Difference between codes reduces every meeting But still big difference at 7 keV
1x10²⁰ m-3
103
2 3 4 5 6 7 8 9
104
Electron temperature ( eV )
0.1
1
10
100R
el d
ensity r
atio (
W45
+ / W
44
+ )
LLNL
FLYCHK
ASDEX-U
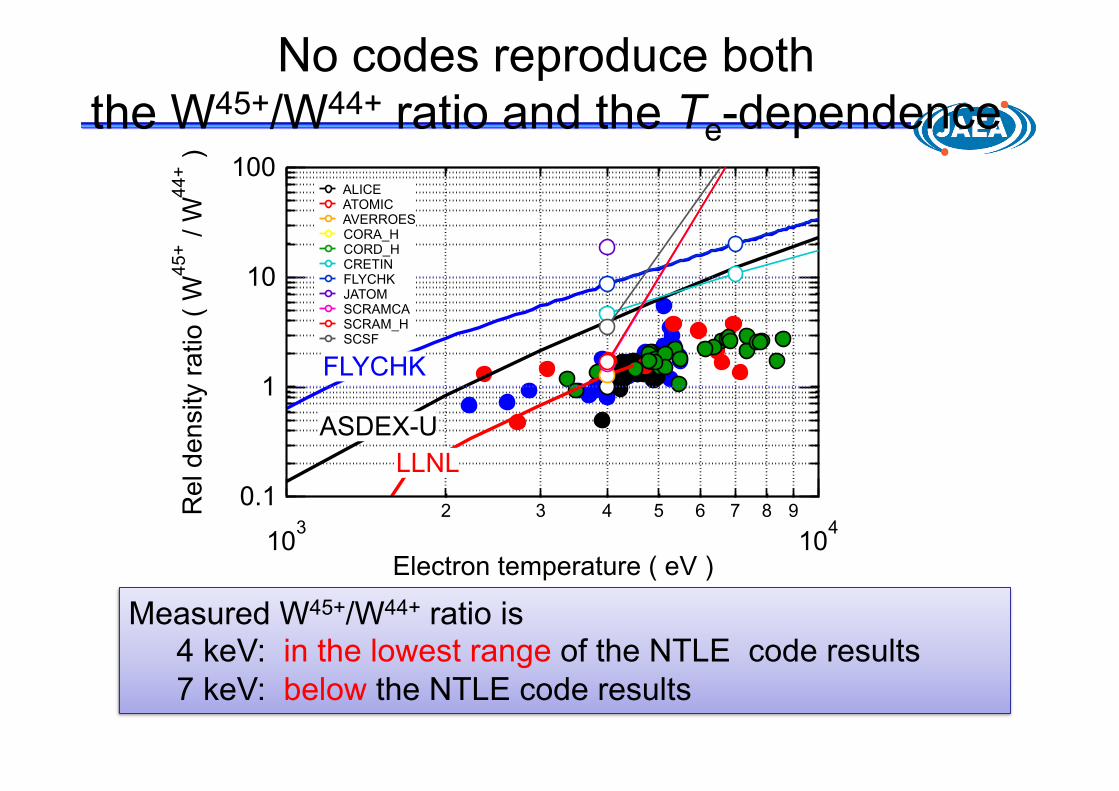
No codes reproduce both the W45+/W44+ ratio and the Te-dependence
Measured W45+/W44+ ratio is 4 keV: in the lowest range of the NTLE code results 7 keV: below the NTLE code results
ALICE ATOMIC AVERROES CORA_H CORD_H CRETIN FLYCHK JATOM SCRAMCA SCRAM_H SCSF
Summary
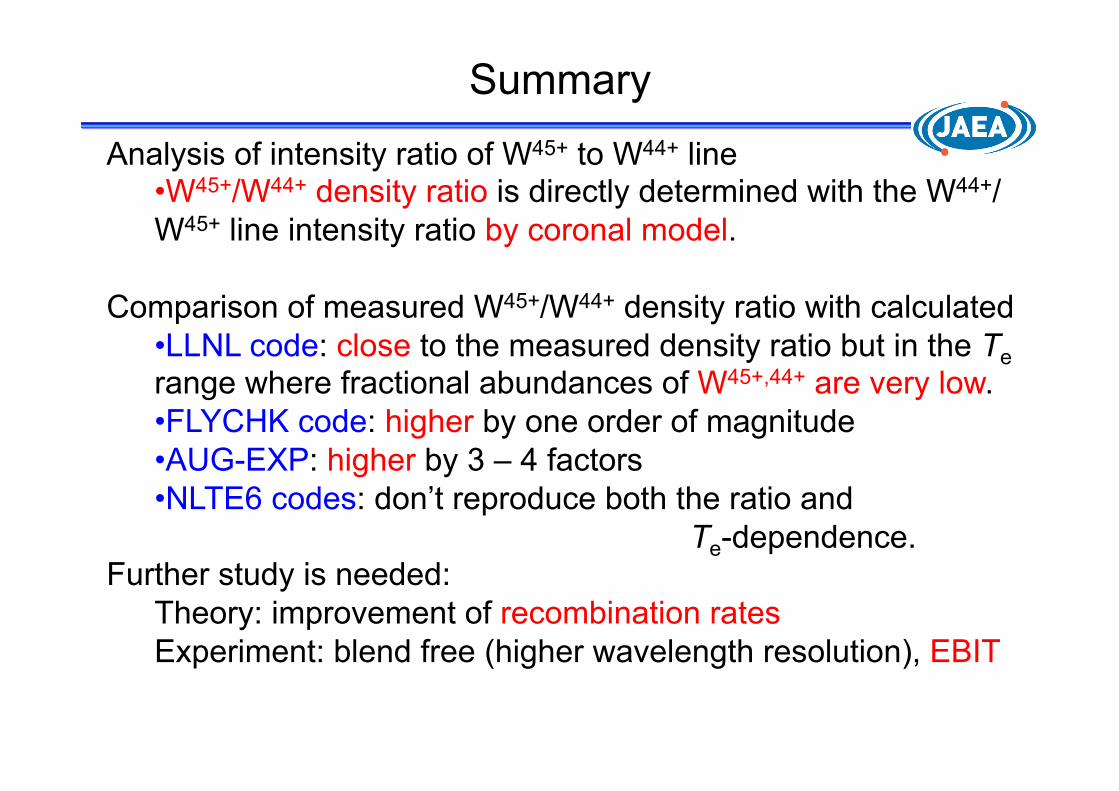
Analysis of intensity ratio of W45+ to W44+ line • W45+/W44+ density ratio is directly determined with the W44+/W45+ line intensity ratio by coronal model.
Comparison of measured W45+/W44+ density ratio with calculated • LLNL code: close to the measured density ratio but in the Te range where fractional abundances of W45+,44+ are very low. • FLYCHK code: higher by one order of magnitude • AUG-EXP: higher by 3 – 4 factors • NLTE6 codes: don’t reproduce both the ratio and
Te-dependence. Further study is needed:
Theory: improvement of recombination rates Experiment: blend free (higher wavelength resolution), EBIT
Thank you!
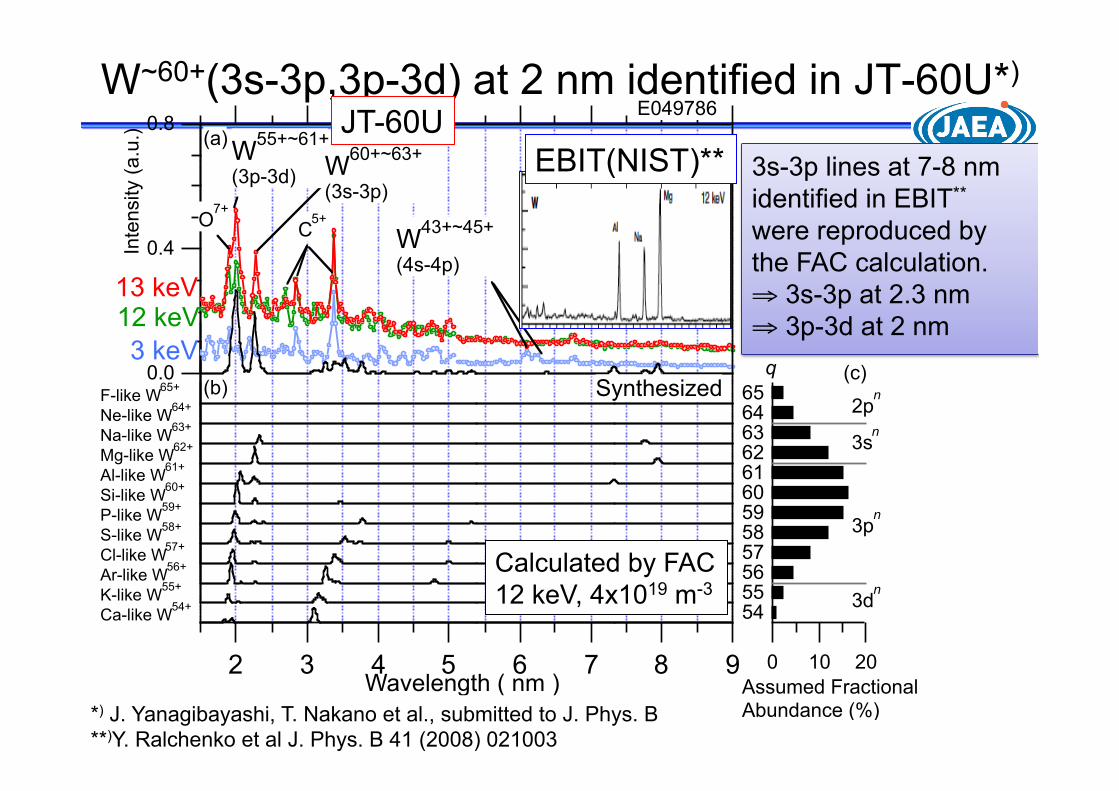
W~60+(3s-3p,3p-3d) at 2 nm identified in JT-60U*)
0.8
0.4
0.0
Inte
nsity
(a.u
.)
98765432Wavelength (nm)
20100
656463626160595857565554
F-like W65+
Ne-like W64+
Na-like W63+
Mg-like W62+
Al-like W61+
Si-like W60+
P-like W59+
S-like W58+
Cl-like W57+
Ar-like W56+
K-like W55+
Ca-like W54+
E049786
q Synthesized
C5+O
7+
W55+~61+
(3p-3d) W60+~63+
(3s-3p)
W43+~45+
(4s-4p)
2pn
3sn
3pn
3dn
(a)
(b)
Assumed FractionalAbundance (%)
(c)3 keV
12 keV13 keV
Calculated by FAC 12 keV, 4x10¹⁹ m-3
JT-60U
Wavelength ( nm ) *) J. Yanagibayashi, T. Nakano et al., submitted to J. Phys. B **)Y. Ralchenko et al J. Phys. B 41 (2008) 021003
EBIT(NIST)** 3s-3p lines at 7-8 nm identified in EBIT** were reproduced by the FAC calculation. ⇒ 3s-3p at 2.3 nm ⇒ 3p-3d at 2 nm
1.5
1.0
0.5
0.0
I p ( M
A )
15
10
5
0 PN
B, P
EC (
MW
)E048141
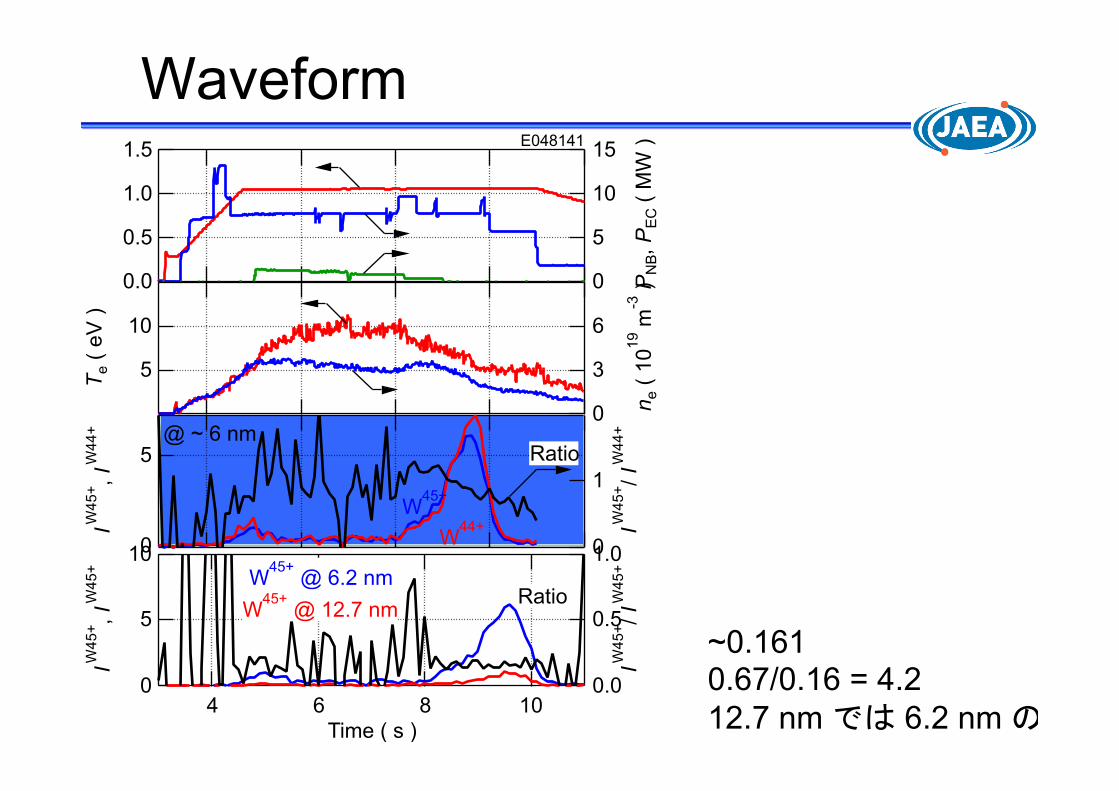
Waveform
10
5T e (
eV ) 6
3
0 n e (
1019
m-3
)
5
0
I W45
+ , I W
44+
1
0
I W45
+ / I W
44+
W44+W45+
Ratio @ ~ 6 nm
10
5
0
I W45+, I W
45+
10864
Time ( s )
1.0
0.5
0.0
I W45
+/ I W
45+
W45+
@ 6.2 nm
W45+
@ 12.7 nmRatio
~0.161 0.67/0.16 = 4.2 12.7 nm では 6.2 nm の感度の1/4.2と概算される

10-11
10-10
10-9
10-8
Exc
itatio
n ra
te (
cm3 /
s )
101 102 103 104 105
Electron temperature ( eV )
1.5
1.0
0.5
0.0
Rat
io o
f Exc
itatio
n ra
tes
W45+: 4s 2S1/2 - 4p 2P1/2, 96 eVW45+: 4s 2S1/2 - 4p 2P3/2, 201 eV
W45+ / W44+ ~0.66