measurement of element normalized level difference of … · requirements to the measurement method...
TRANSCRIPT

VTT PUBLICATIONS 262
Measurement of element normalizedlevel difference of small buildingelements with intensity technique
Seppo Uosukainen
VTT Building Technology
TECHNICAL RESEARCH CENTRE OF FINLANDESPOO 1995

ISBN 951-38-4920-1ISSN 1235-0621Copyright © Valtion teknillinen tutkimuskeskus (VTT) 1995
JULKAISIJA – UTGIVARE – PUBLISHER
Valtion teknillinen tutkimuskeskus (VTT), Vuorimiehentie 5, PL 42, 02151ESPOOpuh. vaihde (90) 4561, telekopio 456 4374, teleksi 125 175 vttin sf
Statens tekniska forskningscentral (VTT), Bergsmansvägen 5, PB 42, 02151 ESBOtel. växel (90) 4561, telefax 456 4374, telex 125 175 vttin sf
Technical Research Centre of Finland (VTT), Vuorimiehentie 5, P.O.Box 42, FIN–02151 ESPOO, Finlandphone internat. + 358 0 4561, telefax + 358 0 456 4374, telex 125 175 vttin sf
Technical editing Leena Ukskoski
VTT OFFSETPAINO, ESPOO 1995

3
Uosukainen, Seppo. Measurement of element normalized level difference of small building elements
with intensity technique. Espoo: Technical Research Centre of Finland, VTT Publications 262. 31 p.
+ app. 38 p.
UCD 534.6:699.844:534.24:534.83:622.43
Keywords measurement, sound insulation, intensity scanning, building elements
ABSTRACT
A laboratory method to evaluate the sound insulation of small building elementswas developed. In the method, sound intensity measurements are applied and theresults are expressed in terms of the element normalized level difference. Thereare special requirements concerning the installation and operation of smallbuilding elements in measuring their sound insulation. The consequences of therequirements to the measurement method are taken into account. Also the specialdemands caused by the small size of the object are taken into account. Asupplement, considering the general usefulness of the element normalized leveldifference (or unit sound insulation) in evaluating the sound insulation of par-titions, is included in the method. The supplement can be applied also to ISO140-10 and NT ACOU 037.
The classical form of the Waterhouse correction, the purpose of which is to takeaccount of the higher energy density near room boundaries, has been developedto an improved formula, which is a function of room modal density. TheWaterhouse correction can be determined for each room by measuring orcalculating its modal density. The improved form of the Waterhouse correctionnormally differs from the traditional one at third octave bands with centrefrequencies less than 100 Hz. There is a tendency for some measurementmethods in building acoustics to be used in an extended frequency range down toa third octave band with a centre frequency of 50 Hz. With that kind of extendedfrequency range, the refinement of the Waterhouse correction has an obviouseffect. The Waterhouse correction of the receiving room should be subtractedfrom the result of traditional measurements of the sound reduction index. This isespecially important if the results are compared with those of intensitymeasurements. No Waterhouse correction is needed for the source room. Themeasurement of sound insulation by the intensity technique needs no Waterhousecorrections.
Experimental measurements were carried out according to this method andaccording to ISO 140-10. Both of the methods give quite similar results with anaccuracy of 1 dB or better at a frequency range where the flanking transmissionis not very important and where both of the methods give valid results. Theeffects of flanking transmission on the sound insulation measurement results canbe diminished by using intensity technique. Very remarkable flankingtransmission may, however, make the results of the intensity technique invalid.

4
PREFACE
This publication is based on the final report for the NORDTEST project no.1065-92, titled "Measurement of element normalized level difference of smallbuilding elements using intensity technique". The goal of the project was to for-mulate a laboratory scanning method in accordance with the title. The project hasbeen carried out by the following project group:
Seppo Uosukainen, project leaderRaimo EurastoVTT (Technical Research Centre of Finland), FIN-02150 Espoo
Clara GöranssonSP (Swedish National Testing and Research Institute), S-50115Borås
Henrik OlesenDanish Technological Institute, DK-8000 Århus
Herold OlsenSintef Delab, N-7034 Trondheim.
The project was started in early 1993 and finished at the end of 1993. VTT actedas the responsible organization for the project. The project group held onemeeting in November 1993 in Otaniemi, Finland. Besides the project group hascommunicated via letters and telefax. The comments of the Nordic circulationprocess at 1994 have been taken into account in the proposal for theNORDTEST method (Annex). The proposal has been approved as theNORDTEST method NT ACOU 093 at 1995-01 [11].
Espoo, May 1995
Seppo Uosukainen

5
CONTENTS
ABSTRACT............................................................................................3
PREFACE..............................................................................................4
LIST OF SYMBOLS...............................................................................6
1 INTRODUCTION...............................................................................7
2 SOME CONSIDERATIONS ABOUT THE MEASUREMENTMETHOD.......................................................................................92.1 Basic quantities.........................................................................92.2 Some special aspects concerning the method............................10
3 WATERHOUSE CORRECTION.......................................................123.1 Waterhouse correction and modal density................................123.2 Applications of Waterhouse correction.....................................16
3.2.1 Determination of sound power.........................................163.2.2 Determination of absorption.............................................173.2.3 Sound insulation measurements........................................19
4 MEASUREMENTS...........................................................................214.1 Measurement equipment and rooms........................................214.2 Ventilation valves....................................................................224.3 Cable duct..............................................................................26
5 CONCLUSIONS...............................................................................28

6
REFERENCES.....................................................................................30
ANNEX: PROPOSAL FOR NORDTEST METHOD..............................1
1 SCOPE AND FIELD OF APPLICATION............................................4
2 REFERENCES....................................................................................5
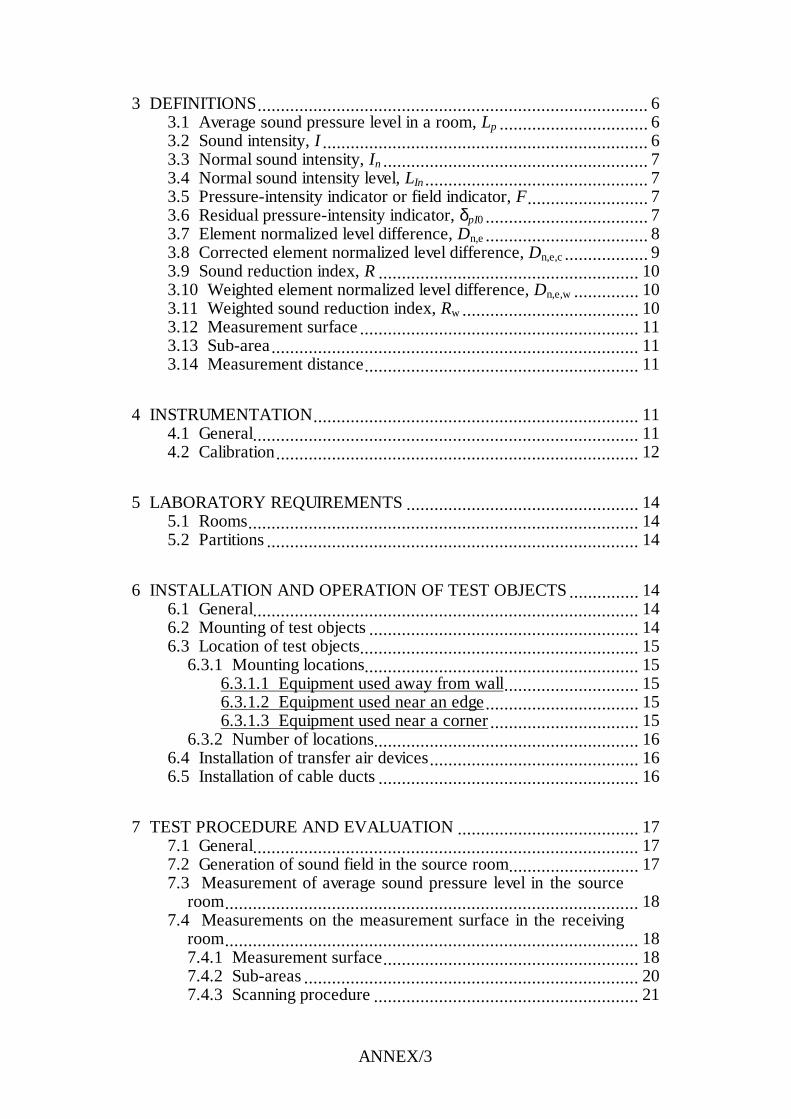
3 DEFINITIONS....................................................................................63.1 Average sound pressure level in a room, Lp ................................63.2 Sound intensity, I ......................................................................63.3 Normal sound intensity, In .........................................................73.4 Normal sound intensity level, LIn ................................................73.5 Pressure-intensity indicator or field indicator, F..........................73.6 Residual pressure-intensity indicator, δpI0 ...................................73.7 Element normalized level difference, Dn,e...................................83.8 Corrected element normalized level difference, Dn,e,c..................93.9 Sound reduction index, R ........................................................103.10 Weighted element normalized level difference, Dn,e,w..............103.11 Weighted sound reduction index, Rw ......................................103.12 Measurement surface............................................................113.13 Sub-area...............................................................................113.14 Measurement distance...........................................................11
4 INSTRUMENTATION......................................................................114.1 General...................................................................................114.2 Calibration..............................................................................12
5 LABORATORY REQUIREMENTS..................................................145.1 Rooms....................................................................................145.2 Partitions................................................................................14
6 INSTALLATION AND OPERATION OF TEST OBJECTS...............146.1 General...................................................................................146.2 Mounting of test objects..........................................................146.3 Location of test objects............................................................15
6.3.1 Mounting locations...........................................................156.3.1.1 Equipment used away from wall.............................156.3.1.2 Equipment used near an edge.................................156.3.1.3 Equipment used near a corner................................15

7
6.3.2 Number of locations.........................................................166.4 Installation of transfer air devices.............................................166.5 Installation of cable ducts........................................................16
7 TEST PROCEDURE AND EVALUATION.......................................177.1 General...................................................................................177.2 Generation of sound field in the source room............................177.3 Measurement of average sound pressure level in the source room
.................................................................................................187.4 Measurements on the measurement surface in the receiving room
.................................................................................................187.4.1 Measurement surface.......................................................187.4.2 Sub-areas........................................................................207.4.3 Scanning procedure.........................................................217.4.4 Sound intensity measurement...........................................237.4.5 Background noise............................................................25
7.5 Frequency range of measurements...........................................25
8 PRECISION......................................................................................25
9 EXPRESSION OF RESULTS............................................................26
10 TEST REPORT AND RECORD......................................................2610.1 Information to be reported.....................................................2610.2 Information to be recorded....................................................27
11 APPLICATION OF SOUND INSULATION DATA..........................28
ANNEX A: LOCAL CHANGE IN WALL THICKNESS...........................1A.1 Local increase of wall thickness................................................1A.2 Local decrease of wall thickness...............................................1
ANNEX B: SIMULATION OF CORNER AND EDGE LOCATIONS.......1
ANNEX C: GUIDELINES FOR THE DERIVATION OF THE OVERALLSOUND REDUCTION OF COMPOSITE PARTITIONCONSTRUCTIONS.........................................................................1

8
ANNEX D: REFINED FORM OF WATERHOUSE CORRECTION.........1

6
LIST OF SYMBOLS
A absorption (area)A0 reference area (for the laboratory, A0 = 10 m2)CW Waterhouse correction (in dB)c0 speed of sound in unperturbed fluidDI,n,e element normalized level difference, measured by intensity techniqueDn,e element normalized level differenceE energyF field indicator (pressure-intensity indicator)f frequencyI sound intensityIn1 incident average normal sound intensityIn2 transmitted average normal sound intensityL total length of dimensions of a roomLIn average sound intensity level over measurement surface (in receiver
room)Lp average sound pressure levelLp1 average sound pressure level in source roomn modal densityP sound powerP1 sound power incident on test specimenP2 sound power transmitted through test specimenPloss power lossp sound pressure (far from boundaries in diffuse fields)R sound reduction indexS total area of a room, area of a test specimenSm area of measurement surfaceT reverberation timet timeV volume of a roomW Waterhouse correctionδpI0 residual pressure-intensity indicatorη total internal loss of roomλ wavelengthρ0 density of unperturbed fluidω angular frequency

7
1 INTRODUCTION
A laboratory method for evaluating the unit sound insulation of small buildingelements NT ACOU 037 [9], based on traditional sound insulation measurementsbetween two reverberation rooms, was approved by Nordtest in 1982. Based onNT ACOU 037, an international standard ISO 140-10 [3] for evaluating theelement normalized level difference (= unit sound insulation + 10 dB) of smallbuilding elements was approved. The methods apply to building elements,excluding windows and doors (ISO 140-10), with an area of less than 1 m2 (ISO140-10) and which occur in a certain number of discrete sizes with well-definedlateral dimensions and which transmit sound between two adjacent rooms, orbetween one room and the open air (ISO 140-10) independently of the adjoiningbuilding elements. Some examples of equipment covered by the methods aretransfer air devices, airing panels (ventilators), outdoor air intakes, cable ductsand transit sealing systems.
One of the main problems of the methods is the flanking transmission through thepartition built in the test opening between the rooms in which the object undertest should be placed. The problem can be most clearly discovered in situationswhere the object has high sound insulation properties. In NT ACOU 037 and ISO140-10, two ways of avoiding the effects of flanking transmission on the resultare given: to correct mathematically the measurement result using the soundinsulation of the flanking path; and to use more than one object in the testopening simultaneously to get the relative proportion of the flanking transmissionsmaller. The mathematical correction works only to a limiting value for the soundinsulation of the object, the value depending on the flanking sound insulation;above this limit only a lower limit for the insulation will be achieved. Using morethan one object has the disadvantage of possible interaction between the soundradiated by the objects at low frequencies (third octave bands below 400 Hz).The interaction tends to decrease the measured insulation. The interaction can belowered only by increasing the distances between the objects, which is notalways desirable for other reasons.
The main advantages of using sound intensity measurements in evaluating thesound insulation is the possibility to diminish the effects of flanking transmissionon the measurement results and the ability to measure elements having very highsound insulation properties. In the traditional methods based on sound pressuremeasurements the sound reduction index based upon all paths between thesource room and the receiving room is evaluated. The intensity based methodevaluates the sound reduction index based upon the paths defined by the choiceof measurement surface between the source room and the receiving room. Thisallows most of the flanking transmission paths to be isolated from the direct paths[12]. A laboratory method for using sound intensity measurements to evaluate thesound reduction index of building elements [10] was developed during Nordtestproject 746-88 [6]. The method is primarily intended to be used when the

8
traditional ISO 140-3 method fails because of remarkable flanking transmission.This may, for instance, be the case when measuring windows, doors or heavyconstructions with high sound insulation. The method is quite general and,concerning the installation and operation of test objects, it has no specialrequirements for measuring small building elements. The special requirements forinstallation and operation may also lead to special requirements for themeasurement method itself. Also the small size of the object and possible airstream cause special demands on the measurement procedure (measurementdistance, scanning pattern etc.). Based on the method, a proposal for a fieldmethod for using sound intensity measurements to determine the sound reductionindex of building elements in situ has being developed, too, at Nordtest project879-90 [12].
In NT ACOU 037 there is a method of calculating the sound reduction index of apartition in which the object under test will be installed, the sound reduction ofthe partition and the unit sound insulation of the object as a starting point.According to the method in NT ACOU 037, the cross-sectional area of the objectis not taken into account. This causes not very much error if the area is small.Problems may arise in other cases and especially in cases where more than oneobject are used in the partition.
In this project a laboratory method for using sound intensity measurements toevaluate the sound insulation of small building elements in terms of elementnormalized level difference was produced. The method has a supplementconsidering the general usefulness of the element normalized level difference (orunit sound insulation) in evaluating the sound insulation of partitions. Thesupplement can be applied also to ISO 140-10 and NT ACOU 037.
The consequences of the special requirements, concerning the installation andoperation of test objects for measuring the sound insulation of small buildingelements, to the measurement method are taken into account. Also the specialdemands caused by the small size of the object are taken into account. Someexperimental measurements according to the method have been performed.

9
2 SOME CONSIDERATIONS ABOUT THEMEASUREMENT METHOD
The method is based on NT ACOU 084 [10] (Nordtest method for using soundintensity measurements to evaluate the sound reduction index of buildingelements), ISO 140-10 [3] (international standard for evaluating the elementnormalized level difference of small building elements by traditional soundpressure measurements), NT ACOU 037 [9] (corresponding Nordtest method),and a Finnish Method description of VTT and TTL [1] (for determination ofradiated sound power using intensity measurements). The method is basedsignificantly also on the experience of the responsible organization for the projectconcerning the intensity measurement techniques.
2.1 BASIC QUANTITIES
The main quantity in the method of this report is the element normalized leveldifference Dn,e. It is used to characterize the sound insulation of small buildingelements. It is defined as
where In1 is the incident average normal sound intensity, In2 is the transmittedaverage normal sound intensity, A0 is the reference area (for the laboratory, A0 =10 m2) and S is the area of the test specimen. The element normalized leveldifference is the ratio of the sound power incident on a reference area to thesound power transmitted through the test specimen in decibels. The incidentaverage normal sound intensity on the reference area corresponds to the incidentaverage normal sound intensity on the test specimen. If the transmitted intensityis measured by intensity technique, the element normalized level difference isdenoted by DI,n,e and it is given by
where Lp1 is the average sound pressure level in the source room, LIn is theaverage sound intensity level over the measurement surface in the receiver roomand Sm is the area of the measurement surface.
This element normalized level difference is evaluated from Eq. 5 assuming that
n,e lgD = 10I A
I S ,
n1 0
n2
(1)
I, p1 In0
D = L -6 - L +10A
S ,n,e
mlg
(2)

10
the sound field in the source room is perfectly diffuse. For the purposes of ISO140-10 the element normalized level difference is given in such a way that it isfurther assumed that the sound field is perfectly diffuse also in the receiving roomand that the sound is transmitted only through the test specimen.
The formula connecting the element normalized level difference and soundreduction index is
In intensity measurements the field indicator or pressure-intensity indicator
where Lp is time and surface averaged sound pressure level and LIn is time andsurface averaged normal sound intensity level on the measurement surface, playsan important role as a quality factor of the measurement results. The lower thefield indicator F is, the more reliable the results are. The residual pressure-intensity indicator δpI0 is the difference between indicated sound pressure leveland sound intensity level when the probe is placed in a sound field in such anorientation that the particle velocity in the direction of the probe measurementaxis is zero. It is a measure of the phase error between the two measurementchannels. The smaller the phase error is, the higher the residual pressure-intensity indicator is. The higher the residual pressure-intensity indicator is, thehigher the field indicator may be in the measurements.
2.2 SOME SPECIAL ASPECTS CONCERNING THE METHOD
Keeping the scanning speed and line density constant may be a difficult task for along period. That is why the scanning time of each sub-area is restricted tomaximum values in the method. The selected maximum values are based onsimple personal experiments. For the same reasons in the method in the case ofmore than one sub-area, it is recommended to record the individual sub-arearesults and to calculate the final result afterwards. Doing so one is required tokeep the scanning speed and line density constant only for individual subareasseparately.
In the method there is a specific rule for the minimum number of scanning lineson any subarea. The rule is based on a minimum number of five lines on a squaresub-area. If the sub-area is not square, the minimum number of scanning lines is
R = D -10A
S .
0n,e lg
(3)
F = L - L ,p In (4)

11
dependent of the ratio of the dimensions of the sub-area so that the total length ofthe scanning pattern is proportional to the square root of the area.
In the method there is a possibility to use discrete probe positions in the case ofvery small sub-areas. This is because of a practical point of view: with a verysmall subarea a definite scanning pattern is impossible to be traced.
The method has special rules for adjusting the scanning speed in the case that theinstrumentation allows only discrete integration times. That is the case with, e.g.,FFT analyzers and some old real time analyzers. The rules give limits to themismatch between the scanning and integration time. The limits are based onvery simple error estimates and their purpose is to reject the error to less than 1dB.
No dimensions of the sub-areas may exceed 1 m. With larger dimensions one isnot able to scan properly according to the method. This requirement will beneeded in cases where the object to be measured have large dimensions in thedirection normal to the partition wall. That is the case, e.g., with cable ducts.
The requirement of less or equal than 1 dB difference between the results of thetwo scans and the requirements concerning the field indicator in the methodproposal will be applied to the final result, not to the results of the individual sub-areas. That is due to that otherwise making more sub-areas may invalidate theresults for some sub-areas having a low contribution to the final result. There isno sense in that the results of those sub-areas are able to invalidate the final resultalso, because the measurement result with less sub-areas may, however, be valid.If the requirements mentioned are applied to all sub-areas one-by-one, makingmore sub-areas may cause formally less accurate results although the result willactually become more accurate due to the diminished effect of scanning speedalteration.
If extra panels are used to simulate corner or edge positions, the averageabsorption coefficient for panels in the receiving room has to be less than 0.06.This requirement is to ensure that the reflecting panels do not absorb the soundenergy too much. With the intensity technique the absorption of the panels towhich the measurement surface is closed cannot be taken into account, and itseffect is directly seen as an error in the measurement result.
In Annex C of the method, guidelines for the derivation of the overall soundreduction of composite partition constructions are given. The guidelines contain acorrection to the case in which the area of the small elements on a partition is notsmall. That correction may be relevant in cases were the partition is very small orif there is many small elements mounted on the partition. Also the guidelinescontain a rough estimate for the error caused by the acoustic interaction betweenthe elements on the partition.

12
3 WATERHOUSE CORRECTION
Due to interference effects, the acoustic energy density in a room is higher nearthe boundaries than far away from them [13]. When estimating the total acousticenergy of a room by measuring the sound pressure far from the boundaries, theso-called Waterhouse correction must be applied to the results to take account ofthe higher energy density near the boundaries. An example of using theWaterhouse correction is sound power measurement in reverberation roomsaccording to, e.g., ISO 3741 [5]. Another example where the Waterhousecorrection should be used is the measurement of the sound reduction indexaccording to traditional methods; e.g., ISO 140-3 [2] and also ISO 140 series ingeneral. In the latter example the correction is not normally applied. In themeasurement of the sound reduction index using sound intensity techniquesaccording to, e.g., Ref. [10], the Waterhouse correction is not needed. However,if the aim of that measurement is to simulate the traditional measurementmethods (without the correction), a "negative correction" is proposed to beapplied to the results [6, 10].
In this chapter an improved formula for the Waterhouse correction, as a functionof modal density, is introduced, and some examples of the pertinent applicationof the correction are studied.
3.1 WATERHOUSE CORRECTION AND MODAL DENSITY
The Waterhouse correction W is [13]
where S is the total area of the room, V its volume and λ the wavelength. Indecibels the correction CW is
The modal density n of a room is, e.g., according to Ref. [7],
W = 1+S
8V ,
λ(5)
WC = 10 (W)= 10 1+S
8V .lg lg
λ
(6)

13
where L is the total length of the linear dimensions of the room, f is frequencyand c0 is the speed of sound in unperturbed fluid. For further considerations onecan write this as
Thus it can be seen that the modal density of a room is proportional to its volume,with a correction factor as a function of surface area and linear dimensions. If thelast term in the correction factor is omitted, the factor has the same form as theWaterhouse correction. This is not coincidental. The original text of Waterhouse'sconsideration of the Waterhouse correction contains an extra term to thecorrection in Appendix 2 of Ref. [13], which can be averaged to exactly thesame term as the last term in the modal density. Waterhouse stated about thisterm: "However, for small rooms, the initial assumption that at all points in themequal energy flows in all directions will not be true at the low frequencies forwhich the correction is significant. Thus, the interference patterns formed woulddiffer from the reverberant interference patterns, and the correction computed forthese latter patterns would not apply with accuracy." However, one may findsome reasons to include the last term in the Waterhouse correction. This will beevident from the following.
By denoting the "complete" Waterhouse correction as
the modal density of the room can be expressed as
The total acoustic energy E of the room is
n =4 V
cf +
S
2cf +
L
8c ,
03
2
02
0
π π(7)
n =4 f
cV 1+
S
8V+
L
32 V .
2
03
2π λ λπ
(8)
W = 1+S
8V+
L
32 V ,
2λ λπ
(9)
n =4 f
cVW .
2
03
π(10)

14
where p is the sound pressure measured far from the boundaries, and ρ0 is thedensity of unperturbed fluid. The total acoustic energy is now proportional to themodal density of the room, and the energy per modal density is independent ofthe room geometry and size:
This makes sense, because in the S.E.A. (Statistical Energy Analysis) model,which is an extension of statistical diffuse field acoustics, basic quantities areinput powers, energies, internal and coupling loss factors, and modal densities.All information concerning the room properties is included in the internal lossfactor and the modal density of the room. It is the energy per modal density thattends to be equalized between subsystems in the S.E.A. model. So, if one usesstatistical diffuse field theory, the modal density, rather than the room volume, isthe correct basic quantity. This is equivalent to using the "Waterhouse-correctedroom volume" instead of the physical room volume. The corrected room volumetakes account of the fact that in small rooms the number of axial and tangentialmodes in proportion to oblique modes is higher than in large rooms. Inversely, ifone accepts the basic assumptions of S.E.A. and supposes that the total acousticenergy is proportional to the modal density of the room rather than to its physicalvolume, the correct expression for the Waterhouse correction will be as stated inEq. 9.
The foregoing examination can be seen to be useful by noticing that theWaterhouse correction is proportional to the modal density,
so it can be determined for each room by measuring its modal density. This isadvantageous if the room is not a parallellepiped, in which case Eq. 8 is only anestimate of the modal density [8], and thus also Eq. 9 is an estimate of theWaterhouse correction.
At very low frequencies, the effects of the boundaries extend everywhere in theroom, so there is nowhere "far from boundaries". In this situation the term p
E =p
cVW =
p
c 4n ,
2
0 02
2
0 0
2
ρ ρλπ
(11)
E
n=
p
c 4 .
2
0 0
2
ρλπ
(12)
W =c n
4 V f ,
03
2π(13)

15
(pressure far from boundaries) cannot be measured and it is a hypotheticalquantity only. However, the preceding examination is still valid if thishypothetical sound pressure is accepted as a starting point. Also, the assumptionof the diffuse field may be somehow misleading at very low frequencies, wherethe modal behaviour of the sound field should be taken into account. These factsand the statement of Waterhouse below Eq. 8 limit the usefulness of the theorypresented. However, if statistical field theory is accepted as a starting point, thesesources of error cannot be avoided. From this point of view, the dependence ofthe Waterhouse correction on modal density and the improved form of theWaterhouse correction can be seen as steps towards higher accuracy in thestatistical field theory.
In practice, the last term in Eq. 9 is very small except at very low frequencies orin small rooms. The improved form of the Waterhouse correction normallydiffers from the traditional one at third octave bands with centre frequencies lessthan 100 Hz. In this project, the frequency bands below 100 Hz have not beentreated, so the developed form of the classic Waterhouse correction has only littleeffect on the measurement results of this report. However, there is a tendency forsome measurement methods in building acoustics to be used in an extendedfrequency range down to a third octave band with a centre frequency of 50 Hz.With that kind of extended frequency range the last term in Eq. 9 has an obviouseffect on the Waterhouse correction. In Fig. 1 the traditional and improvedWaterhouse corrections are presented for a room with dimensions of 5 m ⋅ 6.35m ⋅ 4 m and with a volume of 129.4 m. This room has been used as the receivingroom in the measurements of this project.
Fig. 1. Waterhouse correction for the receiving room.
The fact that the improved form of the Waterhouse correction differs from thetraditional one mainly at low frequencies is advantageous when determining the

16
correction by using the modal density according to Eq. 13. The modal densityneeds to be determined at low frequencies only. It is well-known that themeasurement of the modal density of a room may be difficult, owing todiffuseness of the sound field, modal overlapping or problems concerning theexcitation of modes. However, the above difficulties are not so severe at lowfrequencies. Nevertheless, there may be problems in the experimental estimationof the modal density at low frequencies too. If the problems cannot be overcomeby very precise measurements, with narrowband excitation and analysis, and alarge number of source and measurement positions, the modal density can becalculated by using, e.g., F.E.M. (Finite Element Method). In laboratorymeasurements, the modal density needs to be determined only once, if it isassumed that the room will remain unchanged, so one probably difficultmeasurement or calculation activity may be reasonable.
3.2 APPLICATIONS OF WATERHOUSE CORRECTION
The Waterhouse correction should be used every time one is considering theacoustic energy of a room as a function of the sound pressure (far away from theboundaries). The following examples are all based on this starting point.
3.2.1 Determination of sound power
If a sound source is turned off, the acoustic energy will decay according to
where t is time, E is the energy, E0 is the energy at time t = 0, η is the totalinternal loss factor of the room and ω is the angular frequency. The reverberationtime is defined as the time during which the energy has decayed 60 dB from itsinitial value. So, the total internal loss factor can be presented as a function of thereverberation time as
where T is the reverberation time. The power loss can be expressed in terms ofthe acoustic energy as
E = E e ,0- tηω (14)
ηπ
=3 (10)
fT ,
ln(15)

17
where the Waterhouse correction has now been applied to the relationshipbetween the energy and the sound pressure of the room. In a stationary field thepower loss is equal to the radiated power of the sound sources in the room. WithEqs. 15 and 16 taken into account, the sound power of a source in areverberation room is
where P is the sound power. In sound power measurements in reverberationrooms according to, e.g., ISO 3741 [5], the sound power is determined by usingEq. 17 by measuring the reverberation time and the sound pressure and applyingthe Waterhouse correction.
3.2.2 Determination of absorption
The one-sided diffuse field sound intensity is
where I is the sound intensity and p is the sound pressure far from theboundaries. This equation is valid both far from the boundaries and near them;thus also in the latter case the quantity p means the sound pressure far from theboundaries. This is justified below.
In a diffuse field the magnitude of the one-sided intensity is independent of spatialvariables, also near the boundaries. Although the sound pressure increases whengoing towards the boundaries, the active sound intensity does not, because theincrease of the sound pressure due to interference is a purely reactivephenomenon. That phenomenon increases the energy density near theboundaries, but it does not have any effect on the propagating sound energy. Itcan be easily demonstrated by using a one-dimensional diffuse field of onefrequency (meaning: having narrowband spectral content). It can be thought tobe formed of two waves propagating in opposite directions, having equalexpected values of amplitude, say p1, and a random mutual phase difference. Thetotal sound pressure is then
lossP = E =p
cWV ,
2
0 02ωη ωη ρ (16)
P =6 (10)WV
c
p
T ,
0 02
2ln
ρ (17)
I =p
4 c ,
2
0 0ρ (18)

18
and the one-sided sound intensity is
Suppose there are two boundaries with a reflection coefficient of 1 and the fieldis between the boundaries. On the boundaries the two waves must have equalphases, because the wave outgoing from the boundary originates from thereflection of the wave coming towards the boundary. So, there is interference,and the total sound pressure at the boundary is
which is √2 times the value far away from the boundaries. The one-sidedintensity, however, does not grow when approaching the boundary, but its valuefor waves propagating in both directions is obtained from the amplitude of theindividual waves (p1), and it is everywhere as stated in Eq. 20. Otherwise therewould be active sources of sound near the boundary and that is not the case. Thissimple consideration can be easily generalized to three-dimensional spaces, soEq. 18 is valid also near the boundaries. Thus no Waterhouse correction will beneeded for the diffuse field sound pressure - sound intensity relation. TheWaterhouse correction for the source room, which is included in the methodproposed in Ref. [12], is unjustified therefore.
In this one-dimensional case the acoustic energy density is not higher at theboundaries than far from the boundaries. The potential energy density at theboundaries is twice the density far from the boundaries. The kinetic energydisappears at the boundaries, so the total energy density at the boundaries is thesame as far from the boundaries. However, this is not the case with incidenceangles other than normal to the boundaries, as shown by Waterhouse [13],because it is only the normal component of the particle velocity that disappears atthe boundaries. So, with three-dimensional diffuse fields, the situation differsfrom that with one-dimensional fields in that also the total energy density near theboundaries is higher than far from the boundaries. The normal component of thesound intensity, with respect to boundaries, will nevertheless behave in three-dimensional space like the sound intensity in a one-dimensional space. So theone-sided normal intensity near the boundaries is the same as the one-sidedintensity far from the boundaries.
p = 2 p ,1 (19)
I =p
c=
p
2 c .1
2
0 0
2
0 0ρ ρ (20)
boundaryp = 2 p ,1 (21)

19
Thus if the sound intensity is given by Eq. 18, in a stationary diffuse field thepower loss can be represented as
where Ploss is the power loss and A is the absorption of the room. By usingEquations 15, 16 and 22, and assuming that the absorption is evenly distributed inthe room, the absorption can be presented as a function of the reverberation timeas
This is one basic relation where the Waterhouse correction has to be used: i.e.,when the absorption is determined by the reverberation time measurement. But itis remarkable that, e.g., in ISO 354 [4], where the absorption is determined bythe reverberation time, the correction is not applied, since this is precisely thebasic situation in which it is required. However, if the correction is applied, theresult will represent the absorption in the measuring room, and if it is not applied,the result will represent the limiting case in which the room volume tends toinfinity. So, the only way of getting a result that is independent of the measuringroom geometry is not to use the Waterhouse correction. However, if theabsorption determined is applied to a certain room (as in evaluating thereverberation time of the room), the measured absorption has to be corrected forthat room by the Waterhouse correction. The fact that normally the absorption isnot evenly distributed but rather concentrated at the walls, causes additionaleffects, which will not be treated here.
3.2.3 Sound insulation measurements
In sound insulation measurement the aim is to determine the quantity
where R is the sound reduction index, P1 is the sound power incident on a testspecimen and P2 is the sound power transmitted through the specimen. If themeasurement is done by traditional means (i.e., not with intensitymeasurements), e.g., by using ISO 140-3 [2], the transmitted sound power isdetermined by Eq. 22 (transmitted power is equal to the power loss in the
lossP =p
4 cA ,
2
0 0ρ (22)
A =24 (10)
c
WV
T .
0
ln(23)
R = 10P
P ,
1
2lg
(24)

20
receiving room), where the absorption of the receiving room is obtained by thereverberation time measurements according to Eq. 23. This procedure isequivalent to determining the sound power according to Eq. 17 exactly as statedin standards for sound power determination.
Whatever the starting point, the Waterhouse correction CW (in dB) of thereceiving room should be subtracted from the result. However, this correction isnot normally applied, and the measurements thus yield overestimated values atlow frequencies. The incident sound power is determined by the diffuse fieldsound intensity available from the sound pressure measurements, and the area ofthe specimen. These quantities are not affected by the interference effects nearthe boundaries, so no Waterhouse correction is needed for the source room. Thisis clear for the specimen area; justifications for the sound intensity are given inthe text after Eq. 18.
In sound insulation measurement by the intensity technique the transmitted soundpower is determined directly by sound intensity measurements, so noWaterhouse correction for the receiving room is needed. The incident soundpower is determined similarly as in traditional methods, so no Waterhousecorrection is needed for the source room either, according to the precedingexamination. So sound insulation measurement by the intensity technique needsno Waterhouse corrections.
If one wants to compare the intensity measurement results with the results of thetraditional methods, the Waterhouse correction CW for the receiving room shouldbe subtracted from the result of the traditional method before comparing,although the correction is not included in the traditional methods. The other andworse procedure is to add the Waterhouse correction of the receiving room to theintensity measurement result before comparing [6, 10]. Obviously, the differencebetween the methods is the same in both cases. In the second procedure the"right" intensity measurement result is made similarly erroneous as the result ofthe traditional method; in the first procedure the true error of the traditionalmethod is corrected.

21
4 MEASUREMENTS
Experimental measurements were performed for two types of devices: ventilationvalves and a cable duct. The intensity measurements were carried out accordingto the proposal of this report. The traditional measurements were carried outaccording to ISO 140-10.
4.1 MEASUREMENT EQUIPMENT AND ROOMS
A B&K two-microphone intensity probe type 3520 including an electretmicrophone pair of B&K 4183 was used with a two-channel real time 1/3 octaveanalyzer Norsonic 830. The equipment was calibrated and the residual pressure-intensity indicator was measured with the intensity calibrator B&K 3541.
In the measurements both 50 mm and 12 mm spacings were used. The finitedifference approximation, used in the intensity measurements, causesunderestimating to the sound intensity at high frequencies, the error being thehigher the larger spacing is used in the probe. The 50 mm spacing works with anaccuracy of 1 dB up to 1.25 kHz. The upper frequency limit for the 50 mmspacing was selected a little bit lower, as a frequency upwards from which itgives clearly lower intensity values than the 12 mm spacing. The lowest usablefrequency for the 12 mm spacing was selected according to the rules concerningthe field indicator and residual pressure-intensity indicator in the method. Thelimit frequency for using the different spacings was selected at about the middleof these two limits. According to this, a microphone spacing of 50 mm was usedup to 400 Hz in the measurement of ventilation valves and up to 500 Hz in themeasurement of the cable duct. A spacing of 12 mm was used at higherfrequencies. The 12 mm spacing works with an accuracy of 1 dB up to 5 kHz.The error at high frequencies (near 5 kHz), due to the finite differenceapproximation, tends to overestimate the element normalized level difference andsound reduction index.
The sound insulation measurements were done between two reverberationrooms. The source and receiving room volumes were 99.1 m3 and 129.4 m3
respectively. For the intensity measurements the reverberation in the receivingroom was minimized by adding absorbents and also by dismounting the roof ofthe receiving room.
In the source room only one loudspeaker position has been used, the sameposition for measurements according to ISO 140-10 and the proposal of thisreport.

22
4.2 VENTILATION VALVES
Three ventilation valves KIV-100 (Lapinleimu Oy) of diameter 200 mm weremounted on the partition wall between the measuring rooms. The valves havebeen measured mounted on a wall, near an extra reflecting panel and near twoextra reflecting panels. The panels were mounted in the receiving room only. Inthe measurements according to ISO 140-10 the three valves were functioningsimultaneously. In the measurement according to the proposal of this report thevalves were open one at a time and each of the valves was measured separately.The measuring surface in the intensity measurements was box-shaped with fivesub-areas in the case of no extra reflecting panels, and partially box-shaped withfour or three sub-areas in the cases of one or two extra reflecting panelsrespectively. In the comparison between the results of intensity and ISO 140-10measurements, Fig. 4, the intensity measurement results of the three valves havebeen averaged according to energy basis (the radiated sound power of the threevalves added together), that is
because this gives comparable results with ISO method. In the comparison, theWaterhouse correction of the receiving room has been subtracted from the resultsof ISO 140-10 measurements.
Using more than one object in ISO 140-10 measurements has the disadvantage ofpossible interaction between the sound radiated by the valves at low frequencies(third octave bands below 400 Hz). The interaction tends to decrease themeasured insulation.
The electret microphones of the probe got an electric shock of 200 V DC voltagejust before the measurements. That kind of shock makes the residualpressure-intensity indicator very bad for a while; more than a week will beneeded for the microphones to get over that. That is the main reason for that theresults at lower frequencies than 100 Hz are invalid, so they are not presented inthe figures.The results and corresponding field indicators are presented on Figs. 2 and 3. InFig. 2 it can be clearly seen that the different valves have differences in soundinsulation at the lowest and highest frequencies, although they are similar inprinciple. The differences may be due to differences in mounting and differencesof the valves due to tolerances in manufacturing. These sources of error are nevertotally avoidable; however, more reliable results may be obtained by measuringseveral objects and calculating confidence limits to the results. In Fig. 3 the effectof mounting the reflective panels
n,e lgn,e
D = 103
10i=1
3
-D / 10_ ,
(i)
(25)

23
Fig. 2. Element normalized level difference and field indicator for differentvalves.

24
Fig. 3. Element normalized level difference and field indicator for differentnumber of panels.

25
Fig. 4. Element normalized level difference of the valves, comparison ofmethods.

26
can be seen. As could be expected, the panels increase the sound power comingout of the valves thus decreasing their sound insulation at low frequencies (below630 Hz).
In Fig. 4 the difference between the results of this method and ISO 140-10 canbe seen. Both of the methods give quite similar results with an inaccuracy ofmuch less than 1 dB, except at very low and high frequencies. At highfrequencies the difference is partly due to the error caused by the finitedifference approximation of intensity measurements. This could be lowered byusing smaller than 12 mm spacing in the probe. However, that error does notexplain totally the difference between the results of the methods at highfrequencies. Another cause of difference is that the results should be differentdue to flanking transmission, which is present in the results of ISO 140-10 but notin the intensity measurement results. At low frequencies with no reflective panels,the difference in the results is mainly caused by the interaction between thesound radiated by the three valves simultaneously in ISO 140-10 measurements.That effect cannot be seen in the results with reflective panels. Also the flankingtransmission may have an effect on ISO 140-10 results at low frequencies. Verycurious and not very easily explainable is that the intensity measurements givelower element normalized level difference than ISO 140-10 measurements at thelowest frequencies with one reflective panel. One explanation may be that in ISO140-10 measurements there was deviation in ideal diffuse field conditions in thereceiving room at low frequencies.
As a conclusion, the differences between the two methods are due to errors inISO 140-10 measurements (errors due to flanking transmission, interactionbetween elements and deviation in ideal diffuse field conditions). An exception toabove is the finite difference approximation error in intensity measurement results(which can be eliminated by proper spacing selection). So the intensitymeasurements will, at least in this case, have an accuracy which is better than intraditional measurements. One remarkable point of view is that the differencesbetween the results of different valves are of the same order, and at lowfrequencies even higher, than the differences between the results of differentmethods.
4.3 CABLE DUCT
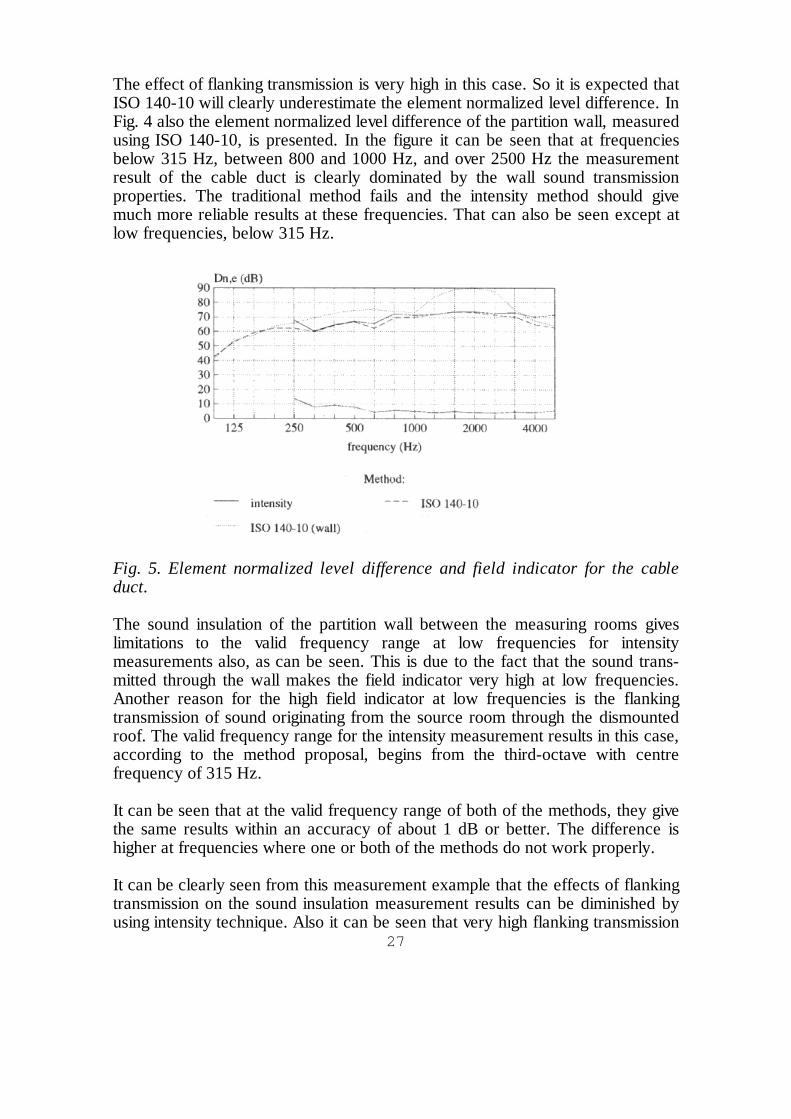
One cable duct of lateral dimensions of 134 mm ⋅ 62 mm, constructed ofaluminium profile, with a length of 2.1 m in both the source and receiving roomsand having six cables inside was mounted through the partition wall between themeasuring rooms, on an reflecting panel in both rooms. In the intensitymeasurements the measurement surface was divided into 10 subareas. Themeasurement results are shown in Fig. 5. The Waterhouse correction of thereceiving room has been subtracted from the results of ISO 140-10measurements.
27
The effect of flanking transmission is very high in this case. So it is expected thatISO 140-10 will clearly underestimate the element normalized level difference. InFig. 4 also the element normalized level difference of the partition wall, measuredusing ISO 140-10, is presented. In the figure it can be seen that at frequenciesbelow 315 Hz, between 800 and 1000 Hz, and over 2500 Hz the measurementresult of the cable duct is clearly dominated by the wall sound transmissionproperties. The traditional method fails and the intensity method should givemuch more reliable results at these frequencies. That can also be seen except atlow frequencies, below 315 Hz.
Fig. 5. Element normalized level difference and field indicator for the cableduct.
The sound insulation of the partition wall between the measuring rooms giveslimitations to the valid frequency range at low frequencies for intensitymeasurements also, as can be seen. This is due to the fact that the sound trans-mitted through the wall makes the field indicator very high at low frequencies.Another reason for the high field indicator at low frequencies is the flankingtransmission of sound originating from the source room through the dismountedroof. The valid frequency range for the intensity measurement results in this case,according to the method proposal, begins from the third-octave with centrefrequency of 315 Hz.
It can be seen that at the valid frequency range of both of the methods, they givethe same results within an accuracy of about 1 dB or better. The difference ishigher at frequencies where one or both of the methods do not work properly.
It can be clearly seen from this measurement example that the effects of flankingtransmission on the sound insulation measurement results can be diminished byusing intensity technique. Also it can be seen that very high flanking transmission

28
may, however, make the results of the intensity technique invalid. This effect canbe very easily noticed from the values of field indicator. If the field indicator iswithin the limits of the method of this report, one can be assured that that kind ofhigh flanking transmission problem does not exist.
The only way to avoid the high flanking transmission problem is to increase thesound insulation of the flanking paths. Using more than one object in connectionwith the intensity technique does not make the situation better, because in theintensity technique the individual objects have to be measured one-by-one. If onegives himself a possibility to deviate from the requirements of the method of thisreport, one way of avoiding the high flanking transmission problem somehow isto use very accurately phase-matched microphones (very low residual pressure-intensity indicator) and to ignore the requirement of the highest field indicator of10 dB. This must be done with ultimate care and it is not recommended for non-experts in acoustics. Anyhow, this is beyond the scope of the method of thisreport.
5 CONCLUSIONS
In this project a laboratory method to evaluate the sound insulation of smallbuilding elements was developed. In the method, sound intensity measurementsare applied and the results are expressed in terms of the element normalized leveldifference. The method has a supplement considering the general usefulness ofthe element normalized level difference (or unit sound insulation) in evaluatingthe sound insulation of partitions. The supplement can be applied also to ISO140-10 and NT ACOU 037.
There are special requirements concerning the installation and operation of smallbuilding elements in measuring their sound insulation. The consequences of therequirements to the measurement method are taken into account. Also the specialdemands caused by the small size of the object are taken into account. Someexperimental measurements according to the method have been performed.
The main special features of this method are: The scanning time of each sub-areahas a recommendation for maximum value and in the case of more than one sub-area, it is recommended to record the individual sub-area results and to calculatethe final result afterwards. That is to avoid errors due to scanning speed and linedensity alteration. A specific rule for the minimum number of scanning lines onany subarea is given, in which the number is dependent of the shape of the sub-area. Special rules for adjusting the scanning speed in the case that theinstrumentation allows only discrete integration times are given, to give limits tothe mismatch between the scanning and integration time. The requirement of lessor equal than 1 dB difference between the results of the two scans and the

29
requirements concerning the field indicator in the method will be applied to thefinal result, not to the results of the individual sub-areas. If extra panels are usedto simulate corner or edge positions, the average absorption coefficient for panelsin the receiving room has to be less than 0.06.
The guidelines for the derivation of the overall sound reduction of compositepartition constructions contain a correction to the case in which the total area ofthe small elements on a partition cannot be considered to be small compared withthe area of the partition. That correction may be relevant in cases where thepartition is very small, or if there is many small elements mounted on thepartition. The guidelines contain also a rough estimate for the error caused by theacoustic interaction between the elements on the partition.
The classical form of the Waterhouse correction, the purpose of which is to takeaccount of the higher energy density near the room boundaries, has beendeveloped to an improved formula, which is a function of room modal density.The corrected room volume takes account of the fact that in small rooms thenumber of axial and tangential modes in proportion to oblique modes is higherthan in large rooms. The Waterhouse correction may be determined for eachroom by measuring or calculating its modal density. This is advantageous if theroom is not a parallellepiped, in which case the accuracy of the classical form ofthe Waterhouse correction is worse. The improved form of the Waterhousecorrection normally differs from the traditional one at third octave bands withcentre frequencies less than 100 Hz. There is a tendency for some measurementmethods in building acoustics to be used in an extended frequency range down toa third octave band with a centre frequency of 50 Hz. With that kind of extendedfrequency range, the refinement of the Waterhouse correction has an obviouseffect.
If absorption is determined by measuring the reverberation time as in ISO 354and the Waterhouse correction is not applied, the result will represent the limitingcase in which the room volume tends to infinity. If the absorption determined isapplied to a certain room (as when evaluating the reverberation time of theroom), the measured absorption must be corrected for that room by theWaterhouse correction.
The Waterhouse correction of the receiving room should be subtracted from theresult of traditional measurements of the sound reduction index. This is especiallyimportant if the results are compared to those of intensity measurements.However, this correction is not normally applied, and the measurements thusyield overestimated values at low frequencies. No Waterhouse correction isneeded for the source room. The measurement of sound insulation by theintensity technique needs no Waterhouse corrections.
Experimental measurements were performed for two types of devices: ventilationvalves and a cable duct. The intensity measurements were carried out according

30
to the proposal of this report. The traditional measurements were carried outaccording to ISO 140-10. Both of the methods give quite similar results with anaccuracy of 1 dB or better at a frequency range where the flanking transmissionis not very important and were both of the methods give valid results. The otherreasons for differences are the finite difference approximation error in intensitymeasurement results, the interaction of different objects at low frequencies, anddeviations in ideal diffuse field conditions in the receiving room at lowfrequencies. Except for the finite difference approximation error, which can beeliminated by proper spacing selection, the differences between the two methodsare due to errors in ISO 140-10 measurements (errors due to flanking trans-mission, interaction between elements and deviation in ideal diffuse fieldconditions). So the intensity measurements will have at least as good an accuracyas the traditional measurements. The differences between the results of similarobjects, due to mounting and manufacturing tolerances, are of the same order asthe differences between the results of the different methods, i.e., the differencebetween the two methods lies well within the repeatability of the methods.
The effects of the flanking transmission on the sound insulation measurementresults can be diminished by using the intensity technique. Very high flankingtransmission may, however, make the results of the intensity technique invalid.This effect can be very easily noticed from the values of field indicator. If thefield indicator is within the limits of the method of this report, one can be assuredthat that kind of high flanking transmission problem does not exist. The only wayto avoid the high flanking transmission problem, according to this method, is toincrease the sound insulation of the flanking paths (i.e., partition wall).
In the cases where flanking transmission causes no problems for traditionalmeasurements, ISO 140-10 method is preferable because measurementsaccording to it may be carried out with much less time than measurementsaccording to the method of this report.
REFERENCES
1. The determination of radiated sound power using intensity measurements insitu. Method description. Espoo, Tampere: VTT (Technical ResearchCentre of Finland) and TTL (Institute of Occupational Health), 1991. 34 p.(In Finnish)
2. ISO 140-3:1978 (E). Acoustics - Measurement of sound insulation inbuildings and of building elements. Part III: Laboratory measurements ofairborne sound insulation of building elements. Geneve: International

31
Organization for Standardization, 1978. 5 p.
3. ISO 140-10:1991 (E). Acoustics - Measurement of sound insulation inbuildings and of building elements. Part 10: Laboratory measurement ofairborne sound insulation of small building elements. Geneve: InternationalOrganization for Standardization, 1991. 7 p.
4. ISO 354:1985 (E). Acoustics - Measurement of sound absorption in areverberation room. Geneve: International Organization for Standardization,1985. 9 p.
5. ISO 3741:1988 (E). Acoustics - Determination of sound power levels ofnoise sources - Precision methods for broad-band sources in reverberationrooms. Geneve: International Organization for Standardization, 1988. 16 p.
6. Jonasson, H. Measurements of sound reduction index with intensitytechnique. Borås: SP (Swedish National Testing and Research Institute),1991. 37 p. (SP report 1991:23). ISBN 91-7848-280-1, ISSN 0284-5172
7. Lyon, R. H. Statistical energy analysis of dynamical systems. Theory andapplications. 1st ed. Cambridge, Massachusetts: The MIT Press, 1975. 388p. ISBN 0-262-12071-2
8. Morse, P. M. & Ingard, K. U. Theoretical acoustics. 1st ed. New York:McGraw-Hill, 1968. 927 p.
9. NT ACOU 037. Small building elements: Sound insulation. Stockholm:Nordtest, 1982. 13 p.
10. NT ACOU 084. Building elements: Sound insulation, intensity scanningunder laboratory conditions. Espoo: Nordtest, 1992. 6 p. ISSN 0283-7145
11. NT ACOU 093. Building elements, small: Sound insulation, intensityscanning under laboratory conditions. Espoo: Nordtest, 1995. 16 p. ISSN0283-7145
12. Olsen, H. & Newman, M. J., Determination of sound reduction indicesusing intensity techniques in situ. Trondheim: Sintef Delab, 1992. 29 + 20 p.(Report STF40 A92045). ISBN 82-595-7093-9
13. Waterhouse, R. V., Interference patterns in reverberant sound fields. J.Acoust. Soc. Am., 1955. Vol. 27, no. 2, pp. 247 - 258.

ANNEX/1
ANNEX: PROPOSAL FOR NORDTEST METHOD
SMALL BUILDING ELEMENTS:
ELEMENT NORMALIZED LEVEL DIFFERENCE
A laboratory method based on
scanned sound intensity measurements

ANNEX/2
CONTENTS
ABSTRACT............................................................................................3
PREFACE..............................................................................................4
LIST OF SYMBOLS...............................................................................6
1 INTRODUCTION...............................................................................7
2 SOME CONSIDERATIONS ABOUT THE MEASUREMENTMETHOD.......................................................................................92.1 Basic quantities.........................................................................92.2 Some special aspects concerning the method............................10
3 WATERHOUSE CORRECTION.......................................................123.1 Waterhouse correction and modal density................................123.2 Applications of Waterhouse correction.....................................16
3.2.1 Determination of sound power.........................................163.2.2 Determination of absorption.............................................173.2.3 Sound insulation measurements........................................19
4 MEASUREMENTS...........................................................................214.1 Measurement equipment and rooms........................................214.2 Ventilation valves....................................................................224.3 Cable duct..............................................................................26
5 CONCLUSIONS...............................................................................28
REFERENCES.....................................................................................30
ANNEX: PROPOSAL FOR NORDTEST METHOD..............................1
1 SCOPE AND FIELD OF APPLICATION............................................4
2 REFERENCES....................................................................................5
ANNEX/3
3 DEFINITIONS....................................................................................63.1 Average sound pressure level in a room, Lp ................................63.2 Sound intensity, I ......................................................................63.3 Normal sound intensity, In .........................................................73.4 Normal sound intensity level, LIn ................................................73.5 Pressure-intensity indicator or field indicator, F..........................73.6 Residual pressure-intensity indicator, δpI0 ...................................73.7 Element normalized level difference, Dn,e...................................83.8 Corrected element normalized level difference, Dn,e,c..................93.9 Sound reduction index, R ........................................................103.10 Weighted element normalized level difference, Dn,e,w..............103.11 Weighted sound reduction index, Rw ......................................103.12 Measurement surface............................................................113.13 Sub-area...............................................................................113.14 Measurement distance...........................................................11
4 INSTRUMENTATION......................................................................114.1 General...................................................................................114.2 Calibration..............................................................................12
5 LABORATORY REQUIREMENTS..................................................145.1 Rooms....................................................................................145.2 Partitions................................................................................14
6 INSTALLATION AND OPERATION OF TEST OBJECTS...............146.1 General...................................................................................146.2 Mounting of test objects..........................................................146.3 Location of test objects............................................................15
6.3.1 Mounting locations...........................................................156.3.1.1 Equipment used away from wall.............................156.3.1.2 Equipment used near an edge.................................156.3.1.3 Equipment used near a corner................................15
6.3.2 Number of locations.........................................................166.4 Installation of transfer air devices.............................................166.5 Installation of cable ducts........................................................16
7 TEST PROCEDURE AND EVALUATION.......................................177.1 General...................................................................................177.2 Generation of sound field in the source room............................177.3 Measurement of average sound pressure level in the source
room.........................................................................................187.4 Measurements on the measurement surface in the receiving
room.........................................................................................187.4.1 Measurement surface.......................................................187.4.2 Sub-areas........................................................................207.4.3 Scanning procedure.........................................................21

ANNEX/4
7.4.4 Sound intensity measurement...........................................237.4.5 Background noise............................................................25
7.5 Frequency range of measurements...........................................25
8 PRECISION......................................................................................25
9 EXPRESSION OF RESULTS............................................................26
10 TEST REPORT AND RECORD......................................................2610.1 Information to be reported.....................................................2610.2 Information to be recorded....................................................27
11 APPLICATION OF SOUND INSULATION DATA..........................28
ANNEX A: LOCAL CHANGE IN WALL THICKNESS...........................1A.1 Local increase of wall thickness................................................1A.2 Local decrease of wall thickness...............................................1
ANNEX B: SIMULATION OF CORNER AND EDGE LOCATIONS.......1
ANNEX C: GUIDELINES FOR THE DERIVATION OF THEOVERALL SOUND REDUCTION OF COMPOSITEPARTITION CONSTRUCTIONS....................................................1
ANNEX D: REFINED FORM OF WATERHOUSE CORRECTION.........1

ANNEX/4
1 SCOPE AND FIELD OF APPLICATION
This NORDTEST method specifies a laboratory sound intensity scanningmethod of measuring the airborne sound insulation of such small buildingelements as are defined below. This method also establishes directionsabout reporting and applying such test data.
ISO 140-10 specifies a laboratory method of measuring airborne soundinsulation of small building elements under diffuse field conditions. ThisNORDTEST method is primarily intended to be used instead of ISO 140-10whenever the flanking transmission prevents accurate measurementsaccording to ISO 140-10. The correction of flanking transmission, used inISO 140-10, is not needed in this NORDTEST method. Increasing thenumber of test objects to avoid inaccuracy due to flanking transmission,used in ISO 140-10, is not used in this NORDTEST method. Increasing thenumber of test objects may, however, be used to evaluate the standarddeviation of the results and to increase the accuracy of the results. ISO 140-10 is to be preferred to this NORDTEST method when it is not possible toget a low enough field indicator in the receiving room, when the air flowfrom the building elements to be measured prevents accurate intensitymeasurements or when the flanking transmission causes no problems.
It is intended that the results obtained will be used to develop buildingelements with appropriate acoustical properties, to classify such elementsaccording to their sound insulation properties and to estimate their influenceon the sound insulation of partition constructions in buildings.
This NORDTEST method applies to building elements with an area of lessthan 1 m2 which occur in a certain number of discrete sizes with well-defined lateral dimensions. The elements are such that they transmit soundbetween two adjacent rooms or between one room and the open airindependently of the adjoining building elements. The method does notapply to windows and doors, and elements with air flows over 2 m/sthrough the measurement surface.
Some examples of equipment covered by this NORDTEST method are
transfer air devicesairing panels (ventilators)outdoor air intakeselectrical cable ductstransit sealing systems (e.g., sealing systems for passingsthrough walls or slabs).
This method is not primarily intended for components that constitute part ofan integrated unit for which the associated sound transmission might dependon an interplay of components.

ANNEX/5
2 REFERENCES
The following standards contain provisions which, through reference in thistext, constitute provisions of this NORDTEST method. At the time ofpublication, the editions indicated were valid. All standards are subject torevision, and parties to agreements based on this NORDTEST method areencouraged to investigate the possibility of applying the most recent editionsof the standards indicated below. Members of IEC and ISO maintainregisters of currently valid International Standards.
ISO 140-1:1990, Acoustics - Measurement of sound insulation in buildingsand of building elements - Part 1: Requirements for laboratories.
ISO 140-3:1978, Acoustics - Measurement of sound insulation in buildingsand of building elements - Part 3: Laboratory measurements of airbornesound insulation of building elements. (Under revision.)
ISO 140-10:1991, Acoustics - Measurement of sound insulation in buildingsand of building elements - Part 10: Measurement of sound insulation ofsmall building elements.
ISO 717-1:1982, Acoustics - Rating of sound insulation in buildings and ofbuilding elements -Part 1: Airborne sound insulation in buildings and ofinterior building elements. (Under revision.)
ISO 717-3:1982, Acoustics - Rating of sound insulation in buildings and ofbuilding elements -Part 3: Airborne sound insulation of facade elements andfacades. (Under revision, to be subjoined to ISO 717-1.)
ISO 3741:1988, Acoustics - Determination of sound power levels of noisesources - Precision methods for broad-band sources in reverberation rooms.
ISO 9614-1:1993, Acoustics - Determination of sound power levels of noisesources using sound intensity - Measurement at discrete points.
ISO 9614-2, Acoustics - Determination of sound power levels of noisesources using sound intensity - Measurement by scanning. (At present atthe stage of draft.)
IEC 942:1988, Sound calibrators.
IEC 1043, Instruments for the measurement of sound intensity. (At presentat the stage of draft.)
NT ACOU 084:1992, Building elements: Sound insulation, intensity.Scanning under laboratory conditions.

ANNEX/6
3 DEFINITIONS
For the purposes of this NORDTEST method, the following definitionsapply.
3.1 AVERAGE SOUND PRESSURE LEVEL IN A ROOM, Lp
10 times the common logarithm of the ratio of the space and time averageof the sound pressure squared to the square of the reference soundpressure, the space average being taken over the entire room with theexception of those parts where the direct radiation of a sound source or thenear field of the boundaries (wall, etc.) is of significant influence. Theaverage sound pressure is given by:
where
p1, p2, ..., pn are the time average (r.m.s.) soundpressures at n different positions in theroom, in pascals;
p0 = 20 µPa is the reference sound pressure.
3.2 SOUND INTENSITY, I
Time average rate of flow of sound energy per unit area. The orientation ofthe unit area is such that the local particle velocity is normal to it. The soundintensity is a vectorial quantity which is equal to
where
p(t) is the instantaneous sound pressure at a point, inpascals;
u(t) is the instantaneous particle velocity at the samepoint, m/s;
T is the averaging time, in seconds.
p12
22
n2
02L = 10
p + p +...+ p
n p lg dB
(1)
_
I
=1
Tp(t)u(t)dt ,
0
T
_ &
W / m2 (2)

ANNEX/7
3.3 NORMAL SOUND INTENSITY, In
Sound intensity component in the direction normal to the measurementsurface. If the normal sound intensity is positive, the acoustic energy flowsout from the measurement surface, and if it is negative, the energy flowstowards the measurement surface. The absolute value of In is denoted by·In·.
3.4 NORMAL SOUND INTENSITY LEVEL, LIn
Ten times the common logarithm of the ratio of the absolute value ofnormal sound intensity ·In· to the reference intensity I0 as given by:
where
I0 = 10-12 W/m2 .
3.5 PRESSURE-INTENSITY INDICATOR OR FIELD INDICATOR, F
The difference between time and surface averaged sound pressure level, Lp,and the normal sound intensity level, LIn, on the measurement surface givenby:
Note In ISO 9614-1 the notation F2 is used.
3.6 RESIDUAL PRESSURE-INTENSITY INDICATOR, δpI0
The difference between indicated sound pressure level and sound intensitylevel when the probe is placed in a sound field in such an orientation thatthe particle velocity in the direction of the probe measurement axis is zero(e.g., in an acoustic coupler or transverse to the direction of propagation ofa plane sound wave).
Inn
0L = 10
I
I ,lg dB
_ _
(3)
F = L - L .p In dB (4)

ANNEX/8
3.7 ELEMENT NORMALIZED LEVEL DIFFERENCE, Dn,e
Ten times the common logarithm of the ratio of the sound power incidenton a reference area to the sound power transmitted through the testspecimen. The incident average normal sound intensity on the referencearea corresponds to the incident average normal sound intensity on the testspecimen. The element normalized level difference is denoted by Dn,e and isexpressed in decibels:
where
In1 is the incident average normal sound intensity, inW/m2;
In2 is the transmitted average normal sound intensity,in W/m2;
A0 is the reference area, in square metres (for thelaboratory, A0 = 10 m2);
S is the area of the test specimen, in square metres.
For the purposes of this test method, the element normalized leveldifference is given by equation 6. It is denoted by DI,n,e and is expressed indecibels:
where the reference area A0 is defined above and
Lp1 is the average sound pressure level in the sourceroom, in decibels;
LIn is the average sound intensity level over the meas-urement surface in the receiver room, in decibels;
Sm is the area of the measurement surface, in squaremetres.
This element normalized level difference is evaluated from Eq. 5 assumingthat the sound field in the source room is perfectly diffuse. For the purposesof ISO 140-10 the element normalized level difference is given in such away that it is assumed further that the sound field is perfectly diffuse also inthe receiving room and that the sound is transmitted only through the testspecimen.
Note If the level of the sound power transmitted through the element
n,e lg dB∆ = 10Ι ΑΙ Σ
,ν1 0
ν2
(5)
I, p1 In0
D = L -6 - L +10A
S ,n,e
mlg dB
(6)

ANNEX/9
to the receiving room is known, the element normalized leveldifference may also be obtained according to:
where the reference area of 10 m2 is supposed, Lp1 is as aboveand LW is the sound power level, in decibels.
3.8 CORRECTED ELEMENT NORMALIZED LEVEL DIFFERENCE, Dn,e,c
If the measurement result DI,n,e is to be compared to a result obtained by thetraditional measurement method ISO 140-10 the corrected elementnormalized level difference
should be used instead of the result of ISO 140-10, where
Dn,e is the element normalized level difference, indecibels, measured according to ISO 140-10;
Sb2 is the area of all the boundary surfaces in thereceiving room, in square metres;
V2 is the volume of the receiving room, in cubicmetres;
λ is the wavelength at the centre frequency of theone-third octave band, in metres.
In the measurements according to ISO 140-10 the sound field in thereceiving room is not perfectly diffuse, as it is assumed, which thusunderestimates the sound power radiated into the receiving room. Thecorrection term in Eq. 8, called Waterhouse correction, compensates forthat effect concerning the higher energy density near the room boundaries.
Note In Annex D a refined form of Waterhouse correction ispresented. By using it, the correction can be determinedexperimentally by measuring the modal density of the receivingroom.
I, p1 WD = L - L + 4 ,n,e dB (7)
(8)

ANNEX/10
3.9 SOUND REDUCTION INDEX, R
Ten times the common logarithm of the ratio of the sound power incidenton a test specimen to the sound power transmitted through the specimen.This quantity is denoted by R and it can be expressed in decibels using theelement normalized level difference:
where
Dn,e is the element normalized level difference, indecibels;
A0 is the reference area, in square metres (for thelaboratory, A0 = 10 m2);
S is the area of the test specimen, in square metres.
If the element normalized level difference is determined by intensitymeasurements, using Eq. 6, it is denoted by DI,n,e. If this is substituted forDn,e in Eq. 9, the result is called intensity sound reduction index anddenoted by RI.
3.10 WEIGHTED ELEMENT NORMALIZED LEVEL DIFFERENCE, Dn,e,w
Element normalized level difference Dn,e weighted according to ISO 717-1,similar weighting as for the level difference D in that standard. If theelement normalized level difference DI,n,e according to Eq. 6 is weighted,the result is denoted by DI,n,e,w. The spectrum adaptation terms C and Ctr
may be stated with the weighted element normalized level difference inparentheses behind the single number quantity as Dn,e,w(C;Ctr), according toISO 717-1 (Draft).
3.11 WEIGHTED SOUND REDUCTION INDEX, Rw
Sound reduction index R weighted according to ISO 717-1. If the intensitysound reduction index RI is weighted, the result is weighted intensity soundreduction index RI,w. The spectrum adaptation terms C and Ctr may bestated with the weighted sound reduction index in parentheses behind thesingle number quantity as Rw(C;Ctr), according to ISO 717-1 (Draft).
R = D -10A
S ,
0n,e lg dB
(9)
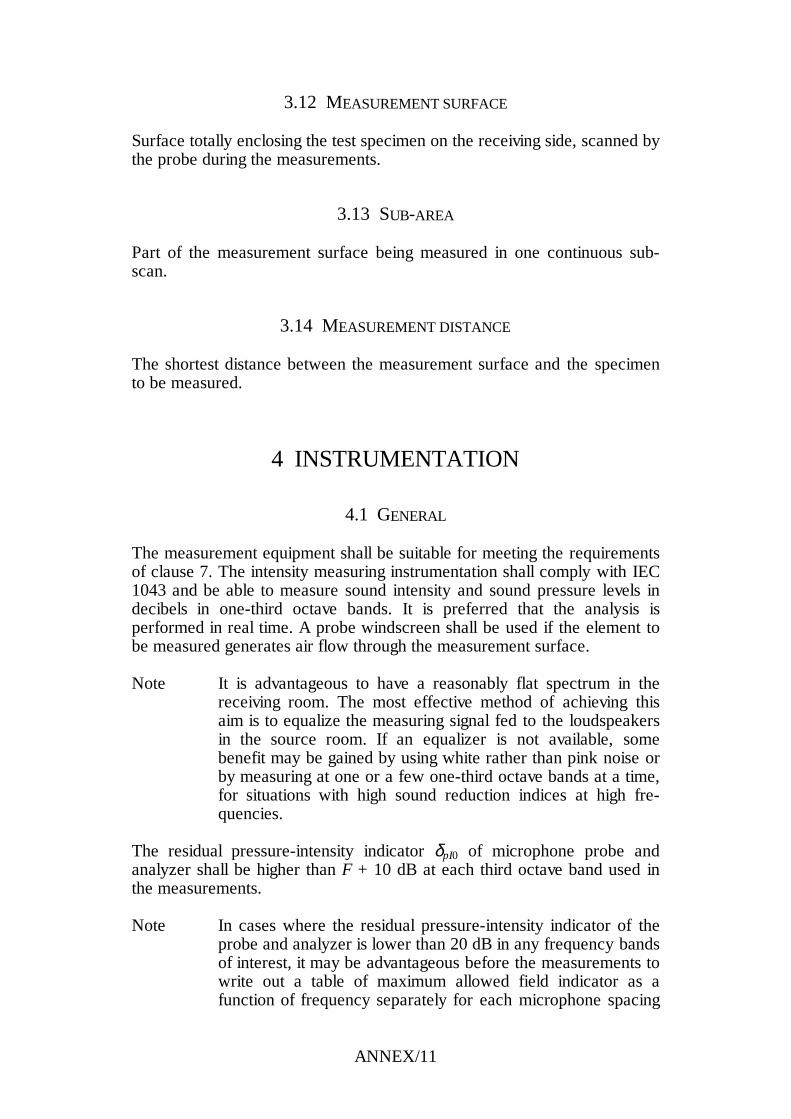
ANNEX/11
3.12 MEASUREMENT SURFACE
Surface totally enclosing the test specimen on the receiving side, scanned bythe probe during the measurements.
3.13 SUB-AREA
Part of the measurement surface being measured in one continuous sub-scan.
3.14 MEASUREMENT DISTANCE
The shortest distance between the measurement surface and the specimento be measured.
4 INSTRUMENTATION
4.1 GENERAL
The measurement equipment shall be suitable for meeting the requirementsof clause 7. The intensity measuring instrumentation shall comply with IEC1043 and be able to measure sound intensity and sound pressure levels indecibels in one-third octave bands. It is preferred that the analysis isperformed in real time. A probe windscreen shall be used if the element tobe measured generates air flow through the measurement surface.
Note It is advantageous to have a reasonably flat spectrum in thereceiving room. The most effective method of achieving thisaim is to equalize the measuring signal fed to the loudspeakersin the source room. If an equalizer is not available, somebenefit may be gained by using white rather than pink noise orby measuring at one or a few one-third octave bands at a time,for situations with high sound reduction indices at high fre-quencies.
The residual pressure-intensity indicator δpI0 of microphone probe andanalyzer shall be higher than F + 10 dB at each third octave band used inthe measurements.
Note In cases where the residual pressure-intensity indicator of theprobe and analyzer is lower than 20 dB in any frequency bandsof interest, it may be advantageous before the measurements towrite out a table of maximum allowed field indicator as afunction of frequency separately for each microphone spacing

ANNEX/12
used. This can be done as follows: Measure the residualpressure-intensity indicator. Subtract 10 dB from the results.This will give the maximum allowed field indicator so that theabove criterion for the residual pressure-intensity indicator isalways satisfied. If the maximum allowed field indicator isknown for spacing d1, it can be calculated for another spacingd2 using
where
Fmax,1 is the maximum allowed field indicatorfor spacing d1;
Fmax,2 is the maximum allowed field indicatorfor spacing d2;
supposing that the same probe (and microphones) are used. InClause 7.4.4 a criterion for the maximum allowed fieldindicator of 10 dB is given in the case of a sound reflectingspecimen. The final maximum of the field indicator will beeither 10 dB or the value obtained in the procedure above,whichever is lower. So the table will have the factors
as functions of frequency for each microphone spacing used.
Note In the case of a test specimen with sound absorbing surface inthe receiving room the criterion for the maximum allowed fieldindicator is 6 dB instead of 10 dB in Clause 7.4.4. In that case10 must be replaced by 6 in Eq. 11.
The equipment for sound pressure level measurements shall meet therequirements of ISO 140-3. In addition the microphone in the source roommust give a flat frequency response in a diffuse sound field.
Note A 13 mm pressure microphone will normally yield satisfactoryfrequency response.
4.2 CALIBRATION
Calibrate the instrument and the probe at least at one frequency in the rangefrom 200 to 1000 Hz in accordance with the calibration procedure and atintervals specified by the manufacturer.
max maxlg,22
1,1F = 10
d
dF ,
• (10)
min dBmax(10, F ) (11)

ANNEX/13
Carry out the following field checks to test the instrument before eachseries of measurements:
a) Carry out a field check according to the instrument manufac-turer's specifications.
If no field check is specified by the instrument manufacturer, check theinstrument according to b) and c):
b) Sound pressure level: Check each pressure microphone of theintensity probe for sound pressure level using a class 1calibrator or better in accordance with IEC 942.
c) Intensity: Carry out a calibration using an intensity calibrator. Ifsuch a calibrator is not available or if the construction of theprobe does not allow it, make a rough field check to indicateanomalies within the measuring system, according to thefollowing: Place the intensity probe on the measurementsurface, with the probe axis oriented normal to the surface, at aposition where the noise from the source is characteristic forthat source. The intensity probe should be mounted on a standto retain the same position while carrying out the measurementcheck. Measure the normal sound intensity level. Rotate theintensity probe through 180 ° about a normal to its measure-ment axis in the same position as the first measurement.Measure the normal sound intensity level again. For the highestsound intensity level measured in one-third octave or octavebands the unsigned difference between the two sound intensitylevels shall be less than 1.5 dB, and the direction indicated forthe intensity shall differ, for the measurement instrumentationto be acceptable.
Note This test may not be completely appropriate for pressure-velocity probes for which the manufacturer's instruction shouldapply.

ANNEX/14
5 LABORATORY REQUIREMENTS
5.1 ROOMS
Laboratory test facilities shall comply with the requirements given forlaboratory test facilities in ISO 140-1, concerning the source room. Thereceiving room may be any room meeting the requirements of the fieldindicator and the background noise, see 7.4.3 and 7.4.5. All the measure-ment results within the same measurements have to correspond to similarreflecting and absorbing properties of the receiving room.
5.2 PARTITIONS
The test object is usually much smaller than the available test opening. Apartition of sufficiently high sound insulation shall be built in the testopening: the object shall be placed in this partition.
If the sound insulation of the partition is expected not to be sufficient, it maybe advantageous to measure it. This measurement can be carried out beforemaking the opening for the test object or with plates having a high soundinsulation on both sides of the opening. It is convenient to express thissound insulation in terms of the element normalized level differenceaccording to equation 5.
6 INSTALLATION AND OPERATION OF TESTOBJECTS
6.1 GENERAL
As the sound insulation of small building elements depends on theirdimensions, reliable values can be obtained only by testing every actualsize.
6.2 MOUNTING OF TEST OBJECTS
Ensure that the test object is installed in a manner representative of fieldpractice with a careful simulation of normal connections and sealingconditions at the perimeter and at joints within the unit.
If the test object is intended to be openable, install it for test so that it can beopened and closed in the normal manner. Open and close it at least tentimes immediately before testing.

ANNEX/15
In order to achieve a realistic wall thickness around the element, it might bepractical or necessary either to increase or decrease the thickness of thepartition wall in the area around the element. Rules for increasing ordecreasing the thickness locally are given in Annex A.
6.3 LOCATION OF TEST OBJECTS
6.3.1 Mounting locations
When a small building unit is mounted near one or more reflecting planes,the sound transmission may differ appreciably from that obtained when theunit is mounted through a partition but away from any adjoining roomsurface. Therefore, mount the equipment to be tested through the partitionin locations representative of normal usage. On devices which can be usedat several different locations, carry out measurements at least with an edgepresent in both rooms.
For transfer air devices and cable ducts which are normally mounted nearan adjoining reflective wall, the specific mounting locations are stated in 6.4and 6.5. For other types of equipment the rules given in 6.3.1.1 to 6.3.1.3shall be observed. If the small building unit is mounted in a niche, theframes of the niche are not considered to be reflective planes in Clauses6.3. - 6.5.
6.3.1.1 Equipment used away from wall
Install equipment mounted through a partition but normally located awayfrom an adjoining wall, floor or ceiling in such a manner that no part iswithin 1.00 m of a surface at right angles to the mounting surface.
6.3.1.2 Equipment used near an edge
Locate equipment mounted through a partition and normally located nearan adjoining wall, floor or ceiling, and away from a corner, at least 1.00 mfrom the nearest wall not being a part of the edge. Unless otherwisespecified by the manufacturer, locate the edge of the equipment 0.1 m fromthe edge of the wall.
6.3.1.3 Equipment used near a corner
Locate equipment mounted through a partition and normally located near acorner at the distance from a corner recommended by the manufacturer.
If natural corners or edges are not available in the test opening, it is essentialto simulate such mounting conditions by attaching reflective panels at rightangles to the partition wall, as illustrated in Annex B. Ensure that thesimulation takes place both in the receiving and the source room.

ANNEX/16
6.3.2 Number of locations
The building elements are small and, in combination with the spatialvariations of the sound field in the test room, this leads to a significantlocation dependency. Use preferably three locations for the mounting of thetest object in the partition wall. These locations shall either
a) be simulated as described in 6.3.1 or
b) they shall be located at least 1.2 m from each other.
Note A location dependency also exists for apparently equivalentcorners which makes it necessary to use more than one cornerto achieve an acceptable precision.
Note When simulating corner or edge locations by attaching reflec-tive panels, it is possible to achieve the necessary locationaveraging by changing the locations and orientations of theadditional panels.
6.4 INSTALLATION OF TRANSFER AIR DEVICES
Install the test objects in a manner representative of field practice and intypical locations with respect to the room surfaces as given in the installa-tion rules above. Mount transfer air devices which are normally mountednear an adjoining ceiling in a location close to a reflective surface at rightangles to the partition, but at least 1.00 m from any corner. The distancebetween the closest part of the device and the adjoining surface shall be 0.1m. Accessories normally used shall be included. Set and fix these acces-sories in accordance with the manufacturer's directions.
If the device is provided with some airflow control, ensure that theequipment is operated in a specified manner typical of normal usage. If thespecified manner is not the fully open condition, include this condition in thetest sequence.
If the device is continuously adjustable to various wall thicknesses, ensurethat the tests comprise at least the two extreme wall thicknesses for whichthe device is stated to be suitable.
6.5 INSTALLATION OF CABLE DUCTS
Install the test object in a manner representative of field practice and intypical locations with respect to the room surfaces. Mount cable ductswhich are normally mounted directly on walls on a reflective surface at

ANNEX/17
right angles to the partition and in accordance with the manufacturer'sdirections. Include accessories normally used. Install these accessories inaccordance with the manufacturer's instructions.
Install the test object with an exposed continuous duct length of at least 2m, both in the source and in the receiving room. Provide the exposed ductends with standard end covers.
Soundproofing accessories to be used in installations through partition wallsare often available in cable ducts. To test practical sealing and insulatingproperties of such soundproofing accessories, it is recommended that thecable duct be filled to its rated capacity with cables.
Note The acoustical performance can vary with the number ofcables.
If the edge mounting is simulated with additional panels, ensure that thepanel length is at least as large as the duct length.
7 TEST PROCEDURE AND EVALUATION
7.1 GENERAL
Measure the average sound pressure level in the source room and theaverage sound intensity level on a measurement surface in the receivingroom. Provided that the field indicator is satisfactory calculate the elementnormalized level difference and, if needed, the intensity sound reductionindex.
Unless otherwise stated in this standard, the laboratory procedures shallcomply with the relevant clauses of ISO 140-3, concerning the soundgeneration and measurement in the source room.
7.2 GENERATION OF SOUND FIELD IN THE SOURCE ROOM
The sound generated in the source room should be steady and have acontinuous spectrum in the frequency range considered. Filters with abandwidth of at least one-third octave may be used.
The sound power should be sufficiently high for the sound pressure andsound intensity level in the receiving room to be at least 10 dB higher thanthe corresponding background level in any third-octave band.
If the sound source contains more than one loudspeaker operating simulta-neously, the loudspeakers should be contained in one enclosure, the

ANNEX/18
maximum dimension of which should not exceed 0.7 m. The loudspeakersshould be driven in phase. Multiple sound sources may be used simulta-neously providing they are of the same type and are driven at the same levelby similar, but uncorrelated signals. Continuously moving sound sourcesmay not be used. When using a single sound source it shall be operated inat least two positions.
The loudspeaker enclosure should be placed to give a sound field as diffuseas possible and at such a distance from the test specimen that the directradiation upon it is not dominant.
7.3 MEASUREMENT OF AVERAGE SOUND PRESSURE LEVEL IN THE SOURCEROOM
The average sound pressure level may be obtained by using a number offixed microphone positions or a continuously moving microphone with anintegration of sound pressure squared (p2). As a minimum, five microphonepositions shall be used.
7.4 MEASUREMENTS ON THE MEASUREMENT SURFACE IN THE RECEIVINGROOM
7.4.1 Measurement surface
The acoustical measurements in the receiving room shall take place on ameasurement surface totally enclosing the test opening. The measurementsurface forms a closed surface over/in front of the element to be measured.If the test specimen generates air flow in the receiving room the speed offlow must not exceed 2 m/s on the scanning paths through the measurementsurface.
If the test specimen is mounted in a niche, the measurement surface isnormally one face, the face consisting of the flat surface of the nicheopening flush with the wall in the receiving room. If the opening is large, themeasurement surface can be made smaller by closing the surface into theopening by using a box-shaped or partial box-shaped measurement surface,see Figs. 1 and 3. The box-shaped surface consists of five faces, see Fig. 1,and the number of faces of a partial box-shaped surface is more than onebut less than five, see Figs. 2 and 3. If the test specimen is not mounted in aniche or if the depth of the niche is less than 0.1 m a box-shaped measure-ment surface has to be used. A box-shaped measurement surface may alsobe used to avoid too high speeds of flow on the measurement surface. If thebuilding element is mounted near one or more reflecting planes excludingthe wall between measuring rooms (see Clause 6), the reflective planes shallbe used as boundaries of the measurement surface, the measurementsurface thus being replaced by a partial one, see Fig. 2. Especially conside-ring the box-shaped or partial box-shaped surfaces, if any reflecting plane

ANNEX/19
(even small) is nearer than 1 m to any part of the measurement surface, theangle between them shall be at least 30 °. The reflecting planes above donot mean those of the element to be measured, the wall between themeasuring rooms and other surfaces on which the measurement surface isclosed. The former requirement is not applied to the frames of a nichewhen using box-shaped or partial box-shaped measurement surfacesprovided that the field indicator is valid according to Clause 7.4.4 at the sidefaces of the measurement surface in the niche opening.
Fig. 1. Box-shaped measurement surface. The arrows point towards thefaces of the measurement surface.
Fig. 2. Examples of partial box-shaped measurement surfaces. The arrowspoint towards the faces of the measurement surface.

ANNEX/20
Fig. 3. Examples of partial box-shaped measurement surfaces on a niche.The arrows point towards the faces of the measurement surface.
The measurement surface may be a hemisphere (or part thereof if the testobject is mounted close to the ceiling, on the floor or in a corner) if alldimensions of the test object inside the receiving room are less than half thechosen measurement distance. In that case the surface consists of only oneface. The measurement surface may be a cylinder (or part thereof) if onlytwo dimensions of the test object inside the receiving room are less than halfthe chosen measurement distance. In that case the cylindrical shell partforms one face of the surface and the ends (two or one) of the cylinderform other faces.
Avoid measurement distances smaller than 0.1 m because of thecomplicated near field of the vibrating element. In the near field theintensity tends to change sign on a very short spatial scale. The sound fieldis also normally more uniform in the niche opening than inside the niche.Avoid measurement distances greater than 0.3 m. However, to avoid toohigh speeds of flow on the measurement surface, larger measurementdistances can be used provided that the field indicator remains in its validrange.
7.4.2 Sub-areas
If the measurement surface consists of one face, it is normally not dividedinto distinct sub-areas. If a box-shaped, partial box-shaped or cylindricalmeasurement surface is used, the measurement surface is normally dividedinto sub-areas, one sub-area for each face of the surface.
If the maximum recommended scanning time of a sub-area is going to beexceeded, the measurement surface has to be divided further into sub-areas. Subdivision can also be carried out if other aspects in the scanningprocedure (see Clause 7.4.3) favour it. In that case use the following

ANNEX/21
principles:
The division into sub-areas can be based on the shape, size and otherfactors of the partition to be measured, to make the scanning patterns easierto follow with a steady speed and line density. Also other constructionaldetails of the partition, including the thicknesses and edges of plate-likeparts, other natural boundaries, natural obstacles (e.g., pipes), leakages etc.can be used as the basis for defining the sub-areas. No dimensions of thesub-areas may exceed 1 m. The sub-areas can be of different size. It isrecommended that strongly (and weakly) radiating parts of the partitionshould have their own sub-areas, as should also parts with negativeintensity.
In the case of more than one sub-area, it is recommended to record theindividual sub-area results and to calculate the final result afterwards, toavoid errors due to scanning speed alteration.
7.4.3 Scanning procedure
Always hold the probe normal to the measurement surface while scanningand direct it to measure the positive intensity outwards from the buildingelement under test. The operator should disturb the acoustic field to bemeasured as slightly as possible. If possible, this can be ensured by theoperator by having larger viewing angles than 45 ° (if forward looking isassumed) in respect to the normal of the surface to be measured.
Scan at a steady speed between 0.1 and 0.3 m/s. Each flat sub-area isscanned using parallel equidistant lines turning at each edge as shown inFig. 4. Scanning patterns of the same kind are applied to hemispherical andsemicylindrical subareas. With the latter, the scanning direction may beaxial or circumferential. The scanning line density depends on theirregularity of the sound radiation. A large number of irregularities such asleakages requires a higher line density. Normally select the line density sothat the distance between adjacent lines is equal to or less than themeasurement distance. Besides, it is preferred that each square or nearlysquare sub-area has at least 5 scanning lines. With other sub-area shapesthe foregoing recommendation is modified so that the product of thenumber of scanning lines in two mutually perpendicular directions (with thesame distance between lines) is at least about 25 (i.e., 5 and 5, or 4 and 6,or 3 and 8, etc.).

ANNEX/22
Fig. 4. Scanning patterns for the two scans.
Note The last recommendation regarding the minimum number ofscanning lines will guarantee that the (minimum) total pathlength of the scanning lines is independent of the sub-areashape. In fact, the minimum path length according to therecommendation will be 5 times the square root of the area.
If the speed of flow is not constant on the measurement surface, the areasof high speed of flow may be avoided in some degree by proper selection ofthe scanning pattern.
If the individual sub-area results are recorded for later calculation, the linedensity may be different on different sub-areas. Those sub-areas that havesmall dimensions can be measured using discrete probe positions in themiddle of the sub-areas. The dimensions are small if a definite scanningpattern is difficult or impossible to be traced.
Avoid stops other than interruptions when passing from one sub-area toanother.
If the individual sub-area results are not recorded for later calculation, thescanning time of each sub-area shall be proportional to the size of the area.For the sake of steady scanning speed and line density, it is recommendedthat the maximum scanning time is about 1 min for each sub-area unlessscanning is carried out by an automatic system.
Note The recommendation regarding the maximum scanning timetogether with the other recommendations and requirementsabove may lead to maximum recommended sub-area sizes.
If the instrumentation is such as to allow only discrete integration times,take into account the following special rules:

ANNEX/23
Adjust the scanning speed and integration time of each sub-area so that the scanning time is as near to the integration timeas possible. If the scanning time of a sub-area is about 20 % ormore longer than the integration time or if the integration timeis about 20 % or more longer than the scanning time, rescanthe sub-area. If it can be expected that the intensity level is atleast 6 dB higher in the part of the scanning pattern notintegrated, rescan the sub-area (although otherwise within thelimits above). If the integration time is longer than the scanningtime (within the above limits), i.e., the scanning will be endedbefore all the integration time has elapsed, continue scanningfrom the end of the scanning path towards the beginning, withdecreased line density, until the integration time ends. Alwaysrecord the individual sub-area results and calculate the finalresult afterwards.
If the measurement surface is not one flat surface, it is important to payparticular attention to the areas close to the intersection between the surfaceand the partition wall in which the test specimen is mounted. The measure-ment surface must be closed properly around the outer edge of themeasuring surface, that is, it is essential to scan as close as possible to thepartition wall. For measuring surfaces that are divided into several sub-areas, these do not need to be closed onto the physical surface at the jointsbetween two sub-areas as long as there is no gap between them.
7.4.4 Sound intensity measurement
During the scan measure the time and space integrated sound intensity levelLIn. If possible measure the time and space integrated sound pressure levelLp simultaneously. If the sound pressure level is not measured simultaneous-ly, measure it using scanning similar to that for sound intensity. If themeasurement surface is divided into several sub-areas, each of area Si andeach scanned individually, the total sound intensity level LIn and soundpressure level Lp must be evaluated from
where I i is positive for sound intensity with positive direction
and negative for sound intensity with negative direction
( ) ( )( ) ( )
In i i i
p iL / 10
i
L = 10 _ S I -10 _ S
L = 10 _S 10 -10 _S ,pi
lg lg dB
lg lg dB(12)
iL / 10I = 10 , Ii energy flow out from the test surface (13)

ANNEX/24
Calculate the field indicator according to Eq. 4. If the measured intensity isnegative or if F is not satisfactory, that is if F > 10 dB for a sound reflectingtest specimen or if F > 6 dB for a test specimen with a sound absorbingsurface in the receiving room, improve the measurement environment. Firsttry to increase the measurement distance by 5 ... 10 cm. If this fails addsound absorbing material to the receiver room. The field indicatorrequirement shall be satisfied for each scan and each loudspeaker positionat each third octave band used in the measurements. However, it shall besatisfied only for the total measurement surface and not for individual sub-areas.
Note As a rule of thumb F < 10 dB requires S/A < 1.25 where S isthe area of the measurement surface and A is the soundabsorption area of the receiving room. The more flankingtransmission there is the more A must be increased.
Note The criterion for the residual pressure-intensity indicator δpI0 inrespect to F may lead to more stringent upper bounds than 10or 6 dB to F, see Clause 4.1.
Once the measurement environment is satisfactory carry out two completescans and compare the results. Turn the scanning path 90 degrees betweenthe two scans. If a sub-area is such that its dimension is small in onedirection (of the same order or smaller than the chosen distance betweenlines), both the scans will be performed with lines parallel to the largerdimension. If the difference between the two measurements is less than orequal to 1.0 dB for any one frequency band the measurement result is givenby the arithmetic average of the two measurements. If the difference islarger than 1.0 dB the measurements are not valid and new scans must becarried out until the requirement is satisfied. The requirement for the leveldifference concerns the final result, not the results of individual subareas. Ifthe requirement cannot be satisfied, change the scanning pattern, measure-ment surface or measurement environment and repeat the measurementsuntil the requirement is satisfied. If, despite these efforts, it turns out to beimpossible to comply with these requirements, the results may still be givenin the test report provided that all deviations from the requirements of thismethod are clearly stated.
If two or more loudspeaker positions are used carry out a pair of scans ineach position, each pair of scans complying with the above requirements.All results, including element normalized level difference and field indicator,are given by the arithmetic mean of all valid scans carried out.
iL / 10I = - 10 , .Ii energy flow towards the test surface (14)

ANNEX/25
7.4.5 Background noise
Both sound pressure level and sound intensity level shall be at least 10 dBhigher than the background noise.
Note These requirements may be tested by applying the followingprocedure: If the field indicator F < 10 dB then lower thesource level by 10 dB. If F is changed by less than 1 dB thenthe requirements are satisfied. Carry out the procedure atpoint(s) representative for the actual measurements.
7.5 FREQUENCY RANGE OF MEASUREMENTS
Measure the sound pressure level and the sound intensity level using one-third octave band filters having at least the following centre frequencies inhertz:
100 125 160 200 250 315 400 500 630 800 1000 1250 1600 2000 2500 3150 4000 5000.
If additional information in the low frequency range is required then usethird octave band filters with the following centre frequencies:
50 63 80.
The response of the filters should be in accordance with IEC Publication225.
8 PRECISION
The precision is expected to be equivalent to that given in ISO 140-3 in thefrequency range valid according to the measurement method.
It is required that the measurement procedure should give satisfactoryrepeatability. This can be determined in accordance with the method shownin ISO 140-2 and should be checked from time to time, particularly when achange is made in procedure or instrumentation.

ANNEX/26
9 EXPRESSION OF RESULTS
For the statement of the airborne sound insulation of the test specimen, givethe values of element normalized level difference and, if needed, theintensity sound reduction indices at all frequencies of measurement to onedecimal place in tabular form and/or in the form of a curve. In additionalways give a curve of the pressure-intensity indicator in the graph. Indicateclearly any deviations from the basic requirement that the differencebetween two scans must not exceed 1 dB. For graphs with the level indecibels plotted against frequency on a logarithmic scale, use the followingdimensions:
5 mm for the one-third octave band;
20 mm for 10 dB.
If weighted element normalized level difference DI,n,e,w or weighted soundreduction index RI,w is to be given, calculate it as specified for single-numberquantities in either ISO 717-1 or ISO 717-3. The spectrum adaptation termsC and Ctr may also be stated as in Clauses 3.10 and 3.11.
10 TEST REPORT AND RECORD
10.1 INFORMATION TO BE REPORTED
The test report shall state:
a) reference to this NORDTEST method;
b) name and address of the testing laboratory;
c) identification number of the test report;
d) name and address of the organization or the person whoordered the test (optional);
e) purpose of the test;
f) name and address of manufacturer or supplier of the testobject;
g) name or other identification marks of the tested object;
h) description of the tested object (test specimen), including typeand size, with sectional drawing and operating conditions;

ANNEX/27
i) identification of the test equipment and instruments usedincluding the probe type or probe configuration; if more thanone probe type or configuration is used, the frequency rangeused for each of these; methods and instruments used incalibration and field check;
j) description of mounting conditions, including the location of thetest object in the partition wall and the distances to adjoiningwalls, floor, ceiling and reflective panels;
k) element normalized level difference of the test specimen as afunction of frequency; intensity sound reduction index, ifneeded, and pressure-intensity indicator of test specimen as afunction of frequency including a clear indication of anydeviations from this method;
l) single number rating according to ISO 717, if needed; also thespectrum adaptation terms as in Clauses 3.10 and 3.11, ifneeded;
m) limit of measurement in case of background noise;
n) brief description of details of procedure;
o) date of test, and signature of person responsible.
10.2 INFORMATION TO BE RECORDED
Information to be recorded includes, in addition to the information to bereported, also:
a) results of the different sub-areas;
b) measurement distance, shape of measurement surface anddimensions of sub-areas;
c) scanning time of each sub-area;
d) deviations of method concerning e.g., scanning patterns,scanning speeds, scanning times etc.

ANNEX/28
11 APPLICATION OF SOUND INSULATIONDATA
When predicting the resulting performance of complex partition construc-tions, it is necessary to identify the important transmission paths, to estimatethe sound insulation properties of the individual partition elements and toadd their individual transmission contributions. A typical situation could bethat one is interested in the sound insulation of a facade consisting of a wall,a window and an outdoor air intake. Guidelines for the derivation of theresulting sound insulation of a partition construction consisting of a partitionwall and a small building element are presented in Annex C.

A1
ANNEX A: LOCAL CHANGE IN WALLTHICKNESS
(normative)
A.1 LOCAL INCREASE OF WALL THICKNESS
Instead of changing the thickness of the complete partition wall, simulatevarious wall thicknesses by adding extra panels to the original partitionconstruction. The edges of such additional panels shall be at least 0.5 mfrom any part of the test object.
A.2 LOCAL DECREASE OF WALL THICKNESS
If a thick partition wall is needed to ensure sufficiently high flankingtransmission loss, create a realistic wall thickness around the test device bylocally reducing the thickness. This shall be done according to Fig. A.1.
1 Partition between test rooms2 Test specimen3 Auxiliary transition panels with mass per unit area more than 10 kg/m2 andan inclination of α < 30°. (The panels shall be sealed with tape along edges.)
Fig. A.1. Local decrease of wall thickness.

A2
The following relations shall hold:
1
2
3
l 0.6
l 0.1
l 0.1
< 30 .
≥≥≥
°
m
m
m
α
(A.1)

B1
ANNEX B: SIMULATION OF CORNER AND EDGELOCATIONS
(normative)
The simulation of a corner is shown in Fig. B.1. To simulate an edge, it issufficient to use only one panel, the dimensions of which shall be at least1.2 x 2.4 m. The minimum dimensions are valid at and above the thirdoctave with the centre frequency of 100 Hz. If a frequency range down to50 Hz is used, the minimum panel dimensions shall be doubled. The panelsshall not be mounted parallel to the boundary surfaces of the room.
If it is necessary to use additional panels in both the source room and thereceiving room, ensure that the locations and orientations of the panels arethe same in both rooms.
The mass per unit area of the panels shall exceed 7 kg/m2. Above 100 Hz,the sound absorption coefficient shall be less than 0.1 at every frequencyband of interest. The sides of the panels facing to the small element in thereceiving room shall have the average absorption coefficient less than 0.06,calculated over the total frequency range of interest above 100 Hz.
Note The requirements concerning the absorption coefficient can besatisfied if, e.g., wooden panels with steel coverings are used.
Seal the connections between the panels and the partition wall with, forexample, a heavy adhesive tape. As the mounting of additional panels to thepartition wall might influence its transmission characteristics, include thevarious panel arrangements in the measurements of the flanking trans-mission.

B2
Fig. B.1. Drawing showing the principle of simulating a corner locationby attaching reflective panels at right angles to the partition wallmounted in the test opening.

C1
ANNEX C: GUIDELINES FOR THE DERIVATIONOF THE OVERALL SOUND REDUCTION OFCOMPOSITE PARTITION CONSTRUCTIONS
If a small building element is installed in a partition, the resulting soundinsulation is given by
where
R is the sound reduction index of the partition wall,in decibels;
Dn,e is the element normalized level difference of thesmall building element, in decibels;
A0 is the reference area, in square metres (for thelaboratory, A0 = 10 m2);
S is the total area of the partition, in square metres.
If more than one unit of a specific building element is installed in a partition,the second term in the denominator in Eq. 1 has to be multiplied by thenumber of the elements. If more than one, mutually different units areinstalled in a partition, Eq. 1 will be replaced by
where the summation takes place over i ; R, A0 and S are as above, and
Dn,e,i is the element normalized level difference of thei :th small building element, in decibels.
The above extensions to Eq. 1 presuppose that the acoustical interactionbetween the elements has no effect on the total radiated sound power. Theinteraction can be seen at low frequencies so that the total sound powerradiated by the elements at the same time is not equal to the sum of thesound powers of the elements when they are radiating separately. Thisusually tends to decrease the total sound insulation. If two elements that canbe considered as similar constant volume velocity sources are mounted at adistance d, the difference between the total radiated sound power comparedto the sum of individual powers is
p -R / 100
-D / 10R = 101
10 +( A / S)10 ,lg dB
n,e
(C.1)
p -R / 100
-D / 10R = 101
10 +( A / S)_10 ,
ilg dB
n,e,
(C.2)

C2
where
∆Lw is the difference between the total radiated soundpower and the sum of individual powers, in deci-bels;
λ is the wavelength, in metres (c/f, c = speed ofsound, f = frequency);
which can be considered to be the same as the difference in soundinsulation (with different sign) if the sound reduction index of the partition ishigh compared with the element normalized level difference of theelements. If the sound reduction index of the partition wall is low thedifference is lower. There are two situations where the problem ofinteraction is overcome. The first is that the measurement has been madefor the total sound insulation of the elements mounted in a way similar totheir final mounting. The other is that the elements are mounted far enoughfrom each other to avoid the interaction. If two elements are consideredaccording to Eq. 3 an error of 1 dB at the lower limiting frequency of thirdoctave of 100 Hz will give the minimum distance of the elements to be 1.5m. At the lower limiting frequency of third octave of 50 Hz the minimumdistance is 3 m. Corresponding minimum distances for an error of 0.5 dBare 5 m (100 Hz) and 10 m (50 Hz). If it is not possible to overcome theproblem, i.e., if one has to evaluate the resulting sound insulation of apartition having more than one small element with distances of less than 1.5m between them, based on the measurement results of the elementnormalized level differences of individual elements, an upper bound for theresulting error can be got from
where
∆Lw is given by Eq. 3, in decibels, with d taken as theaverage distance of any element from the elementnearest to it;
n is the number of small elements.
In Eq. 4 it has been assumed, besides the assumptions for Eq. 3, that anyelement interacts only with the element nearest to it.
If the total physical area of the small element(s) ΣSi (in the plane of thepartition) is not small compared with the area of the partition, Eqs. 1 and 2give an underestimate of the resulting sound insulation. The error depends
∆ wL = 10 1+(2 d / )
2 d / ,lg
sindB
π λπ λ
(C.3)
∆ ∆p wR L +10 (n -1) ,≈ lg (C.4)

C3
on the sound reduction index of the partition wall compared with theelement normalized level difference of the elements; the lower the soundreduction index of the partition wall, the higher this is. If the soundreduction index of the partition wall is very low, the error can be about 1dB if ΣSi is about 20 % of the total area, 0.5 dB if ΣSi is about 10 % of thetotal area and 0.1 dB if ΣSi about 2 % of the total area. The error is lowerthan stated above if the sound reduction index of the partition wall is high.The error can be compensated for by changing the term 10-R/10 according to
in Eqs. 1 and 2. To compensate for the error it is required that the totalphysical area of the small elements is known.
Example. Let Rm be the minimum allowed value for the total sound reduction index of apartition with n identical small elements. Let the sound reduction index R of thepartition be expressed as
Using Eqs. 1 and 5 the element normalized level difference of each small elementhas to satisfy:
where S1 is the area of one element. For two extreme cases, when ∆R tends to zeroor infinity, the requirement will be
In the first case, an alternative way of stating the requirement is that if the soundreduction index of the partition just satisfies the requirement, the sound reductionindex of each small element has to be equal to or higher than the requirement (seethe relation between the sound reduction index and element normalized leveldifference, Eq. 9). In the second case the sound reduction index of the partition is sohigh that the total sound reduction index is determined only by the elements. If thearea of the partition is S = A0 = 10 m2, the requirement in the second case can bewritten as
-R / 10 i -R / 1010 1-_ S
S10→
• (C.5)
R = R + R .m dB∆
n,e m lg dBD R + 10n A / S
1- (1- n S / S) 10 ,
0
1- R / 10≥
•
∆
n,e m
n,e m
lg dB
lg dB
D R +10 ( A / S ) , R 0
D R + 10 (n A / S) , R .
0 1
0
≥ →≥ → ∞
∆∆

C4
The acoustical interaction between the elements is not taken into account in thisexample.

D1
ANNEX D: REFINED FORM OF WATERHOUSECORRECTION
The Waterhouse correction, used in Eq. 8, can be presented more preciselyby using the modal density of the room instead of the room geometry. Bydoing so the corrected element normalized level difference Dn,e,c (for theresult of ISO 140-10 measurement) can be written as
where
Dn,e is the element normalized level difference, indecibels;
n2 is the modal density of the receiving room, inmodes/hertz;
V2 is the volume of the receiving room, in cubicmetres;
f is the centre frequency of the one-third octaveband, in hertz.
This formula has the advantage that the Waterhouse correction can bedetermined experimentally by measuring the modal density of the receivingroom.
This formula can be written using geometrical quantities as
where Dn,e is as above and
Sb2 is the area of all the boundary surfaces in thereceiving room, in square metres;
V2 is the volume of the receiving room, in cubicmetres;
L2 is the total length of the linear dimensions of thereceiving room, in metres (if the room is rectangu-lar with dimensions a, b and c, L2 = 4 ⋅ (a + b +c));
λ is the wavelength at the centre frequency of theone-third octave band, in metres.
, (D.1)
, (D.2)

D2
The formula 2 is identical to Eq. 1 with rectangular rooms; for other roomshapes Eq. 2 is an approximation. The last (third) factor in the correctionterm in Eq. 2 is not presented in the traditional Waterhouse correction inEq. 8. Normally it has significance only at frequencies below 100 Hz,typically about or less than 0.5 dB.

VTT TIETOPALVELUJULKAISUJEN TOIMITUS
Esittelyteksti
A laboratory method to evaluate the sound insulation of small building elementsusing sound intensity technique was developed. A supplement, considering thegeneral usefulness of the element normalized level difference in evaluating thesound insulation of partitions, is included in the method. The method givessimilar results as ISO 140-10 with an accuracy of 1 dB or better at a frequencyrange where both of the methods give valid results. The effects of flanking trans-mission on the sound insulation measurement results can be diminished by usingintensity technique unless the flanking transmission is very remarkable. Animproved form has been developed to the Waterhouse correction. The Waterhousecorrection can be determined for each room by measuring or calculating its modaldensity. The Waterhouse correction of the receiving room should be subtractedfrom the result of traditional measurements of the sound reduction index. NoWaterhouse correction is needed for the source room. The measurement of soundinsulation by the intensity technique needs no Waterhouse corrections.