measurement, instrumentation and experiment design
TRANSCRIPT
Measurement, Instrumentation and Experiment Design
PHYS 352 – Lab 5Introduction to LabView
Winter Term, 2010
Material taken from aNational Instruments Tutorial
6-Hour Hands-On
Introduction to LabVIEW
LabView programs are called virtual instruments because their appearance and operation imitate
physical instruments, such as oscilloscopes and multimeters.
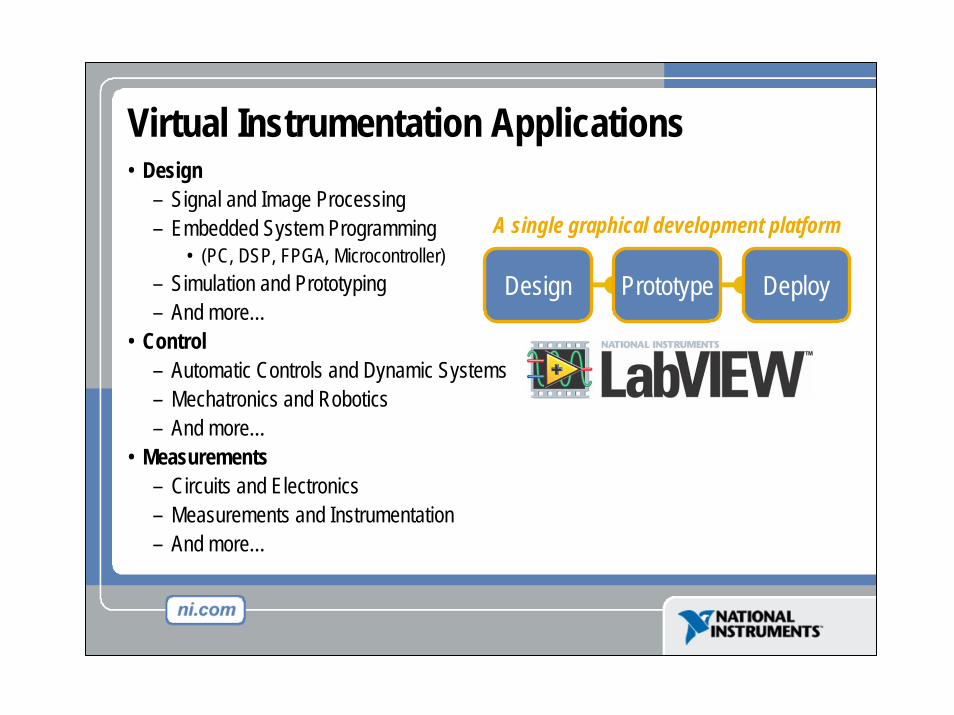
Virtual Instrumentation Applications• Design
– Signal and Image Processing– Embedded System Programming
• (PC, DSP, FPGA, Microcontroller)– Simulation and Prototyping– And more…
• Control– Automatic Controls and Dynamic Systems– Mechatronics and Robotics– And more…
• Measurements– Circuits and Electronics– Measurements and Instrumentation– And more…
Design Prototype Deploy
A single graphical development platform
In LabView
-- Build a user interface (front panel) with controls and indicators
-- Add the code (block diagram)using VIs and structures
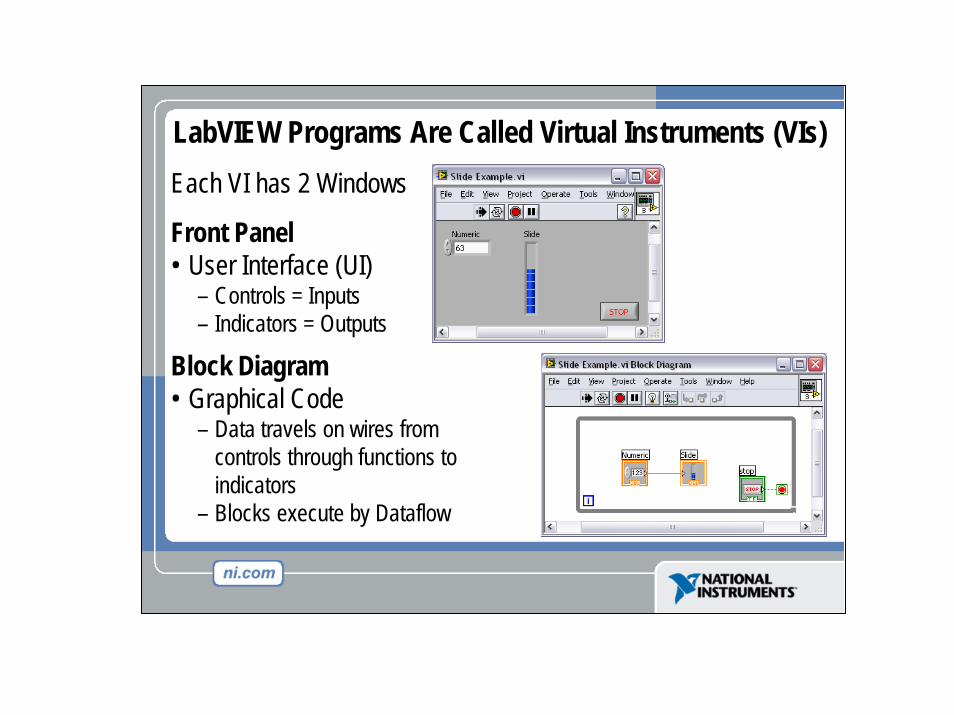
Each VI has 2 Windows
Front Panel• User Interface (UI)
– Controls = Inputs– Indicators = Outputs
Block Diagram• Graphical Code
– Data travels on wires from controls through functions to indicators
– Blocks execute by Dataflow
LabVIEW Programs Are Called Virtual Instruments (VIs)
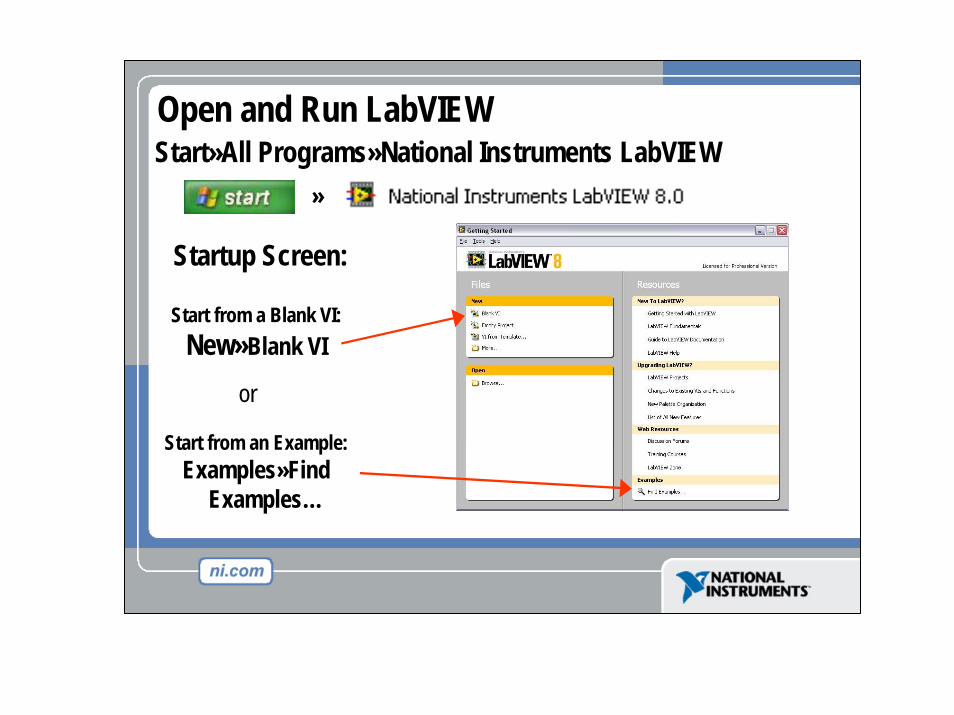
Start»All Programs»National Instruments LabVIEW
Startup Screen:
Start from a Blank VI:New»Blank VI
Start from an Example:Examples»Find
Examples…
»
or
Open and Run LabVIEW
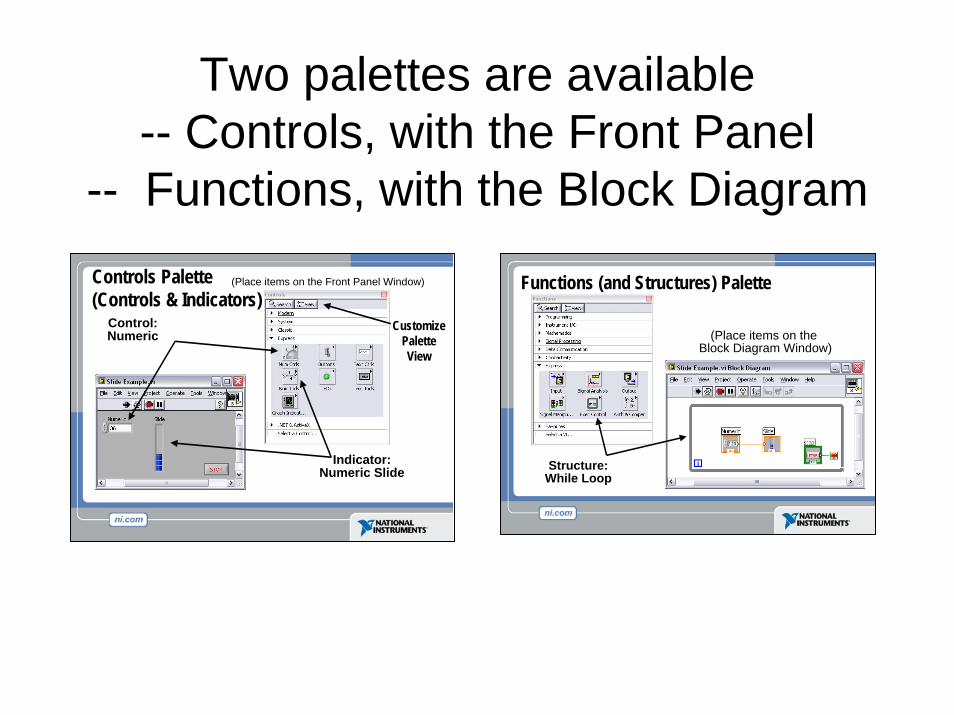
Two palettes are available-- Controls, with the Front Panel
-- Functions, with the Block DiagramControls Palette(Controls & Indicators)
(Place items on the Front Panel Window)
Indicator:Numeric Slide
Control:Numeric
Customize Palette View
Functions (and Structures) Palette
(Place items on theBlock Diagram Window)
Structure:While Loop
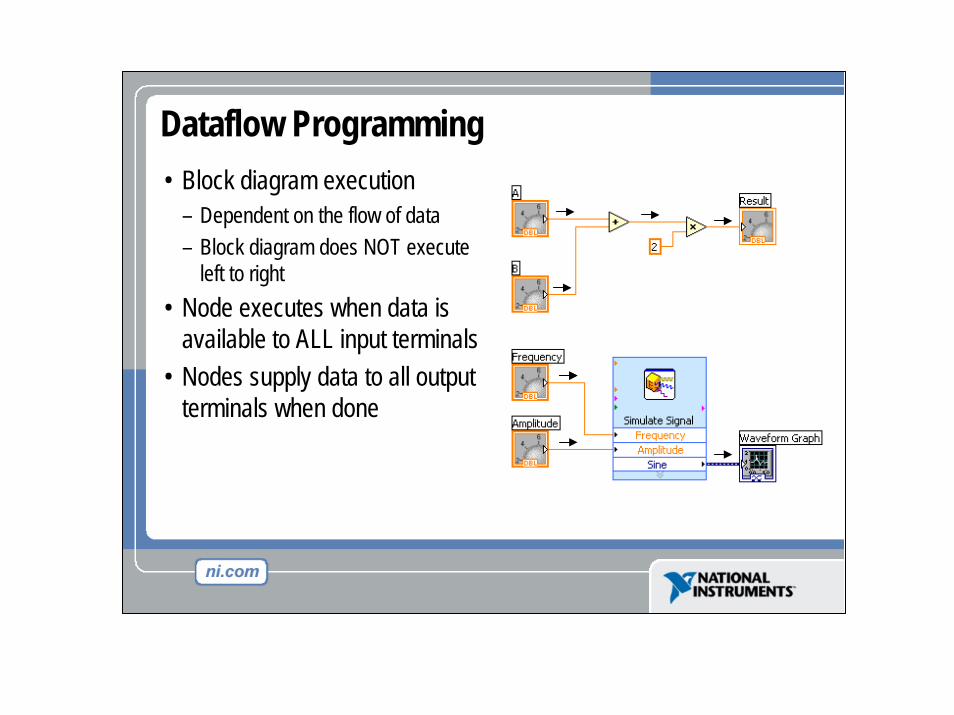
• Block diagram execution– Dependent on the flow of data– Block diagram does NOT execute
left to right• Node executes when data is
available to ALL input terminals• Nodes supply data to all output
terminals when done
Dataflow Programming
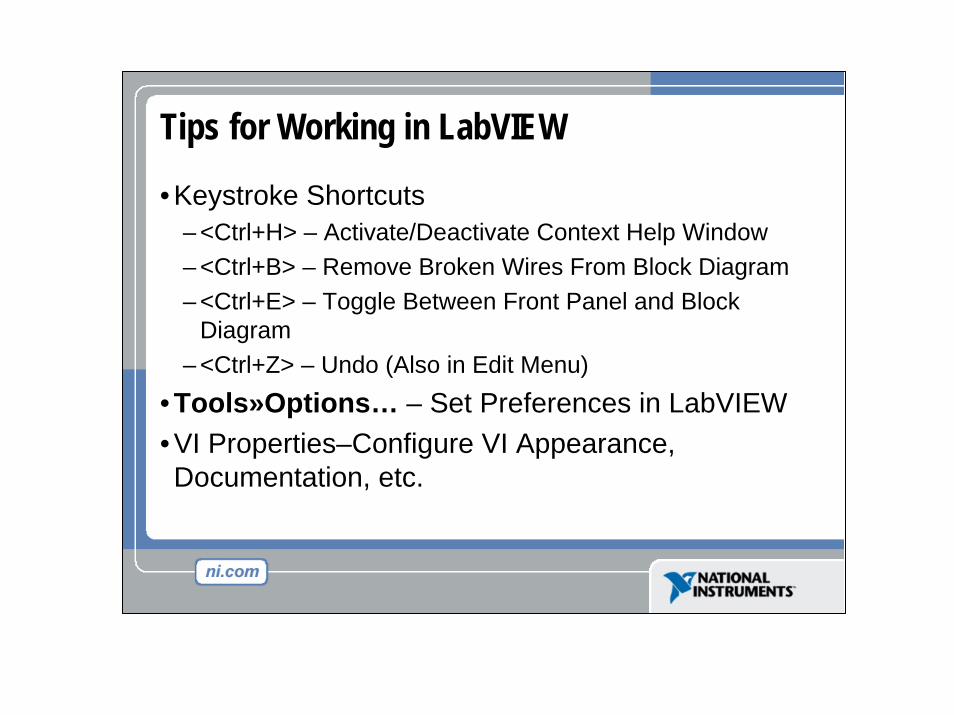
Tips for Working in LabVIEW
• Keystroke Shortcuts– <Ctrl+H> – Activate/Deactivate Context Help Window– <Ctrl+B> – Remove Broken Wires From Block Diagram– <Ctrl+E> – Toggle Between Front Panel and Block
Diagram– <Ctrl+Z> – Undo (Also in Edit Menu)
• Tools»Options… – Set Preferences in LabVIEW• VI Properties–Configure VI Appearance, Documentation, etc.
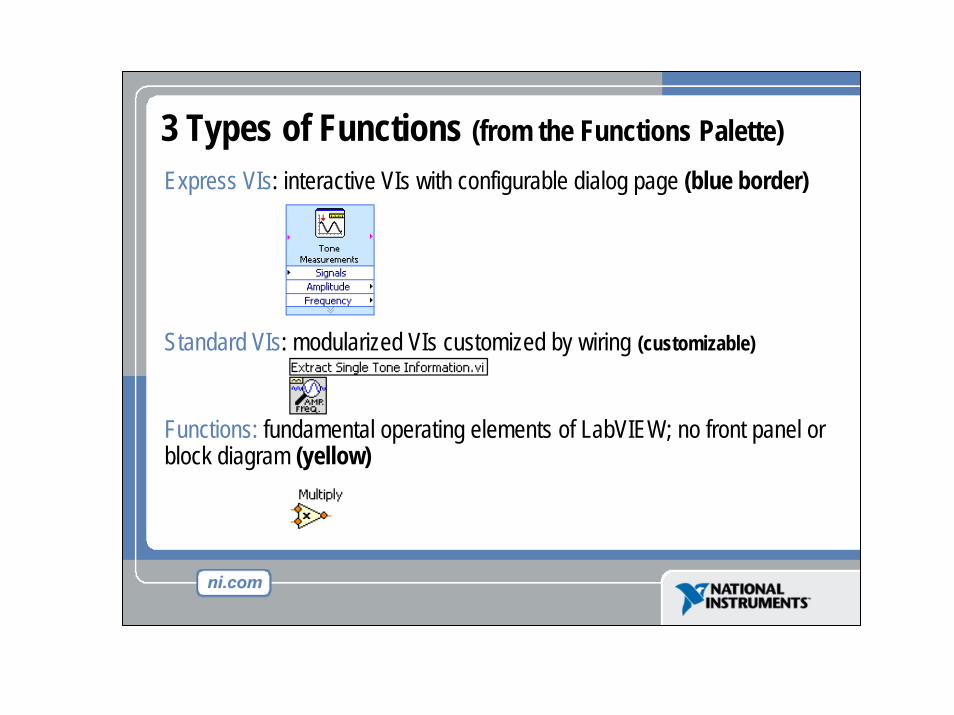
3 Types of Functions (from the Functions Palette)Express VIs: interactive VIs with configurable dialog page (blue border)
Standard VIs: modularized VIs customized by wiring (customizable)
Functions: fundamental operating elements of LabVIEW; no front panel or block diagram (yellow)
Section II – Elements of Typical ProgramsA. Loops
• While Loop• For Loop
B. Functions and SubVIs• Types of Functions• Creating Custom Functions (SubVI)• Functions Palette & Searching
C. Decision Making and File IO• Case Structure• Select (simple If statement)• File I/O
Section III – Presenting your ResultsA. Displaying Data on the Front Panel
• Controls and Indicators• Graphs and Charts• Loop Timing
B. Signal Processing• MathScript• Arrays• Clusters• Waveforms
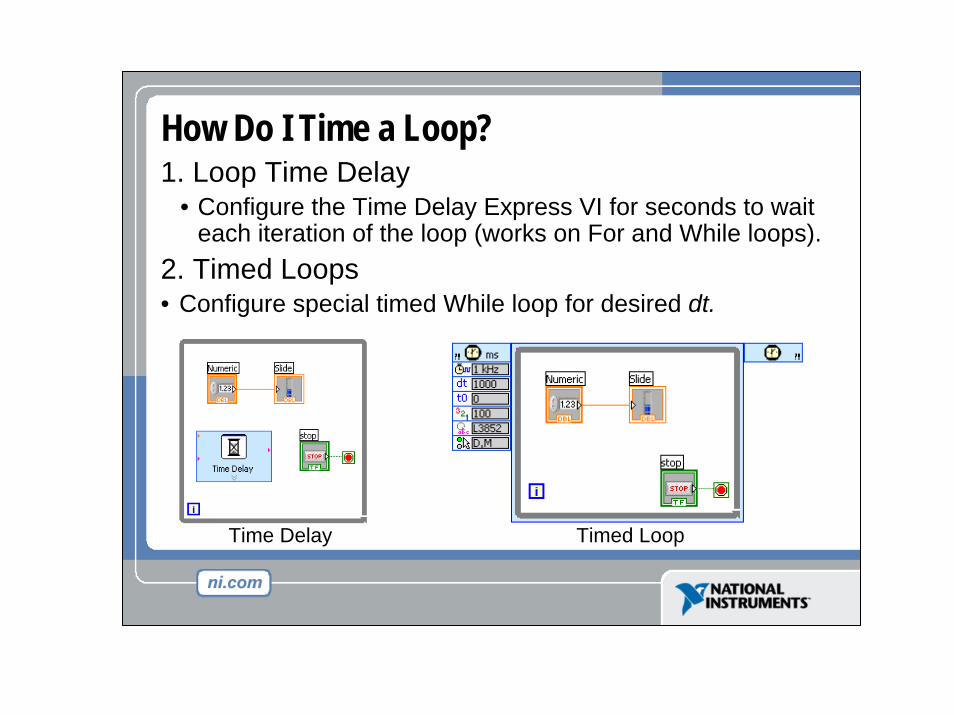
How Do I Time a Loop?1. Loop Time Delay
• Configure the Time Delay Express VI for seconds to wait each iteration of the loop (works on For and While loops).
2. Timed Loops• Configure special timed While loop for desired dt.
Timed LoopTime Delay
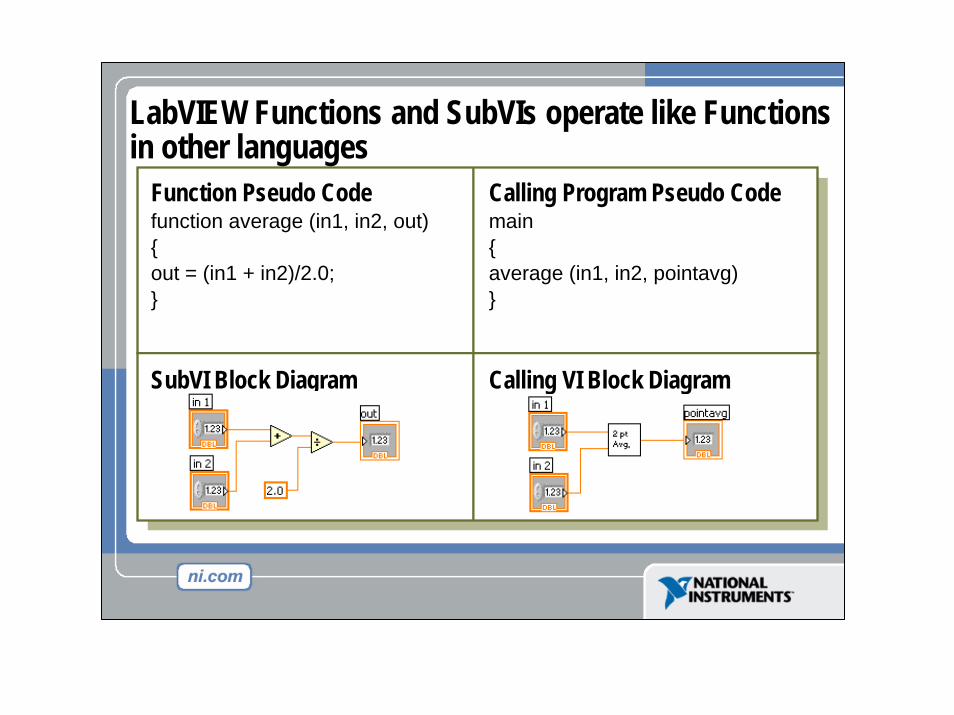
LabVIEW Functions and SubVIs operate like Functions in other languages
Function Pseudo Codefunction average (in1, in2, out){out = (in1 + in2)/2.0;}
SubVI Block Diagram
Calling Program Pseudo Codemain{average (in1, in2, pointavg)}
Calling VI Block Diagram
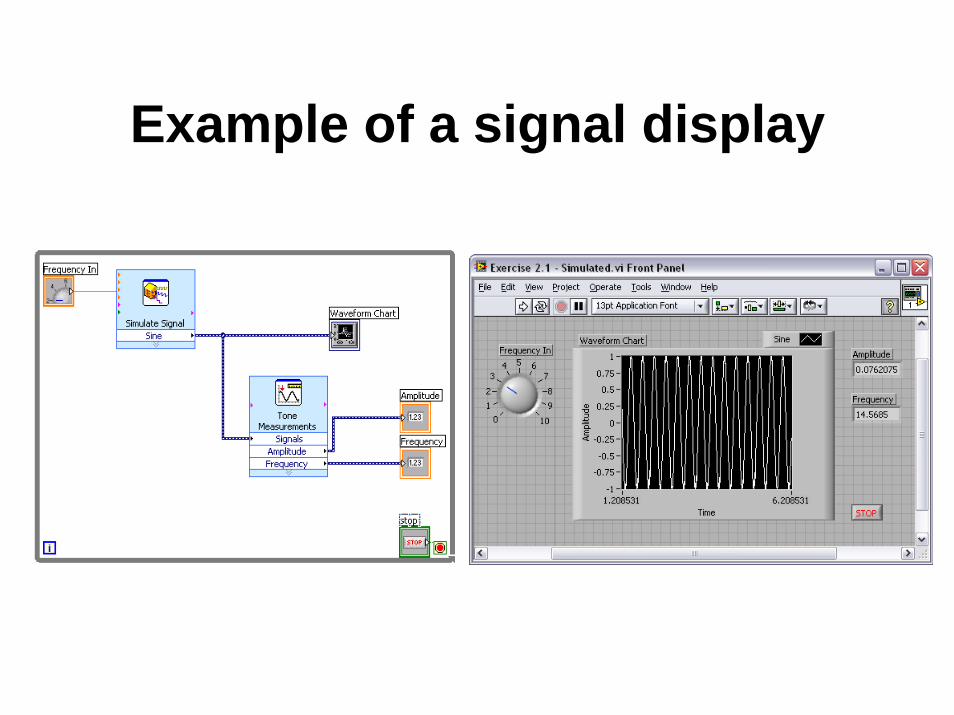
Example of a signal display