mean, median, mode, standard deviation for grouped data for statistical measure for shampoo in...
TRANSCRIPT

Managerial Statics
1
Mean, median, mode, Standard deviation for
grouped data for Statistical Measure for
Shampoo in Indian market
Presented to
Sameer Virani
By
Renzil D’cruz
http://RenzilDe.com
http://about.me/renzilde
http://linkedin.com/in/renzilde

Managerial Statics
2
Introduction
In statistics and data analysis, the mean, median, mode, range, and standard
deviation tell researchers how the data is distributed. Each of the five measures
can be calculated with simple arithmetic formulae. The mean and median
indicate the "centre" of the data points. The mode is the value or values that
occur most frequently. Range is the span between the smallest value and largest
value. Standard deviation measures how far the data "deviates" from the centre,
on average. Knowing how to calculate these statistical measures will help you
analyze data from surveys.
We have conducted survey on sample of 50 people age group between 18-25,
who are consumers of various Shampoos. We compare Sunsilk, L’Oreal with
respect to other brands on various factors. In questionnaire, we compare various
shampoos on 10 features such as price, size, aroma etc. For which we have got
good response from our Classmates, friends and family members.
The shampoo market in India is estimated to be 2,500-3,000 crore. The
shampoo market is India is categorized according to the benefits they provide.
Mostly consisting of three kinds of shampoos cosmetic, herbal and anti
dandruff, the shampoo market in India has managed to tap users of the various
segments according to their requirements and preferences.
Due to the continuous efforts of the top shampoo brands in India penetration of
shampoos in urban areas is almost 100%. As far as penetration of shampoo in
the rural areas is concerned it has risen by almost 18% in the current scenario.
The top shampoo brands in India include Sunsilk, Clinic Plus, L’oreal and
Pantene. The company that leads the shampoo market in India is Hindustan
Unilever Limited. The top three most sought after brands Sunsilk, Dove and
Clinic are produced by HUL. The company holds a 44% market share in the
Indian shampoo industry. It is said that HUL earns almost 8% of its revenue
from the sale of these products. Proctor and Gamble the second top shampoo
brand in India holds a market share of around 25% in the Indian shampoo
industry. The revenue earned from the value of shampoos from Proctor and
gamble is almost 17%.
Managerial Statics
3
Various Shampoos in Indian Market:
Sunsilk:
Sunsilk is a hair care brand, primarily aimed at women, produced by
the Unilever group, which is now considered the world's leading company in
hair conditioning and the second largest in shampoo. Sunsilk is Unilever’s
leading hair care brand, and ranks as one of the Anglo-Dutch conglomerate's
“billion dollar brands". Sunsilk shampoos, conditioners and other hair care
products are sold in 69 countries worldwide.
Sunsilk is sold under a variety of different names in markets around the world
including Elidor, Seda and Sedal. The brand is strongest in Asia, Latin
America and the Middle East and is the number one hair care brand
in India, Brazil, Argentina, Bolivia, Bangladesh, Sri Lanka and Thailand
L’oreal:
The L'Oréal Group is the world's largest cosmetics and beauty company with its
registered office in Paris and head office in the Paris suburb of Clichy, Hauts-
de-Seine, France, it has developed activities in the field of cosmetics.
Concentrating on hair colour, skin care, sun protection, make-
up, perfumes and hair care, the company is active in the dermatological, tissue
engineering and pharmaceutical fields and is the top nanotechnology patent-
holder in the United States.
L'Oréal is a listed company, but the founder's daughter Liliane Bettencourt and
the Swiss food company Nestlé each control around 30 percent of the shares
and voting rights.
Questionnaire For Shampoo Survey:
Please rate the following on the scale of 1-7:(1:Lowest & 7: Highest)
Company
Variable
SUNSILK
(HUL)
LOREAL VATIKA
(DABUR)
Price
Availability
Aroma
Packaging
Varieties
Value For Money
Brand Ambassadors
Advertising
Satisfaction

Managerial Statics
4
Price
0
5
10
15
20
25
30
1 2 3 4 5 6 7
Sunsilk
L'oreal
Others
Availability
0
5
10
15
20
25
1 2 3 4 5 6 7
Sunsilk
L'oreal
Others

Managerial Statics
5
Aroma
0
2
4
6
8
10
12
14
16
18
20
1 2 3 4 5 6 7
Sunsilk
L'oreal
Others
Quality
0
2
4
6
8
10
12
14
16
1 2 3 4 5 6 7
Sunsilk
L'oreal
Others

Managerial Statics
6
Packaging
0
2
4
6
8
10
12
14
16
18
1 2 3 4 5 6 7
Sunsilk
L'oreal
Others
Varieties
0
2
4
6
8
10
12
14
16
18
20
1 2 3 4 5 6 7
Sunsilk
L'oreal
Others

Managerial Statics
7
Value for money
0
2
4
6
8
10
12
14
16
18
1 2 3 4 5 6 7
Sunsilk
L'oreal
Others
Brand Ambassador
0
2
4
6
8
10
12
14
16
18
20
1 2 3 4 5 6 7
Sunsilk
L'oreal
Others

Managerial Statics
8
Advertising
0
2
4
6
8
10
12
14
16
18
1 2 3 4 5 6 7
Sunsilk
L'oreal
Others
Satisfaction
0
5
10
15
20
25
1 2 3 4 5 6 7
Sunsilk
L'oreal
Others

Managerial Statics
9
Mean:
The arithmetic mean or average of a set of numbers is the expected value. The
mean is calculated by adding up all the values, and then dividing that sum by
the number of values.
Mean (x)=A+(Σ(fd)/n)*i
Median:
The median is the middle value in a set of values. To find the median, order the
numbers from largest to smallest, and then choose the value in the middle.
Median =L+((n/2-PCF)/f)*i
Mode:
The mode of a set is the value or values that occur most frequently. There can
be more than one mode in a set. If there is more than one mode, you simply list
all of the modes; you do not have to average them.
Mode=L+{∆1/(∆1+ ∆2)}*i
0
10
20
30
40
50
60
Sunsilk L'Oreal Other
Mean
Median
Mode

Managerial Statics
10
Standard Deviation:
It is a measure of how much spread or variability is present in the sample. If all
the number in the sample are very close to each other in such cases SD is zero
(0) and if the numbers are well dispersed than SD tends to be large. It is
calculated as:
Standard deviation (σ) = *i
STANDARD DEVIATION
0
2
4
6
8
10
12
14
16
SUNSILK LO'REAL OTHERS
Quartile:
The quartiles of a set of values are the three points that divide the data set into
four equal groups, each representing a fourth of the population being sampled
For group data the formula is:
Q1 can be given as (L+ n/4 – pcf x i )/f
Q3can be given as (L+3 n/4 – pcf x i )/f
Inter-quartile Deviation:
In descriptive statistics, the Inter-quartile Deviation, also called the mid-
spread or middle fifty, is a measure of statistical dispersion, being equal to the
difference between the upper and lower quartiles.
Inter-quartile Deviation = Q3 − Q1
Managerial Statics
11
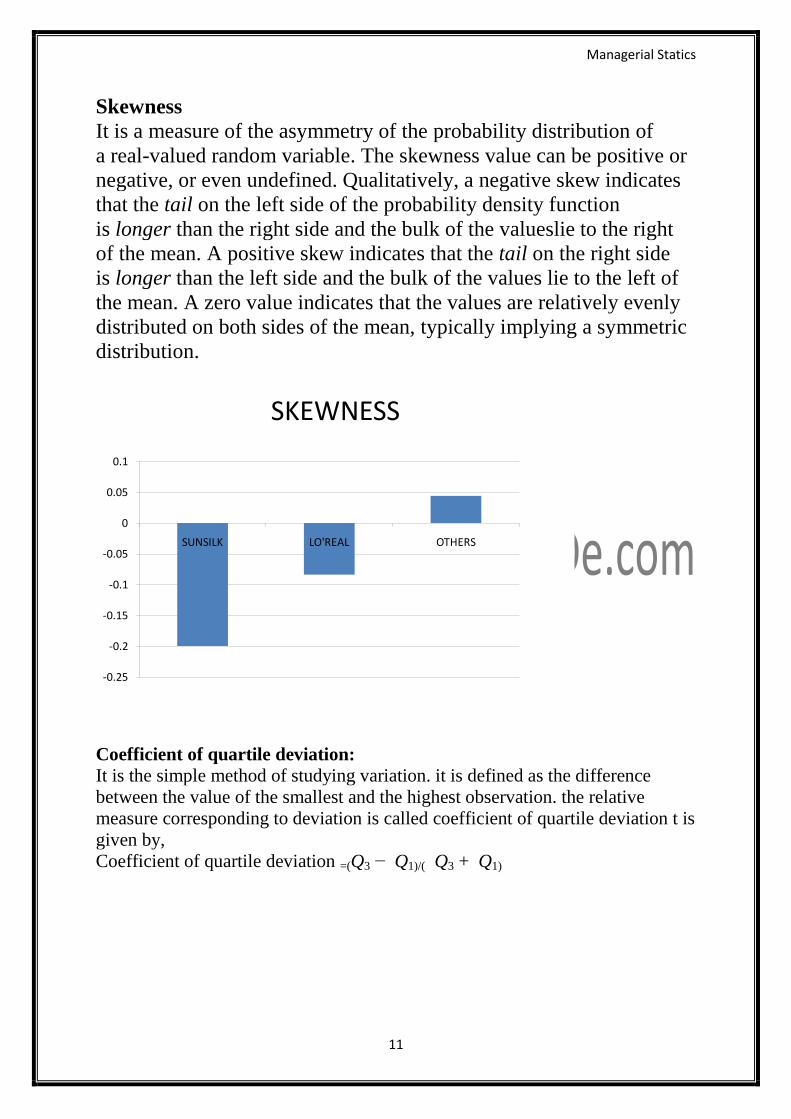
Skewness
It is a measure of the asymmetry of the probability distribution of
a real-valued random variable. The skewness value can be positive or
negative, or even undefined. Qualitatively, a negative skew indicates
that the tail on the left side of the probability density function
is longer than the right side and the bulk of the valueslie to the right
of the mean. A positive skew indicates that the tail on the right side
is longer than the left side and the bulk of the values lie to the left of
the mean. A zero value indicates that the values are relatively evenly
distributed on both sides of the mean, typically implying a symmetric
distribution.
SKEWNESS
-0.25
-0.2
-0.15
-0.1
-0.05
0
0.05
0.1
SUNSILK LO'REAL OTHERS
Coefficient of quartile deviation:
It is the simple method of studying variation. it is defined as the difference
between the value of the smallest and the highest observation. the relative
measure corresponding to deviation is called coefficient of quartile deviation t is
given by,
Coefficient of quartile deviation =(Q3 − Q1)/( Q3 + Q1)

Managerial Statics
12
CO-EFFICEINT OF Q.D
0
0.05
0.1
0.15
0.2
0.25
0.3
SUNSILK LO'REAL OTHERS
AVERAGE DEVIATION
0
2
4
6
8
10
12
14
16
18
20
SUNSILK LO'REAL OTHERS
SUNSILK:
Analysis
Parameters
Mean Median Mode Standard
deviation
Quartile
Deviation
Coefficient
of Quartile
deviation
Skewness Average
Deviation
Price 212 205.56 182.76 22.91 100.53 0.39 1.27 55.52
Availability 24.2 26 27.38 7.05 8.37 0.16 -0.45 5.50

Managerial Statics
13
Aroma 22.3 22.63 22.75 6.4 8.32 0.18 -0.07 4.68
Quality 20.8 20.77 19.29 6.45 9.43 0.22 0.23 5.31
Packaging 22.1 22.31 25.88 5.47 9.92 0.22 -0.69 4.49
Varieties 24.3 26.32 28.09 7.28 10.55 0.22 -0.52 6.04
Value for
Money
19.9 20.88 22.5 5.32 9.81 0.25 -0.499 5.51
Brand
Ambassador
22.9 24.23 26.39 9.12 8.04 0.17 -0.38 4.65
Advertising 22.1 25.66 28.13 6.62 10.12 0.20 -0.91 6.53
Satisfaction 21.4 21.5 21.84 5.73 7.12 0.17 -0.01 4.46
LOREAL:
Analysis
Parameters
Mean Median Mode Standard
Deviation
Quartile
Deviation
Coefficient
of Quartile
Deviation
Skewness Average
Deviation
Price 298 322 331.08 73.63 84.5 0.14 -0.45 62.34
Availability 20.4 22 24.16 7.62 12.18 0.30 -0.49 6.40
Aroma 20.1 19.66 19.09 7.22 3.92 0.89 0.14 5.90
Quality 25.2 26.66 30 7.08 10 0.19 -0.68 5.76
Packaging 23.1 23.52 23.66 8.73 8.3 0.17 -0.06 4.92
Varieties 22.7 23.5 27.5 7.54 12.01 0.26 -0.64 6.22
Value for
Money
21.6 21.76 20.71 5.89 8.46 0.19 0.15 4.72
Brand
Ambassador
23.6 25.33 27.14 7.9 9.29 0.24 -0.44 6.26
Advertising 23.7 25 18.75 7.26 10.85 0.23 0.68 6
Satisfaction 22.6 22.08 13.5 9.6 9.17 0.19 0.95 5.31
OTHERS:
Analysis
Parameters
Mean Median Mode Standard
Deviation
Quartile
Deviation
Coefficient
of Quartile
Deviation
Skewnwess Average
Deviation

Managerial Statics
14
Price 216 209.09 234.21 64.57 95.47 0.22 -0.28 53.72
Availability 18.7 17.73 13.75 7.97 11.85 0.32 0.62 62.4
Aroma 18 18.21 18.33 7.5 9.88 0.27 -0.04 5.8
Quality 18.6 19 17 7.16 9.01 0.24 0.22 5.63
Packaging 17.2 11.25 14.38 8.21 11.57 0.34 0.34 6.54
Varieties 17 14.72 13.09 7.23 9.82 0.30 0.54 5.88
Value for
Money
18 18.13 18.33 6.14 8.75 0.24 -0.05 4.62
Brand
Ambassador
17.7 18.07 20.83 7.28 3.17 0.08 -0.43 5.93
Advertising 18.4 17.5 16.25 6.61 8.6 0.24 0.33 5.19
Satisfaction 16.9 16.25 15 0.6 2.5 0.05 3.17 16.82
THE MARKET SHARES
BRANDS SHARE %
SUNSILK 20
CLINIC 25
L’Oreal 5.5
PANTENE 11
HALO 3.4
OPTIMA 3.6
LAKME 1
ULTRA DOUX 1.2

Managerial Statics
15
FLEX 0.7
OTHERS 28.6
Promoting the shampoo brands poses another challenge for the marketers,
resulting in high adv. spends and media spends. Sunsilk spent 8 crores on
advertising on TV in the first four months of its launch. HLL’s estimated
advertising expenditure for each new shampoo launch was between Rs.4 crores
and 6 crores in the introductory phase. The ad-to - sales ratio of the companies
have shown remarkable jump from 10 % to 20 % compared to the average of 5
% for most product categories.
One of the biggest barriers to shampoo usage is the consumer perception that it
harms the hair. Thus companies are focusing on defending the product against
accusations by promoting the strength, nourishment and beauty of the hair -
‘The 3 - in -1 Capsule ‘for ultimate hair. Companies are still associating it with
modern life styles to find acceptance in semi - urban and rural non-users to
build and enlarge shampoo usage levels. Thus companies will have to mould
new consumer usage patterns to its own benefit, to have a competitive
advantage and stay out there in the longer run with a respectable market share.
A market segment consists of a large identifiable group within a market. A
company that practices segment marketing recognizes that buyers differ in their
wants, purchasing power, geographical locations, buying attitudes, and buying
habits. Because buyers have unique needs and wants, each buyer is potentially a
separate market. Ideally, then, a seller might design a separate marketing
program for each buyer, though no company is willing to customize its offer \
communication bundle to each individual customer. The company instead tries
to isolate some broad segments that make up a market.
Two broad groups of variables are used to segment consumer markets. Some
researchers try to form segments by looking at consumer responses to benefits
sought, use occasions or brands. Other researchers try to form segments by
Managerial Statics
16
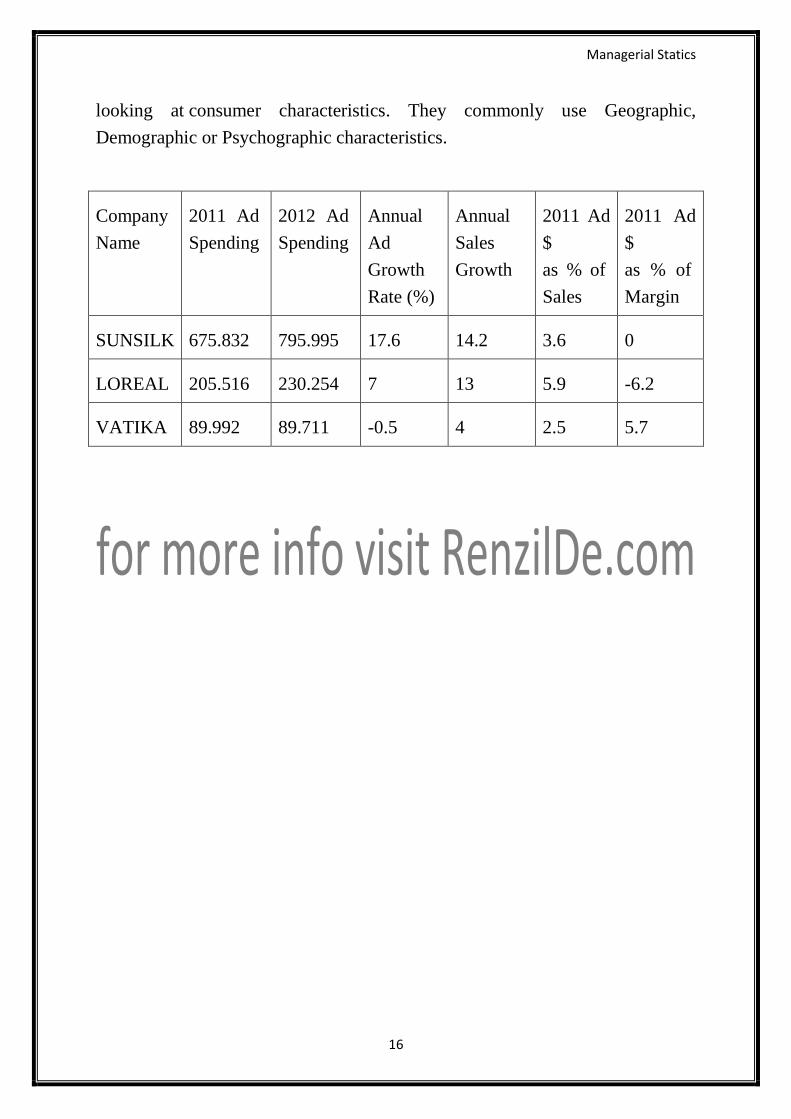
looking at consumer characteristics. They commonly use Geographic,
Demographic or Psychographic characteristics.
Company
Name
2011 Ad
Spending
2012 Ad
Spending
Annual
Ad
Growth
Rate (%)
Annual
Sales
Growth
2011 Ad
$
as % of
Sales
2011 Ad
$
as % of
Margin
SUNSILK 675.832 795.995 17.6 14.2 3.6 0
LOREAL 205.516 230.254 7 13 5.9 -6.2
VATIKA 89.992 89.711 -0.5 4 2.5 5.7