mckinsey center for government the business … business...mckinsey center for government the...
TRANSCRIPT
McKinsey Center for Government
The Business Case for Medical Device Quality

1
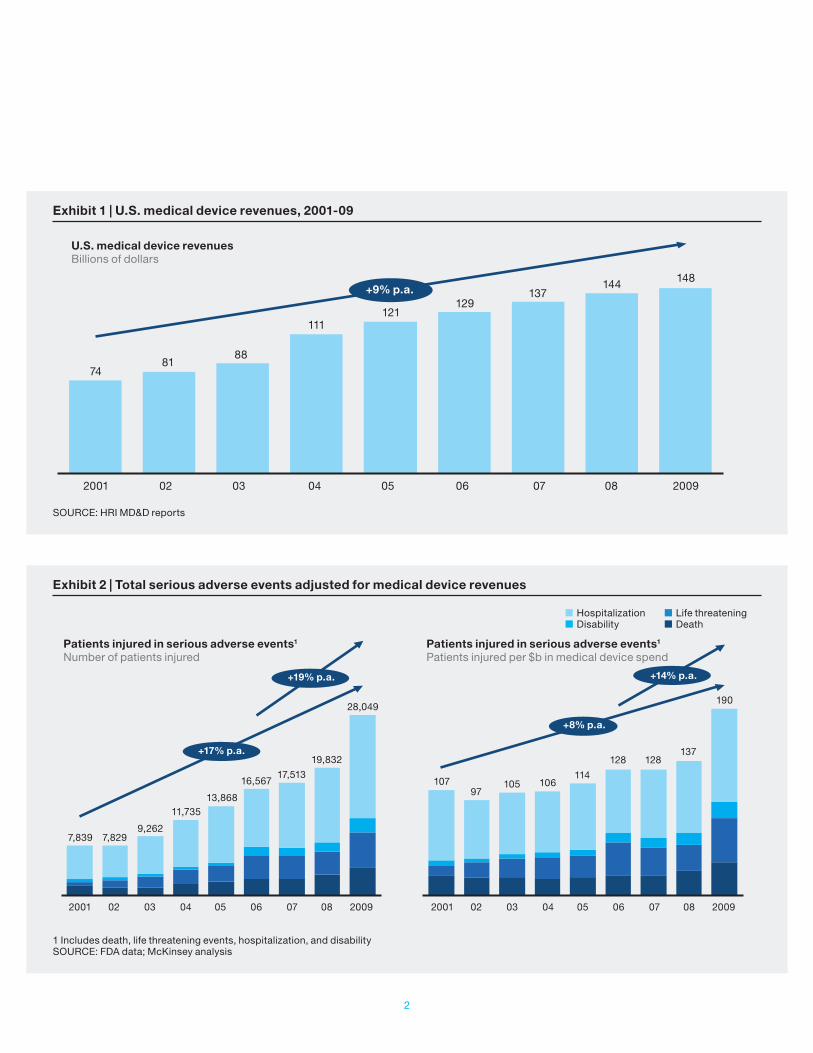
Sales of medical devices have grown at an annu-al rate of 9 percent for the past decade (Exhibit 1). The number and complexity of the devices on the market have risen significantly, too. This rapid evolution has delivered life-enhancing innovations, including combination products, automation, and wireless technology. Meanwhile, the industry has experienced increasing pres-sures, including cost competitiveness, globaliza-tion, and supply chain tiering; a company today may deal with hundreds or even thousands of suppliers and sub- suppliers, each of which can impact product quality and performance.
The industry’s transformational growth and innovation have placed new burdens on quality systems. Evidence of this includes an increase in serious patient adverse events reported to the U.S. Food and Drug Administration (FDA)—those resulting in hospitalization, disability, or death—which is about twice as fast as the increase in the overall medical device market (Exhibit 2).
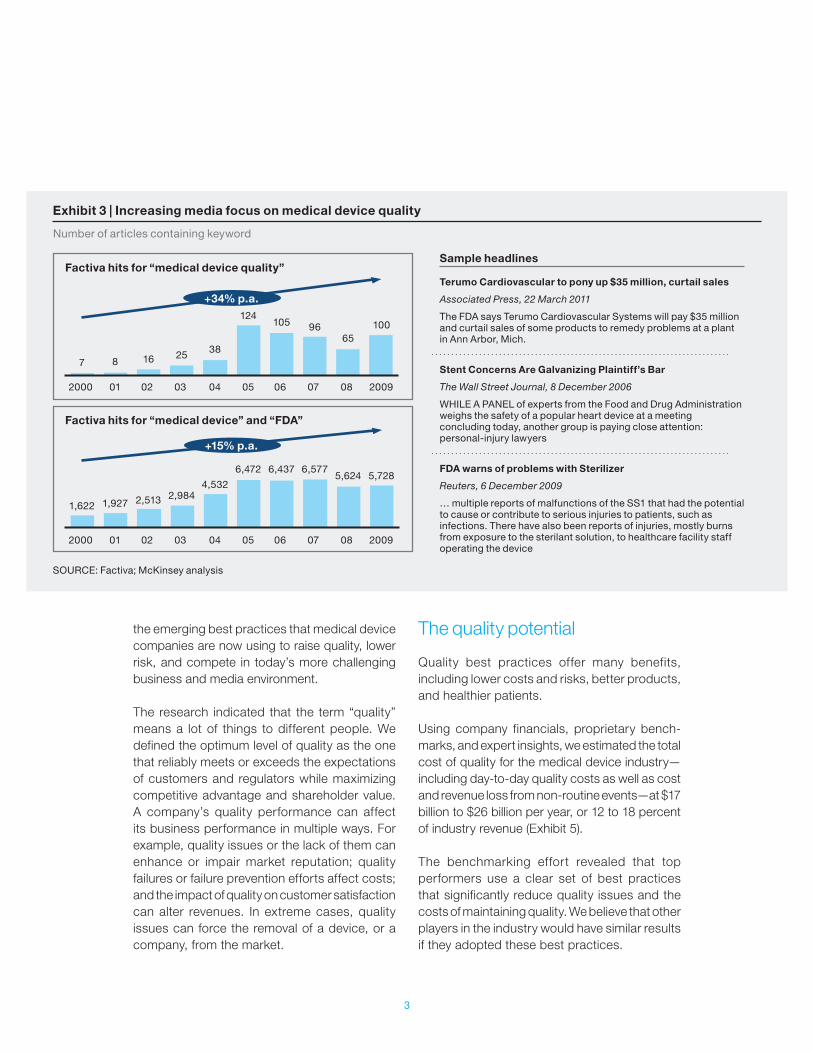
Quality issues rightly concern every stakeholder in the medical device value chain, from manufacturers and regulators to payors, doctors, and patients. Media attention has increased, and investors have severely punished some companies with quality issues (Exhibits 3 and 4).
In the past decade, an average of one company per year has seen a 10 percent drop in share price after a single, major quality event (e.g., a major product recall). Indeed, the risk that a major quality event will cause serious, long-term value destruction is high and rising.
The medical device industry is approaching a tip-ping point where the increasing likelihood of a quality event, the rising costs of such events, and the public nature of quality performance will force companies to focus on quality and reliability throughout product design, manufacturing, and marketing.
The good news is that companies in a wide range of industries have developed approaches that help them build quality into processes at every step of the value chain—from design and manufacturing to sales and service—which will lower costs over the long term. These approaches are now making their way into the medical device sector. Working with a major regulator, we recently carried out research1 to identify and measure the impact of
1 Including detailed analysis of financial and FDA data, company case examples, market research across several major medical device categories, and a series of interviews with medical device company executives, regulators, and customers.
The Business Case for Medical Device Quality
Ted Fuhr, Katy George, Janice Pai
The medical device industry is approaching a tipping point where the increasing likelihood of a quality event, the rising costs of such events, and the public nature of quality performance will force companies to focus on quality and reliability throughout product design, manufacturing, and marketing.
2
Exhibit 1 | U.S. medical device revenues, 2001-09
SOURCE: HRI MD&D reports
U.S. medical device revenuesBillions of dollars
74
2001 02 03 04 05 06 07 08 2009
8188
111121
129137
144 148+9% p.a.
Exhibit 2 | Total serious adverse events adjusted for medical device revenues
1 Includes death, life threatening events, hospitalization, and disabilitySOURCE: FDA data; McKinsey analysis
Patients injured in serious adverse events1
Number of patients injuredPatients injured in serious adverse events1
Patients injured per $b in medical device spend
Hospitalization Disability
Life threatening Death
+14% p.a.
+8% p.a.
+19% p.a.
+17% p.a.
2001 02 03 04 05 06 07 08 2009 2001 02 03 04 05 06 07 08 2009
7,839
107
7,829
97
9,262
105
11,735
106
13,868
11416,567
128
17,513
12819,832137
28,049190
3
the emerging best practices that medical device companies are now using to raise quality, lower risk, and compete in today’s more challenging business and media environment.
The research indicated that the term “quality” means a lot of things to different people. We defined the optimum level of quality as the one that reliably meets or exceeds the expectations of customers and regulators while maximizing competitive advantage and shareholder value. A company’s quality performance can affect its business performance in multiple ways. For example, quality issues or the lack of them can enhance or impair market reputation; quality failures or failure prevention efforts affect costs; and the impact of quality on customer satisfaction can alter revenues. In extreme cases, quality issues can force the removal of a device, or a company, from the market.
The quality potential
Quality best practices offer many benefits, including lower costs and risks, better products, and healthier patients.
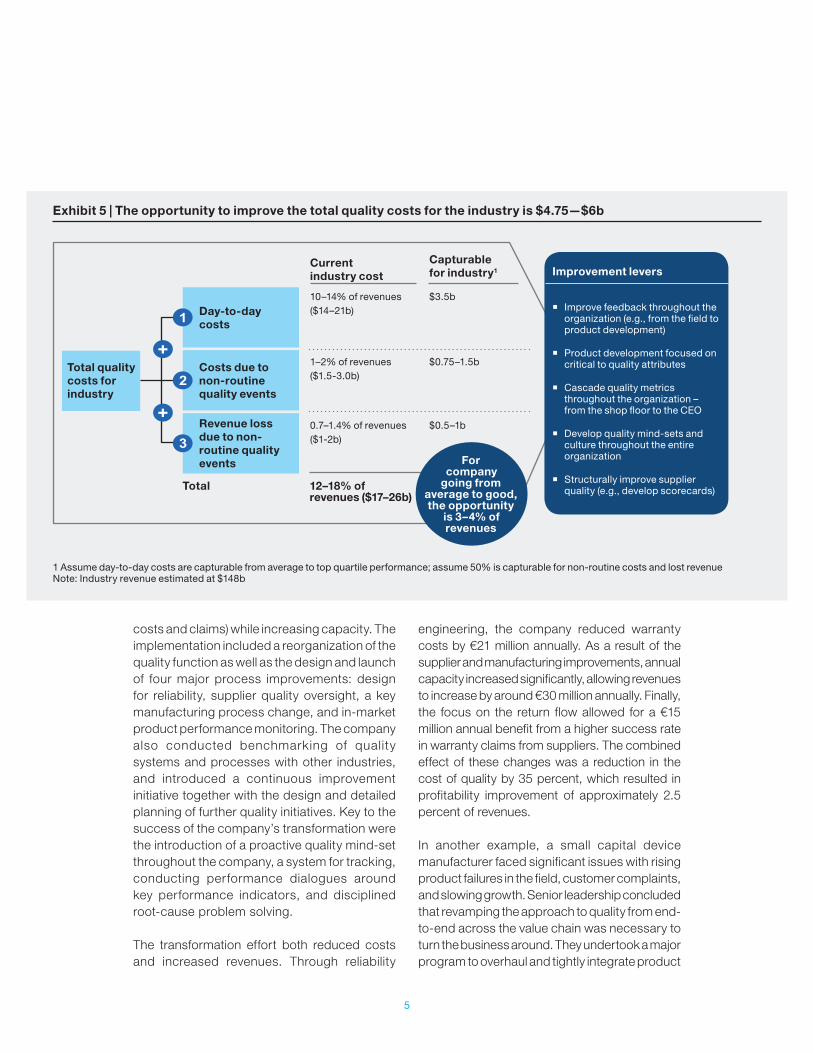
Using company financials, proprietary bench-marks, and expert insights, we estimated the total cost of quality for the medical device industry—including day-to-day quality costs as well as cost and revenue loss from non-routine events—at $17 billion to $26 billion per year, or 12 to 18 percent of industry revenue (Exhibit 5).
The benchmarking effort revealed that top performers use a clear set of best practices that significantly reduce quality issues and the costs of maintaining quality. We believe that other players in the industry would have similar results if they adopted these best practices.
Exhibit 3 | Increasing media focus on medical device quality
SOURCE: Factiva; McKinsey analysis
Sample headlines
Terumo Cardiovascular to pony up $35 million, curtail sales
Associated Press, 22 March 2011
The FDA says Terumo Cardiovascular Systems will pay $35 million and curtail sales of some products to remedy problems at a plant in Ann Arbor, Mich.
Stent Concerns Are Galvanizing Plaintiff’s Bar
The Wall Street Journal, 8 December 2006
WHILE A PANEL of experts from the Food and Drug Administration weighs the safety of a popular heart device at a meeting concluding today, another group is paying close attention: personal-injury lawyers
FDA warns of problems with Sterilizer
Reuters, 6 December 2009
… multiple reports of malfunctions of the SS1 that had the potential to cause or contribute to serious injuries to patients, such as infections. There have also been reports of injuries, mostly burns from exposure to the sterilant solution, to healthcare facility staff operating the device
Factiva hits for “medical device quality”
Number of articles containing keyword
+34% p.a.
2000 01 02 03 04 05 06 07 08 2009
2000 01 02 03 04 05 06 07 08 2009
7 8 16 25 38
124105 96
65100
Factiva hits for “medical device” and “FDA”
+15% p.a.
1,622 1,927 2,513 2,9844,532
6,472 6,437 6,5775,624 5,728
4
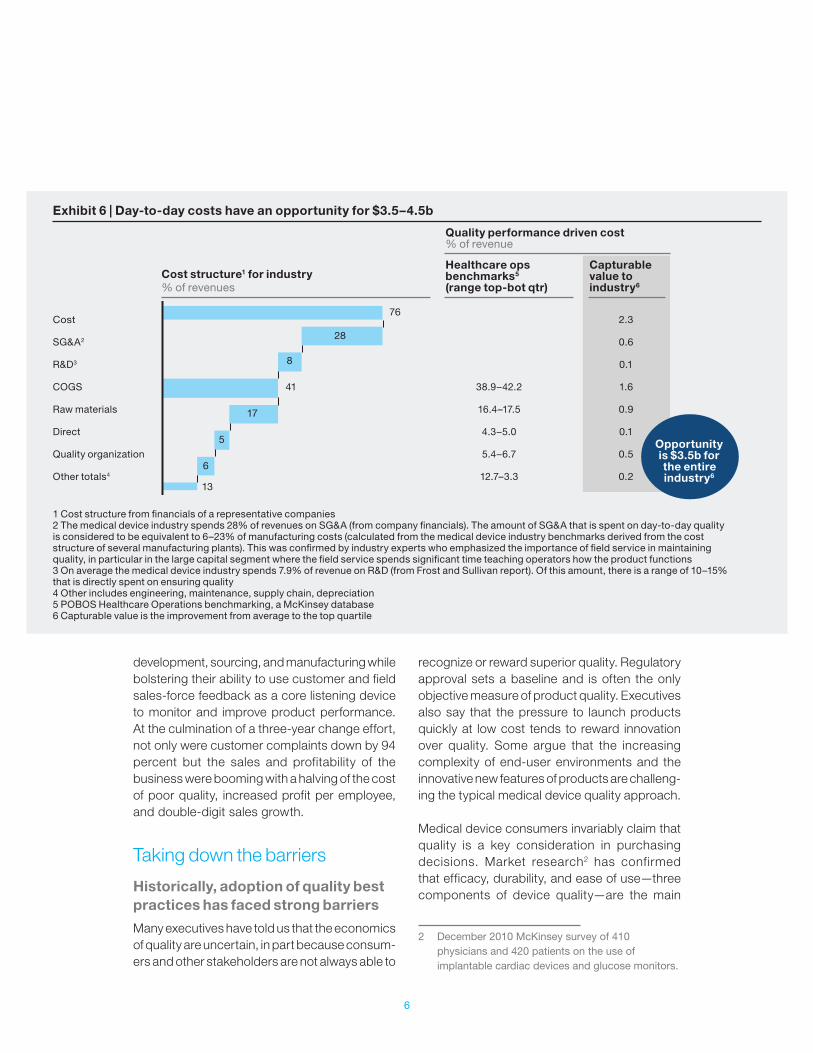
For an average quality performing company, we estimate that moving to top-quartile performance would increase profits by 3 to 4 percent of revenues. This would translate to a roughly 14 percent growth in EBITA (earnings before interest, taxes, and amortization) for an average company, or from 25 to 28.5 percent. Since the industry spends 10 to 14 percent of its revenues on maintaining day-to-day quality, or $14 to $21 billion, moving the entire industry to top-quartile performance would represent an opportunity worth about $3.5 billion (Exhibit 6).
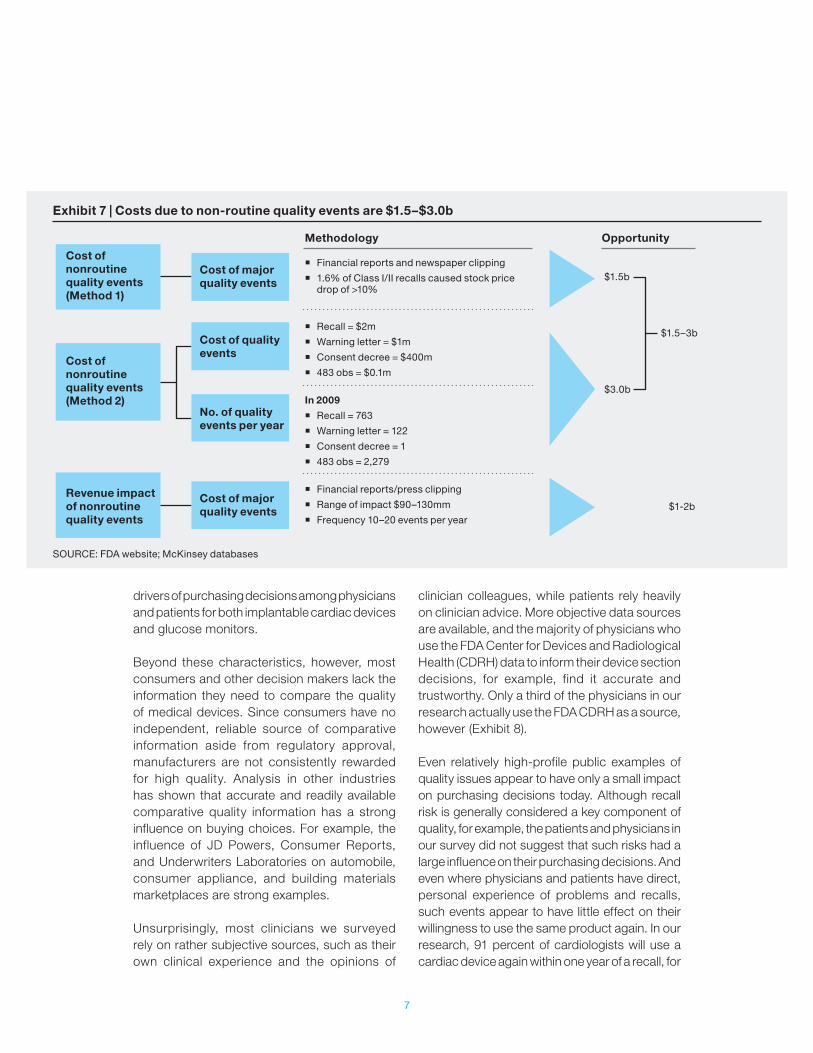
Non-routine quality events—such as major observations, recalls, warning letters, and consent decrees, along with associated warranties and lawsuits—cost the industry between $2.5 billion and $5 billion per year on average. This includes $1.5 billion to $3 billion per year on non-routine costs, plus $1 billion to $2 billion in lost sales of new and existing products (Exhibit 7). We
estimate that adopting best practices would cut these costs in half.
Improvements of that order generally require that a company transform its approach to quality. Senior management must guide product development along well-defined critical-to-quality parameters, manage supplier quality, build feedback loops across the quality management system, adopt holistic metrics that drive the right behaviors, and instill a quality mind-set across the organization.
For example, a European supplier of high-tech equipment faced several major quality challenges, including quality costs above competitor levels, a focus on problem resolution after customer delivery rather than problem prevention in development and production, and low-quality performance of suppliers. The management went forward with a transformation aimed to reduce quality-related costs (e.g., warranty
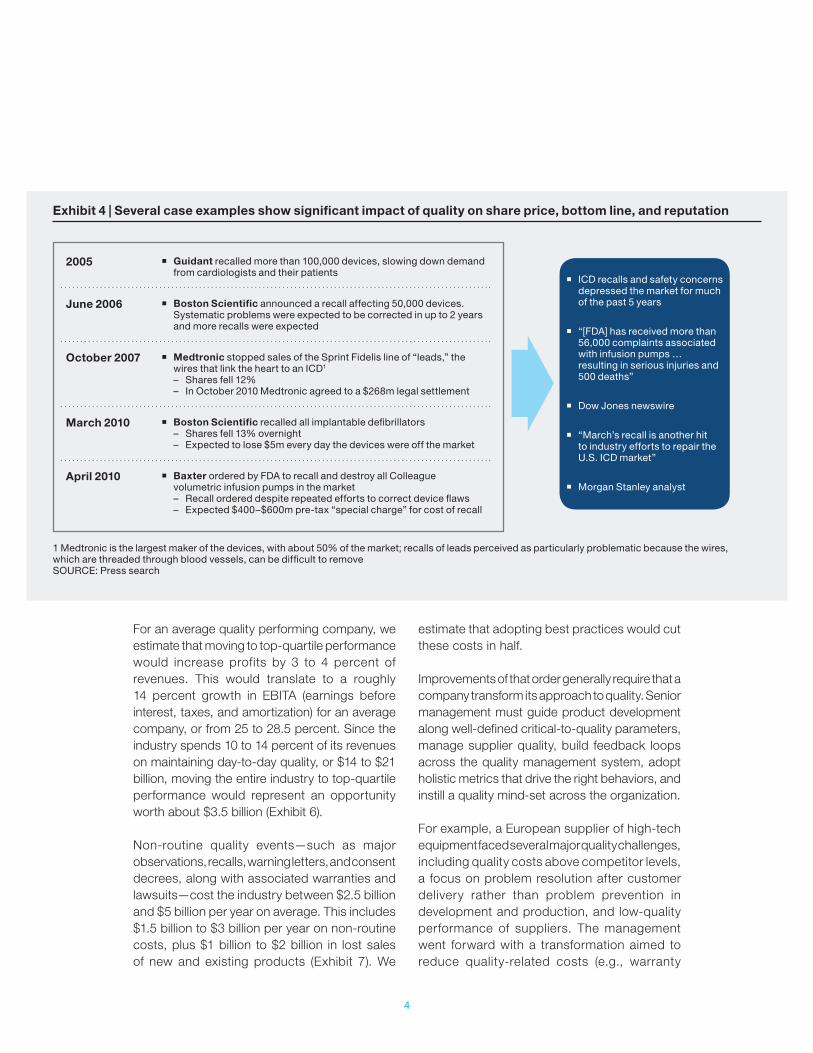
Exhibit 4 | Several case examples show significant impact of quality on share price, bottom line, and reputation
1 Medtronic is the largest maker of the devices, with about 50% of the market; recalls of leads perceived as particularly problematic because the wires, which are threaded through blood vessels, can be difficult to removeSOURCE: Press search
2005 � Guidant recalled more than 100,000 devices, slowing down demand from cardiologists and their patients
June 2006 � Boston Scientific announced a recall affecting 50,000 devices. Systematic problems were expected to be corrected in up to 2 years and more recalls were expected
October 2007 � Medtronic stopped sales of the Sprint Fidelis line of “leads,” the wires that link the heart to an ICD1
– Shares fell 12% – In October 2010 Medtronic agreed to a $268m legal settlement
March 2010 � Boston Scientific recalled all implantable defibrillators – Shares fell 13% overnight – Expected to lose $5m every day the devices were off the market
April 2010 � Baxter ordered by FDA to recall and destroy all Colleague volumetric infusion pumps in the market – Recall ordered despite repeated efforts to correct device flaws – Expected $400–$600m pre-tax “special charge” for cost of recall
� ICD recalls and safety concerns depressed the market for much of the past 5 years
� “[FDA] has received more than 56,000 complaints associated with infusion pumps … resulting in serious injuries and 500 deaths”
� Dow Jones newswire
� “March’s recall is another hit to industry efforts to repair the U.S. ICD market”
� Morgan Stanley analyst
5
costs and claims) while increasing capacity. The implementation included a reorganization of the quality function as well as the design and launch of four major process improvements: design for reliability, supplier quality oversight, a key manufacturing process change, and in-market product performance monitoring. The company also conducted benchmarking of quality systems and processes with other industries, and introduced a continuous improvement initiative together with the design and detailed planning of further quality initiatives. Key to the success of the company’s transformation were the introduction of a proactive quality mind-set throughout the company, a system for tracking, conducting performance dialogues around key performance indicators, and disciplined root-cause problem solving.
The transformation effort both reduced costs and increased revenues. Through reliability
engineering, the company reduced warranty costs by €21 million annually. As a result of the supplier and manufacturing improvements, annual capacity increased significantly, allowing revenues to increase by around €30 million annually. Finally, the focus on the return flow allowed for a €15 million annual benefit from a higher success rate in warranty claims from suppliers. The combined effect of these changes was a reduction in the cost of quality by 35 percent, which resulted in profitability improvement of approximately 2.5 percent of revenues.
In another example, a small capital device manufacturer faced significant issues with rising product failures in the field, customer complaints, and slowing growth. Senior leadership concluded that revamping the approach to quality from end-to-end across the value chain was necessary to turn the business around. They undertook a major program to overhaul and tightly integrate product
Exhibit 5 | The opportunity to improve the total quality costs for the industry is $4.75—$6b
1 Assume day-to-day costs are capturable from average to top quartile performance; assume 50% is capturable for non-routine costs and lost revenueNote: Industry revenue estimated at $148b
For company
going from average to good, the opportunity
is 3–4% of revenues
Total quality costs for industry
Day-to-day costs
Costs due to non-routine quality events
Revenue loss due to non-routine quality events
Total 12–18% of revenues ($17–26b)
Current industry cost
Capturable for industry1
10–14% of revenues($14–21b)
$3.5b
1–2% of revenues($1.5-3.0b)
$0.75–1.5b
0.7–1.4% of revenues($1-2b)
$0.5–1b
Improvement levers
� Improve feedback throughout the organization (e.g., from the field to product development)
� Product development focused on critical to quality attributes
� Cascade quality metrics throughout the organization – from the shop floor to the CEO
� Develop quality mind-sets and culture throughout the entire organization
� Structurally improve supplier quality (e.g., develop scorecards)
6
development, sourcing, and manufacturing while bolstering their ability to use customer and field sales-force feedback as a core listening device to monitor and improve product performance. At the culmination of a three-year change effort, not only were customer complaints down by 94 percent but the sales and profitability of the business were booming with a halving of the cost of poor quality, increased profit per employee, and double-digit sales growth.
Taking down the barriers
Historically, adoption of quality best practices has faced strong barriers
Many executives have told us that the economics of quality are uncertain, in part because consum-ers and other stakeholders are not always able to
recognize or reward superior quality. Regulatory approval sets a baseline and is often the only objective measure of product quality. Executives also say that the pressure to launch products quickly at low cost tends to reward innovation over quality. Some argue that the increasing complexity of end-user environments and the innovative new features of products are challeng-ing the typical medical device quality approach.
Medical device consumers invariably claim that quality is a key consideration in purchasing decisions. Market research2 has confirmed that efficacy, durability, and ease of use—three components of device quality—are the main
2 December 2010 McKinsey survey of 410 physicians and 420 patients on the use of implantable cardiac devices and glucose monitors.
Exhibit 6 | Day-to-day costs have an opportunity for $3.5–4.5b
1 Cost structure from financials of a representative companies2 The medical device industry spends 28% of revenues on SG&A (from company financials). The amount of SG&A that is spent on day-to-day quality is considered to be equivalent to 6–23% of manufacturing costs (calculated from the medical device industry benchmarks derived from the cost structure of several manufacturing plants). This was confirmed by industry experts who emphasized the importance of field service in maintaining quality, in particular in the large capital segment where the field service spends significant time teaching operators how the product functions 3 On average the medical device industry spends 7.9% of revenue on R&D (from Frost and Sullivan report). Of this amount, there is a range of 10–15% that is directly spent on ensuring quality4 Other includes engineering, maintenance, supply chain, depreciation5 POBOS Healthcare Operations benchmarking, a McKinsey database6 Capturable value is the improvement from average to the top quartile
Opportunity is $3.5b for the entire industry6
Cost
SG&A2
R&D3
COGS
Raw materials
Direct
Quality organization
Other totals4
2.3
0.6
0.1
1.6
0.9
0.1
0.5
0.2
38.9–42.2
16.4–17.5
4.3–5.0
5.4–6.7
12.7–3.3
76
28
8
41
17
5
6
13
Cost structure1 for industry% of revenues
Healthcare ops benchmarks5 (range top-bot qtr)
Capturable value to industry6
Quality performance driven cost% of revenue
7
drivers of purchasing decisions among physicians and patients for both implantable cardiac devices and glucose monitors.
Beyond these characteristics, however, most consumers and other decision makers lack the information they need to compare the quality of medical devices. Since consumers have no independent, reliable source of comparative information aside from regulatory approval, manufacturers are not consistently rewarded for high quality. Analysis in other industries has shown that accurate and readily available comparative quality information has a strong influence on buying choices. For example, the influence of JD Powers, Consumer Reports, and Underwriters Laboratories on automobile, consumer appliance, and building materials marketplaces are strong examples.
Unsurprisingly, most clinicians we surveyed rely on rather subjective sources, such as their own clinical experience and the opinions of
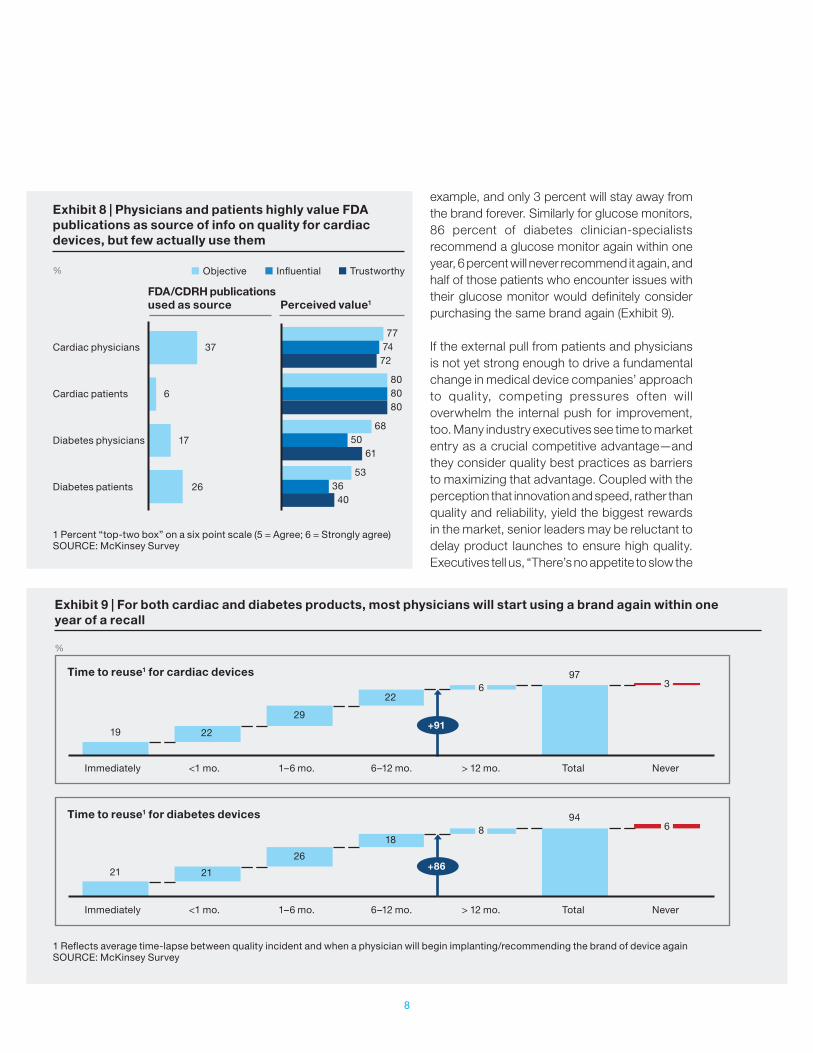
clinician colleagues, while patients rely heavily on clinician advice. More objective data sources are available, and the majority of physicians who use the FDA Center for Devices and Radiological Health (CDRH) data to inform their device section decisions, for example, find it accurate and trustworthy. Only a third of the physicians in our research actually use the FDA CDRH as a source, however (Exhibit 8).
Even relatively high-profile public examples of quality issues appear to have only a small impact on purchasing decisions today. Although recall risk is generally considered a key component of quality, for example, the patients and physicians in our survey did not suggest that such risks had a large influence on their purchasing decisions. And even where physicians and patients have direct, personal experience of problems and recalls, such events appear to have little effect on their willingness to use the same product again. In our research, 91 percent of cardiologists will use a cardiac device again within one year of a recall, for
Exhibit 7 | Costs due to non-routine quality events are $1.5–$3.0b
SOURCE: FDA website; McKinsey databases
Cost of nonroutine quality events (Method 1)
Cost of major quality events
Methodology
� Financial reports and newspaper clipping
� 1.6% of Class I/II recalls caused stock price drop of >10%
� Recall = $2m
� Warning letter = $1m
� Consent decree = $400m
� 483 obs = $0.1m
� Financial reports/press clipping
� Range of impact $90–130mm
� Frequency 10–20 events per year
In 2009
� Recall = 763
� Warning letter = 122
� Consent decree = 1
� 483 obs = 2,279
Opportunity
$1.5b
$3.0b
$1.5–3b
$1-2b
Cost of quality events
No. of quality events per year
Cost of major quality events
Cost of nonroutine quality events (Method 2)
Revenue impact of nonroutine quality events
8
example, and only 3 percent will stay away from the brand forever. Similarly for glucose monitors, 86 percent of diabetes clinician-specialists recommend a glucose monitor again within one year, 6 percent will never recommend it again, and half of those patients who encounter issues with their glucose monitor would definitely consider purchasing the same brand again (Exhibit 9).
If the external pull from patients and physicians is not yet strong enough to drive a fundamental change in medical device companies’ approach to quality, competing pressures often will overwhelm the internal push for improvement, too. Many industry executives see time to market entry as a crucial competitive advantage—and they consider quality best practices as barriers to maximizing that advantage. Coupled with the perception that innovation and speed, rather than quality and reliability, yield the biggest rewards in the market, senior leaders may be reluctant to delay product launches to ensure high quality. Executives tell us, “There’s no appetite to slow the
Exhibit 9 | For both cardiac and diabetes products, most physicians will start using a brand again within one year of a recall
1 Reflects average time-lapse between quality incident and when a physician will begin implanting/recommending the brand of device againSOURCE: McKinsey Survey
Exhibit 8 | Physicians and patients highly value FDA publications as source of info on quality for cardiac devices, but few actually use them
1 Percent “top-two box” on a six point scale (5 = Agree; 6 = Strongly agree)SOURCE: McKinsey Survey
Cardiac physicians
Cardiac patients
Diabetes physicians
Diabetes patients
%
37
6
17
26
77 74 72
80 80 80
68 50 61
53 36 40
FDA/CDRH publications used as source Perceived value1
Objective Influential Trustworthy
%
Immediately <1 mo. 1–6 mo. 6–12 mo. > 12 mo. Total Never
Time to reuse1 for cardiac devices
Time to reuse1 for diabetes devices
Immediately <1 mo. 1–6 mo. 6–12 mo. > 12 mo. Total Never
+91
+86
19
21
97
94
22
21
22
18
29
26
6
8
3
6
9
process to embed quality,” and “R&D is pushed to focus more on timelines than quality.” The pressure is even greater for smaller companies, where senior managers may believe they need to release new products early to compete.
Consumer and payor cost pressures increase the challenge, since many executives mistakenly believe that improving quality necessarily adds to cost. In fact, as shown above, enhanced product quality increases profits. Moreover, searching for lower cost suppliers, or pressuring existing sup-pliers to lower costs, can hurt product quality. For instance, suppliers’ moves to cheaper raw materials for implantable devices has led to shorter product lifecycle and more frequent replacements.
The importance of quality is set to rise
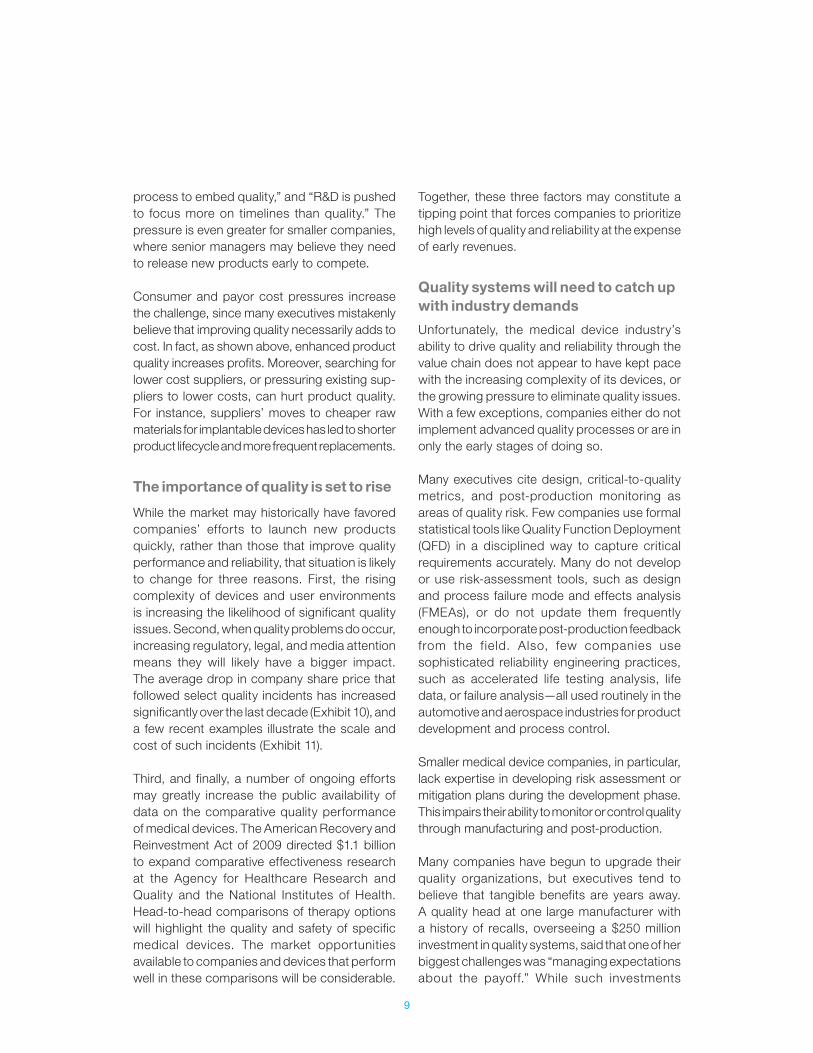
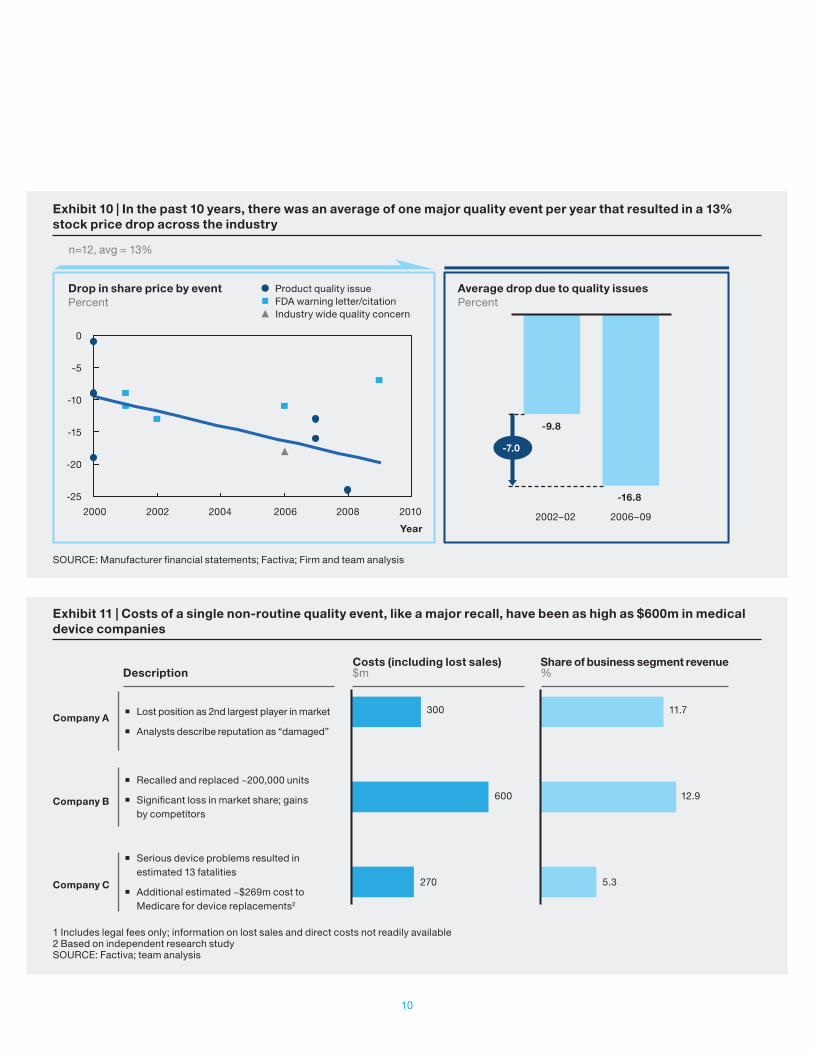
While the market may historically have favored companies’ efforts to launch new products quickly, rather than those that improve quality performance and reliability, that situation is likely to change for three reasons. First, the rising complexity of devices and user environments is increasing the likelihood of significant quality issues. Second, when quality problems do occur, increasing regulatory, legal, and media attention means they will likely have a bigger impact. The average drop in company share price that followed select quality incidents has increased significantly over the last decade (Exhibit 10), and a few recent examples illustrate the scale and cost of such incidents (Exhibit 11).
Third, and finally, a number of ongoing efforts may greatly increase the public availability of data on the comparative quality performance of medical devices. The American Recovery and Reinvestment Act of 2009 directed $1.1 billion to expand comparative effectiveness research at the Agency for Healthcare Research and Quality and the National Institutes of Health. Head-to-head comparisons of therapy options will highlight the quality and safety of specific medical devices. The market opportunities available to companies and devices that perform well in these comparisons will be considerable.
Together, these three factors may constitute a tipping point that forces companies to prioritize high levels of quality and reliability at the expense of early revenues.
Quality systems will need to catch up with industry demands
Unfortunately, the medical device industry’s ability to drive quality and reliability through the value chain does not appear to have kept pace with the increasing complexity of its devices, or the growing pressure to eliminate quality issues. With a few exceptions, companies either do not implement advanced quality processes or are in only the early stages of doing so.
Many executives cite design, critical-to-quality metrics, and post-production monitoring as areas of quality risk. Few companies use formal statistical tools like Quality Function Deployment (QFD) in a disciplined way to capture critical requirements accurately. Many do not develop or use risk-assessment tools, such as design and process failure mode and effects analysis (FMEAs), or do not update them frequently enough to incorporate post-production feedback from the f ield. Also, few companies use sophisticated reliability engineering practices, such as accelerated life testing analysis, life data, or failure analysis—all used routinely in the automotive and aerospace industries for product development and process control.
Smaller medical device companies, in particular, lack expertise in developing risk assessment or mitigation plans during the development phase. This impairs their ability to monitor or control quality through manufacturing and post-production.
Many companies have begun to upgrade their quality organizations, but executives tend to believe that tangible benefits are years away. A quality head at one large manufacturer with a history of recalls, overseeing a $250 million investment in quality systems, said that one of her biggest challenges was “managing expectations about the payoff.” While such investments
10
Exhibit 10 | In the past 10 years, there was an average of one major quality event per year that resulted in a 13% stock price drop across the industry
SOURCE: Manufacturer financial statements; Factiva; Firm and team analysis
Exhibit 11 | Costs of a single non-routine quality event, like a major recall, have been as high as $600m in medical device companies
1 Includes legal fees only; information on lost sales and direct costs not readily available 2 Based on independent research study SOURCE: Factiva; team analysis
� Lost position as 2nd largest player in market
� Analysts describe reputation as “damaged”
� Recalled and replaced ~200,000 units
� Significant loss in market share; gains by competitors
� Serious device problems resulted in estimated 13 fatalities
� Additional estimated ~$269m cost to Medicare for device replacements2
Share of business segment revenue%
Costs (including lost sales)$mDescription
Company A
Company B
Company C
300
600
270
11.7
12.9
5.3
2000 2002 2004 2006 2008 2010
Drop in share price by eventPercent
Average drop due to quality issuesPercent
Year2002–02 2006–09
-9.8
-16.8
Product quality issue
Industry wide quality concernFDA warning letter/citation
0
-5
-10
-15
-20
-25
-7.0
n=12, avg = 13%
11
can take time to result in increased revenues, experience from other industries has shown that early adopters of quality best practices hold an advantage over competitors, while late adopters may risk the demise of the company because the competition is already too far ahead.
Some companies are innovating with processes to drive quality, however. One large medical device manufacturer, for example, has been evaluating advanced “process signature” methods in its plants to catch process non-conformance early. Another now uses “spiral modeling” techniques to develop error-free software quickly for its devices. Early signs are that adoption of these and other leading practices are yielding strong results in improving device quality.
Implementing quality best practices
A quality best practices program begins with an integrated set of techniques for designing and manufacturing high-quality products based on the most critical customer needs and compliance requirements at low cost, along with methods for optimizing new product designs for commercial manufacture.
While all medical device companies aim to produce high-quality products. implementing quality best practices does present challenges. Many of the concepts, frameworks, and tools are new to medical device practitioners. As in a lean operations transformation, adopting quality best practices means applying a cohesive set of technical tools, management infrastructure— including new steering mechanisms and cascading metrics—as well as high-performance mind-sets. behaviors, and capabilities, which can require a new training infrastructure and knowledge base.
But a handful of medical device companies have already demonstrated that implementation does not require new regulations or guidance—just the know-how, dedication, and discipline to implement it.
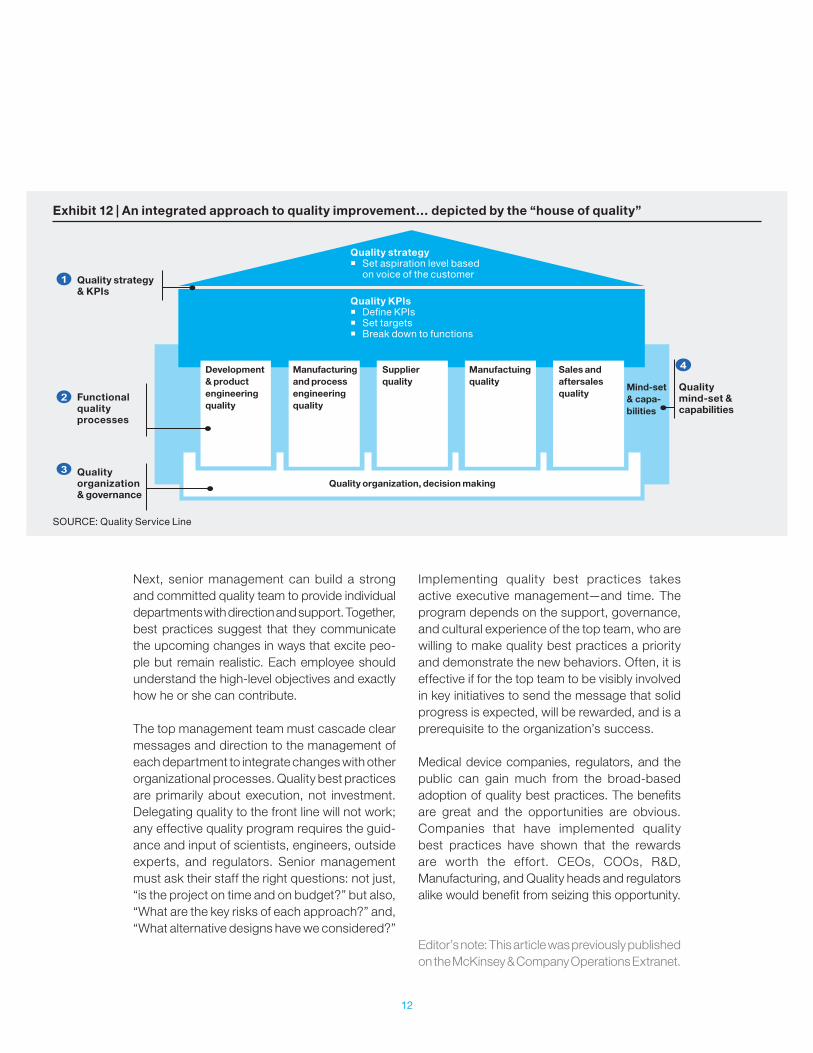
In our experience, medical device quality best practices include time-tested methods from other industries, tailored to medical devices. A comprehensive approach would encompass a set of best practices and methodologies to diagnose, design, and implement a world-class quality system. The approach would also focus on addressing technical and cultural challenges: clearly defining a quality strategy in tune with the voice of the customer, aligning quality metrics, developing robust functional quality processes across the entire product life cycle, building a high-performing quality organization, and developing positive and quality-oriented mind-sets and capabilities across the organization (Exhibit 12).
As with any major change program, a transforma-tional approach is required to gain the full benefit of implementing these tools. This includes visible senior executive team sponsorship and tight cross-collaboration between Quality and other functions (e.g., Manufacturing, Sales, and R&D) in setting mutual aspirations, implementation road-maps, and, in many cases, joint working teams.
Top team supportQuality best practices require investments in change management to ensure that the new methods endure. They include a strong commitment from the executive team, including the CEO; an overarching governance structure; and rigorous project management.
As a vital component of profitability, quality requires cross-functional alignment and performance objectives. The top team must first create a compelling business case that lays out the company’s overall objectives and each department’s role in achieving them. Multiple departments need to work in concert, including Manufacturing, Quality, Regulatory, and R&D. Making the right trade-offs between short- and long-term objectives—and among sometimes-conflicting departmental needs—requires firm and decisive leadership.
12
Next, senior management can build a strong and committed quality team to provide individual departments with direction and support. Together, best practices suggest that they communicate the upcoming changes in ways that excite peo-ple but remain realistic. Each employee should understand the high-level objectives and exactly how he or she can contribute.
The top management team must cascade clear messages and direction to the management of each department to integrate changes with other organizational processes. Quality best practices are primarily about execution, not investment. Delegating quality to the front line will not work; any effective quality program requires the guid-ance and input of scientists, engineers, outside experts, and regulators. Senior management must ask their staff the right questions: not just, “is the project on time and on budget?” but also, “What are the key risks of each approach?” and, “What alternative designs have we considered?”
Implementing quality best practices takes active executive management—and time. The program depends on the support, governance, and cultural experience of the top team, who are willing to make quality best practices a priority and demonstrate the new behaviors. Often, it is effective if for the top team to be visibly involved in key initiatives to send the message that solid progress is expected, will be rewarded, and is a prerequisite to the organization’s success.
Medical device companies, regulators, and the public can gain much from the broad-based adoption of quality best practices. The benefits are great and the opportunities are obvious. Companies that have implemented quality best practices have shown that the rewards are worth the effort. CEOs, COOs, R&D, Manufacturing, and Quality heads and regulators alike would benefit from seizing this opportunity. Editor’s note: This article was previously published on the McKinsey & Company Operations Extranet.
Exhibit 12 | An integrated approach to quality improvement… depicted by the “house of quality”
SOURCE: Quality Service Line
Quality strategy � Set aspiration level based
on voice of the customerQuality strategy & KPIs
Functional quality processes
Quality mind-set & capabilities
Mind-set & capa-bilities
Sales and aftersales quality
Manufactuing quality
Quality organization, decision making
Supplier quality
Manufacturing and process engineering quality
Development & product engineering quality
Quality organization & governance
Quality KPIs � Define KPIs � Set targets � Break down to functions

McKinsey Center for Government October 2013 Layout by US Design Center Copyright © McKinsey & Company www.mckinsey.com/mcg