mcas practice test biology high schoolmcas.pearsonsupport.com/.../mcas...biology_pt_ada.pdf · sea...
TRANSCRIPT

MASSACHUSETTS COMPREHENSIVE ASSESSMENT SYSTEM
BiologyPRACTICE TEST
High School
Student Name
School Name
District Name
MASSACHUSETTS COMPREHENSIVE ASSESSMENT SYSTEM

Go On 2
High SchoolBiology
PRACTICE TEST
This practice test contains 29 questions.
DirectionsRead each question carefully and then answer it as well as you can. You must record all answers in this Practice Test Booklet.
For some questions, you will mark your answers by filling in the circles in your Practice Test Booklet. Make sure you darken the circles completely. Do not make any marks outside of the circles. If you need to change an answer, be sure to erase your first answer completely.
If a question asks you to show or explain your work, you must do so to receive full credit. Write your response in the space provided. Only responses written within the provided space will be scored.
If you do not know the answer to a question, you may go on to the next question. When you are finished, you may review your answers and go back to any questions you did not answer.

q Images of the embryo and adult stages of three different organisms are shown.
Organism Embryo
Grasshopper
Spider
Centipede
Adult
Which of the following is the best conclusion that can be drawn from this evidence?
AHaving similar embryos indicates that these organisms eat the same types of food.
BHaving similar embryos indicates that these organisms live in a similar environment.
CHaving similar embryos indicates that these organisms share a recent common ancestor.
DHaving similar embryos indicates that a certain protein controls how many legs the adult organisms will have.
Biology
3 Go On

w A partial ocean food web is shown.
Sharks
Sea otters
Sea urchins Small fish Crabs
Algae
Select two changes that would most likely lead to a decrease in the size of the sea otter population in the area.
AA law is passed that results in less fishing in the area.
BWarmer ocean temperatures cause more algae to grow in the area.
CChemical runoff from a factory kills many crabs and small fish in the area.
DAn invasive species of sea star that preys on sea urchins moves into the area.
e A small number of people have an inherited mutation that decreases the likelihood of heart disease. The mutation causes the amino acid cysteine to be replaced by arginine.
Which of the following is most likely responsible for this mutation?
Aa large protein with a longer polypeptide chain
Bthe duplication of a chromosome in the genome
Cthe crossing over of a chromosome in the genome
Da substitution of one nucleotide in the DNA sequence
Biology
4 Go On

r The graph shows the effect of temperature on the rate of carbon dioxide (CO2) production in plant cells as a result of cellular respiration.
0 10 20 30 40 50
10
20
30
40
Temperature(°C)
Rate
of CO
2 Pr
oduc
tion
(nm
oles
/s)
Effect of Temperatureon CO2 Production
Based on the graph, select the response that correctly completes each statement.
When temperature increases, the rate at which glucose is used by cells is expected to
Adecrease.
Bincrease.
Cstay the same.
When temperature decreases, the rate of ATP production by cells is expected to
Adecrease.
Bincrease.
Cstay the same.
Biology
5 Go On

t Scientists discovered a 375-million-year-old fossil in Canada. The diagram below shows the top and side views of the fossil.
Top view
Side view
Which observation would best support the hypothesis that this organism was a transitional form between amphibians and fish?
AThe fossil has a long body, which both modern amphibians and modern fish have.
BThe fossil is larger than most modern amphibians, but smaller than most ancient fish.
CThe fossil has some body structures that are similar to amphibians and some body structures that are similar to fish.
DThe fossil was discovered near a lake, which shows that the organism needed water to reproduce, as do amphibians and fish.
Biology
6 Go On

This question has two parts.
y Part A
Which of the following shows the stages of mitosis in the correct order?
A
B
C
D
Part B
Which of the following best describes a result of mitosis?
Aorganisms whose genetic diversity increases over time
Bdaughter cells that are genetically identical to the parent cell
Cgametes with combinations of alleles absent in the parent cell
Dchromosomes that carry different genetic instructions to each cell
Biology
7 Go On

u The distribution of shell heights in a population of snails changed over time, as shown.
Distribution of Shell Heights
5 10 150
50
75
25
100
Shell Height (mm)
InitialN
umbe
r of
She
lls
5 10 150
50
100
75
25
Num
ber
of S
hells
Shell Height (mm)
Final
Which of the following best explains what happened to the genetic diversity of this snail population in regard to shell height?
AGenetic diversity decreased because of selection pressure.
BGenetic diversity increased because of changes in food sources.
CGenetic diversity stayed the same because of equal birth and death rates.
DGenetic diversity increased because of the introduction of a new behavior.
Biology
8 Go On

i A section of DNA is shown.
3'–TCG ATA TCC–5'
Which sequence best shows the result of transcription for the section of DNA?
AAGC TAT AGG
BUCG AUA UCC
CTCG ATA TCC
DAGC UAU AGG
Biology
9 Go On
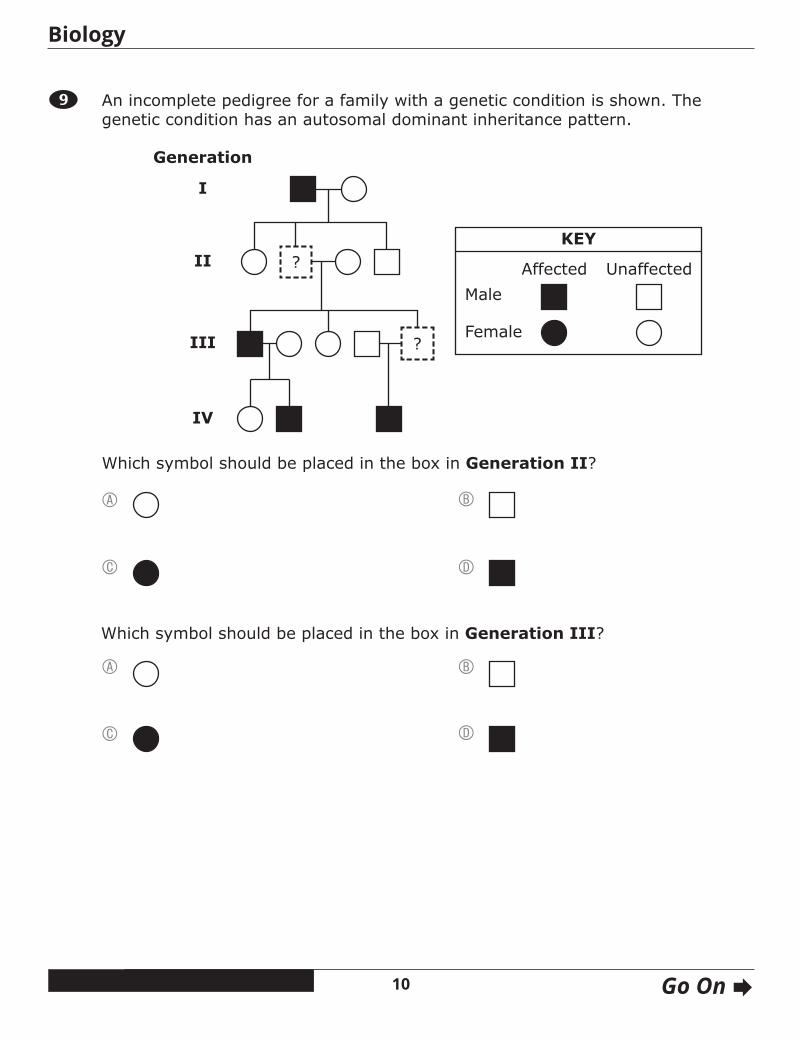
o An incomplete pedigree for a family with a genetic condition is shown. The genetic condition has an autosomal dominant inheritance pattern.
Affected UnaffectedMale
Female
KEY
Generation
II
I
III
?
?
IV
Which symbol should be placed in the box in Generation II?
A B
C D
Which symbol should be placed in the box in Generation III?
A B
C D
Biology
10 Go On

a Herbicides are chemicals that kill plants by interrupting important biological processes. Different herbicides affect different plant processes. The herbicide atrazine prevents the chemical reactions that use energy from sunlight.
A plant is sprayed with atrazine. Exposure to atrazine causes an immediate decrease in the production of two substances in the plant. Select the two substances.
ADNA
Bcarbon dioxide
Cglucose
Dphospholipids
Eoxygen
s Genetic engineering is a process used to introduce a new trait into an individual organism or into a population of organisms.
Inherited traits are passed from parents to offspring through
Agenes.
Bproteins.
For a genetically engineered trait to be inherited by offspring, the genetically engineered DNA must be present in the parents’
Ablood cells.
Bgametes.
Csaliva.
Dskin cells.
Biology
11 Go On

This question has two parts.
d Part A
The diagram shows part of the carbon cycle.
Animals
Decomposers
Fossil fuels
CO2
Plants
Photosynthesis
Decomposition
Combustion
Respiration
Which of the processes shown in the diagram is responsible for cycling carbon from the atmosphere to the biosphere?
Acombustion
Bdecomposition
Cphotosynthesis
Drespiration
Part B
Which of the following occurs during decomposition?
ACarbon is dissolved in water to form a solution.
BCarbon is stored in animals as complex carbon compounds.
CCarbon compounds are absorbed by plant roots from the soil.
DCarbon compounds are broken down into simpler substances.
Biology
12 Go On
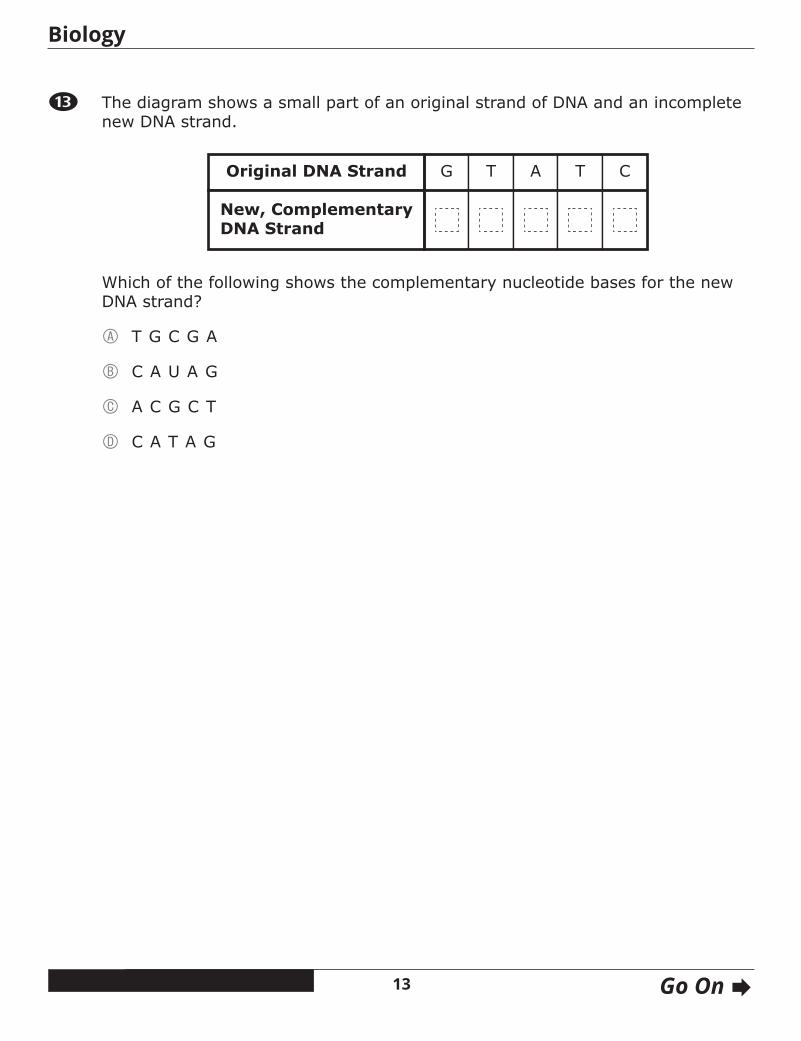
f The diagram shows a small part of an original strand of DNA and an incomplete new DNA strand.
Original DNA Strand
New, ComplementaryDNA Strand
G T A T C
Which of the following shows the complementary nucleotide bases for the new DNA strand?
AT G C G A
BC A U A G
CA C G C T
DC A T A G
Biology
13 Go On

The following section focuses on Polynesian crickets.
Read the information below and use it to answer the four selected-response questions and one constructed-response question that follow.
Male Polynesian field crickets typically “sing” to attract females by rubbing their wings together. When male field crickets sing, they not only attract female Polynesian field crickets, but they also attract female Ormia flies. When a female Ormia fly finds a male field cricket, she deposits larvae on the field cricket. The larvae burrow into and feed on the field cricket’s body, eventually causing the cricket to die. Field crickets are the main food source of Ormia fly larvae.
Scientists studied Polynesian field crickets and Ormia flies on the Hawaiian island of Kauai over several years. They collected data on the number of male Polynesian field crickets found in an area on Kauai. They also determined whether the field crickets had the ability to sing. The data the scientists collected are shown in the table.
1993
1995
1999
2004
2005
72
52
5
133
145
Most had the ability to sing.
Most had the ability to sing.
Some had the ability to sing.
Few had the ability to sing.
Very few had the ability to sing.
Year Number ofMales Found Ability of Crickets to Sing
When the number of male field crickets began to increase, the scientists found that most male field crickets were not able to sing; instead, they were silent. The scientists called silent males “flatwing” and those that can sing “wild-type.” The flatwing trait is caused by a genetic mutation.
Biology
14 Go On

g Ormia flies and Polynesian field crickets have different ecological roles.
Based on the information provided, what is the ecological relationship between the Ormia fly and the field cricket?
Acommensalism
Bcompetition
Cmutualism
Dparasitism
h Within a few years of the introduction of Ormia flies on Kauai, over 90% of male field crickets had the flatwing trait. Which of the following most likely allowed the trait to spread so quickly in the field cricket population?
AFlatwing male field crickets preferred mating with wild-type females.
BIndividual female field crickets became resistant to attacks from Ormia flies.
CIndividual wild-type male field crickets lost the ability to sing and became flatwing field crickets.
DFemale field crickets mated with males that had the flatwing trait and produced fertile offspring.
Biology
15 Go On

j Wing phenotype in male field crickets can be an advantage or a disadvantage, depending on environmental conditions.
Select three sentences that correctly identify under which environmental conditions a wing phenotype in male field crickets is an advantage or a disadvantage.
AThe flatwing phenotype is an advantage when Ormia flies are present.
BThe flatwing phenotype is a disadvantage when Ormia flies are present.
CThe wild-type phenotype is an advantage when Ormia flies are present.
DThe wild-type phenotype is a disadvantage when Ormia flies are present.
EThe wild-type phenotype is an advantage when Ormia flies are not present.
FThe wild-type phenotype is a disadvantage when Ormia flies are not present.
Biology
16 Go On
This question has two parts.
k The table in the introduction shows how the numbers of male field crickets changed over time.
Part A
Between 1995 and 1999, the size of the Ormia fly population on Kauai most likely
Adecreased.
Bincreased.
Cstayed the same.
Part B
Which of the following explains what most likely affected the population size of the Ormia fly between 1995 and 1999?
AThe male flies were able to find more mates.
BThe fly population reached its carrying capacity.
CThe flies were able to feed on more field crickets.
DThe amount of food available for the flies’ larvae decreased.
Biology
17 Go On
This question has two parts. Write your response on the next page. Be sure to label each part of your response.
l The Ormia fly was introduced by humans to the Hawaiian Islands and is considered an invasive species.
A. Describe two characteristics of an organism, such as the Ormia fly, that would allow it to become an invasive species.
B. Explain why people are concerned about invasive species being introduced into an ecosystem.
Biology
18 Go On

l
Biology
19 Go On

; A group of students measured the heights of all sophomores at their school. The data are shown in the graph.
01020
7080
Height (cm)
30405060
Num
ber
of S
tude
nts
150–155
161–165
171–175
176–180
156–160
166–170
181–185
Height Distribution of Sophomores
One of the students claims that many genes control height in humans.
Which of the following best describes the student’s claim?
AThe claim is correct because the data show a range of heights among the students.
BThe claim is not correct because the data show a range of heights among the students.
CThe claim is correct because the data show most students in one height range, with little variation.
DThe claim is not correct because the data show most students in one height range, with little variation.
Biology
20 Go On
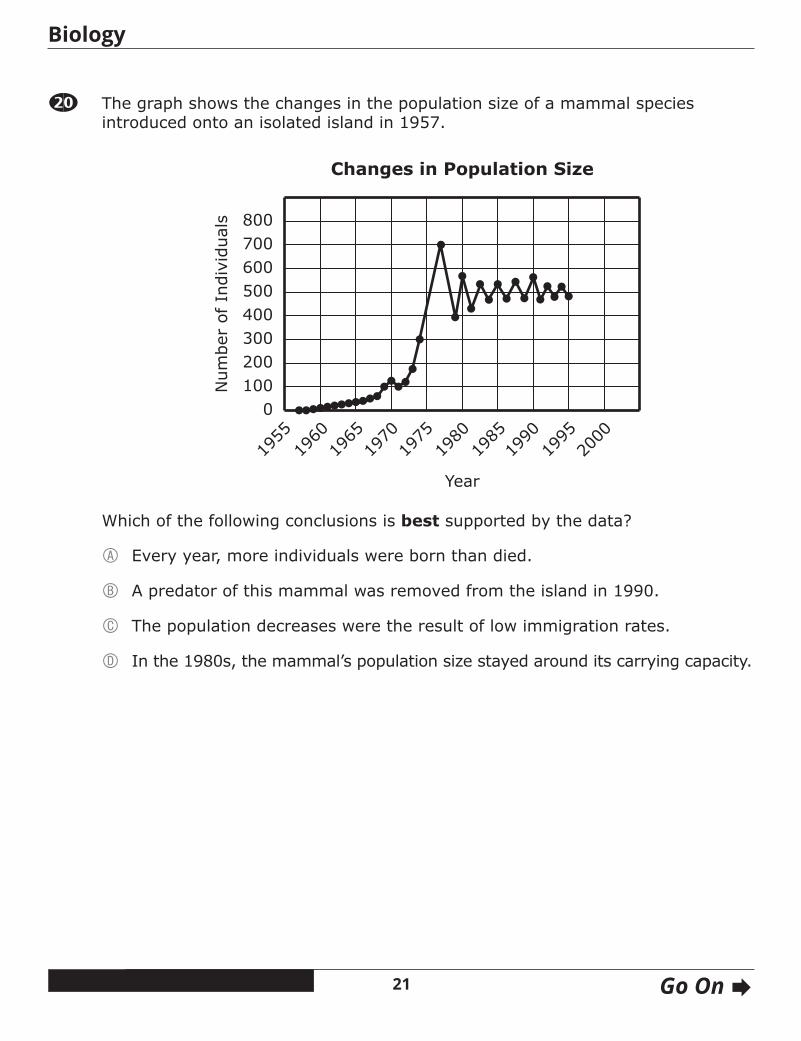
2) The graph shows the changes in the population size of a mammal species introduced onto an isolated island in 1957.
1955
1960
1965
1970
1975
1980
1985
1990
1995
0100200300400500600700800
Num
ber
of I
ndiv
idua
ls
Year
2000
Changes in Population Size
Which of the following conclusions is best supported by the data?
AEvery year, more individuals were born than died.
BA predator of this mammal was removed from the island in 1990.
CThe population decreases were the result of low immigration rates.
DIn the 1980s, the mammal’s population size stayed around its carrying capacity.
Biology
21 Go On

2! Some populations of Atlantic tomcod fish have an allele that makes the fish resistant to toxic pollutants called PCBs. Tomcod populations in several rivers were analyzed for the presence of this allele. Each river had varying levels of PCB pollution.
Which of the following results would best support the conclusion that natural selection is influencing the presence of this allele in the tomcod populations?
AAll of the tomcod in each of the rivers have this allele.
BThe percentage of tomcod with this allele remains the same from year to year in each river.
CThe rivers with high PCB levels have larger percentages of tomcod with this allele than the rivers without PCBs.
DEggs from tomcod without this allele can hatch in rivers with or without PCBs, and eggs from tomcod with this allele can only hatch in rivers without PCBs.
Biology
22 Go On

This question has two parts.
2@ The energy pyramid shows the amount of available energy at each trophic level of an ecosystem.
Trophic level 4
Trophic level 3
Trophic level 2
Trophic level 1
Part A
Which statement best explains the trophic levels in the energy pyramid?
AThe trophic levels show how energy flows from level 4 to level 1.
BOnly about 10% of the energy available at one trophic level is transferred to the next trophic level.
CAt each trophic level, the energy available is directly proportional to the size of the organisms in that trophic level.
DAt each trophic level, 10% of the energy is converted into matter and 90% of the energy is transferred up to the next level.
Part B
Which group of organisms obtains energy for life processes by converting sunlight into chemical energy?
Aproducers
Bprimary consumers
Csecondary consumers
Dtertiary consumers
Biology
23 Go On

This question has two parts.
2# The enzyme lactase is needed for a person to be able to digest sugar in dairy products, such as cow’s milk. The model shows how the enzyme lactase is produced by a cell.
Part A
Which model correctly shows the two molecules involved in the formation of lactase?
A
Protein
Glucose
ATP
B
Protein
RNA
DNA
C
Protein
Glucose
ATPD
Protein
RNA
DNA
Biology
24 Go On

Part B
Based on the model, which of the following leads to the production of lactase?
AATP is used to form lactase from glucose.
BLactase is directly replicated from DNA using ATP.
CDNA is transcribed to form mRNA, and then mRNA is translated.
DDNA is translated to form a dairy sugar, and then mRNA is transcribed.
Biology
25 Go On
2$ A person eats an apple, and it is broken down in the person’s digestive system.
Which of the following shows the order in which the apple pieces travel through the digestive system?
Amouth → liver → small intestine → large intestine
Bmouth → large intestine → small intestine → liver
Cmouth → stomach → small intestine → large intestine
Dmouth → large intestine → small intestine → stomach
2% Fossilized remains of prehistoric mastodons show anatomical similarities to modern-day elephants. These similarities provided the first evidence that mastodons were related to modern-day elephants.
Which of the following is the best additional evidence that mastodons were related to elephants?
AMastodons walked on four legs like modern-day elephants.
BMastodons ate a diet similar to that of modern-day elephants.
CMastodon fossils were found in the same area where modern-day elephants live.
DMastodon tissues contained protein sequences similar to those of modern-day elephants.
Biology
26 Go On

2^ The simplified diagram shows how the protein mucin is produced by lung cells.
DNA mRNA
Mucin
Select two statements that best describe the relationship between the DNA and the protein mucin.
AThe DNA is built from the mRNA of mucin.
BThe DNA folds at certain locations to shape mucin.
CSugars in the DNA can change the structure of mucin.
DThe DNA codes for the amino acid sequence that forms mucin.
EMutations to the DNA can change the structure and function of mucin.
2& Select two body systems that are most directly responsible for delivering oxygen to an animal’s cells.
Acirculatory system
Bdigestive system
Cexcretory system
Dnervous system
Erespiratory system
Biology
27 Go On
This question has three parts. Write your response on the next page. Be sure to label each part of your response.
2* Some plants in an area produce a toxin that protects them from being eaten by a variety of insect species. The toxin decreases reproductive rates in insects. Because of a genetic mutation, some fruit flies can detect the plant toxin and therefore avoid eating the plant.
A. Describe how the number of fruit flies in the population that can detect the toxin will most likely change over the next 25 years.
B. According to the mechanism of natural selection, explain how the change you described in Part A will occur.
C. Based on the changes in the fruit fly population, describe what will most likely happen to the plants’ production of the toxin. Explain your answer.
Biology
28 Go On

2*
Biology
29 Go On

This question has four parts. Write your response on the next page. Be sure to label each part of your response.
2( In tomato plants, the allele for red fruit color (R) is dominant to the allele for yellow fruit color (r). The allele for round-shaped fruit (F) is dominant to the allele for pear-shaped fruit (f).
Two tomato plants, heterozygous for fruit color and fruit shape, are crossed. The Punnett square for this dihybrid cross is shown.
RF
Rf
rF
rf
RF Rf rF rf
RrFf
RrFF
RRFf
RRFF
Rrff
RrFf
RRff
RRFf
rrFf
rrFF
RrFf
RrFF
rrff
rrFf
Rrff
RrFf
A. For this cross, identify all the possible phenotypes of the offspring.
B. Considering only fruit color, determine the ratio of offspring with red fruit to offspring with yellow fruit predicted by the Punnett square.
C. Considering only fruit shape, determine the ratio of offspring with round-shaped fruit to offspring with pear-shaped fruit predicted by the Punnett square.
D. Explain what is meant by independent assortment and describe one way in which your answers to Parts A, B, and C support the conclusion that the genes for fruit color and fruit shape sort independently.
Biology
30 Go On

2(
Biology
31
