mcafr
DESCRIPTION
Managemnet control and accountability for financial resources.TRANSCRIPT

Words: 3,289 Approximately
Post Graduate Diploma in Business Management- LAMS
Name: Mirza Farhan Baig
Module: MCAFR
Reference No: 8092b/MIRZ
NCC Registration: 00125280
Assignment Title: Evaluation of Financial Performance

Management Control and Accountability for Financial Resources
ACKNOWLEDGEMENTS:
I owe a great thanks to many people who helped and supported me during writing of the report for Evaluation Of Financial Performance of Nokia Company.
My deepest thanks to course coordinator Mr. Kashif Sadiq for Management, Control and Accountability for Financial Resources (MCAFR). He has taken pain to go through the project and make necessary correction as and when needed.
I would also thank my college LAMS without whom this project would have been a distant reality.
1

Management Control and Accountability for Financial Resources
Table of Contents:
Acknowledgements………………………………………………………………………...................1
Table of Contents…………………………………………………………………………………………….2
1) Executive Summary..................................................................................3
2) Aim and Objectives……………………………………………………………………………….4
3) Financial Ratio Analysis………………………………………………………………………...5
3.1) Profitability Ratios………………………………………………………………………….53.2) Liquidity Ratios……………………………………………………………………………... 83.3) Efficiency Ratios……………………………………………………………………………. 103.4) Investment Ratios……………………………………………………………………………123.5) Gearing Ratios…………………………………………………………………………………19
4) SWOT Model…………………………………………………………………………………………………22
4.1) Strengths…………………………………………………………………………………………22
4.2) Weaknesses……………………………………………………………………………………..23
4.3) Opportunities………………………………………………………………………………….24
4.4) Threats……………………………………………………………………………………………26
5) Conclusion………………………………………………………………………………………………………27
6) Referencing…………………………………………………………………………………………………….28
7) Appendices………………………………………………………………………………………………………29
2
Management Control and Accountability for Financial Resources
Executive Summary:
Nokia is a multinational company, which was incorporated in 1871 in the town of Finland named as Espoo, headquartered in Keilaniemi. Nokia is indulged in the manufacturing of various products such as mobile phones, smart phones, mobile computers and networks. There is about 132000 people of workforce is working in a big company. It has a few subsidiaries which includes nokia Siemens networks, nauteq, and Symbian, vertu, and Qt development frameworks. In total eight branches working worldwide to lift the business up. Some of the branches are located in New York, Latin America, and India etc. Nokia has a rich dependency on research centers, and hiring expert team which are specialized in research. They are always experimenting innovative technologies to bring something new in the market and faster than others. Their main research centers are situated in Hollywood, Cambridge, and Bangalore etc. Recent research showed that Nokia’s share in the market is nearly about 31 %. Since past few decades Nokia acquired 41 companies but the latest research shoes that it has acquired Motorola, motally, Novara incorporation and Meta carta incorporation by the end of April, 2010. Nokia is listed in New York, Helsinki and Frankfurt stock exchanges.
Mission statement:
“Connecting People”
Nokia©
3
Management Control and Accountability for Financial Resources
Aims and Objectives:
To analyze the financial position of Nokia using financial ratio analysis framework.
To Analyze business performance of Nokia using SWOT model.
To manage the cash and measure business liquidity with the help of cash flow by determining cash inflows and outflows of a company.
Assessment of Nokia Corporate Social Responsibility.
To use assets efficiently and effectively in a sense to produce more output but less or same amount of technology or input.
To Analyze Nokia Past problem and future Planning.
Provide useful information for potential investor in decision making.
4

Management Control and Accountability for Financial Resources
Financial ratio analysis:
Profitability Ratios:
Profitabilty ratio: it is used to determine the ability of business in order to generate revenue in contrast to expenses during specific period of time. There are three type of profitability ratios:
Return on Capital Employed Gross Profit Margin Net Profit Margin
(By Lawrence J. Gitman, Carl McDaniel) (P.393-396)
Return on Capital Employed:
It shows the income on the emplyed captial which company has invested. It is related to finance however it is resemble to assets as well.
Gross profit margin:
It is used to assess the proportion of money left over revenue. It is also know as the real or true profit from investment. It is derived in income statement by deducting the cost of the goods from the revenue generated by selling the goods. It shows how company has performed in sales and how much profit they have generated.
Net profit margin:
This is what we call the final real profit left for the company after deducting expenses from gross profit. And this is also the main difference due to which it is known as net profit instead of gross profit. It indicated how effective a company is at cost control.
5
Management Control and Accountability for Financial Resources
Analysis:
The main reason behind drop of ROCE is fall in Operating profit of the company. The main reason behind drop in gross profit and eventually fall in operating profit. This may be because fall in selling price of mobile phone in all markets and severe competition in this sector. Therefore Nokia’s ROCE is fall from 27.20% in 2008 to 11% in 2010.
A high ROCE shows that greater proportion of profits can be invested back into the company for the sake of its shareholders.
A low ROCE indicates that a company utilizing its capital resouces in a poor manner.
6
2008 2009 20100.00%
5.00%
10.00%
15.00%
20.00%
25.00%
30.00%27.20%
6.70%
11.00%
ROCE
ROCE

Management Control and Accountability for Financial Resources
Gross Profit and Net Profit
Analysis:
The fall of gross profit margin shows that Nokia remains unable to decrease its cost of goods sold. On the other hand the selling price of mobile phones are facing tough competition from other companies, therefore, gross profit margin reduce by 2% every year.
On the other hand company’s net profit margin fall significantly in 2009 which followed by bit increase in year 2010. On having a look of Nokia’s financial statement, we can find the cause of that as impairment of Nokia’s goodwill in 2009. However company increases its R &D cost whose benefit can be derive by Nokia in future. The increase in R & D cost may aslo be another reason behind falling of Net Profit Margin. There is not much difference in Admin, selling & marketing cost of all three years. However company manage to reduce its other expenses (see Nokia’s latest Financial Statement).
7
2008 2009 20100%
5%
10%
15%
20%
25%
30%
35%
40%
34%32%
30%
9.80%
2.30%4.20%
Gross Profit MarginNet Profit Margin

Management Control and Accountability for Financial Resources
Further Nokia’s financial cost raised because of which its net profit affected too much and result in decreased net profit margin. Because of financial crunch in year 2008, finance cost has been increased globally and thus Nokia also affected by it.
Liquidity Ratios
In indicates the ability of company to meet its short term obligations for the repayment of short term debts.it also brief the effectiveness of working capital management. The term used for liquidity ratios is solvency ratios. In liquidity ratios, current and quick ratios are used often.
(William Lasher p. 83 and 84)
Current Ratio:
It indicates the ability of company to pay off its short term liabilities from its short term assets. Current ratio is used to assess the business financial health.
8

Management Control and Accountability for Financial Resources
Current Ratio V/S Quick Ratio
2008 2009 2010€ -
€ 0.20
€ 0.40
€ 0.60
€ 0.80
€ 1.00
€ 1.20
€ 1.40
€ 1.60
€ 1.80
Quick RatioCurrent Ratio
Analysis
Both, current and quick ratio of the company improved in 2009 and then maintained in 2010. Nokia managed to reduce its accounts receivable and thus ultimately its cash and cash equivalents has been increased. It also increases its investment in financial assets; therefore its quick ratio has been improved in 2009 and 2010. On the other side, its Accounts payable, Accrued expenses and other financial liabilities is also increased but company still managed to maintain its quick and current ratio to 2009 level.
Efficiency Ratios:
9

Management Control and Accountability for Financial Resources
Efficiency ratios are used to analyze how you are run your business. It provide an information of how fast you are collecting your money for credit sales and how many times you are turning over your inventory in a given period of times. Among these ratios are yardstick, to watch on your business carefully. Efficiency ratios are calculated in days, not in percentages or proportions.so, the result would be soon. Following are the types of efficiency ratios.
(Ramachandra p. 105-107)
Stock turnover ratio Debtor’s turnover ratio Creditor’s turnover ratio
Stock turnover ratio:
It indicates average amount of period for which inventory is held before the sale.it measure how a company converts stock into revenue. And how much efficiently company can sale its goods as soon as possible and hold the goods for a short time. Higher Stock turnover ratio means company is not good in selling their products and holding it for a long time and this is how it indicates company’s performance in sales that how effectively sales workforce is working and product is demanded by market. If its higher then it could also lead to expiration of the stock which means wastage and holding products for a long time would also result in increase in holding cost.
Debtors turnover ratio:
10

Management Control and Accountability for Financial Resources
It emphasizes on the short collection period. It is basically used to determine the ratio which concentrates the debtors recovery period, i.e. how well the debt has been recovered or received within the given time. It is directly proportional to assets and used to convert account receivable into cash and so on effecting the performance of the company and the credit collection department is responsible for getting the credit back from their clients.
Credit turnover ratio:
It reflects the company’s credit history and performance which is used to revise or review by the credit providers of the company. It is used to maintain credit rating and help to grab the opportunities which require big investment which could be avail in the form of loans by financial institutions. It is basically can be defined as how much time company take to write off his liability and pay back to his supplier. It also creates the goodwill of the company and help to maintain the relationships with the suppliers.
11

Management Control and Accountability for Financial Resources
Efficiency ratios
2008 2009 20100
10
20
30
40
50
60
70
80
28 2531
68 7165
5765
75
Stock Turnover RatioDebtors Turnover RatioCreditors Turnover Ratio
Analysis
Nokia’s stock turnover ratio has been increased from 28 (in 2008) to 31(in 2010), which means more cash stuck in stock which can be dangerous. Company should try to reduce its inventory turnover. On the other hand Nokia debtor’s turnover is reduced to 65 days in 2010 which is good and thus help to improve its current and quick ratio. However, its creditors had to wait longer for their payment as their turnover is increased from 57 days to 75 days. Because of this delaying technique company’s liquidity improved but this may damage relationship with its suppliers.
Investment Ratios:
Investment ratios are usually reviewed by the existing and potential investors and the company’s which wants to invest on another company by purchasing shares of some portion. It has a significant importance and one of the most important factors for the company as people are influenced by these ratios in order to invest their
12

Management Control and Accountability for Financial Resources
money at a useful place. These ratios are analyzed every time whenever there is the need of cash for the company so they can borrow the funds from the public and issue shares to raise their capital. (Peter Atrill, Eddie McLaney p. 210-212)
Investment ratios include:
Earnings per share (EPS) Dividend per share (DPS) Price Earnings ratio (P/E) Dividend Yield Market Capitalization
Earnings per Share:
It can be defined as how much investor are earning per share or what amount of money they will get or getting per share. Shareholders are not concerned about the gross or net profit they are concerned about the earning per share. This is only matter of concern for the shareholders and It distracts a lot of capital in the form of shares which are purchased by the public and the condition applies on it is it should be competitive or good than other companies. Higher EPS can help in persuading the public to purchase the shares and generating more investment.
Dividends yield:
It is known as the return on investment which a shareholder gets after company has announced a specific period in which dividends will be given. It is also known as profit for investors. When an investor wishes to buy some shares of a company he gets aware about how much dividend he is going to get which is listed in stock market by the means of trends or past statements and in which period usually company announces to distribute the dividends.
13

Management Control and Accountability for Financial Resources
Price earnings ratio
P/E can be defined as relationship between current market price of share common stock and the stock earning per share. Normally, existing and potential investor consider price earnings ratio gauge of future earning power of the company. High growth opportunities mean that company has high P/E ratio, while low growth tend to have low growth opportunities.
Dividend per share
Dividend per share helps to determine the income received by shareholder against each share they owned. It is less than earning per share because specific proportion of profit held by a company for reinvestment in company.
Market Capitalization:
Market capitalization is total worth of shares that are issued by the company on the basis of current market price of share. It can also be defined as total value of the shares that a company floated in a market. Normally, it depends upon current share price in market.
(Michael C. Thomsett p. 128-129)
14

Management Control and Accountability for Financial Resources
2008
2009
2010
€ - € 2.00 € 4.00 € 6.00 € 8.00 € 10.00 € 12.00
€ 1.07
€ 0.24
€ 0.50
€ 0.5
€ 0.4
€ 0.4
€ 11.10
€ 8.92
€ 7.79
INVESTMENT RATIOS
Share priceDPSEPS
Analysis
Nokia’s share price is decreased from €11.10 (in 2008) to €7.79 (in 2010) per share making it less attractive for investors. This may be because it’s reduced profitability in last two years. Further less profit result in decreased earnings per share. Further Company was unable to maintain its Dividend per share ratio, which also play major role for reducing investor’s interest. Overall company seems less attractive in year 2010 than year 2008.
15

Management Control and Accountability for Financial Resources
2008 2009 2010
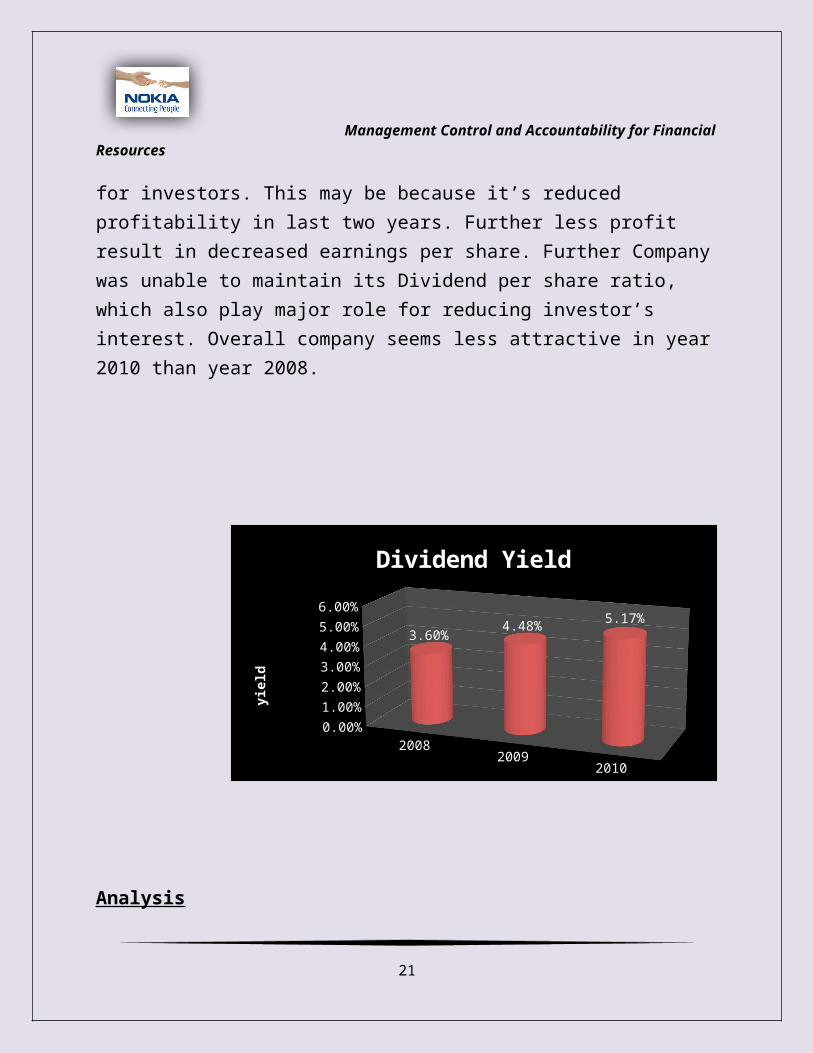
Dividend Yield 3.60% 4.48% 5.17%
0.50%
1.50%
2.50%
3.50%
4.50%
5.50%
3.60%4.48%
5.17%
Dividend Yieldyi
eld
Analysis
Dividend yield ratio of Nokia is improved because it did not reduce its dividend per share as much as its price has been decreased. As a result its dividend yield ratio remains good for last two years.
16

Management Control and Accountability for Financial Resources
Price Earnings Ratio (Euros)
2008 2009 20100
5
10
15
20
25
30
35
40
10.37
37.17
15.58
Analysis
The P/E ratio doesn't tell us the whole story by itself. It's usually more useful to compare the P/E ratios of one company to other companies in the same industry, to the market in general or against the company's own historical P/E. Higher P/E Ratio in 2009 shows that investors are ready to pay more for every € of earning. However, their significant drops tell the opposite story it means that when they realize that they are paying much more for every share than their interest reduces.
17

Management Control and Accountability for Financial Resources
Market Capitalization
41046
33078
28709
Market Capitalization in Euro (million)
200820092010
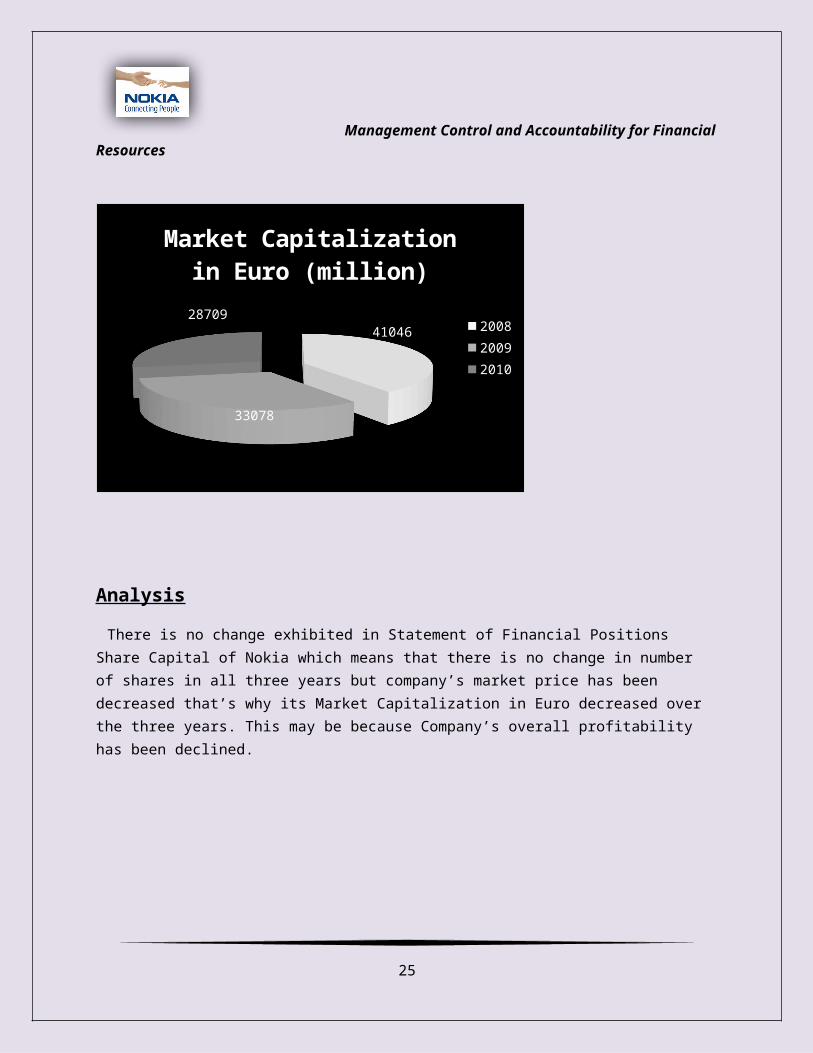
Analysis
There is no change exhibited in Statement of Financial Positions Share Capital of Nokia which means that there is no change in number of shares in all three years but company’s market price has been decreased that’s why its Market Capitalization in Euro decreased over the three years. This may be because Company’s overall profitability has been declined.
18
Management Control and Accountability for Financial Resources
2008 2009 2010
0%
5%
10%
15%
20%
25%
30%
14%
28% 25%
long term gearing
long term gearing
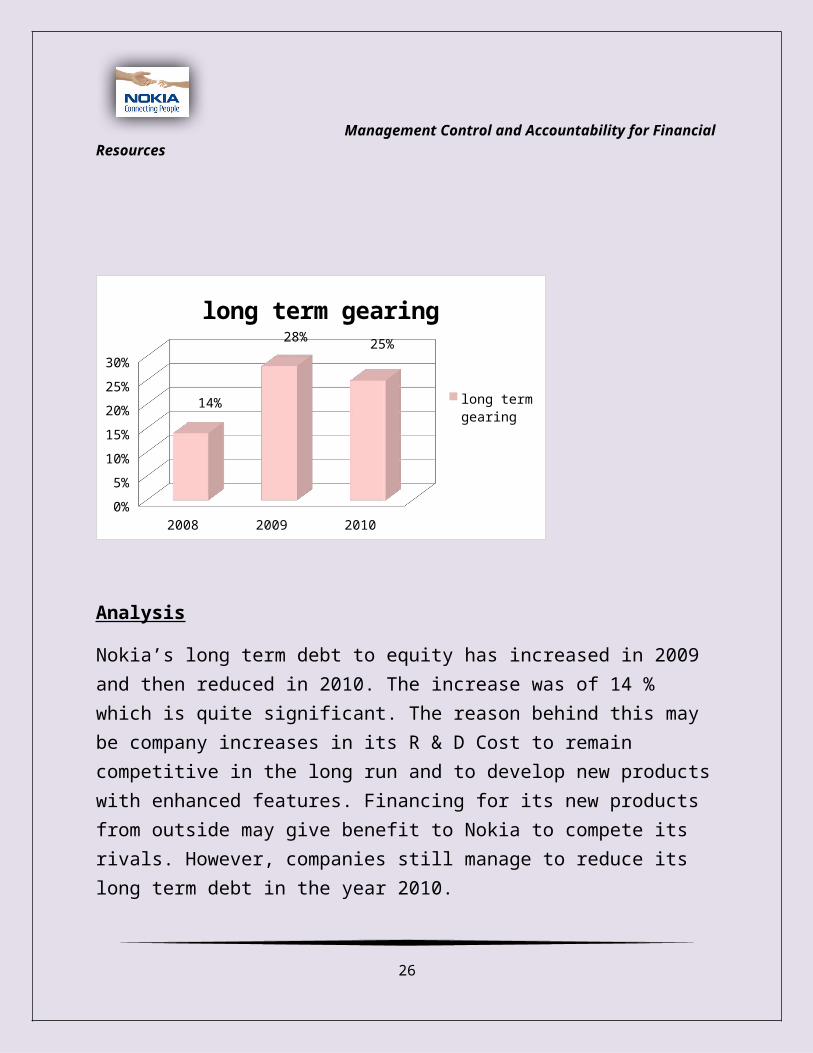
Analysis
Nokia’s long term debt to equity has increased in 2009 and then reduced in 2010. The increase was of 14 % which is quite significant. The reason behind this may be company increases in its R & D Cost to remain competitive in the long run and to develop new products with enhanced features. Financing for its new products from outside may give benefit to Nokia to compete its rivals. However, companies still manage to reduce its long term debt in the year 2010.
19

Management Control and Accountability for Financial Resources
2008 2009 20100
2
4
6
8
10
12
€ 11.10 € 8.92 € 7.79
NOKIA SHARE PRICES ON NASDAQ OMX HELSINKI (EUR)
Analysis
The reason behind decrease in average market share in three stock markets may be reduced cost efficiency particularly company has been failed to control its financial cost over last three years. Hence, its overall profitability decline and as a consequence, Nokia’s share price in stock market is decline too.
20
Management Control and Accountability for Financial Resources
Gearing Ratios:
Gearing ratios defined as to assess the capital structure of the company; i.e. the proportion of debt and equity. Normally, there are two source from company can raise funds i.e.
Debt (borrowed capital they pay interest) Equity (from shareholders paid by dividend payments and capital growth
of the company.) Debt financing can be considered cheaper as equity financing.
(Peter Atrill, Eddie McLaney p.206)
There are two types of gearing ratios:
Capital or long term Interest cover
Capital or long term:
It describes possible difficulty in meeting long term debt requirements. It can be directly or indirectly relationship between borrowed capital and total amount of money invested into business.
Interest cover:
It shows the number of times in interest expense is covered by earnings and cash flows. This ratio demonstrates that certain amount of money decrease in income that a company can bear its financial cost. It can be analyzed how much time profit you have to pay interest cost. It shows the operating income of company by its interest obligation for a given period.
21
Management Control and Accountability for Financial Resources
SWOT MODEL
STRENGTHS:
Largest Cellular Company
One of its main strength is that nokia is providing best services around 120 countries that’s why it is known as world’s largest cellular company. Nokia is well reputed for manufacturing of telecommunication products which also facilitate communication industries and as well as internet industries.
Affluent technology for user
Nokia is manufacturing various mobile phones which are user friendly, anybody can easily operate the nokia mobiles phones and it has categorized mobile phones with respect to age group. Each technology of nokia is fluently used by its customers.
Gigantic Brand image
In global market, it has got strong brand name which attracts many people to use its products. Its latest technologies and reliability has lead towards growth of brand name due to which many people irresistibly comes in a circle of nokia.
22

Management Control and Accountability for Financial Resources
Great Price Range
Nokia shares a great price range according to each social class so that everybody can be served by nokia. This strength makes nokia the world largest cellular company. An Affordable price range of nokia has made is brand name so popular.
Dynamic workforce
Over 132000 employees’ works under the marquee of nokia which are highly qualified and well- trained who attains to work for their assigned tasks. They serve nokia for their durability and reliability. This dynamic workforce helps to make nokia the strongest company in this era. They are gathered to make nokia stronger in order to yield high quality and quantity.
High market share
Recently, Nokia acquires a market share of 31% globally. Its market share is increasing rapidly because of its research centers which are distributed in different parts of the world. Latest research has been done to improve their technologies in order to get huge amount of output.
WEAKNESSES:
Limited sales and services centers
23

Management Control and Accountability for Financial Resources
One of the main weaknesses of nokia is less sales and services centers are available. There are limited services centers for clients due to which they lack behind. Poor services are conducted in India which results in the shortage of their customers leading towards decline in sales.
High prices
Some of the nokia products have a relatively high price which doesn’t suit to some of the lower classes. Though its better quality and reliability covers the weakness but it is count as a weakness. Some of the nokia cells are not user friendly which are not purchased by people and they don’t have any concerns about them. It may lose the reputation of nokia though it’s the weakness.
OPPORTUNITIES:
Expansion in Business
Nokia has a great opportunity to expand its business in Asian countries with various products and characteristics and various price ranges for different people. It may get success by featuring latest mobiles phones and technologies.
Effective marketing strategies
Strong marketing strategies leads towards the growth of any organization similarly; nokia has the great opportunity of attracting customers by designing effective and efficient marketing strategies. By this manner nokia is going to have a magnificent increase in sales which is a positive attitude. This straight attitude will create a good brand image among people.
24
Management Control and Accountability for Financial Resources
Growing market share
As telecommunication market is growing progressively and people are very interested to invest in this industry so this is the right opportunity for nokia to increase its market share by manufacturing innovative models.
Assortment in Nokia
Nokia has a vast opportunity to bring diversification in business. This is the organizational strategy of nokia for growth and survival in the telecommunication industry. Its latest and innovative mobile phones are designed to bring variety in the business and generate profit.
Target Market
Nokia should target for US market in order to avail this opportunity this may lead towards the growth of its organizational structure. Marketing strategies should be improved to get positive response from US market. Ample amount of efforts should be done to get through its opportunity in order to enhance their market share in US. If they work in this arena they are going to have marvelous business reputation amongst several industries.
25
Management Control and Accountability for Financial Resources
THREATS:
Strong competitors in the market
There are several competitors in the market which is a threat to nokia. Various brands such as i- phone and blackberry are opponents of nokia which are also known as the elite class brand. Nokia products have comparatively high prices in contrast to its competitors who have indifferent low prices as a consequence they capture the market share of nokia. More and more competitors are arising in a market which may be a threat to nokia in future.
Unauthentic manufacturers
Bogus manufacturer are upcoming in the telecommunication market that are ruining the brand name of nokia. Lot of public awareness is required which can be done through advertisement and quality promotion programs in order to overcome this major threat.
Recession
In this recession period, purchasing power is becoming relatively low resulting in the decline in sales of nokia. Recession resists the growth of market profitability due to which financial cost is increased.
26

Management Control and Accountability for Financial Resources
Malfunction
Some of the nokia mobile phone is getting affected by viruses due to web browsing and downloading. These viruses destroy all save data and people due to which people hesitate to reuse nokia brand name. This factor is affecting nokia goodwill and sales may get affected too.
(http://marketingmixx.com/swot/161-nokia-swot-analysis.html )
Conclusion:
Conclusively, we can say that Nokia has great potential for growing worldwide; particularly the use of mobile phone in South Asia has increased significantly. As Nokia offers range of products for a common man with great quality and reliable & user friendly features, it may easily compete with others. As we saw in its financial statement, Nokia invest a lot in R & D to develop new products to compete worldwide with its rivals. It has to borrow funds to achieve its targets and objectives but it has to be cautious with finance cost which increases significantly in recent years. Mobile phone Industry has great potential for growth, so Nokia has to overcome its weaknesses (discussed above) as early as possible to maintain its image as leader of mobile phone industry.
27

Management Control and Accountability for Financial Resources
Referencing
By Lawrence J. Gitman, Carl McDaniel, and the Future of Business: The Essentials Practical Financial Management, Cengage Learning, 2008.
Practical Financial Management, By William Lasher, Cengage Learning, 2007.
Econ., Acc., And Man for Jntu, By Ramachandra, Tata McGraw-Hill Education, 2006.
Accounting and finance for non-specialists, 6th edition, By Peter Atrill, Eddie, McLaney Pearson Education, 2008.
The stock investor's pocket calculator: a quick guide to all the formulas and ratios you need to invest like a pro, By Michael C. Thomsett, AMACOM Div American Mgmt Assn, 2007.
http://marketingmixx.com/swot/161-nokia-swot-analysis.html.
www.nokia.com.
28

Management Control and Accountability for Financial Resources
Appendices
Return on capital employed = Profit before Interest and Tax
Capital Employed
Capital Employed = (Total Assets – Current Liability) – (Long Term Loans + Equity)
Gross Profit Margin = Gross Profit x 100
Sales
Net Profit Margin = Net Profit x 100
Sales
Current Ratio = Current Assets Current Liabilities
Quick Ratio = Current Assets – Stock Current Liabilities
Stock Turnover Ratio = Closing Stock x 365
29
Management Control and Accountability for Financial Resources
Purchases
Debtor’s Collection Period = Closing Debtors x 365
Sales
Creditor’s Payment Period = Closing Creditors x 365
Purchases
Earning Per Share = Profit after Tax and Dividend
No. of Ordinary Shares
Dividend Per Share = Ordinary Dividend
No. of Ordinary Shares
Dividend Yield = Dividend Per Share x 100
Market Price per Share
Price Earnings Ratio = Market price per Share
Earning per Share
Market Capitalization = No. of Shares Outstanding x Current Price of share
Gearing Ratio = Long term Loan
Long term Loan + Equity
30

Management Control and Accountability for Financial Resources
31

Management Control and Accountability for Financial Resources
32

Management Control and Accountability for Financial Resources
33

Management Control and Accountability for Financial Resources
34

Management Control and Accountability for Financial Resources
35