mba ii pmom_unit-1.4 process design, analysis & selection a
TRANSCRIPT

Course: MBASubject: Production & Operation
ManagementUnit: 1.4
Process design, analysis and selection

• Process Analysis
• Process Flowcharting
• Types of Processes
• Process Performance Metrics
• Manufacturing Processes
• Service Processes
• Business Process Reengineering
OBJECTIVES

Process Management
• Processes relate to work that is ongoing and repetitive
• Process management concepts and methods can be applied to improve manufacturing, service, and business processes
• Effort is placed trying to reduce cost, increase throughput, and improve quality

Process Analysis Terms
• Process: Is any part of an organization that takes inputs and transforms them into outputs
• Cycle Time: Is the average successive time between completions of successive units
• Utilization: Is the ratio of the time that a resource is actually activated relative to the time that it is available for use
Process Flowcharting
Defined
• Process flowcharting is the use of a diagram to present the major elements of a process
• The basic elements can include tasks or operations, flows of materials or customers, decision points, and storage areas or queues
• It is an ideal methodology by which to begin analyzing a process

Tasks or operationsExamples: Giving an admission ticket to a customer, installing a engine in a car, etc.
Examples: Giving an admission ticket to a customer, installing a engine in a car, etc.
Decision PointsExamples: How much change should be given to a customer, which wrench should be used, etc.
Examples: How much change should be given to a customer, which wrench should be used, etc.
Purpose and Examples
Flowchart Symbols

Examples: Sheds, lines of people waiting for a service, etc.
Examples: Sheds, lines of people waiting for a service, etc.
Examples: Customers moving to a seat, mechanic getting a tool, etc.
Examples: Customers moving to a seat, mechanic getting a tool, etc.
Storage areas or queues
Flows of materials or customers
Purpose and Examples Flowchart Symbols

Types of Processes
Single-stage Process
Stage 1
Stage 1 Stage 2 Stage 3
Multi-stage Process

Types of Processes (Continued)
A buffer refers to a storage area between stages where the output of a stage is placed prior to being used in a downstream stage
Stage 1 Stage 2
Buffer
Multi-stage Process with Buffer

Other Process Terminology
• Blocking– Occurs when the activities in a stage must stop because
there is no place to deposit the item just completed– If there is no room for an employee to place a unit of work
down, the employee will hold on to it not able to continue working on the next unit
• Starving– Occurs when the activities in a stage must stop because
there is no work – If an employee is waiting at a work station and no work is
coming to the employee to process, the employee will remain idle until the next unit of work comes

Other Process Terminology (Continued)
• Bottleneck– Occurs when the limited capacity of a process
causes work to pile up or become unevenly distributed in the flow of a process
– If an employee works too slow in a multi-stage process, work will begin to pile up in front of that employee. In this is case the employee represents the limited capacity causing the bottleneck.
• Pacing– Refers to the fixed timing of the movement of
items through the process

Other Types of Processes
• Make-to-order– Only activated in response to an actual order– Both work-in-process and finished goods inventory
kept to a minimum
• Make-to-stock– Process activated to meet expected or forecast
demand– Customer orders are served from target stocking
level


Process Performance Metrics
Capacity: maximum output of a process or resource measured in units/time: a rate
Operation time = Setup time + Run time
Setup time: the length of time required to changeover from one product to another (assumes products are produced in batches)
Throughput time = Average time for a unit to move through the system

Process Performance Metrics (Continued)
• Cycle time = Average time betweencompletion of units
• Throughput rate = 1___ Cycle time
• Utilization of an operation = Demand/Capacity

Cycle Time Example
Suppose you had to produce 600 units in 80 hours to meet the demand requirements of a product. What is the cycle time to meet this demand requirement?
Suppose you had to produce 600 units in 80 hours to meet the demand requirements of a product. What is the cycle time to meet this demand requirement?
Answer: There are 4,800 minutes (60 minutes/hour x 80 hours) in 80 hours. So the average time between completions would have to be: Cycle time = 4,800/600 units = 8 minutes.
Answer: There are 4,800 minutes (60 minutes/hour x 80 hours) in 80 hours. So the average time between completions would have to be: Cycle time = 4,800/600 units = 8 minutes.


Bread-Making Questions
• What is the bottleneck when one bread-making line is used? What is the capacity of the process? What is the utilization of packaging? What is the throughput time?
• What happens to capacity and utilization when two bread-making lines are used? What is the bottleneck?
Process Throughput Time Reduction
• Perform activities in parallel
• Change the sequence of activities
• Reduce interruptions

Basic work flow structures
Project layout – fixed position; construction, movie lots
Workcenter (job shop) – similar equipment grouped together; machine shop
Manufacturing cell – similar set of processes for a limited range of products
Assembly Line – discrete parts move through workstations; toys, appliances, cars
Continuous process – flow vs discrete, flows a set sequence of steps; oil, rubber, chemicals

Process types
• Continuous• Assembly Line• Job Shop• Cell• Project

Continuous Process
• Highly standardized products in large volumes• Often these products have become commodities• Typically these processes operate 24 hours/day
seven days/week• Objective is to spread fixed cost over as large a
volume as possible

Continuous Process continued
• Starting and stopping a continuous process can be prohibitively expensive
• Highly automated and specialized equipment used
• Layout follows the processing stages• Output rate controlled through equipment
capacity and flow mixture rates

Continuous Process continued
• Low labor requirements
• Often one primary input
• Initial setup of equipment and procedures very complex
24

Assembly Line
• Similar to continuous process except discrete product is produced
• Heavily automated special purpose equipment
• High volume - low variety • Both services and products can use flow
shop form of processing

A Generalized Assembly Line Operation

Advantages of the Assembly Line
• Low unit cost– specialized high volume equipment– bulk purchasing– lower labor rates– low in-process inventories– simplified managerial control

Disadvantages of Assembly Line
• Variety of output difficult to obtain• Difficult to change rate of output• Minor design changes may require
substantial changes to the equipment• Worker boredom and absenteeism• Work not very challenging• Vulnerable to equipment breakdowns
Disadvantages of Assembly Line continued
• Line balanced to slowest element• Large support staff required• Planning, design, and installation very
complex task• Difficult to dispose of or modify special
purpose equipment

Assembly Line Layout
• Objective is to assign tasks to groups• The work assigned to each group should
take about the same amount of time to complete
• Final assembly operations with more labor input often subdivided easier
• Paced versus unpaced lines
Job Shop
• High variety - low volume• Equipment and staff grouped based on
function• Each output processed differently

A Generalized Job Shop Operation32

Advantages of the Job Shop
• Flexibility to respond to individual demands• Less expensive general purpose equipment
used• Maintenance and installation of general
purpose equipment easier• General purpose equipment easier to
modify and therefore less susceptible to becoming obsolete

Advantages of the Job Shop continued
• Dangerous activities can be segregated from other operations
• Higher skilled work leading to pride of workmanship
• Experience and expertise concentrated• Pace of work not dictated by moving line• Less vulnerable to equipment breakdowns

Disadvantages of the Job Shop
• General purpose equipment is slower• Higher direct labor cost• High WIP inventories• High material handling costs• Management control very difficult

The Cell Form
• Combines flexibility of job shop with low costs and short response times of flow shop
• Based on group technology• First identify part families• Then form machine cells to produce part
families

Conversion of a Job Shop Layout to a Cellular Layout
37

Organization of Miscellaneous Parts into Families
38

Advantages of Cellular Production
• Reduced machine setup times– increased capacity– economical to produce in smaller batch sizes– smaller batch sizes result in less WIP– less WIP leads to shorter lead times– shorter lead times increase forecast accuracy
and provide a competitive advantage• Parts produced in one cell

Advantages of Cellular Production continued
• Capitalize on benefits of using worker teams
• Minimal cost to move from job shop to cellular production (e.g. EHC)
• Can move from cellular production to “mini-plants”

Disadvantages of Cellular Production
• Volumes too low to justify highly efficient high volume equipment
• Vulnerable to equipment breakdowns• Balancing work across cells• Does not offer the same high degree of
customization as the job shop

Cellular Layout
• Teams of workers and equipment to produce families of outputs
• Workers cross-trained• Nominal cells versus physical cells.• Remainder cell• Cell formation methods
– production flow analysis

Project Operations
• Large scale• Finite duration• Nonrepetitive• Multiple
interdependent activities
• Offers extremely short reaction times

Product-Process Matrix

Selection of Transformation System by Stage of Life Cycle

Break-Even Analysis
• A standard approach to choosing among alternative processes or equipment
• Model seeks to determine the point in units produced (and sold) where we will start making profit on the process or equipment
• Model seeks to determine the point in units produced (and sold) where total revenue and total cost are equal
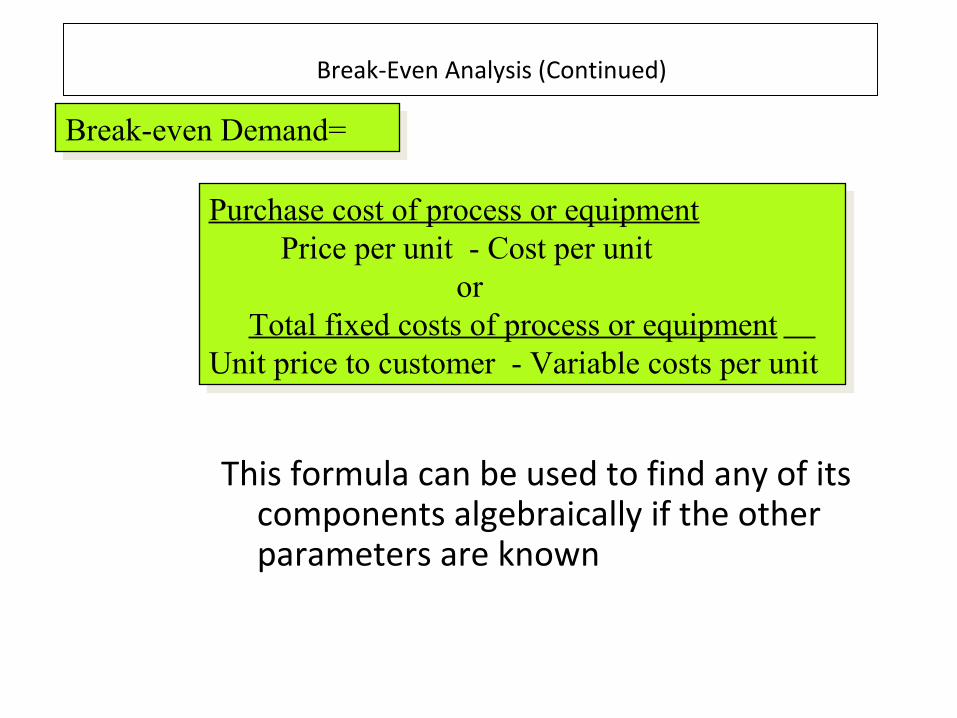
Break-Even Analysis (Continued)
This formula can be used to find any of its components algebraically if the other parameters are known
Break-even Demand=Break-even Demand=
Purchase cost of process or equipment Price per unit - Cost per unit or Total fixed costs of process or equipment Unit price to customer - Variable costs per unit
Purchase cost of process or equipment Price per unit - Cost per unit or Total fixed costs of process or equipment Unit price to customer - Variable costs per unit

Break-Even Analysis (Continued)
Example: Suppose you want to purchase a new computer that will cost $5,000. It will be used to process written orders from customers who will pay $25 each for the service. The cost of labor, electricity and the form used to place the order is $5 per customer. How many customers will we need to serve to permit the total revenue to break-even with our costs?
Break-even Demand: = Total fixed costs of process or equip.
Unit price to customer – Variable costs =5,000/(25-5) =250 customers

Manufacturing Process Flow Design
• A process flow design can be defined as a mapping of the specific processes that raw materials, parts, and subassemblies follow as they move through a plant
• The most common tools to conduct a process flow design include assembly drawings, assembly charts, and operation and route sheets

Example: Assembly Chart (Gozinto) – Plug Assembly
A-2SA-2
4
5
6
7
Lockring
Spacer, detent spring
Rivets (2)
Spring-detent
A-5Component/Assy Operation
Inspection
From Exhibit 7.4From Exhibit 7.4

Service Businesses
• Facilities-based services: Where the customer must go to the service facility
• Field-based services: Where the production and consumption of the service takes place in the customer’s environment
A service business is the management of organizations whose primary business requires interaction with the customer to produce the service

The Customer Centered View
TheCustomer
The ServiceStrategy
ThePeople
TheSystems
A philosophical view that suggests the organization exists to serve the customer, and the systems and the employees exist to facilitate the process of service.
A philosophical view that suggests the organization exists to serve the customer, and the systems and the employees exist to facilitate the process of service.

Service-System Design Matrix
Mail contact
Face-to-faceloose specs
Face-to-facetight specs
PhoneContact
Face-to-facetotal
customization
Buffered core (none)
Permeable system (some)
Reactivesystem (much)
High
LowHigh
Low
Degree of customer/server contact
Internet & on-site
technology
SalesOpportunity
ProductionEfficiency

Characteristics of Workers, Operations, and Innovations Relative to the Degree of Customer/Service Contact

Example of Service Blueprinting
Brushshoes
Applypolish
Failpoint
BuffCollect
payment
Cleanshoes Materials
(e.g., polish, cloth)
Select andpurchasesupplies
Standardexecution time
2 minutes
Total acceptableexecution time
5 minutes
30secs
30secs
45secs
15secs
Wrongcolor wax
Seen bycustomer 45
secs
Line ofvisibility
Not seen bycustomer butnecessary toperformance

Service Fail-safingPoka-Yokes (A Proactive Approach)
• Keeping a mistake from becoming a service defect
• How can we fail-safe the three Ts?
Task
TangiblesTreatment

Three Contrasting Service Designs
The production line approach (ex. McDonald’s)
The self-service approach (ex. automatic teller machines)
The personal attention approach (ex. Ritz-Carlton Hotel Company)
Managing Customer Introduced Variation
•Arrival variability
•Request variability
•Capability variability
•Effort variability
•Subjective preference variability

Accommodation Strategies
• Classic accommodation – extra employees or additional employee skills
• Low cost accommodation – use low cost labor, outsource, self-service
• Classic reduction – more self-service, reservations, adjust expectations
• Uncompromised reduction – develop procedures for good service, minimizing variation impact

Characteristics of a Well-Designed Service System
1. Each element of the service system is consistent with the operating focus of the firm
2. It is user-friendly
3. It is robust
4. It is structured so that consistent performance by its people and systems is easily maintained

Characteristics of a Well-Designed Service System (Continued)
5. It provides effective links between the back office and the front office so that nothing falls between the cracks
6. It manages the evidence of service quality in such a way that customers see the value of the service provided
7. It is cost-effective

Service Guarantees as Design Drivers
• Recent research suggests:– Any guarantee is better than no guarantee– Involve the customer as well as employees in the
design– Avoid complexity or legalistic language– Do not quibble or wriggle when a customer
invokes a guarantee– Make it clear that you are happy for customers to
invoke the guarantee

Business Process Design (Reengineering)

Division of Labor Concept
• Work broken down into its simplest most basic tasks– Performing same task facilitates attaining
greater skill– No time lost switching to another task– Workers well positioned to improve tools
and techniques

Division of Labor Concept continued
• Division of labor concept not challenged until recently despite dramatic changes in technology
• Quality, innovation, service, and value more important than cost, growth, and control

Process
• Set of activities that taken together produce a result of value to the customer
• Organizing on basis of processes– Eliminate delays and errors when work is
handed off– Capture information once and at source– When people closest to process perform
work, there is little need for management overhead

Business Process Design (BPD)
The fundamental rethinking and radical redesign of business processes to bring about dramatic improvements in performance
Hammer, M. and Stanton, S. The Reengineering Revolution, Harper Business, 1995.

Radical
• Profoundly change the way work performed
• Not concerned with making superficial changes
• Get to root• Get rid of old• Reinventing, not improving

Redesign
• BPD is about designing how work is done• Smart, capable, well trained, highly
motivated employees mean little if the way work is performed is poorly designed

Process
• All organizations perform processes• Customers not interested in individual
activities but rather overall results• Few of them are organized on the basis of
processes• Thus, processes tend to go unmanaged• Team approach one way this addressed

Dramatic
• Quantum leaps in performance, not marginal or incremental improvements
• Breakthroughs in performance

IBM Credit Example72

IBM Credit Example continued
• Order logged by 1 of 14 people in conference room
• Carted upstairs to credit department• Information entered into computer to
check borrower’s creditworthiness• Results written on piece of paper

IBM Credit Example continued
• Business practices department modified standard loan covenant in response to customer requests
• Used its own computer system• Pricer keyed data into PC to determine
appropriate interest rate• Administrator converted to quote letter
and Fedexed to field sales rep.

IBM Credit Example continued
• Average time to process a request was 6 days
• Could take as long as 2 weeks• Actual processing time 90 minutes• Deal Structurer– Turnaround time 4 hours– Number of deals processed increased 100 times
with small reduction in head count

Reference
• www.csun.edu• www.crfproject-eu.org• erp.acuvisions.com/ERP01.