mb0050-research methodology (rev)
TRANSCRIPT
8/7/2019 MB0050-RESEARCH METHODOLOGY (rev)
http://slidepdf.com/reader/full/mb0050-research-methodology-rev 1/21

8/7/2019 MB0050-RESEARCH METHODOLOGY (rev)
http://slidepdf.com/reader/full/mb0050-research-methodology-rev 2/21
Research Methodology Answer sheet to
(MB 0050) Assignment Set-1
and their usefulness be evaluated as a basis for further research. In this
way researcher should review and build upon the work already done by
others, but in cases where hypothesis has not been formulated his task is to
review the available material for deriving the relevant hypothesis from it.
Experience Survey:
It is the survey of people who have had practical experience with the survey
to be studied. The object is to obtain insight into the relationship between
variables and new ideas relating to the research problem. For such a survey
people who are competent and can contribute new ideas may be carefully
selected as respondents to ensure representation of different of experience.
The respondents selected can be interviewed by the investigator. Thus, an
experience survey may enable the researcher to define the problem more
concisely and help in formulation of research hypothesis. This survey may
as well provide information about the practical possibilities for doing different
types of research.
Analysis of insight stimulating examples:
This is a fruitful method for suggesting hypothesis for research. It is
particularly suitable in areas where there is little experience to serve as a
guide. It consists of the intensive study of the selected instances of the
phenomenon in which on is interested. For this purpose the existing records
may be examined the unstructured interviewing may take place or some
other approach may be adopted. Attitude of the investigator, the intensity of
the study and the ability of the researcher to draw together diverse
information into a unified interpretation are the main features which makethis method an appropriate procedure for evoking insights.
Page 2 of 21

8/7/2019 MB0050-RESEARCH METHODOLOGY (rev)
http://slidepdf.com/reader/full/mb0050-research-methodology-rev 3/21

8/7/2019 MB0050-RESEARCH METHODOLOGY (rev)
http://slidepdf.com/reader/full/mb0050-research-methodology-rev 4/21
8/7/2019 MB0050-RESEARCH METHODOLOGY (rev)
http://slidepdf.com/reader/full/mb0050-research-methodology-rev 5/21
Research Methodology Answer sheet to
(MB 0050) Assignment Set-1
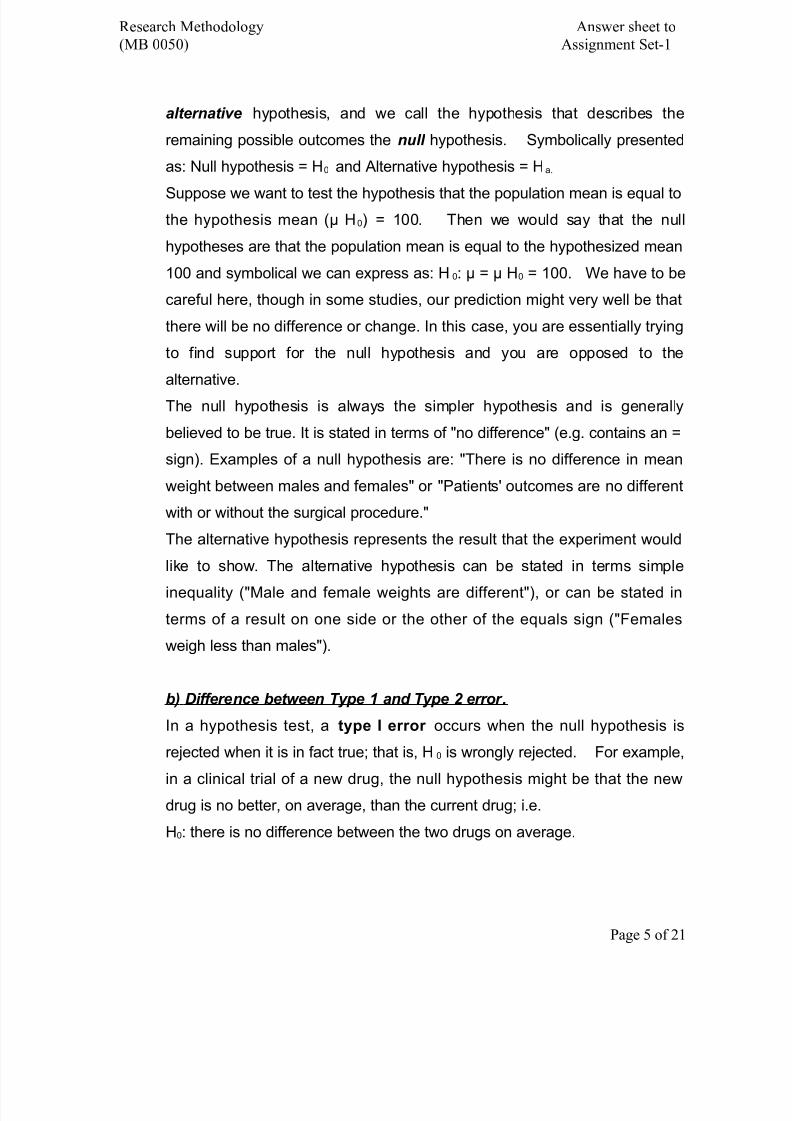
alternative hypothesis, and we call the hypothesis that describes the
remaining possible outcomes the null hypothesis. Symbolically presented
as: Null hypothesis = H0 and Alternative hypothesis = Ha.
Suppose we want to test the hypothesis that the population mean is equal tothe hypothesis mean (µ H0) = 100. Then we would say that the null
hypotheses are that the population mean is equal to the hypothesized mean
100 and symbolical we can express as: H0: µ = µ H0 = 100. We have to be
careful here, though in some studies, our prediction might very well be that
there will be no difference or change. In this case, you are essentially trying
to find support for the null hypothesis and you are opposed to the
alternative.
The null hypothesis is always the simpler hypothesis and is generally
believed to be true. It is stated in terms of "no difference" (e.g. contains an =
sign). Examples of a null hypothesis are: "There is no difference in mean
weight between males and females" or "Patients' outcomes are no different
with or without the surgical procedure."
The alternative hypothesis represents the result that the experiment would
like to show. The alternative hypothesis can be stated in terms simple
inequality ("Male and female weights are different"), or can be stated in
terms of a result on one side or the other of the equals sign ("Females
weigh less than males").
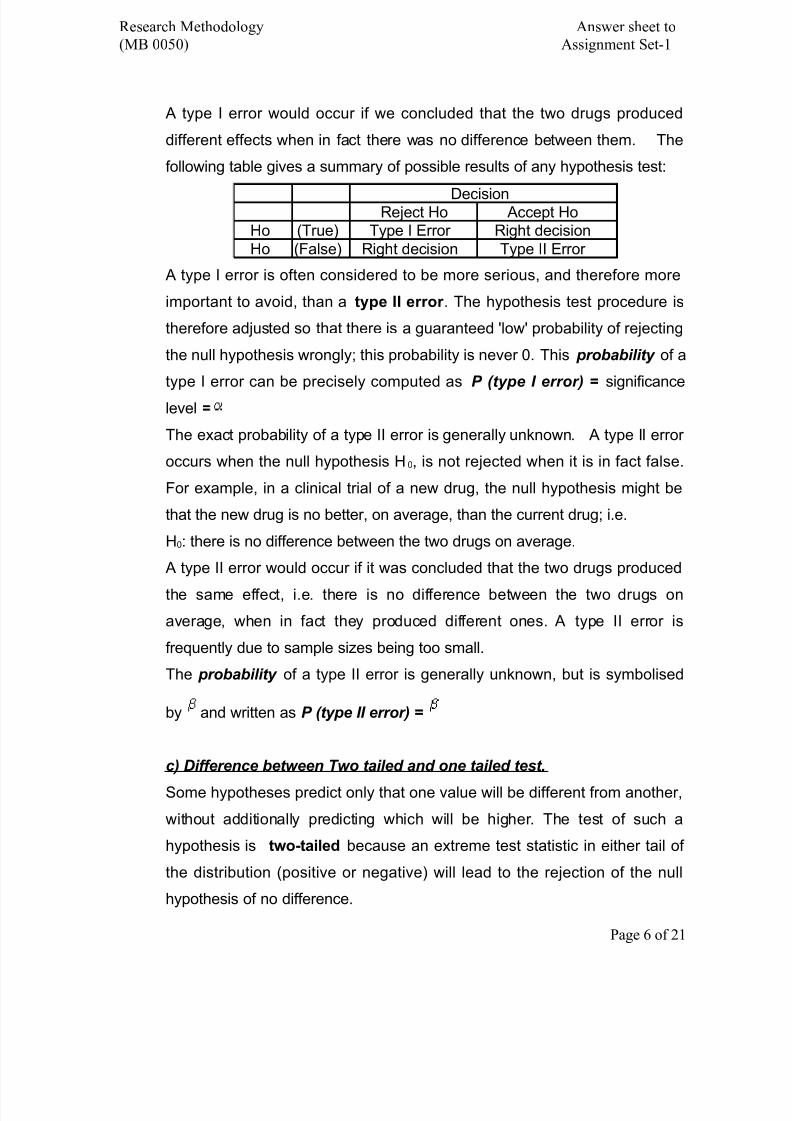
b) Difference between Type 1 and Type 2 error.
In a hypothesis test, a type I error occurs when the null hypothesis is
rejected when it is in fact true; that is, H0 is wrongly rejected. For example,
in a clinical trial of a new drug, the null hypothesis might be that the newdrug is no better, on average, than the current drug; i.e.
H0: there is no difference between the two drugs on average.
Page 5 of 21
8/7/2019 MB0050-RESEARCH METHODOLOGY (rev)
http://slidepdf.com/reader/full/mb0050-research-methodology-rev 6/21

8/7/2019 MB0050-RESEARCH METHODOLOGY (rev)
http://slidepdf.com/reader/full/mb0050-research-methodology-rev 7/21

8/7/2019 MB0050-RESEARCH METHODOLOGY (rev)
http://slidepdf.com/reader/full/mb0050-research-methodology-rev 8/21
8/7/2019 MB0050-RESEARCH METHODOLOGY (rev)
http://slidepdf.com/reader/full/mb0050-research-methodology-rev 9/21
Research Methodology Answer sheet to
(MB 0050) Assignment Set-1
correlation coefficient also assumes normality. While parametric techniques
are robust – that is, they often retain considerable power to detect
differences or similarities even when these assumptions are violated – some
distributions violate the assumptions so markedly that a non-parametricalternative is more likely to detect a difference or similarity.
Non-parametric statistics is a branch of statistics concerned with non-
parametric statistical models and non-parametric inference, including non-
parametric statistical tests. Nonparametric methods are often referred to as
distribution free methods as they do not rely on assumptions that the data
are drawn from a given probability distribution. The term non-parametric
statistic can also refer to a statistic (a function on a sample) whose
interpretation does not depend on the population fitting any parametrized
distributions. Order statistics are one example of such a statistic that plays a
central role in many non-parametric approaches.
Q.3 Explain the difference between a causal relationship and correlation,with an example of each. What are the possible reasons for acorrelation between two variables?
Ans. A relationship refers to the correspondence between two variables. In
correlation research, we do not influence any variables but only measure
them and look for relations between some set of variables, such as blood
pressure and cholesterol level. In experimental research, we manipulate
some variables and then measure the effects of this manipulation on other
variables. For example, a researcher might artificially increase blood
pressure and then record cholesterol level. Data analysis in experimental
research also comes down to calculating "correlations" between variables,
specifically, those manipulated and those affected by the manipulation.
However, experimental data may potentially provide qualitatively better
information: only experimental data can conclusively demonstrate causal
Page 9 of 21
8/7/2019 MB0050-RESEARCH METHODOLOGY (rev)
http://slidepdf.com/reader/full/mb0050-research-methodology-rev 10/21
Research Methodology Answer sheet to
(MB 0050) Assignment Set-1
relations between variables. For example, if we found that whenever we
change variable A then variable B changes, then we can conclude that "A
influences B." Data from correlational research can only be "interpreted" in
causal terms based on some theories that we have, but correlational datacannot conclusively prove causality.
Regardless of their type, two variables are related if the values of those
variables are distributed in a consistent manner. In other words, variables
are related if their values systematically correspond to each other for these
observations. Generally speaking, the ultimate goal of every research or
scientific analysis is to find relations between variables. The philosophy of
science teaches us that there is no other way of representing "meaning"
except in terms of relations between some quantities or qualities; either way
involves relations between variables. Thus, the advancement of science
must always involve finding new relations between variables. Correlational
research involves measuring such relations in the most straightforward
manner. However, experimental research is not any different in this respect.
For example, the above mentioned experiment comparing WCC in males
and females can be described as looking for a correlation between two
variables: Gender and WCC .
The two most elementary formal properties of every relation between
variables are the relation's (a) magnitude or size and (b) its reliability or
truthfulness.
a. The magnitude is much easier to understand and measure than the
reliability. For example, if every male in our sample was found to have a
higher WCC than any female in the sample, we could say that themagnitude of the relation between the two variables (Gender and WCC )
is very high in our sample. In other words, we could predict one based
on the other.
Page 10 of 21
8/7/2019 MB0050-RESEARCH METHODOLOGY (rev)
http://slidepdf.com/reader/full/mb0050-research-methodology-rev 11/21
Research Methodology Answer sheet to
(MB 0050) Assignment Set-1
b. The reliability of a relation is a much less intuitive concept, but still
extremely important. It pertains to the "representativeness" of the result
found in our specific sample for the entire population. In other words, it
says how probable it is that a similar relation would be found if theexperiment was replicated with other samples drawn from the same
population.
Q.4 Briefly explain any two factors that affect the choice of a sampling technique. What are the characteristics of a good sample?
Ans. The researcher has to first identify the limiting factor or factors and must
judiciously balance the conflicting factors. There are various factors that
affect the choice of the sampling technique:
1. Purpose of the Survey
2. Measurability
3. Degree of Precision
4. Information about Population
5. The Nature of the Population
6. Geographical Area of the Study and the Size of the Population
7. Financial resources
8. Time Limitation
9. Economy
Out of above, we can discuss two important factors as follows.
1. Purpose of the Survey: What does the researcher aim at? If he intends
to generalize the findings based on the sample survey to the population,then an appropriate probability sampling method must be selected. The
choice of a particular type of probability sampling depends on the
geographical area of the survey and the size and the nature of the
population under study.
Page 11 of 21

8/7/2019 MB0050-RESEARCH METHODOLOGY (rev)
http://slidepdf.com/reader/full/mb0050-research-methodology-rev 12/21
Research Methodology Answer sheet to
(MB 0050) Assignment Set-1
2. Information about Population: How much information is available
about the population to be studied? Where no list of population and no
information about its nature are available, it is difficult to apply aprobability sampling method. Then exploratory study with non-probability
sampling may be made to gain a better idea of population. After gaining
sufficient knowledge about the population through the exploratory study,
appropriate probability sampling design may be adopted.
The characteristics of a Good Sample are Representativeness, Accuracy,
Precision & Size.
Representativeness: a sample must be representative of the
population. Probability sampling technique yield representative sample.
Accuracy: accuracy is defined as the degree to which bias is absent
from the sample. An accurate sample is the one which exactly
represents the population.
Precision: the sample must yield precise estimate. Precision is
measured by standard error.
Size: a good sample must be adequate in size in order to be reliable.
Q 5. Select any topic for research and explain how you will use bothsecondary and primary sources to gather the required information.
Ans. The search for answers to research questions is called collection of data.
Data are facts, and other relevant materials, past and present, serving as
bases for study and analyses. The data needed for a social science
research may be broadly classified into (a) Data pertaining to human
beings, (b) Data relating to organization and (c) Data pertaining to territorial
areas.
Page 12 of 21

8/7/2019 MB0050-RESEARCH METHODOLOGY (rev)
http://slidepdf.com/reader/full/mb0050-research-methodology-rev 13/21
Research Methodology Answer sheet to
(MB 0050) Assignment Set-1
Primary Sources of Data
Primary sources are original sources from which the researcher directly
collects data that have not been previously collected e.g.., collection of data
directly by the researcher on brand awareness, brand preference, brandloyalty and other aspects of consumer behaviour from a sample of
consumers by interviewing them,. Primary data are first hand information
collected through various methods such as observation, interviewing,
mailing etc.
Advantage of Primary Data
• It is original source of data
• It is possible to capture the changes occurring in the course of time.
• It flexible to the advantage of researcher.
• Extensive research study is based of primary data
Disadvantage of Primary Data
o Primary data is expensive to obtain
o It is time consuming
o It requires extensive research personnel who are skilled.
o It is difficult to administer.
Use of primary sources for Collecting Data
Primary data are directly collected by the researcher from their original
sources. In this case, the researcher can collect the required date precisely
according to his research needs, he can collect them when he wants them
and in the form he needs them. But the collection of primary data is costly
and time consuming. Yet, for several types of social science research
required data are not available from secondary sources and they have to be
directly gathered from the primary sources.
In such cases where the available data are inappropriate, inadequate or
obsolete, primary data have to be gathered. They include: socio economic
surveys, social anthropological studies of rural communities and tribal
Page 13 of 21

8/7/2019 MB0050-RESEARCH METHODOLOGY (rev)
http://slidepdf.com/reader/full/mb0050-research-methodology-rev 14/21
Research Methodology Answer sheet to
(MB 0050) Assignment Set-1
communities, sociological studies of social problems and social institutions.
Marketing research, leadership studies, opinion polls, attitudinal surveys,
readership, radio listening and T.V. viewing surveys, knowledge-awareness
practice (KAP) studies, farm managements studies, business managementstudies etc.
There are various methods of data collection. A ‘Method’ is different from a
‘Tool’ while a method refers to the way or mode of gathering data, a tool is
an instruments used for the method. For example, a schedule is used for
interviewing. The important methods are
(a) observation, (b) interviewing, (c) mail survey, (d) experimentation,
(e) simulation and (f) projective technique. Each of these methods is
discussed in detail in the subsequent sections in the later chapters.
Use of secondary sources for Collecting Data
These are sources containing data which have been collected and
compiled for another purpose. The secondary sources consists of readily
compendia and already compiled statistical statements and reports whose
data may be used by researchers for their studies e.g., census reports ,
annual reports and financial statements of companies, Statistical statement,
Reports of Government Departments, Annual reports of currency and
finance published by the Reserve Bank of India, Statistical statements
relating to Co-operatives and Regional Banks, published by the NABARD,
Reports of the National sample survey Organization, Reports of trade
associations, publications of international organizations such as UNO, IMF,
World Bank, ILO, WHO, etc., Trade and Financial journals newspapers etc.
Secondary sources consist of not only published records and reports, butalso unpublished records. The latter category includes various records and
registers maintained by the firms and organizations, e.g., accounting and
financial records, personnel records, register of members, minutes of
meetings, inventory records etc.
Page 14 of 21
8/7/2019 MB0050-RESEARCH METHODOLOGY (rev)
http://slidepdf.com/reader/full/mb0050-research-methodology-rev 15/21
Research Methodology Answer sheet to
(MB 0050) Assignment Set-1
Features of Secondary Sources
Though secondary sources are diverse and consist of all sorts of materials,
they have certain common characteristics.
First, they are readymade and readily available, and do not require thetrouble of constructing tools and administering them.
Second, they consist of data which a researcher has no original control over
collection and classification. Both the form and the content of secondary
sources are shaped by others. Clearly, this is a feature which can limit the
research value of secondary sources.
Finally, secondary sources are not limited in time and space. That is, the
researcher using them need not have been present when and where they
were gathered.
Use of Secondary Data
The second data may be used in three ways by a researcher. First, some
specific information from secondary sources may be used for reference
purpose. For example, the general statistical information in the number of
co-operative credit societies in the country, their coverage of villages, their
capital structure, volume of business etc., may be taken from published
reports and quoted as background information in a study on the evaluation
of performance of cooperative credit societies in a selected district/state.
Second, secondary data may be used as bench marks against which the
findings of research may be tested, e.g., the findings of a local or regional
survey may be compared with the national averages; the performance
indicators of a particular bank may be tested against the corresponding
indicators of the banking industry as a whole; and so on.Finally, secondary data may be used as the sole source of information for a
research project. Such studies as securities Market Behaviour, Financial
Analysis of companies, Trade in credit allocation in commercial banks,
sociological studies on crimes, historical studies, and the like, depend
Page 15 of 21

8/7/2019 MB0050-RESEARCH METHODOLOGY (rev)
http://slidepdf.com/reader/full/mb0050-research-methodology-rev 16/21
Research Methodology Answer sheet to
(MB 0050) Assignment Set-1
primarily on secondary data. Year books, statistical reports of government
departments, report of public organizations of Bureau of Public Enterprises,
Censes Reports etc, serve as major data sources for such research studies.
Advantages of Secondary Data
Secondary sources have some advantages:
1. Secondary data, if available can be secured quickly and cheaply.
Once their source of documents and reports are located, collection of
data is just matter of desk work. Even the tediousness of copying the
data from the source can now be avoided, thanks to Xeroxing facilities.
2. Wider geographical area and longer reference period may be
covered without much cost. Thus, the use of secondary data extends the
researcher’s space and time reach.
3. The use of secondary data broadens the data base from which
scientific generalizations can be made.
4. Environmental and cultural settings are required for the study.
5. The use of secondary data enables a researcher to verify the
findings bases on primary data. It readily meets the need for additional
empirical support. The researcher need not wait the time when additional
primary data can be collected.
Disadvantages of Secondary Data
The use of a secondary data has its own limitations.
1. The most important limitation is the available data may not meet
our specific needs. The definitions adopted by those who collected those
data may be different; units of measure may not match; and time periodsmay also be different.
2. The available data may not be as accurate as desired. To assess
their accuracy we need to know how the data were collected.
Page 16 of 21
8/7/2019 MB0050-RESEARCH METHODOLOGY (rev)
http://slidepdf.com/reader/full/mb0050-research-methodology-rev 17/21
Research Methodology Answer sheet to
(MB 0050) Assignment Set-1
3. The secondary data are not up-to-date and become obsolete
when they appear in print, because of time lag in producing them. For
example, population census data are published tow or three years later
after compilation, and no new figures will be available for another tenyears.
4. Finally, information about the whereabouts of sources may not be
available to all social scientists. Even if the location of the source is
known, the accessibility depends primarily on proximity. For example,
most of the unpublished official records and compilations are located in
the capital city, and they are not within the easy reach of researchers
based in far off places.
Q 6. Case Study: You are engaged to carry out a market survey on behalf of a leading Newspaper that is keen to increase its circulation inBangalore City, in order to ascertain reader habits and interests.Develop a title for the study, define the research problem and theobjectives or questions to be answered by the study.
Ans: Title of the study: Choices in reading Newspaper.
Research problem: A research problem is the situation that causes theresearcher to feel apprehensive, confused and ill at ease. It is the
demarcation of a problem area within a certain context involving the WHO
or WHAT, the WHERE, the WHEN and the WHY of the problem situation.
There are many problem situations that may give rise to research. Three
sources usually contribute to problem identification. Own experience or the
experience of others may be a source of problem supply. A second source
could be scientific literature. You may read about certain findings andnotice that a certain field was not covered. This could lead to a research
problem. Theories could be a third source. Shortcomings in theories could
be researched.
Page 17 of 21
8/7/2019 MB0050-RESEARCH METHODOLOGY (rev)
http://slidepdf.com/reader/full/mb0050-research-methodology-rev 18/21
Research Methodology Answer sheet to
(MB 0050) Assignment Set-1
Research can thus be aimed at clarifying or substantiating an existing
theory, at clarifying contradictory findings, at correcting a faulty
methodology, at correcting the inadequate or unsuitable use of statistical
techniques, at reconciling conflicting opinions, or at solving existing practicalproblems.
Types of questions to be asked :For more than 35 years, the news about
newspapers and young readers has been mostly bad for the newspaper
industry. Long before any competition from cable television or Nintendo,
American newspaper publishers were worrying about declining readership
among the young.
As early as 1960, at least 20 years prior to Music Television (MTV) or the
Internet, media research scholars1 began to focus their studies on young
adult readers' decreasing interest in newspaper content. The concern over a
declining youth market preceded and perhaps foreshadowed today's fretting
over market penetration. Even where circulation has grown or stayed stable,
there is rising concern over penetration, defined as the percentage of
occupied households in a geographic market that are served by a
newspaper.2 Simply put, population growth is occurring more rapidly than
newspaper readership in most communities.
This study looks at trends in newspaper readership among the 18-to-34 age
group and examines some of the choices young adults make when reading
newspapers.
One of the underlying concerns behind the decline in youth newspaper
reading is the question of how young people view the newspaper. A number
of studies explored how young readers evaluate and use newspaper
content.
Page 18 of 21

8/7/2019 MB0050-RESEARCH METHODOLOGY (rev)
http://slidepdf.com/reader/full/mb0050-research-methodology-rev 19/21

8/7/2019 MB0050-RESEARCH METHODOLOGY (rev)
http://slidepdf.com/reader/full/mb0050-research-methodology-rev 20/21

8/7/2019 MB0050-RESEARCH METHODOLOGY (rev)
http://slidepdf.com/reader/full/mb0050-research-methodology-rev 21/21