may 2021 investor presentation - american axle
TRANSCRIPT

May 2021 Investor Presentation
Forward-Looking Statements
2
This supplemental information contains forward-looking statements within the meaning of the Private Securities Litigation Reform Act of 1995. These forward-looking statements involve certain risks and uncertainties that could cause actual results to differ materially from those expressed or implied by these statements. These risks and uncertainties include uncertainty around the duration and effects of the COVID-19 pandemic, and include factors detailed in the reports we file with the SEC, including those described under “Risk Factors” in our most recent Annual Report on Form 10-K and our Quarterly Reports on Form 10-Q. These forward-looking statements speak only as of the date of this communication. We expressly disclaim any obligation or undertaking to disseminate any updates or revisions to any forward-looking statement contained herein to reflect any change in our expectations with regard thereto or any change in events, conditions or circumstances on which any such statement is based.
It should also be noted that this information contains certain financial measures, including Adjusted EBITDA, Adjusted Earnings per Share, Adjusted Free Cash Flow, Net Leverage Ratio and Liquidity that are not required by, or presented in accordance with, accounting principles generally accepted in the United States, or GAAP. These measures are presented here to provide additional useful measurements to review our operations, provide transparency to investors and enable period-to-period comparability of financial performance. A description of non-GAAP financial measures that we use to evaluate our operations and financial performance, and reconciliation of these non-GAAP financial measures to the most directly comparable financial measures calculated and reported in accordance with GAAP, can be found in the appendix under “Reconciliation of Non-GAAP Measures”.

Agenda
3
▪ AAM Overview
▪ ESG Update
▪ Electrification Product Technology

AAM Overview

We Are AAM
As a leading, global tier 1 automotive supplier,
AAM designs, engineers and manufactures
driveline and metal forming technologies that are making the
next generation of vehicles smarter, lighter, safer and more
efficient
AAM delivers POWER that moves the world
through world-class quality, technology leadership and
operational excellence 16ENGINEERING CENTERS
Over
60MANUFACTURING
FACILITIES
17COUNTRIES
2020 SALES
$4.7B
≈20,000ASSOCIATES
Nearly
80LOCATIONS
5

Business Units and Market Leadership
DRIVELINE METAL FORMING
• 2020 Sales: $3.6B
• A Global Leader in
• Full-size pickup truck and SUV
driveline systems
• AWD systems for crossover vehicles
• Damped gears, viscous dampers and
rubber isolation pulleys
• Pioneer of disconnecting AWD Systems
• One of the leaders in hybrid and electric
driveline solutions
• 2020 Sales: $1.1B
• Largest automotive forger in the
world
• A Global Leader in
• Powdered metal connecting rods
• Differential gears
• Axle shafts
• Hypoid pinions
• Ring gears
• Transmission gears
• CVT pulleys
• Aluminum valve bodies
*Note: Market leadership based on company estimates as compared to other independent supplier., business unit sales are after intercompany sales of approximately $0.4 billion.
6

2020 AAM Highlights
Recognized as GM
Supplier of the Year
for Fourth Year
in a Row
BITDA*
Continued Strong
Free Cash Flow
Generation and
Debt Reduction
Published
Comprehensive
Sustainability Report
Launched First
China eDrive
Program at our
Liuzhou AAM JV
Received Silver
Quality Award at
Ford’s World
Excellence Awards
Won Both PACE
Partnership and
Innovation Awards
for Electric Drive
Technology
Implemented
Significant Cost
Savings Actions to
Adjust to New
Market Demand
Formed Technical
Agreement with
Inovance Automotive
and Awarded Multiple
New Electrification
Programs in China
Secured Next
Generation Ram
Heavy Duty Axle and
Driveshaft program
7
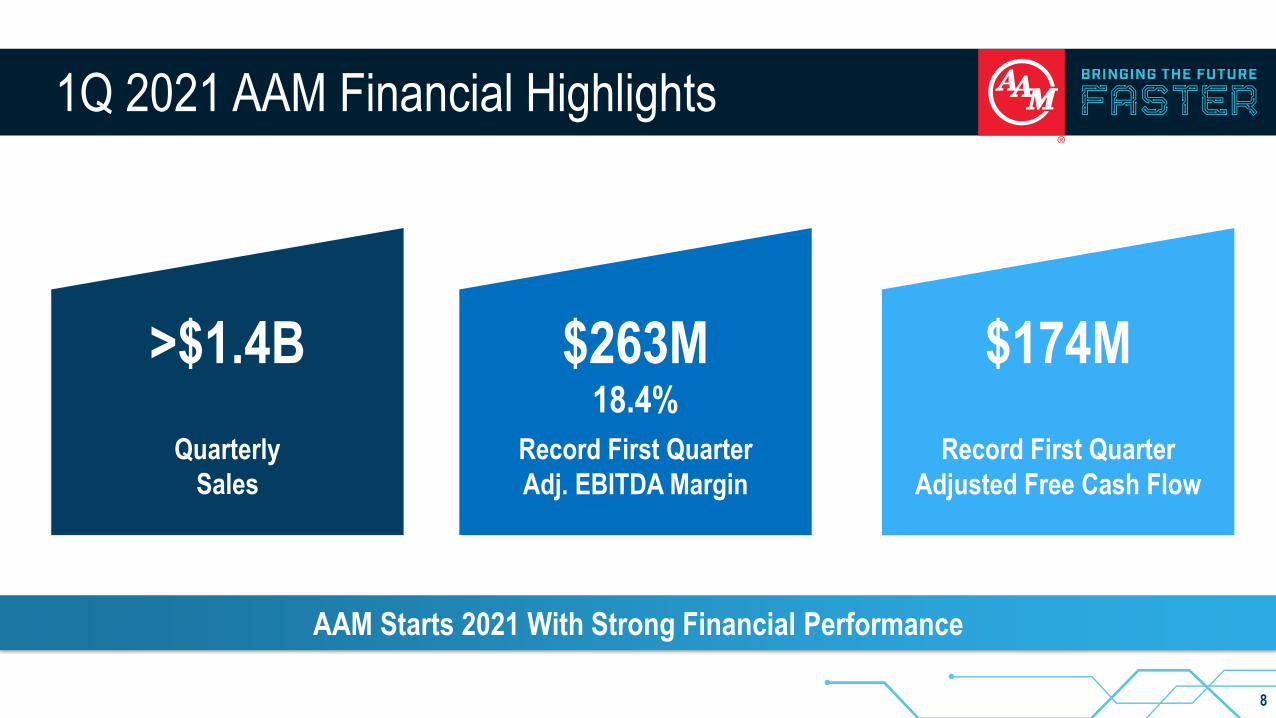
1Q 2021 AAM Financial Highlights
8
Quarterly
Sales
>$1.4B $174M
Record First Quarter
Adjusted Free Cash Flow
$263M18.4%
Record First Quarter
Adj. EBITDA Margin
AAM Starts 2021 With Strong Financial Performance

Business Update
9
AAM has been named as the sole-supplier of front and rear pickup axles for
GM’s Oshawa truck plant.
AAM is supplying both air-cooled and liquid-cooled Power Transfer
Units (PTU) for the all-new Ford Bronco Sport.
AAM and REE have agreed to jointly develop an exciting new electric propulsion
system for e-Mobility.
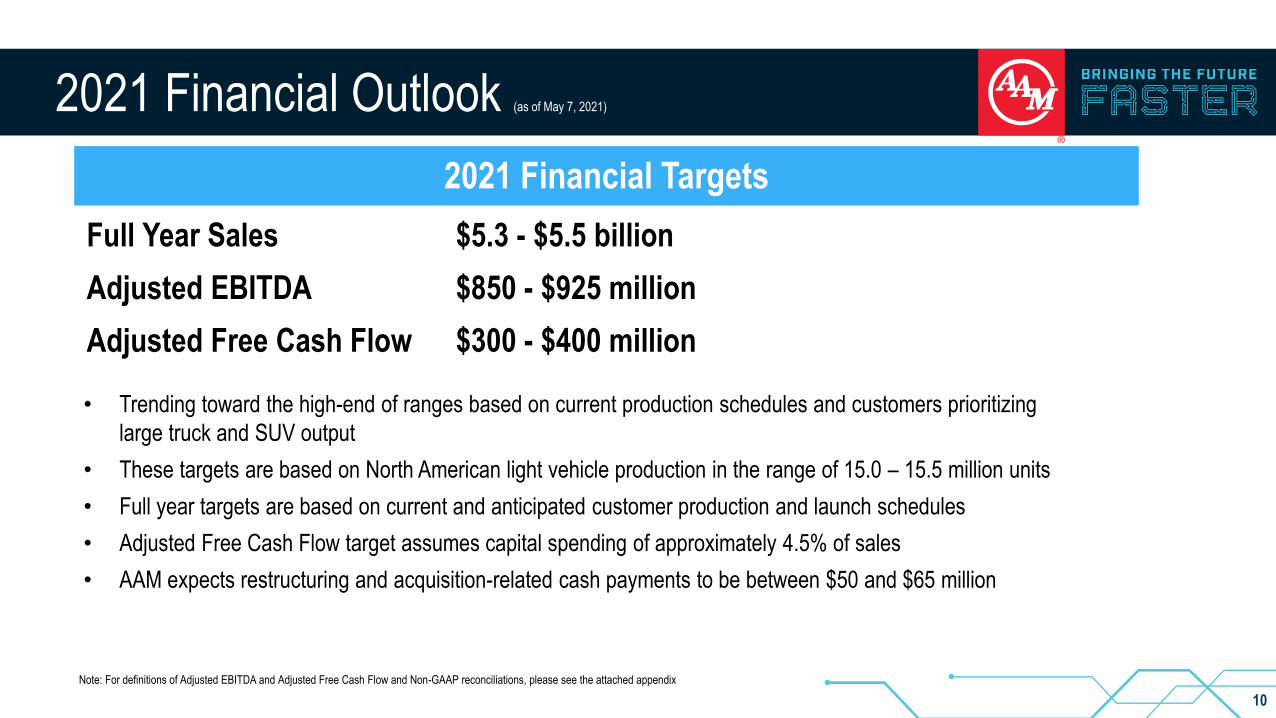
2021 Financial Outlook (as of May 7, 2021)
10
2021 Financial Targets
Full Year Sales $5.3 - $5.5 billion
Adjusted EBITDA $850 - $925 million
Adjusted Free Cash Flow $300 - $400 million
• Trending toward the high-end of ranges based on current production schedules and customers prioritizing
large truck and SUV output
• These targets are based on North American light vehicle production in the range of 15.0 – 15.5 million units
• Full year targets are based on current and anticipated customer production and launch schedules
• Adjusted Free Cash Flow target assumes capital spending of approximately 4.5% of sales
• AAM expects restructuring and acquisition-related cash payments to be between $50 and $65 million
Note: For definitions of Adjusted EBITDA and Adjusted Free Cash Flow and Non-GAAP reconciliations, please see the attached appendix

Environment, Social, and Governance

Sustainability UpdateIn 2021, AAM published a comprehensive sustainability report with the reporting framework based
on SASB, GRI, and TCFD standards
In a survey conducted by
Institutional Investor, our
Financially Material ESG
Disclosures were ranked
1st out of 80+ nominated
Small-cap Consumer
companies*
12*For our 2019 sustainability report

Sustainability Leadership and Oversight
AAM's sustainability program is managed within a well-defined governance structure, through clearly-
established ownership and responsibilities at multiple levels in the organization.
13

Sustainability: Key Areas of Focus
Our cross-functional team of subject matter experts considered Global Reporting Initiative (GRI) standards,
industry-specific standards of the Sustainability Accounting Standards Board (SASB) and the United Nations
Sustainable Development Goals to prioritize sustainability topics and develop performance indicators
14
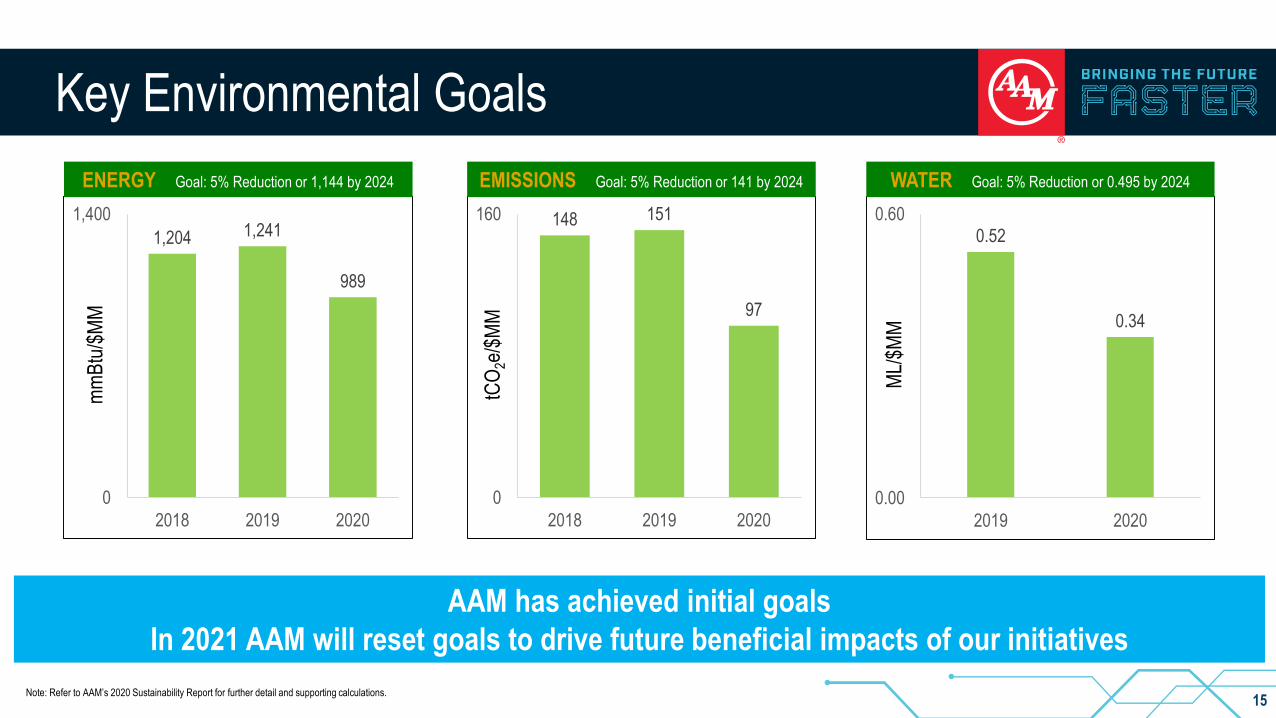
Key Environmental Goals
AAM has achieved initial goals
In 2021 AAM will reset goals to drive future beneficial impacts of our initiatives
15
0.52
0.34
0.00
0.60
2019 2020
ML/
$MM
WATER Goal: 5% Reduction or 0.495 by 2024
148 151
97
0
160
2018 2019 2020
tCO
2e/$
MM
EMISSIONS Goal: 5% Reduction or 141 by 2024
1,204 1,241
989
0
1,400
2018 2019 2020
mm
Btu
/$M
M
ENERGY Goal: 5% Reduction or 1,144 by 2024
Note: Refer to AAM’s 2020 Sustainability Report for further detail and supporting calculations.
Electrification Product Technology

Electrification Addressable Market
*Note: Total global addressable markets is based on electric drive unit install rates across various propulsion types
Source: IHS estimates and internal calculations
AAM anticipates the addressable sourcing market at
~$18-20 billion by 2030
▪ This includes electric drive units, subsystems and components
▪ We offer solutions for various OEM go-to-market strategies for electric vehicles
▪ Our technology is a key differentiator
▪ We expect the market to grow past 2030
AAM’s Competitive Advantage
Global Size
& Scale
Operational
Excellence
Technology
Leadership
Broad Product
Portfolio
Integration
Experience
Technical
Partnerships
17

Significant Content Opportunity
Customer In-House Support Customer Outsourced Support
Components Electric Drive Units Vehicle Integration & Controls
AAM is Positioned to Support All OEM Sourcing Strategies
Subsystems Gearboxes
AAM CPV: Up to $500 AAM CPV: Up to $2,500+
18
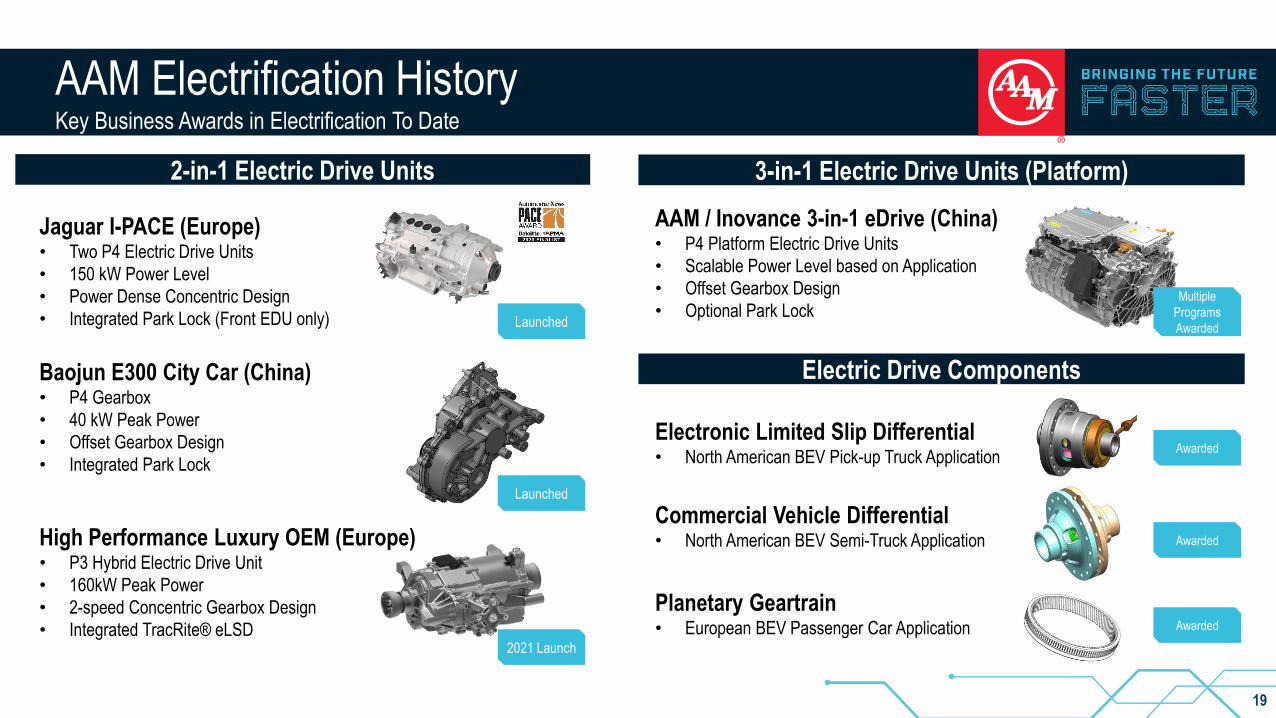
AAM Electrification HistoryKey Business Awards in Electrification To Date
AAM / Inovance 3-in-1 eDrive (China)• P4 Platform Electric Drive Units
• Scalable Power Level based on Application
• Offset Gearbox Design
• Optional Park Lock
Electronic Limited Slip Differential• North American BEV Pick-up Truck Application
Planetary Geartrain• European BEV Passenger Car Application
2-in-1 Electric Drive Units 3-in-1 Electric Drive Units (Platform)
Multiple
Programs
Awarded
Electric Drive Components
High Performance Luxury OEM (Europe)• P3 Hybrid Electric Drive Unit
• 160kW Peak Power
• 2-speed Concentric Gearbox Design
• Integrated TracRite® eLSD
Jaguar I-PACE (Europe)• Two P4 Electric Drive Units
• 150 kW Power Level
• Power Dense Concentric Design
• Integrated Park Lock (Front EDU only)
Baojun E300 City Car (China)• P4 Gearbox
• 40 kW Peak Power
• Offset Gearbox Design
• Integrated Park Lock
Launched
Launched
2021 Launch
Awarded
Awarded
Awarded
Commercial Vehicle Differential• North American BEV Semi-Truck Application
19

AAM Technology/Partnerships/Launches
▪ Technical advancement of fully integrated 3-in-1 EDUs
▪ Access to the largest BEV Market (China)
▪ High value power electronics
▪ Multiple programs awarded via partnership
▪ Invested In REE Automotive
▪ Electric platform leader reinventing e-mobility
▪ Integrates traditional vehicle components in the arch
of the wheel
▪ Allowing for flat and modular electric platforms
▪ Highly integrated advanced 3-in-1 technology
▪ Substantial improvement over currently available units
▪ World class efficiency and NVH
▪ AAM proprietary motor, invertor, and gear technology
Next Generation Drive Units
▪ Rear e-Drive units for European high performance
hybrid passenger car (multiple variants)
▪ Multiple program launches in China
▪ Multiple electric powertrain component launches on
multiple vehicle segments including electric pick-up
truck and commercial vehicle
Key Launches
20

AAM – REE Joint Development Agreement
▪ AAM and REE intend to incorporate AAM’s next
generation of high-speed electric drive units, which
feature a fully integrated high-speed motor and
inverter, into REE’s highly modular and disruptive
REEcornerTM technology.
▪ The REEcorner integrates critical vehicle chassis
systems (propulsion, steering, braking, suspension,
and controls) into a module that sits in-between the
vehicle sub-frame and wheel to provide additional
space for battery storage, enabling greater vehicle
range.
▪ AAM’s electric drive technology enables REE’s
integration of these chassis systems into the
REEcorner module based on its industry leading
power density and compact design.Development is expected to occur at AAM’s Advanced Technology and Development
Center in Detroit with delivery of prototypes planned by the end of 2021
21

AAM / Inovance Technical Partnership
▪ Inovance Overview– Leading Independent Traction Inverter Supplier in China
– Portfolio of Electric Propulsion ProductsInverters, Motors, DC/DC Converters, On-Board Chargers, 3-in-1 Electric Drive Units
– Strong Technical Team with Full Development Capability
– Competitive and Vertically Integrated Manufacturing Footprint
▪ Multiple Programs Awarded via Partnership
Partnership Accelerates Development of Next Generation Fully Integrated
3-in-1 EDUs and Increased Access to the largest BEV Market22

WLTP Consumption [Whr/Km]
CLTC-P Consumption [Whr/Km]
EPA Consumption [Whr/Km]
Price / kW
Price / Output NmkW / kg
Output Nm / kg
kW / L
Output Nm / L
Benchmark AAM Gen 5
AAM Next Generation Electric Drive
23
AAM’s Next Generation Electric Drive exceeds
widely recognized industry benchmark in terms of critical EDU attributes
Outside: Best
Inside: Worst
Packaging
Price
Efficiency
Mass AAM Next Generation Electric Drive Units Deliver Compelling Performance
Market Critical Attributes
Strong Value Proposition
>10%Improvement in
Mass Efficiency
>40%Improvement in
Volumetric
Efficiency
>40%Improvement in
Power Density
>10%Reduced Power
Loss, More
Range

Scalable & Modular Platform
AAM’s Next Generation Scalable & Modular Electric Drive Units support numerous
vehicle applications while optimizing capital and development costs
Scalable Power Levels Modular Motor Construction Various EDU Architectures Multiple Gear RatiosOptional Torque
Vectoring & Disconnect
Dual Motor Light Duty Beam Heavy Duty BeamWheel EndSingle Motor
P4 AWD MPV ARCHITECTUREP4 SPLIT AXLE HYBRID ARCHITECTURE P4 RWD ARCHITECTUREP3 HYBRID ARCHITECTURE
P4 4WD HD ARCHITECTUREP4 AWD ARCHITECTURE P4 4WD ARCHITECTUREP4 FWD ARCHITECTURE
P4 AWD ARCHITECTURE
Denotes AAM EDU application 24

Well positioned to
support all OEM sourcing
strategies leveraging our
strengths in software,
integration, and
manufacturing
Electrification Summary
Proven electric drive
systems design and
integration capabilities
in production
Highly integrated product
technology resulting in
improved power density,
value, and efficiency
Next generation
electric drive system is
positioning us
for continued
profitable growth
Strategic partnerships to
further accelerate the
development and delivery
of scalable, next-
generation 3-in-1 electric
drive systems
Global reach and
scalable product portfolio
to serve all segments and
major markets
25
Supplemental Data
Reconciliation of Non-GAAP Measures
27
In addition to the results reported in accordance with accounting principles generally accepted in the United States of America (GAAP) included within this presentation, we have provided certain information, which includes non-GAAP financial measures. Such information is reconciled to its closest GAAP measure in accordance with Securities and Exchange Commission rules and is included in the following slides.
Certain of the forward-looking financial measures included in this earnings release are provided on a non-GAAP basis. A reconciliation of non-GAAP forward-looking financial measures to the most directly comparable forward-looking financial measures calculated and presented in accordance with GAAP has been provided. The amounts in these reconciliations are based on our current estimates and actual results may differ materially from these forward-looking estimates for many reasons, including potential event driven transactional and other non-core operating items and their related effects in any future period, the magnitude of which may be significant.
Supplemental Data
28
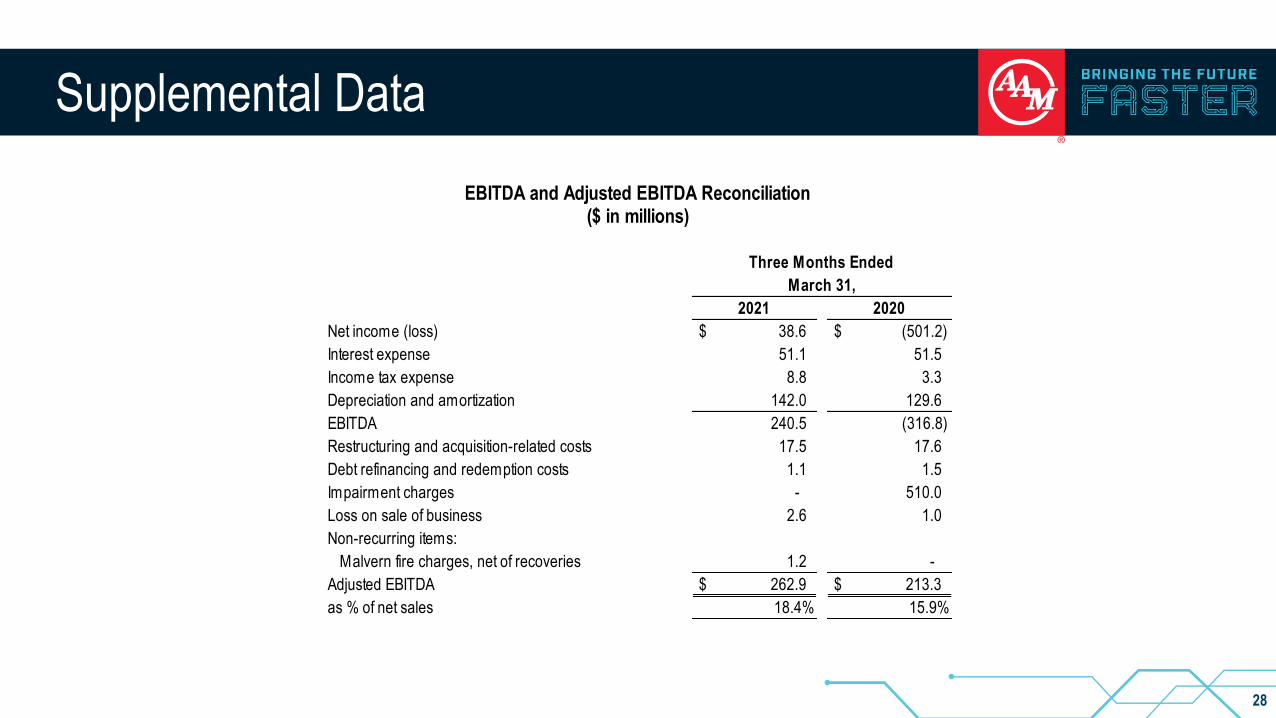
2021 2020
Net income (loss) $ 38.6 $ (501.2)
Interest expense 51.1 51.5
Income tax expense 8.8 3.3
Depreciation and amortization 142.0 129.6
EBITDA 240.5 (316.8)
Restructuring and acquisition-related costs 17.5 17.6
Debt refinancing and redemption costs 1.1 1.5
Impairment charges - 510.0
Loss on sale of business 2.6 1.0
Non-recurring items:
Malvern fire charges, net of recoveries 1.2 -
Adjusted EBITDA $ 262.9 $ 213.3
as % of net sales 18.4% 15.9%
Three Months Ended
March 31,
EBITDA and Adjusted EBITDA Reconciliation($ in millions)

Supplemental Data
29*Please refer to definition of Non-GAAP measures
2021 2020
Diluted earnings (loss) per share $ 0.33 $ (4.45)
Restructuring and acquisition-related costs 0.15 0.16
Debt refinancing and redemption costs 0.01 0.01
Loss on sale of business 0.02 0.01
Impairment charges - 4.53
Accelerated depreciation* 0.09 0.06
Non-recurring items:
Malvern fire charges, net of recoveries 0.01 -
Tax adjustments related to the CARES Act - (0.07)
Tax effect of adjustments (0.04) (0.04)
Adjustment for anti-dilutive effect - (0.01)
Adjusted earnings per share $ 0.57 $ 0.20
Three Months Ended
March 31,
Adjusted Earnings Per Share Reconciliation

Supplemental Data
30
2021 2020
Net cash provided by operating activities $ 179.1 $ 139.4
Less: Capital expenditures net of proceeds from sale of property, plant
and equipment (39.6) (69.2)
Free cash flow 139.5 70.2
Cash payments for restructuring and acquisition-related costs 23.4 13.1
Cash payments related to the Malvern fire net of recoveries 11.2 -
Adjusted free cash flow $ 174.1 $ 83.3
Three Months Ended
March 31,
Free Cash Flow and Adjusted Free Cash Flow Reconciliation($ in millions)

Supplemental Data
31
March 31,
2021
Current portion of long-term debt $ 13.7
Long-term debt, net 3,360.9
Total debt, net 3,374.6
Less: Cash and cash equivalents 601.2
Net debt at end of period 2,773.4
Adjusted LTM EBITDA $ 769.4
Net Leverage Ratio 3.6x
Net Debt and Net Leverage Ratio($ in millions)
Supplemental Data
32
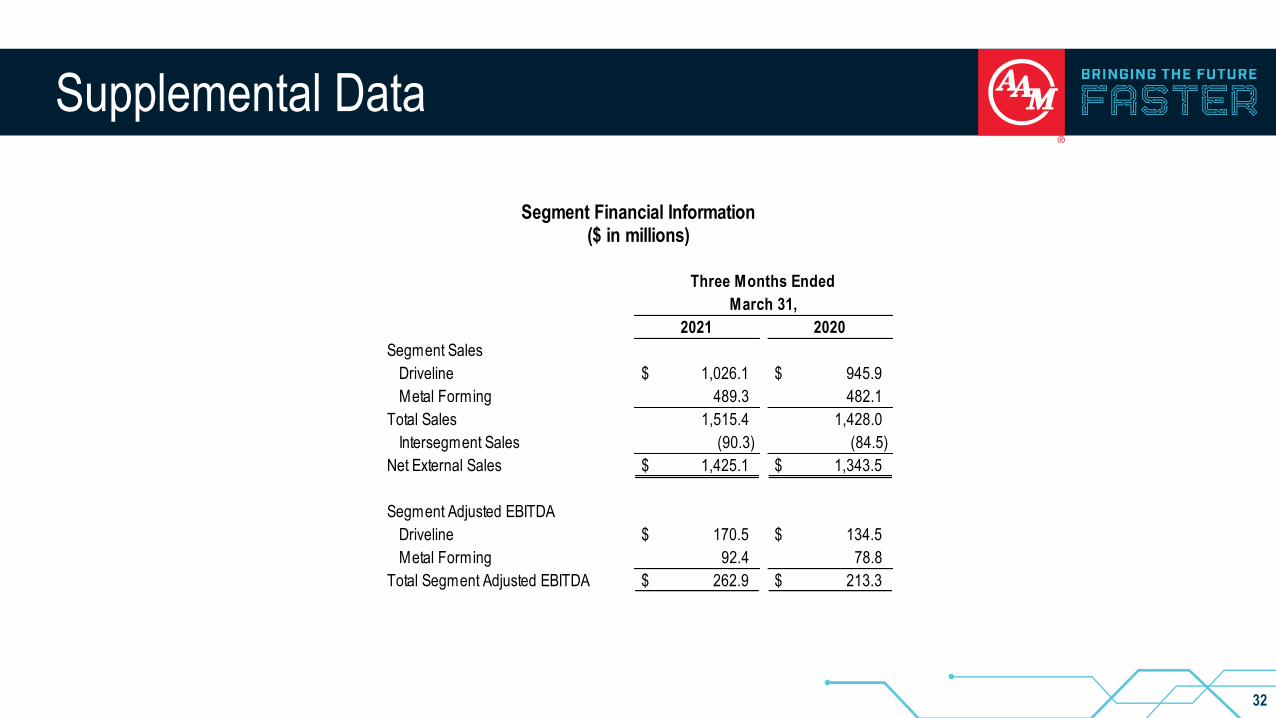
2021 2020
Segment Sales
Driveline $ 1,026.1 $ 945.9
Metal Forming 489.3 482.1
Total Sales 1,515.4 1,428.0
Intersegment Sales (90.3) (84.5)
Net External Sales $ 1,425.1 $ 1,343.5
Segment Adjusted EBITDA
Driveline $ 170.5 $ 134.5
Metal Forming 92.4 78.8
Total Segment Adjusted EBITDA $ 262.9 $ 213.3
Three Months Ended
March 31,
Segment Financial Information($ in millions)

Supplemental Data
33
Low End High End
Net income $ 40 $ 100
Interest expense 200 200
Income tax expense 10 25
Depreciation and amortization 530 530
Full year 2021 targeted EBITDA 780 855
Restructuring and acquisition-related costs 60 60
Other 10 10
Full year 2021 targeted Adjusted EBITDA $ 850 $ 925
Low End High End
Net cash provided by operating activities $ 480 $ 580
Capital expenditures net of proceeds from the
sale of property, plant and equipment (240) (240)
Full year 2021 targeted Free Cash Flow 240 340
Cash payments for restructuring and acquisition-
related costs 60 60
Full year 2021 targeted Adjusted Free Cash Flow $ 300 $ 400
Full Year 2021 Outlook($ in millions)
Adjusted EBITDA
Adjusted Free Cash Flow

Definition of Non-GAAP Measures
34
EBITDA and Adjusted EBITDA
We define EBITDA to be earnings before interest expense, income taxes, depreciation and amortization. Adjusted EBITDA is defined as EBITDA excluding the impact of restructuring and acquisition-related costs, debt
refinancing and redemption costs, loss on sale of a business, impairment charges, pension settlements and non-recurring items. We believe that EBITDA and Adjusted EBITDA are meaningful measures of performance as
they are commonly utilized by management and investors to analyze operating performance and entity valuation. Our management, the investment community and the banking institutions routinely use EBITDA and Adjusted
EBITDA, together with other measures, to measure our operating performance relative to other Tier 1 automotive suppliers. We also use Segment Adjusted EBITDA as the measure of earnings to assess the performance of
each segment and determine the resources to be allocated to the segments. EBITDA and Adjusted EBITDA should not be construed as income from operations, net income or cash flow from operating activities as determined
under GAAP. Other companies may calculate EBITDA and Adjusted EBITDA differently.
Adjusted Earnings (Loss) Per Share
We define Adjusted earnings per share to be diluted earnings per share excluding the impact of restructuring and acquisition-related costs, debt refinancing and redemption costs, loss on sale of a business, impairment
charges, pension settlements, certain accelerated depreciation and non-recurring items, including the tax effect thereon. We believe Adjusted earnings per share is a meaningful measure as it is commonly utilized by
management and investors in assessing ongoing financial performance that provides improved comparability between periods through the exclusion of certain items that management believes are not indicative of core
operating performance and which may obscure underlying business results and trends. Other companies may calculate Adjusted earnings per share differently.
Free Cash Flow and Adjusted Free Cash Flow
We define free cash flow to be net cash provided by operating activities less capital expenditures net of proceeds from the sale of property, plant and equipment. Adjusted free cash flow is defined as free cash flow
excluding the impact of cash payments for restructuring and acquisition-related costs and cash payments related to the Malvern fire net of recoveries. We believe free cash flow and Adjusted free cash flow are meaningful
measures as they are commonly utilized by management and investors to assess our ability to generate cash flow from business operations to repay debt and return capital to our stockholders. Free cash flow and Adjusted
free cash flow are also key metrics used in our calculation of incentive compensation. Other companies may calculate free cash flow and Adjusted free cash flow differently.
Net Debt and Net Leverage Ratio
We define net debt to be total debt, net less cash and cash equivalents. We define Net Leverage Ratio to be net debt divided by the trailing 12 months of Adjusted EBITDA. We believe that Net Leverage Ratio is a
meaningful measure of financial condition as it is commonly used by management, investors and creditors to assess capital structure risk. Other companies may calculate Net Leverage Ratio differently.
Liquidity
We define Liquidity as cash on hand plus amounts available on our revolving credit facility and foreign credit facilities.
US SAAR
We define US SAAR as the seasonally adjusted annual rate of light vehicle sales in the United States.
Accelerated Depreciation
In the first quarter of 2021, one of our largest customers announced their intention to cease production operations in Brazil in 2021 as part of their restructuring actions. As such, we have accelerated depreciation on certain
property, plant and equipment beginning in the first quarter of 2021. In the first quarter of 2020, we accelerated depreciation for certain assets that were idled as a result of our largest customer exiting their operations in
Thailand, which they announced in the first quarter of 2020.
