may 2021 brooklyn rental market - ecorcoran.com
TRANSCRIPT
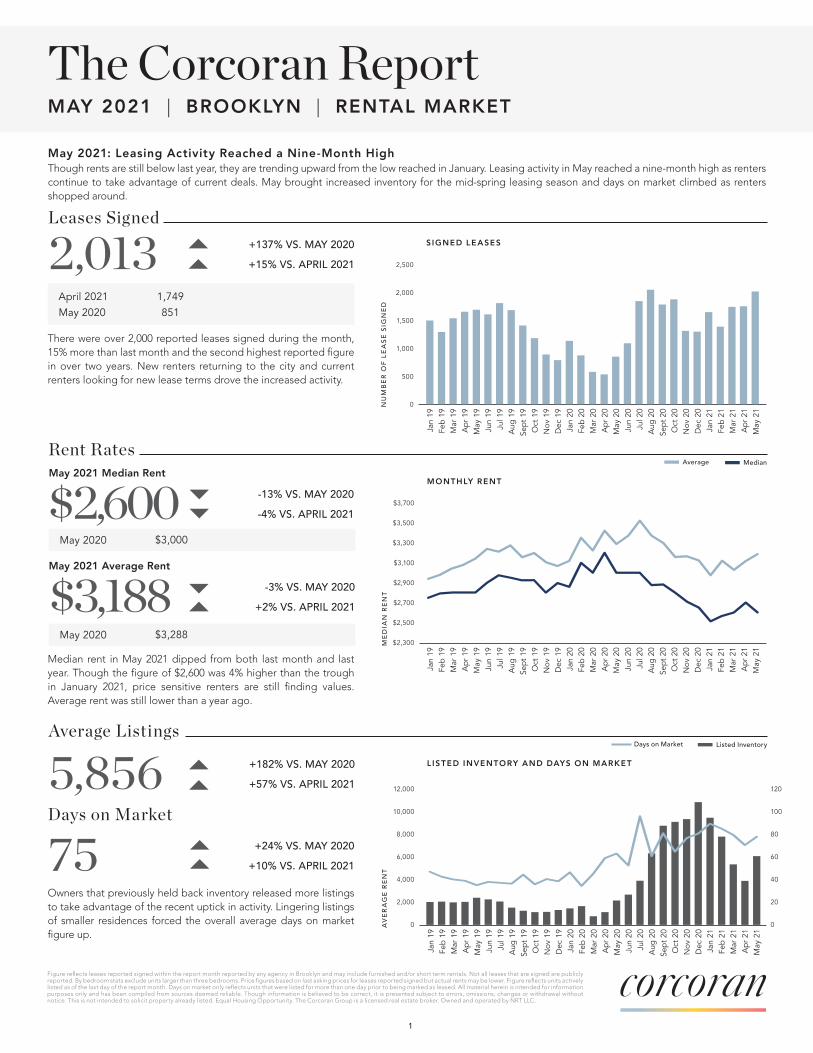
Figure reflects leases reported signed within the report month reported by any agency in Brooklyn and may include furnished and/or short term rentals. Not all leases that are signed are publicly reported. By bedroom stats exclude units larger than three bedrooms. Price figures based on last asking prices for leases reported signed but actual rents may be lower. Figure reflects units actively listed as of the last day of the report month. Days on market only reflects units that were listed for more than one day prior to being marked as leased. All material herein is intended for information purposes only and has been compiled from sources deemed reliable. Though information is believed to be correct, it is presented subject to errors, omissions, changes or withdrawal without notice. This is not intended to solicit property already listed. Equal Housing Opportunity. The Corcoran Group is a licensed real estate broker. Owned and operated by NRT LLC.
Leases Signed
May 2021: Leasing Activity Reached a Nine-Month HighThough rents are still below last year, they are trending upward from the low reached in January. Leasing activity in May reached a nine-month high as renters continue to take advantage of current deals. May brought increased inventory for the mid-spring leasing season and days on market climbed as renters shopped around.
SIGNED LEASES
NU
MB
ER
OF
LEA
SE S
IGN
ED
2,500
2,000
1,500
1,000
500
0
There were over 2,000 reported leases signed during the month, 15% more than last month and the second highest reported figure in over two years. New renters returning to the city and current renters looking for new lease terms drove the increased activity.
2,013 +137% VS. MAY 2020 +15% VS. APRIL 2021
Rent Rates
Average Listings
April 2021May 2020
1,749851
Median rent in May 2021 dipped from both last month and last year. Though the figure of $2,600 was 4% higher than the trough in January 2021, price sensitive renters are still finding values. Average rent was still lower than a year ago.
May 2020 $3,000
Owners that previously held back inventory released more listings to take advantage of the recent uptick in activity. Lingering listings of smaller residences forced the overall average days on market figure up.
Jan
19Fe
b 19
M
ar 1
9 A
pr 1
9M
ay 1
9 Ju
n 19
Ju
l 19
Aug
19
Sept
19
Oct
19
Nov
19
Dec
19
Jan
20Fe
b 20
M
ar 2
0 A
pr 2
0M
ay 2
0 Ju
n 20
Ju
l 20
Aug
20
Sept
20
Oct
20
Nov
20
Dec
20
Jan
21Fe
b 21
Mar
21
Apr
21
May
21
MONTHLY RENT
ME
DIA
N R
EN
T
$3,700
$3,500
$3,300
$3,100
$2,900
$2,700
$2,500
$2,300
Jan
19Fe
b 19
M
ar 1
9 A
pr 1
9M
ay 1
9 Ju
n 19
Ju
l 19
Aug
19
Sept
19
Oct
19
Nov
19
Dec
19
Jan
20Fe
b 20
M
ar 2
0 A
pr 2
0M
ay 2
0 Ju
n 20
Ju
l 20
Aug
20
Sept
20
Oct
20
Nov
20
Dec
20
Jan
21Fe
b 21
Mar
21
Apr
21
May
21
L ISTED INVENTORY AND DAYS ON MARKET
AV
ER
AG
E R
EN
T
12,000
10,000
8,000
6,000
4,000
2,000
0
Jan
19Fe
b 19
M
ar 1
9 A
pr 1
9M
ay 1
9 Ju
n 19
Ju
l 19
Aug
19
Sept
19
Oct
19
Nov
19
Dec
19
Jan
20Fe
b 20
M
ar 2
0 A
pr 2
0M
ay 2
0 Ju
n 20
Ju
l 20
Aug
20
Sept
20
Oct
20
Nov
20
Dec
20
Jan
21Fe
b 21
Mar
21
Apr
21
May
21
The Corcoran ReportMAY 2021 | BROOKLYN | RENTAL MARKET
Average Median
1
5,856 +182% VS. MAY 2020 +57% VS. APRIL 2021
Days on Market
75 +24% VS. MAY 2020 +10% VS. APRIL 2021
120
100
80
60
40
20
0
$2,600 -13% VS. MAY 2020 -4% VS. APRIL 2021
May 2020 $3,288
$3,188 -3% VS. MAY 2020 +2% VS. APRIL 2021
May 2021 Median Rent
May 2021 Average Rent
Listed InventoryDays on Market

Figure reflects leases reported signed within the report month reported by any agency in Brooklyn and may include furnished and/or short term rentals. Not all leases that are signed are publicly reported. By bedroom stats exclude units larger than three bedrooms. Price figures based on last asking prices for leases reported signed but actual rents may be lower. Figure reflects units actively listed as of the last day of the report month. Days on market only reflects units that were listed for more than one day prior to being marked as leased. All material herein is intended for information purposes only and has been compiled from sources deemed reliable. Though information is believed to be correct, it is presented subject to errors, omissions, changes or withdrawal without notice. This is not intended to solicit property already listed. Equal Housing Opportunity. The Corcoran Group is a licensed real estate broker. Owned and operated by NRT LLC.
Leases Signed by Bedroom
The Corcoran ReportMAY 2021 | BROOKLYN | RENTAL MARKET
Leasing activity expanded annually across all unit types and generally also matched or exceeded the pace seen late last summer and early fall. Compared to their respective lows during the market pause, three bedrooms have seen the largest percentage gain in lease activity.
Average Rent by Bedroom
Rents fell annually across all unit types, though just minimally for studio and one bedrooms. Rents for smaller residences have seen monthly gains for the past five to six months, whereas the gains in rent rates for larger residences have yet to gain consistent traction.
AVER AGE RENT BY BEDROOM
AV
ER
AG
E R
EN
T
$5,500
$5,000
$4,500
$4,000
$3,500
$3,000
$2,500
$2,000
Jan
19Fe
b 19
M
ar 1
9 A
pr 1
9M
ay 1
9 Ju
n 19
Ju
l 19
Aug
19
Sept
19
Oct
19
Nov
19
Dec
19
Jan
20Fe
b 20
M
ar 2
0 A
pr 2
0M
ay 2
0 Ju
n 20
Ju
l 20
Aug
20
Sept
20
Oct
20
Nov
20
Dec
20
Jan
21Fe
b 21
Mar
21
Apr
21
May
21
SIGNED LEASES BY BEDROOM T YPE
NU
MB
ER
OF
LEA
SES
SIG
NE
D
900
800
700
600
500
400
300
200
100
0
Jan
19Fe
b 19
M
ar 1
9 A
pr 1
9M
ay 1
9 Ju
n 19
Ju
l 19
Aug
19
Sept
19
Oct
19
Nov
19
Dec
19
Jan
20Fe
b 20
M
ar 2
0 A
pr 2
0M
ay 2
0 Ju
n 20
Ju
l 20
Aug
20
Sept
20
Oct
20
Nov
20
Dec
20
Jan
21Fe
b 21
Mar
21
Apr
21
May
21
Days on Market by Bedroom
Marketing time from list date to reported leased date increased for smaller residences but decreased for larger ones. The elongated marketing timeline for smaller residences correlate to rising rents and many customers still expecting lower values.
DAYS ON MARKET BY BEDROOM
AV
ER
AG
E D
AY
S O
N M
AR
KE
T
120
100
80
60
40
20
0
2
StudiosOne BedroomsTwo BedroomsThree Bedrooms
324762624251
159%109%135%195%
YoYYoYYoYYoY
One BedroomsStudios Two Bedrooms Three Bedrooms
StudiosOne BedroomsTwo BedroomsThree Bedrooms
$2,363$2,827$3,403$3,908
-1%-1%-8%
-18%
YoYYoYYoYYoY
StudiosOne BedroomsTwo BedroomsThree Bedrooms
105816458
63%71%-13%-23%
YoYYoYYoYYoY
May 2020 April 2021 May 2021
One BedroomsStudios Two Bedrooms Three Bedrooms
One BedroomsStudios Two Bedrooms Three Bedrooms

Figure reflects leases reported signed within the report month reported by any agency in Brooklyn and may include furnished and/or short term rentals. Not all leases that are signed are publicly reported. By bedroom stats exclude units larger than three bedrooms. Price figures based on last asking prices for leases reported signed but actual rents may be lower. Figure reflects units actively listed as of the last day of the report month. Days on market only reflects units that were listed for more than one day prior to being marked as leased. All material herein is intended for information purposes only and has been compiled from sources deemed reliable. Though information is believed to be correct, it is presented subject to errors, omissions, changes or withdrawal without notice. This is not intended to solicit property already listed. Equal Housing Opportunity. The Corcoran Group is a licensed real estate broker. Owned and operated by NRT LLC.
The Corcoran ReportMAY 2021 | BROOKLYN | RENTAL MARKET
May 2021: Compared a year ago, lease activity improved across all neighborhoods. The increase in Dumbo was exaggerated due to its relatively small volume compared to other areas. Rents across a majority of neighborhoods fell versus last year. The average rent increase in Prospect Heights was driven by a new development which began leasing in May.
Leases Signed by NeighborhoodMay 2021 May 2020 YoY
Greenpoint 63 25 152%North Williamsburg 110 66 67%South Williamsburg 99 67 48%DUMBO 57 11 418%Brooklyn Heights 94 37 154%Boerum Hill / Cobble Hill 100 37 170%Carroll Gardens / Gowanus / Red Hook 110 32 244%Downtown Brooklyn 168 89 89%Park Slope 178 78 128%Fort Greene / Clinton Hill 144 58 148%Prospect Heights 77 21 267%Crown Heights / Prospect-Lefferts 136 54 152%Bedford-Stuyvesant 159 73 118%East Williamsburg 116 46 152%Bushwick 100 24 317%Prospect Park South 148 64 131%South Brooklyn 154 117 32%
ANNUAL CHANGE IN LEASES S IGNED
GreenpointNorth WilliamsburgSouth Williamsburg
DUMBOBrooklyn Heights
Brm Hl / Cbl HlCrl Grds / Gwns / Rd Hk
Downtown BrooklynPark Slope
Fort Gr. / Clinton HillProspect Heights
Crwn Hts / PLGBedford-Stuyvesant
East WilliamsburgBushwick
Prospect Park SouthSouth Brooklyn
0% 50% 100% 150% 200% 300%
3
350%
Average Rent by NeighborhoodMay 2021 May 2020 YoY
Greenpoint $3,329 $3,560 -6%North Williamsburg $3,902 $4,529 -14%South Williamsburg $3,398 $3,895 -13%DUMBO $5,264 $5,351 -2%Brooklyn Heights $3,983 $4,102 -3%Boerum Hill / Cobble Hill $3,815 $4,197 -9%Carroll Gardens / Gowanus / Red Hook $3,613 $3,665 -1%Downtown Brooklyn $3,449 $3,758 -8%Park Slope $3,254 $3,488 -7%Fort Greene / Clinton Hill $3,544 $3,606 -2%Prospect Heights $3,464 $3,332 4%Crown Heights / Prospect-Lefferts $2,595 $3,674 -3%Bedford-Stuyvesant $2,506 $2,616 -4%East Williamsburg $2,965 $3,175 -7%Bushwick $2,493 $2,601 -4%Prospect Park South $2,455 $2,749 -11%South Brooklyn $2,125 $2,106 1%
ANNUAL CHANGE IN AVER AGE RENT
GreenpointNorth WilliamsburgSouth Williamsburg
DUMBOBrooklyn Heights
Brm Hl / Cbl HlCrl Grds / Gwns / Rd Hk
Downtown BrooklynPark Slope
Fort Gr. / Clinton HillProspect Heights
Crwn Hts / PLGBedford-Stuyvesant
East WilliamsburgBushwick
Prospect Park SouthSouth Brooklyn
-15% -10% -5% 0% 5%
Prospect Park South includes Windsor Terrace, Greenwood Heights, Prospect Park South, Kensington and Flatbush. South Brooklyn includes neighborhoods south of Foster Avenue, west of McDonald Avenue south of Greenwood Cemetery, east of Utica Avenue south of Fulton Street, and east of East New York Avenue south of Clarkson Avenue.
250% 400% 450%