may 2013 new york city real time jobs report · newyork-presbyterian/columbia; 371; ... jobs...
TRANSCRIPT
TOP EMPLOYERS Advertiser VolumeJ.P. Morgan Chase & Co. 2,610CITI 1,358Time Warner 1,109AT&T 757City University of New York (CUNY) 692Morgan Stanley 682American Express 608
MONTHLY AD TRENDS Bank Of America 536The Bank of New York Mellon Corporation 534Deloitte 503Thomson Reuters 501Macy's 453Chartis 444Sittercity 418Columbia University 418IBM 415State University of New York (SUNY) 376
ADS BY SECTOR AND OCCUPATION NewYork-Presbyterian/Columbia 371Barclays 367KPMG 362T-Mobile 361Wireless Generation Inc 359CBS 353Bloomberg 344AOL 328Sun America 316Total 255,363
* Includes only ads for which sector could be determined.
1 Please note that this report includes only ads from direct employers. Ads posted in bulk or by employment agencies have been excluded.2 Because WANTED AnalyticsTM, the company that issues the real-time labor market data, has introduced an improved classification system for online job ads and a new software version, the data is this report is not directly comparable to the data in previous reports.
May 2013 New York City Real Time Jobs Report
The table to the right lists the employers in New York City that posted the most new, unduplicated ads in the last 90 days and the number of ads they posted. The list of top-advertising employers is dominated by firms in finance, technology, and universities.1,2
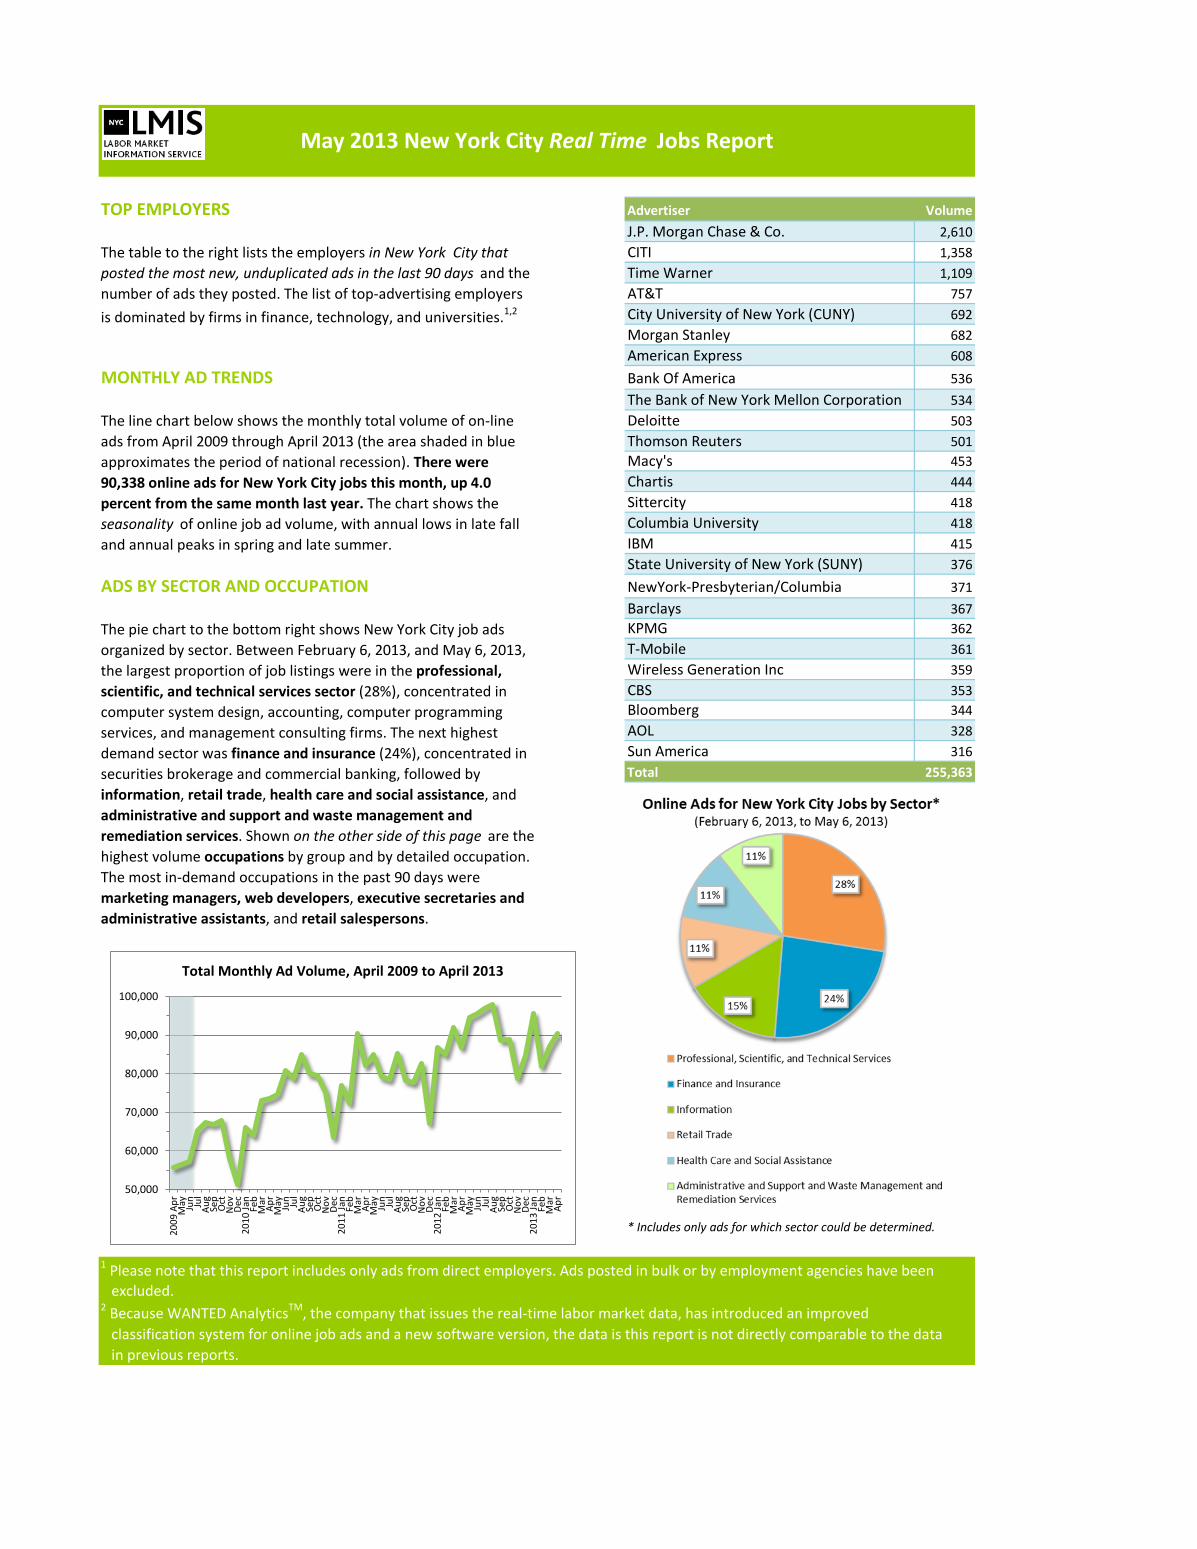
The line chart below shows the monthly total volume of on-line ads from April 2009 through April 2013 (the area shaded in blue approximates the period of national recession). There were 90,338 online ads for New York City jobs this month, up 4.0 percent from the same month last year. The chart shows the seasonality of online job ad volume, with annual lows in late fall and annual peaks in spring and late summer.
The pie chart to the bottom right shows New York City job ads organized by sector. Between February 6, 2013, and May 6, 2013, the largest proportion of job listings were in the professional, scientific, and technical services sector (28%), concentrated in computer system design, accounting, computer programming services, and management consulting firms. The next highest demand sector was finance and insurance (24%), concentrated in securities brokerage and commercial banking, followed by information, retail trade, health care and social assistance, and administrative and support and waste management and remediation services. Shown on the other side of this page are the highest volume occupations by group and by detailed occupation. The most in-demand occupations in the past 90 days were marketing managers, web developers, executive secretaries and administrative assistants, and retail salespersons.
50,000
60,000
70,000
80,000
90,000
100,000
2009
Apr
May Jun Jul
Aug
Sep
Oct
Nov De
c20
10 Ja
nFe
bM
arAp
rM
ay Jun Jul
Aug
Sep
Oct
Nov De
c20
11 Ja
nFe
bM
arAp
rM
ay Jun Jul
Aug
Sep
Oct
Nov De
c20
12 Ja
nFe
bM
arAp
rM
ay Jun Jul
Aug
Sep
Oct
Nov De
c20
13 Ja
nFe
bM
arAp
r
Total Monthly Ad Volume, April 2009 to April 2013
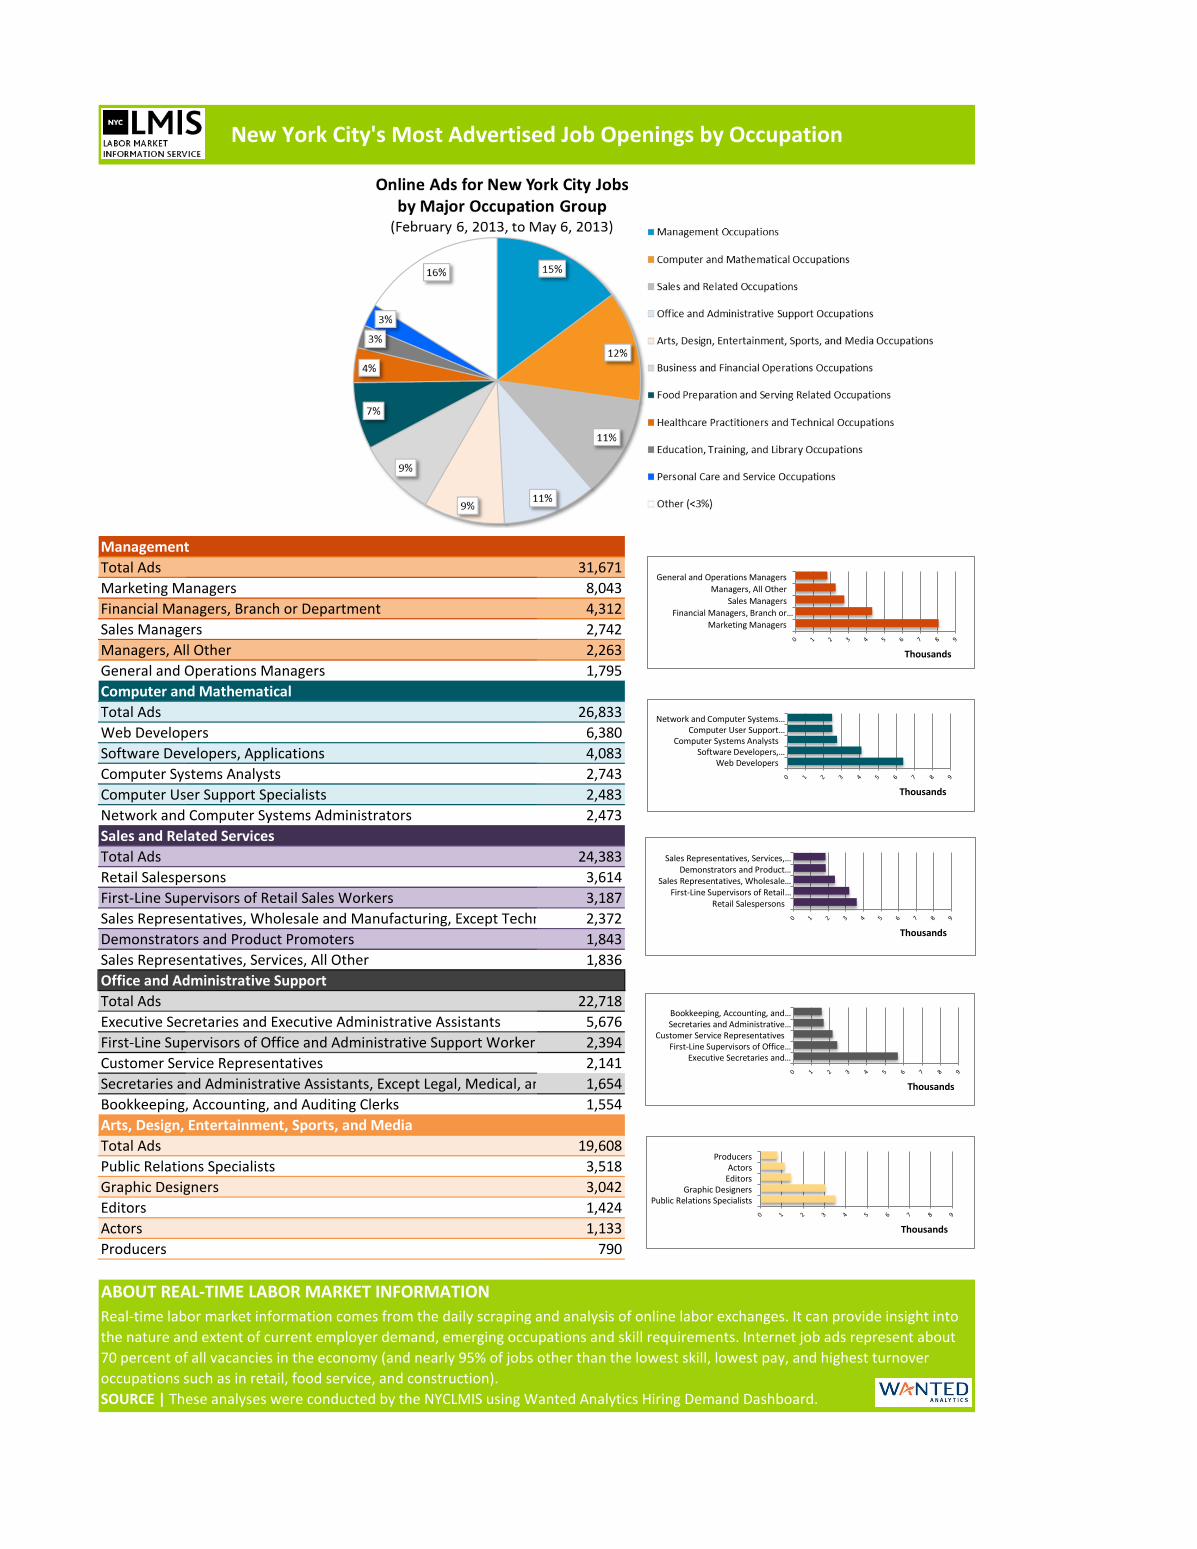
Management Total Ads 31,671Marketing Managers 8,043Financial Managers, Branch or Department 4,312Sales Managers 2,742Managers, All Other 2,263General and Operations Managers 1,795Computer and MathematicalTotal Ads 26,833Web Developers 6,380Software Developers, Applications 4,083Computer Systems Analysts 2,743Computer User Support Specialists 2,483Network and Computer Systems Administrators 2,473Sales and Related ServicesTotal Ads 24,383Retail Salespersons 3,614First-Line Supervisors of Retail Sales Workers 3,187Sales Representatives, Wholesale and Manufacturing, Except Techn 2,372Demonstrators and Product Promoters 1,843Sales Representatives, Services, All Other 1,836Office and Administrative SupportTotal Ads 22,718Executive Secretaries and Executive Administrative Assistants 5,676First-Line Supervisors of Office and Administrative Support Workers 2,394Customer Service Representatives 2,141Secretaries and Administrative Assistants, Except Legal, Medical, an 1,654Bookkeeping, Accounting, and Auditing Clerks 1,554Arts, Design, Entertainment, Sports, and MediaTotal Ads 19,608Public Relations Specialists 3,518Graphic Designers 3,042Editors 1,424Actors 1,133Producers 790
ABOUT REAL-TIME LABOR MARKET INFORMATION Real-time labor market information comes from the daily scraping and analysis of online labor exchanges. It can provide insight into the nature and extent of current employer demand, emerging occupations and skill requirements. Internet job ads represent about 70 percent of all vacancies in the economy (and nearly 95% of jobs other than the lowest skill, lowest pay, and highest turnover occupations such as in retail, food service, and construction). SOURCE | These analyses were conducted by the NYCLMIS using Wanted Analytics Hiring Demand Dashboard.
New York City's Most Advertised Job Openings by Occupation
Marketing ManagersFinancial Managers, Branch or…
Sales ManagersManagers, All Other
General and Operations Managers
Thousands
Web DevelopersSoftware Developers,…
Computer Systems AnalystsComputer User Support…
Network and Computer Systems…
Thousands
Executive Secretaries and…First-Line Supervisors of Office…
Customer Service RepresentativesSecretaries and Administrative…Bookkeeping, Accounting, and…
Thousands
Public Relations SpecialistsGraphic Designers
EditorsActors
Producers
Thousands
Retail SalespersonsFirst-Line Supervisors of Retail…
Sales Representatives, Wholesale…Demonstrators and Product…
Sales Representatives, Services,…
Thousands