may 2, 2017 philippine stock exchange the … · the audit committee is endorsing to the...
TRANSCRIPT

May 2, 2017 PHILIPPINE STOCK EXCHANGE The Disclosure Department 3rd Floor, Tower One and Exchange Plaza Ayala Triangle, Ayala Ave., Makati City Attention: Mr. Jose Valeriano B. Zuño III Head, Disclosures Department PHILIPPINE DEALING AND EXCHANGE CORPORATION 37th Floor, Tower 1, The Enterprise Center 6766 Ayala Ave. cor Paseo de Roxas, Makati City Attention: Ms. Vina Vanessa S. Salonga Head, Issuer Compliance and Disclosure Department Subject: Vista Land & Lifescapes, Inc.: Preliminary Information Statement Gentlemen: Please see attached SEC Form 20-IS, Preliminary Information Statement, filed today for the Company’s Annual Stockholders’ Meeting on June 15, 2017. Very truly yours, Brian N. Edang Officer-in-Charge

COVER SHEET
C S 2 0 0 7 0 3 1 4 5 S.E.C. Registration Number
V I S T A L A N D & L I F E S C A P E S , I N C .
(Registrant’s Full Name)
3 R D L E V E L S T A R M A L L L A S P I N A S , C V S T A R R A V E N U E , P H I L A M L I F E V I L L A G E , P A M P L O N A , L A S P I N A S C I T Y
(Business Address: No. Street/City/Province)
Brian N. Edang 226-3552 ext. 0088
Contact Person Registrant Telephone Number
1 2 3 1 20-IS Preliminary Information Statement
0 6 1 5
Month Day FORM TYPE Month Day Calendar Year Annual Meeting
Secondary License Type, If Applicable
Dept. Requiring this Doc. Amended Articles Number/Section
Total Amount of Borrowings
Total No. of Stockholders Domestic Foreign ----------------------------------------------------------------------------------------------------------
To be accomplished by SEC Personnel concerned
File Number LCU
Document I.D.
Cashier


3
Annex “A” EXPLANATION AND RATIONALE
For each item on the Agenda of Vista Land & Lifescapes, Inc.’s 2017 ASM requiring the approval of the stockholders
1. President’s Report, Management Report and Audited Financial Statements as of and for the year ended December 31, 2016 The audited financial statements (“AFS”) of the Company as of and for the year ended December 31, 2016, audited by SyCip, Gorres, Velayo & Co. and a copy of which is incorporated in the Preliminary Information Statement for this meeting, will be presented for approval by the stockholders. To give context to the AFS and bring to the shareholders’ attention the highlights of said AFS, the President and CEO, Mr. Manuel Paolo A. Villar, will deliver a report to the stockholders on the Company’s performance for the year 2016 and the outlook for 2017. The Board and Management of the Company believes it in keeping with the Company’s thrust to at all times observe best corporate governance practices that the results of operations and financial condition of the Company be presented and explained to the shareholders. Any comments from the shareholders, and their approval or disapproval of these reports, will provide guidance to the Board and Management in their running of the business and affairs of the Company.
2. Ratification of all acts and resolutions of the Board of Directors and Management for the year 2016 until 31 March 2017 Ratification by the stockholders will be sought for all the acts and the resolutions of the Board of Directors and all the acts of Management taken or adopted for the year 2016 until March 31, 2017. A brief summary of these resolutions and actions is set forth in the Preliminary Information Statement for this meeting. Copies of the minutes of the meetings of the Board of Directors are available for inspection by any shareholder at the offices of the Company during business hours.
The Board and Management of the Company believes it is in keeping with the Company’s thrust to at all times observe best corporate governance practices that ratification of their acts and resolutions be requested from the shareholders in this annual meeting. Such ratification will be a confirmation that the shareholders approve the manner that the Board and Management run the business and affairs of the Company.
3. Election of the members of the Board of Directors, including the Independent
Directors, for the year 2017 The Corporate Secretary will present the names of the persons who have been duly nominated for election as directors of the Company in accordance with the By-Laws and Manual on Corporate Governance of the Company and applicable laws and regulations. The voting procedure is set forth in the Preliminary Information Statement for this meeting.
4. Appointment of External Auditors The Audit Committee is endorsing to the stockholders the re-appointment of SyCip Gorres Velayo & Co. as external auditor of the Company for the year 2017.

4
PROXY The undersigned stockholder of VISTA LAND & LIFESCAPES, INC. (the “Company”) hereby appoints __________________________________ or in his absence, the Chairman of the meeting, as attorney-in-fact or proxy, with power of substitution, to represent and vote ______________ shares registered in his/her/its name as proxy of the undersigned stockholder, at the Annual Stockholders’ Meeting of the Company to be held at Colonial Ballroom, Palazzo Verde, Daang Reyna, Vista Alabang, Las Piñas City on 15 June 2017 at 9:00 a.m. and at any of the adjournments thereof for the purpose of acting on the following matters:
1. Approval of the Audited Financial 4. Re-appointment of SyCip Gorres Statements for the year 2016 Velayo & Co. as external auditor
Yes No Abstain Yes No Abstain
2. Ratification of all acts and resolutions of the
Board of Directors and Management for the year 2016 until 31 March 2017 Yes No Abstain
3. Election of the members of the Board of Directors, _____________________________ including the Independent Directors, Printed Name of the Stockholder for the year 2017.
_____________________________ Signature of Stockholder/ Authorized Signatory _____________________________ Date
This proxy should be received by the Corporate Secretary on or before 09 June 2017, the deadline for submission of proxies. This proxy when properly executed will be voted in the manner as directed herein by the stockholder(s). If no direction is made, this proxy will be voted for the election of all nominees and for the approval of the matters stated above and for such other matters as may properly come before the meeting in the manner described in the Information Statement. A stockholder giving a proxy has the power to revoke it at any time before the right granted is exercised. A proxy is also considered revoked if the stockholder attends the meeting in person and expressed his intention to vote in person. Notarization of this proxy is not required.
No. of Votes Manuel B. Villar Manuel Paolo A. Villar Cynthia J. Javarez Camille A. Villar Jerryle Luz C. Quismundo Marilou O. Adea Ruben O. Fruto

5
SECURITIES AND EXCHANGE COMMISSION
SEC FORM 20-IS
INFORMATION STATEMENT PURSUANT TO SECTION 20 OF THE SECURITIES REGULATION CODE
1. Check the appropriate box:
[x] Preliminary Information Statement [ ] Definitive Information Statement
2. Name of Registrant as specified in its charter: VISTA LAND & LIFESCAPES, INC. 3. Philippines Province, country or other jurisdiction of incorporation or organization 4. SEC Identification Number CS200703145 5. BIR Tax Identification Code 006-652-678-000 6. 3rd Level Starmall Las Piñas, CV Starr Avenue, Philamlife Village, Pamplona Las Piñas City 1747 Address of principal office Postal Code
7. (632) 874-5758 / (632) 872-6947 / (632) 226-3552 Registrant’s telephone number, including area code 8. Date, time and place of the meeting of security holders June 15, 2017, 9:00 a.m. Colonial Ballroom, Palazzo Verde, Daang Reyna, Vista Alabang, Las Piñas City 9. Approximate date on which the Information Statement is first to be sent or given to security
holders May 18, 2017 10. Securities registered pursuant to Sections 8 and 12 of the Code or Sections 4 and 8 of the
RSA:
Title of Each Class Number of Shares of Common Stock Outstanding and Amount of Debt Outstanding
Common Shares (net of treasury shares as of April 27, 2017) 12,826,926,076 Shares VLL Home Builder Bonds Up to P2,500,000,000.00 Vista Land Retail Bonds Up to P5,000,000,000.00 11. Are any or all of registrant's securities listed in a Stock Exchange? Yes x No _______
The Registrant’s common shares are listed on the Philippine Stock Exchange.
WE ARE NOT ASKING YOU FOR A PROXY AND YOU ARE REQUESTED NOT TO SEND US A PROXY

6
PART I
INFORMATION STATEMENT GENERAL INFORMATION Date, time and place of meeting of security holders. Date: June 15, 2017 Time: 9:00 a.m. Place: Colonial Ballroom, Palazzo Verde, Daang Reyna, Vista Alabang, Las Piñas City The corporate mailing address of the principal office of the Company is 3rd Level Starmall Las Piñas, CV Starr Avenue, Philamlife Village, Pamplona, Las Piñas City. This Information Statement shall be sent to security holders as soon as practicable after the approval hereof by the Securities and Exchange Commission, but not later than May 25, 2017.
Dissenters' Right of Appraisal There are no corporate matters or action that will entitle a shareholder to exercise a right of appraisal as provided under Section 81, Title X, of the Corporation Code of the Philippines (“Corporation Code”). Any stockholder of the Company shall have the right to dissent and demand payment of the fair value of his shares only in the following instances, as provided by the Corporation Code:
(1) In case any amendment to the articles of incorporation has the effect of changing or restricting the rights of any stockholder or class of shares, or of authorizing preferences in any respect superior to those outstanding shares of any class, or of extending or shortening the term of corporate existence;
(2) In case of sale, lease, exchange, transfer, mortgage, pledge or other disposition of all or substantially all of the corporate property and assets;
(3) In case of merger or consolidation; and (4) In case of investments in another corporation, business or purpose.
The appraisal right, when available, may be exercised by any stockholder who shall have voted against the proposed corporate action, by making a written demand on the corporation within thirty (30) days after the date on which the vote was taken, for payment of the fair value of his shares; Provided, That failure to make the demand within such period shall be deemed a waiver of the appraisal right. A stockholder must have voted against the proposed corporate action in order to avail himself of the appraisal right. If the proposed corporate action is implemented or effected, the corporation shall pay to such stockholder upon surrender of his certificate(s) of stock representing his shares, the fair value thereof as of the day prior to the date on which the vote was taken, excluding any appreciation or depreciation in anticipation of such corporate action. If within a period of sixty (60) days from the date the corporate action was approved by the stockholders, the withdrawing stockholder and the corporation cannot agree on the fair value of the shares, it shall be determined and appraised by three (3) disinterested persons, one of whom shall be named by the stockholder, another by the corporation and the third by the two thus chosen. The findings of the majority of appraisers shall be final, and their award shall be paid by the corporation within thirty (30) days after such award is made: Provided, that no payment shall be made to any dissenting stockholder unless the corporation has unrestricted retained earnings in its books to cover such payment; and Provided, Further, That upon payment by the corporation of the agreed or awarded price, the stockholder shall forthwith transfer his shares to the corporation. Interest of Certain Persons in or Opposition to Matters to be Acted Upon None of the officers or directors or any of their associates has any substantial interest, direct or indirect, in any of the matters to be acted upon in the stockholders’ meeting.

7
No director has informed the Company in writing that he intends to oppose any action to be taken at the meeting. CONTROL AND COMPENSATION INFORMATION
Voting Securities and Principal Holders Thereof
(a) Number of shares outstanding as of March 31, 2017:
Common: 12,826,926,076 Preferred: 3,300,000,000 (b) Record Date: May 2, 2017 Each common and each preferred share of stock of the Company is entitled to one (1) vote. Pursuant to Article II, Section 7 of the Company’s By-Laws, every holder of voting stock may vote during all meetings, including the Annual Stockholders’ Meeting, either in person or by proxy executed in writing by the stockholder or his duly authorized attorney-in-fact. Stockholders entitled to vote are also entitled to cumulative voting in the election of directors. Section 24 of the Corporation Code provides, in part, that: “….in stock corporations, every stockholder entitled to vote shall have the right to vote in person or by proxy the number of shares of stock standing, at the time fixed in the by-laws, in his own name on the stock books of the corporation, or where the by-laws are silent, at the time of the election; and said stockholder may vote such number of shares for as many persons as there are directors to be elected, or he may cumulate said shares and give one candidate as many votes as the number of directors to be elected multiplied by the number of his shares shall equal, or he may distribute them on the same principle among as many candidates as he shall see fit….” Equity Ownership of Foreign and Local Shareholders
Foreign and local security ownership as of March 31, 2017:
Class
Foreign Filipino
Shares
Percent of Class/Total Outstanding
Shares Shares
Percent of Class/Total Outstanding
Shares
Total Outstanding
Shares
Common 2,801,072,913 21.84% 10,025,853,163 78.16% 12,826,926,076 17.37% 62.17%
Preferred 0 0.00% 3,300,000,000 100.00% 3,300,000,000 0.00% 20.46%
Total 2,801,072,913 13,325,853,163 16,126,926,076

8
Security Ownership of Certain Beneficial Owners and Management
Security ownership of certain record and beneficial owners of more than 5.0% of the Company’s voting securities as of March 31, 2017:
Title of Class of Securities
Name/Address of Record Owners and Relationship with Us
Name of
Beneficial Owner /Relationship with Record
Owner Citizenship No. of Shares
Held % of
Ownership1 Common
Fine Properties, Inc Las Pinas Business Center Alabang Zapote Road, Talon, Las Piñas City Shareholder
Fine Properties, Inc./ Record Owner is also beneficial Owner2
Filipino
3,462,047,161
21.467%
Preferred
Fine Properties, Inc Las Pinas Business Center Alabang Zapote Road, Talon, Las Piñas City Shareholder
Fine Properties, Inc./ Record Owner is also beneficial Owner2
Filipino
3,300,000,000
20.463%
Common
PCD Nominee Corporation 37/F Tower 1, The Enterprise Ctr. 6766 Ayala Ave. cor. Paseo de Roxas, Makati City Shareholder
Fine Properties, Inc./ Record Owner is not the beneficial Owner4
Filipino
3,188,590,904
19.772%
Common
PCD Nominee Corporation 37/F Tower 1, The Enterprise Ctr. 6766 Ayala Ave. cor. Paseo de Roxas, Makati City Shareholder
Record Owner is not the beneficial Owner4
Non-Filipino
2,774,223,795
17.202%
Common
Althorp Holdings, Inc. 3L Starmall Las Pinas, CV Starr Ave., Pamplona, Las PInas City Shareholder
Fine Properties, Inc./ Record owner is also the beneficial owner3
Filipino
1,235,292,469
7.660%
Common PCD Nominee Corporation
37/F Tower 1, The Enterprise Ctr. 6766 Ayala Ave. cor. Paseo de Roxas, Makati City Shareholder
Record Owner is not the beneficial Owner4
Filipino 863,858,785 5.357%
1 Based on the total issued and outstanding capital stocks as of March 31, 2017 of 16,126,926,076 shares (common and preferred). 2 Mr. Manuel B. Villar, Jr. and his spouse are the controlling shareholders of Fine Properties, Inc. The right to vote the shares held by Fine Properties, Inc. has in the past been, and in this annual meeting is expected to be, exercised by either Mr. Villar or Mr. Jerry M. Navarrete. 3 Fine Properties Inc. is the controlling shareholder of Althorp Holdings, Inc. Mr. Manuel B. Villar, Jr. and his spouse are the controlling shareholders of Fine Properties, Inc. The right to vote the shares held by Fine Properties, Inc. has in the past been, and in this annual meeting is expected to be, exercised by either Mr. Villar or Mr. Jerry M. Navarrete. 4 PCD Nominee Corporation is the registered owner of shares beneficially owned by participants in the Philippine Depository & Trust Corporation, a private company organized to implement an automated book entry system of handling securities transactions in the Philippines (PCD). Under the PCD procedures, when an issuer of a PCD-eligible issue will hold a stockholders’ meeting, the PCD shall execute a pro-forma proxy in favor of its participants for the total number of shares in their respective principal securities account as well as for the total number of shares in their client securities account. For the shares held in the principal securities account, the participant concerned is appointed as proxy with full voting rights and powers as registered owner of such shares. For the shares held in the client securities account, the participant concerned is appointed as proxy, with the obligation to constitute a sub-proxy in favor of its clients with full voting and other rights for the number of shares beneficially owned by such clients. Except as indicated above, as of Record Date, the Company is not aware of any investor beneficially owning shares lodged with the PCD which comprise more than five percent (5%) of the Company’s total outstanding capital stock.

9
Security ownership of management as of March 31, 2017:
Title of class Name of beneficial owner
Amount and nature of beneficial ownership Citizenship
Percent of Class1
Common
Manuel B. Villar, Jr. C. Masibay St. BF Resort Village, Talon, Las Piñas City
293,969,986
8,638,138,749
Indirect2
Indirect3
Filipino
Filipino
1.823%
53.563%
Preferred
Manuel B. Villar, Jr. C. Masibay St. BF Resort Village, Talon, Las Piñas City
3,300,000,000
Indirect4
Filipino
20.463%
Common
Manuel Paolo A. Villar C. Masibay St. BF Resort Village, Talon, Las Piñas City
200,000
222,596,324
Direct
Indirect2
Filipino
Filipino
0.001%
1.380%
Common
Cynthia J. Javarez B3A/L2 Vetta di Citta Italia Imus, Cavite
160
Direct
Filipino
0.000%
Common
Camille A. Villar C. Masibay St. BF Resort Village, Talon, Las Piñas City
1,000
Indirect2
Filipino
0.000%
Common
Jerylle Luz C. Quismundo 15 Garnett Ext., Dona Juana Subd. Rosario, Pasig City
3,865
Direct
Filipino
0.000%
Common
Ruben O. Fruto No. 136 Bunga Ext. Ayala Alabang Village. Muntinlupa City
1,000
Direct
Filipino
0.000%
Common
Marilou O. Adea No. 44 Istanbul Street BF Homes, Parañaque City
1
Direct
Filipino
0.000%
Total 12,454,911,085 77.231% 1 Based on the total outstanding, issued and subscribed shares of 16,126,926,076 (common and preferred) as of March 31,
2017 2 Shares lodged under PCD Nominee Corporation (Filipino) 3 Includes 6,650,638,065 shares held thru Fine Properties, Inc., 1,235,292,469 shares held thru Althorp Holdings, Inc. and
752,208,215 shares held thru Manuela Corp. 4 Shares held thru Fine Properties, Inc. Except as indicated in the above table, the above named officers have no indirect beneficial ownership in the Company. Except as aforementioned, no other officers of the Company holds, directly or indirectly, shares in the Company.
Voting Trust Holders of 5.0% or More
As of March 31, 2017, there were no persons holding more than 5.0% of a class of shares under a voting trust or similar agreement. Changes in Control The Company is not aware of any voting trust agreements or any other similar agreements which may result in a change in control of the Company. No change in control of the Company has occurred since the beginning of its last fiscal year.

10
Directors and Executive Officers of the Registrant Term of Office Each director holds office until the annual meeting of stockholders held next after his election and his successor shall have been elected and qualified, except in case of death, resignation, disqualification or removal from office. The term of office of the officers is coterminous with that of directors that elected or appointed them. Background Information The following are the names, ages and citizenship of the incumbent directors/independent directors of the Company as of March 31, 2017: Name Age Position Citizenship Manuel B. Villar, Jr. 67 Chairman of the Board Filipino Manuel Paolo A. Villar 40 Director, President and Chief Executive Officer Filipino Cynthia J. Javarez 53 Director, Chief Financial Officer, Controller Filipino Camille A. Villar 32 Director, Managing Director of Vista Land Commercial
Division Filipino
Jerylle Luz C. Quismundo 53 Director and President of Camella Homes, Inc. & Communities Philippines, Inc.
Filipino
Ruben O. Fruto 78 Independent Director Filipino Marilou Adea 66 Independent Director Filipino The following are the names, ages and citizenship of the Company’s executive officers in addition to its executive and independent directors listed above as of March 31, 2017. Name Age Position Citizenship Gemma M. Santos 54 Corporate Secretary Filipino Ma. Nalen Rosero 46 Chief Legal Counsel, Chief Information Officer and
Compliance Officer Filipino
Jerry M. Navarrete 62 President of Starmalls, Inc. Filipino Benjamarie Therese N. Serrano 54 Chief Operating Officer of Starmalls, Inc. Filipino Rowena S. Reclosado 54 Managing Director of Brittany Corporation Filipino Ma. Leni D. Luya 48 Managing Director of Crown Asia, Inc. Filipino Mary Lee S. Sadiasa 47 Managing Director of Camella Homes, North Luzon Filipino Ric A. Pallesco 48 Managing Director of Camella Homes, South Luzon Filipino Ma. Pamela C. Gako 48 Managing Director of Camella Homes, Visayas &
Mindanao
Edgardo G. Santos 57 Vice President for Sales of Camella Homes Filipino Elizabeth M. Kalaw 53 Managing Director of Vista Residences Filipino Lorelyn D. Mercado 47 Vice President-Accounting Filipino Brian N. Edang 38 Head Investor Relations Filipino Dante M. Julongbayan 49 Group Production Head Filipino Rodel B. Racadio 53 Vice President External Relations /
Technical Services Head Filipino
Estrellita S. Tan 53 President of Prima Casa Land & Houses, Inc. Filipino
The following states the business experience of the incumbent directors and officers of the Company for the last five (5) years: Manuel B. Villar, Jr. Chairman of the Board. Mr. Villar, 67, was Senator of the Philippines from 2001 to June 2013. He served as Senate President from 2006 to 2008. He also served as a Congressman from 1992 to 2001 and as Speaker of the House of Representatives from 1998 to 2000. A Certified Public Accountant, Mr. Villar graduated from the University of the Philippines in 1970 with the degree of Bachelor of Science in Business Administration and in 1973 with the degree of Masters in Business Administration. He founded Camella Homes in the early 1970s and successfully managed said company over the years, to become the largest homebuilder in the Philippines now known as the Vista Land Group. Mr. Villar is also Chairman of the Board of Starmalls, Inc. Manuel Paolo A. Villar, Director and President & Chief Executive Officer. Mr. Villar, 40, graduated from the Wharton School of the University of Pennsylvania, Philadelphia, USA with a Bachelor of Science in Economics and Bachelor of Applied Science in 1999. He was a consultant for McKinsey

11
&Co. in the United States from 1999 to 2001. He joined Crown Asia in 2001 as Head of Corporate Planning. He was elected President and Chief Executive Officer of the Company in July 2011. In addition, at present, he is the CEO and Chairman of St. Agustine Gold and Copper Limited from October 2012, President of Prime Asset Ventures, Inc. from 2013, and Chairman of TVI Resource Development Philippines, Inc. from December 2013. Cynthia J. Javarez, Director, Controller and Chief Financial Officer. Ms. Javarez, 53, graduated from the University of the East with a degree in Bachelor of Science in Business Administration major in Accounting. She is a Certified Public Accountant. She took a Management Development Program at the Asian Institute of Management. She is currently the Controller, Chief Financial Officer and Head of the Tax and Audit group of Vista Land after holding various other positions in the MB Villar Group of Companies since 1985. Camille A. Villar, Managing Director, Vista Land Commercial Division. Ms. Villar, 32, graduated from Ateneo de Manila University with a degree in Bachelor of Science in Management. She took Management in Business Administration, Global Executive MBA Program in IESE Business School, Barcelona, Spain. She joined the Corporate Communications Group of Brittany in 2007 until she assumed the position of Managing Director of Vista Land Commercial. She is also a Director of AllValue Holdings Corp. Jerylle Luz C. Quismundo, President, Camella Homes, Inc. & Communities Philippines, Inc. Ms. Quismundo, 53, graduated cum laude from the University of the Philippines with a Masters in Business Administration and a Bachelor of Science in Business Economics. From 2001 to 2003, Ms. Quismundo was the Chief Financial Officer of Camella Homes, Inc. She is currently the President of Camella Homes, Inc. and Communities Philippines, Inc., and its subsidiaries. Ruben O. Fruto, Independent Director. Mr. Fruto, 78, graduated with the degree of Bachelor of Laws from the Ateneo de Manila University in 1961. He was formerly a partner in the law firm of Feria, Feria, Lugtu & La O’ and the Oben, Fruto & Ventura Law Office. In February 1987, he was the Chief Legal Counsel and Senior Vice President of the Development Bank of the Philippines and Director from 1991 to 1998. He was the Undersecretary of Finance from March 1990 to May 15, 1991. Presently aside from private practice in corporate and civil litigation, he is also Of Counsel of Feria Tantoco Daos Law Office. He is also currently General Counsel of Wallem Philippines Shipping, Inc. and Wallem Maritime Services, Inc.; Vice-Chairman of Toyota Balintawak, Inc.; Director and Vice-President of China Shipping Manila Agency, Inc. and Director and Chairman of Padre Burgos Realty, Inc. Marilou O. Adea, Independent Director. Ms. Adea, 66, is currently a consultant for FBO Management Network, Inc. and is Independent Director for Malarayat Rural Bank. She was until recently the Court Appointed Rehabilitation Receiver of Anna-Lynns, Inc. and Manuela Corporation. Ms. Adea served previously as Project Director for Site Acquisition of Digital Telecommunications Phils. Inc. from 2000 to 2002, Executive Director for FBO Management Network, Inc. from 1989 to 2000 and BF Homes Inc. in Receivership from 1988 to 1994 and Vice President for Finance & Administration for L&H Resources Management Corporation from 1986 to 1988. Ms. Adea worked with the Home Development Mutual Fund from 1978 to 1986. Ms. Adea holds a Degree in Bachelor of Science in Business Administration Major in Marketing Management from the University of the Philippines. Gemma M. Santos, Corporate Secretary. Atty. Santos, 54, graduated cum laude with the degree of Bachelor of Arts, Major in History from the University of the Philippines in 1981, and with the degree of Bachelor of Laws also from the University of the Philippines in 1985. She is a practicing lawyer and Senior Partner of Picazo Buyco Tan Fider & Santos Law Offices and Corporate Secretary of various Philippine companies, including public companies Max’s Group, Inc. and SSI Group, Inc. Ma. Nalen Rosero. Chief Legal Counsel, Chief Information Officer and Compliance Officer. Atty. Rosero, 46, graduated salutatorian from the San Beda College of Law in 1997. From 1997 to 2000, she was an Associate in the Litigation Group of Angara Abello Concepcion Relaga & Cruz (ACCRA) Law Offices. She has been the Corporate Secretary of Starmalls. Inc. (formerly Polar Property Holdings Corp.) from 2001 to the present. On September 11, 2013, Atty. Rosero was designated as Compliance Officer and Chief Information Officer of the Company.

12
Jerry M. Navarrete, President, Starmalls, Inc. Mr. Navarrete, 62, graduated from the Lyceum of the Philippines with a Bachelor’s degree in Economics and from Ateneo de Manila University with a Master’s degree in Business Administration. He has been with the Group for more than 40 years and has served as President and Chief Executive Officer of Starmalls since 2004. Benjamarie Therese N. Serrano, Chief Operating Officer, Starmalls, Inc. Ms. Serrano, 54, graduated from the University of the Philippines with a degree in Economics and from the Asian Institute of Management with a Master’s degree in Business Management. She is also the President and Chief Executive Officer of AllValue Holdings Corp. and its subsidiaries and was President and Chief Executive Officer of Vista Land from 2007 to 2011. She also serves as Business Development Head of the Group. Rowena S. Reclosado, Managing Director, Brittany Corporation. Ms. Reclosado, 54, graduated magna cum laude from the University of the East with a degree in Bachelor of Science in Business Administration Major in Banking and Finance. She took her Masters in Business Administration at the Ateneo Graduate of School of Business. She handled several positions with the MB Villar Group since 1989. Prior to joining the Group, she was an Analyst in United Coconut Planters Bank from 1983 to 1989. At present, she is the Managing Director of Brittany Corporation. Ma. Leni D. Luya, Managing Director, Crown Asia, Inc.. Ms. Luya, 48, is a Certified Public Accountant. She graduated from the University of the Philippines in the Visayas with a degree in Bachelor of Science in Business Administration Major in Accounting. Ms. Luya has held various positions in the MB Villar Group of Companies from 1989 until she assumed the position of Division Head of Crown Asia Properties, Inc. in 2004, Managing Director of Crown Asia Division of Vista Land & Lifescapes, Inc. in 2007, and Director of Polar Property Holdings Corp., Division Head of Communities Philippines (SOLVIZMIN) in 2010 and Managing Director of Vista Land Commercial Division from 2011 to 2016. At present, she is the Managing Director of Crown Asia, Inc. Mary Lee S. Sadiasa, Managing Director, Camella Homes, North Luzon. Ms. Sadiasa, 47, graduated from the De La Salle University with a Bachelor of Science in Applied Mathematics Minor in Operations Research in 1988. She has held various positions in the MB Villar Group of Companies from 1988 until she assumed the position of Division Head of Brittany Corporation from 2005 to 2011. At present, she is the Managing Director of Camella Homes, Inc., North Luzon Division. Ric A. Pallesco, Managing Director, Camella Homes, South Luzon. Mr. Pallesco, 48, graduated from Mapua Institute of Technology with a degree in Bachelor of Science in Civil Engineering. He handled several positions with the MB Villar Group since 1991. At present, he is the Managing Director of Camella Homes, Inc., South Luzon Division. Ma. Pamela C. Gako, Managing Director, Camella Homes, Visayas & Mindanao. Ms. Gako, 48, graduated from the University of San Carlos, Cebu City, summa cum laude with a Bachelor of Science major in Accounting, and a certified public accountant. She also graduated from the University of the Philippines, Dilliman, Quezon City, College of Law, and a member of the Philippine BAR since 1995. She joined Palmera Homes in 1995 and held various positions in Communities Philippines Inc., including Division Head for the Visayas, until she assumed the position of Division Head for the Visayas and Mindanao in November 2016. Edgardo G. Santos. Vice President for Sales, Camella Homes. Mr. Santos, 57, Graduate of Bachelor of Science in Agribusiness Development & Management, University of the Philippines Los Banos 1980; 2000-2002 Division Head, Crown Asia (North); 2002-2003 Division Head, Camella Homes (North); 2005 to present Group Head, Asia Plus Corporation; 1990 – to present, Sales Director Vista Land & Lifescapes, Inc. Elizabeth M. Kalaw, Managing Director, Vista Residences. Ms. Kalaw, 53, graduated magna cum laude with the degree of Bachelor of Science in Business Management, Accountancy from the University of the East in 1984, with MBA from the De La Salle University. She was Head of Vista Land International Marketing, Inc. from October 2008 to December 2010. She assumed the position of Head of Vista Residences in January 2011. Lorelyn D. Mercado. Vice President-Accounting. Ms Mercado, 47, graduated from the University of Batangas with a degree in Bachelor of Science in Business Administration-Accounting. She took

13
Master in Business Administration at the De La Salle University. She is currently the Chief Accountant of Vista Land & Lifescapes, Inc. and its subsidiaries. Brian N. Edang. Head Investor Relations. Mr. Edang, 38, is a Certified Public Accountant. He graduated cum laude with a Bachelor of Science in Accountancy from the University of St. La Salle - Bacolod. He served in various capacities in the MB Villar Group of companies from 2004 to 2007. Prior to joining the group, he was with SGV & Co. (EY Philippines) as an external auditor from 1999 to 2003. He is currently the Investor Relations Head of Vista Land. Dante M. Julongbayan, Group Production Head. Mr. Julongbayan, 49, graduated from the University of the East with a degree in Bachelor of Science in Civil Engineering. He is a licensed Jr. Geodetic and Civil Engineer. He handled several technical positions within the MB Villar Group since 1993. He was the Marketing Division Head of Camella and Brittany from 2001-2006 and Technical Head of Camella, Crown Asia from 2007 to 2010 and Managing Director of Camella North Luzon from 2011 to 2014. At present he is the Group Production Head of Vista Land. Rodel Racadio. Vice President External Relations/ Technical Services Head. Mr. Racadio, 53, is a licensed Civil Engineer, graduated from the University of Santo Tomas as a consistent Scholar and Dean’s Lister with a Degree in Bachelor of Science in Civil Engineering. He also took a Construction Management Program at the Asian Institute of Management to enhance his expertise in line with the core business of the Company. From 1987, he handled various key positions in Construction, Planning and Design, Property Management, Project Utilities, and Permits and Licenses Departments of the MB Villar Group of Companies. Estrellita S. Tan, President, Prima Casa Land & Houses, Inc. Ms. Tan, 53, graduated with distinction from the Philippine School of Business Administration major in Accounting. She is a Certified Public Accountant and a licensed Real Estate Broker. She also completed the Management Devt. Program at the Vista Center for Professional Development. She worked with Sycip. Gorres. Velayo &'Co. as Senior Associate Auditor & F.J.Elizalde Group of Cos as Audit Supervisor & Controller of Philcite/Starcity before she joined & held various positions in the MB Villar Group of Companies since 1993. Board Meeting Attendance
Jan Jan Mar Apr Apr May Jun Jul Aug Sep Sep Nov Nov Dec Director's Name 5 13 16 4 19 11 15 4 11 22 28 11 23 21 Manuel B. Villar, Jr. P P P P P P P P P P P P P P Manuel Paolo A. Villar P P P P P P P P P P P P P P Cynthia J. Javarez P P P P P P P P P P P P P P Marcelino Mendoza P P P P P P P - - - - - - - Maribeth C. Tolentino P P P P P P P - - - - - - - Camille A. Villar - - - - - - - P P P P P P P Jerylle Luz C. Quismundo - - - - - - - P P P P P P P Marilou Adea P P P P P P P P P P P P P P Ruben O. Fruto P P P P P P P P P P P P P P
Legend : (A) Absent, (P) Present, (-) Not applicable
All of the incumbent Directors named above have a one year term of office and all have been nominated for re-election to the Board of Directors. The By-Laws of the Compay conforms with SRC Rule 38, as amended, with regard to the nomination of independent directors of the Companhy. Article III, Sections 2-A and 3 of the Company’s By-Laws provide as follows:
“Section 2-A. Independent Directors – The Corporation shall have at
least two (2) independent directors or at least twenty percent (20%) of the entire Board membership, whichever is lesser.

14
The independent directors shall have all the qualifications and none of the disqualifications set forth in Section 38 of the Securities Regulation Code and its Implementing Rules and Regulations, as the same may be amended from time to time. [As approved by the Board of Directors and the Stockholders at their respective meetings held on 16 March 2007].
Section 3. Election and Term - The Board of Directors shall be elected
during each regular meeting of stockholders and shall hold office for one (1) year and until their successors are elected and qualified.
A nomination committee is hereby created which may be organized from
time to time upon determination of the Board of Directors. The nomination committee shall be composed of at least three (3) members, one of whom shall be an independent director. The nomination committee shall have the following functions: (A) formulate screening policies to enable the committee to effectively review the qualification of the nominees for independent directors; and (B) conduct nominations for independent directors prior to the stockholders’ meeting in accordance with the procedures set forth in Rule 38 of the Amended Implementing Rules and Regulations of the Securities Regulation Code, as the same may be amended from time to time. [As approved by the Board of Directors and the Stockholders at their respective meetings held on 16 March 2007].”
On the other hand, SRC Rule 38, as amended, provides in part as follows:
“8. Nomination and Election of Independent Director/s The following rules shall be applicable to all covered companies: A. The Nomination Committee (the "Committee") shall have at least three
(3) members, one of whom is an independent director. It shall promulgate the guidelines or criteria to govern the conduct of the nomination. The same shall be properly disclosed in the Registrant's information or proxy statement or such other reports required to be submitted to the Commission.
B. Nomination of independent director/s shall be conducted by the Committee prior to a stockholders' meeting. All recommendations shall be signed by the nominating stockholders together with the acceptance and conformity by the would-be nominees.
C. The Committee shall pre-screen the qualifications and prepare a final list of all candidates and put in place screening policies and parameters to enable it to effectively review the qualifications of the nominees for independent director/s.
D. After the nomination, the Committee shall prepare a Final List of Candidates which shall contain all the information about all the nominees for independent directors, as required under Part IV (A) and (C) of Annex "C" of SRC Rule 12, which list, shall be made available to the Commission and to all stockholders through the filing and distribution of the Information Statement, in accordance with SRC Rule 20, or in such other reports the Registrant is required to submit to the Commission. The name of the person or group of persons who recommended the nomination of the independent director shall be identified in such report including any relationship with the nominee.
E. Only nominees whose names appear on the Final List of Candidates shall be eligible for election as Independent Director/s. No other nominations shall be entertained after the Final List of Candidates shall have been prepared. No further nominations shall be entertained or allowed on the floor during the actual annual stockholders'/memberships' meeting.”
The Company has complied with the guidelines on the nomination and election of independent directors set forth in Rule 38 of the Amended Implementing Rules and Regulations of the Securities

15
Regulation Code. The nominated independent directors, namely, Mr. Ruben O. Fruto and Ms. Marilou O. Adea were duly nominated by Ms. Marilyn J. Javier, a registered shareholder of the Company who is not a director, officer or substantial shareholder of the Company and who is not related to either of the said nominees. The Nominations Committee of the Company is composed of Mr. Manuel B. Villar, Jr., Chairman, and Jerylle Luz C. Quismundo and Ruben Fruto, members. Directors elected during the annual meeting of stockholders will hold office for one year until their successors are duly elected and qualified. A director who was elected to fill any vacancy holds office only for the unexpired term of his predecessor. No Director has resigned or declined to stand for re-election to the Board of Directors since the date of the last annual stockholders’ meeting due to disagreement with the Company on any matter relating to the Company’s operations, policies or practices. The Company has no other significant employee other than its Executive Officers. Mr. Manuel Paolo A. Villar and Ms. Camille Lydia A. Villar, who are both officers of the Company, are siblings and children of Mr. Manuel B. Villar, Jr., the Chairman of the Board. Except for the aforesaid relationship, none of the Company’s Directors or Executive Officers is related to the others by consanguinity or affinity within the fourth civil degree. Except as otherwise disclosed in the Annual Report of the Company (SEC Form 17-A) for the year ended December 31, 2016, the Company has not had any transaction during the last two (2) years in which any Director or Executive Officer or any of their immediate family members had a direct or indirect interest. None of the aforementioned Directors or Executive Officers is or has been involved in any criminal or bankruptcy proceeding, or is or has been subject to any judgment of a competent court barring or otherwise limiting his involvement in any type of business, or has been found to have violated any securities laws during the past five (5) years and up to the latest date. Compensation of Directors and Executive Officers Executive Compensation
The compensation for its executive officers for the years 2015 and 2016 (actual) and 2017 (projected) are shown below:
Name and Principal Position Year Salary Bonus Others Manuel Paolo A. Villar Cynthia J. Javarez Maribeth C. Tolentino Elizabeth M. Kalaw Jerry M. Navarrete Benjamarie Therese N. Serrano Aggregate executive compensation for above named officers
President & CEO Controller/ CFO President, Camella Homes/ Communities Philippines, Inc. Managing Director, Vista Residences, Inc. President, Starmalls, Inc. COO, Starmalls, Inc.
Actual 2015 Actual 2016 Projected 2017
P34.7M
P36.0M
P37.8M
P5.9M
P7.6M
P8.0M
P None P None P None
16
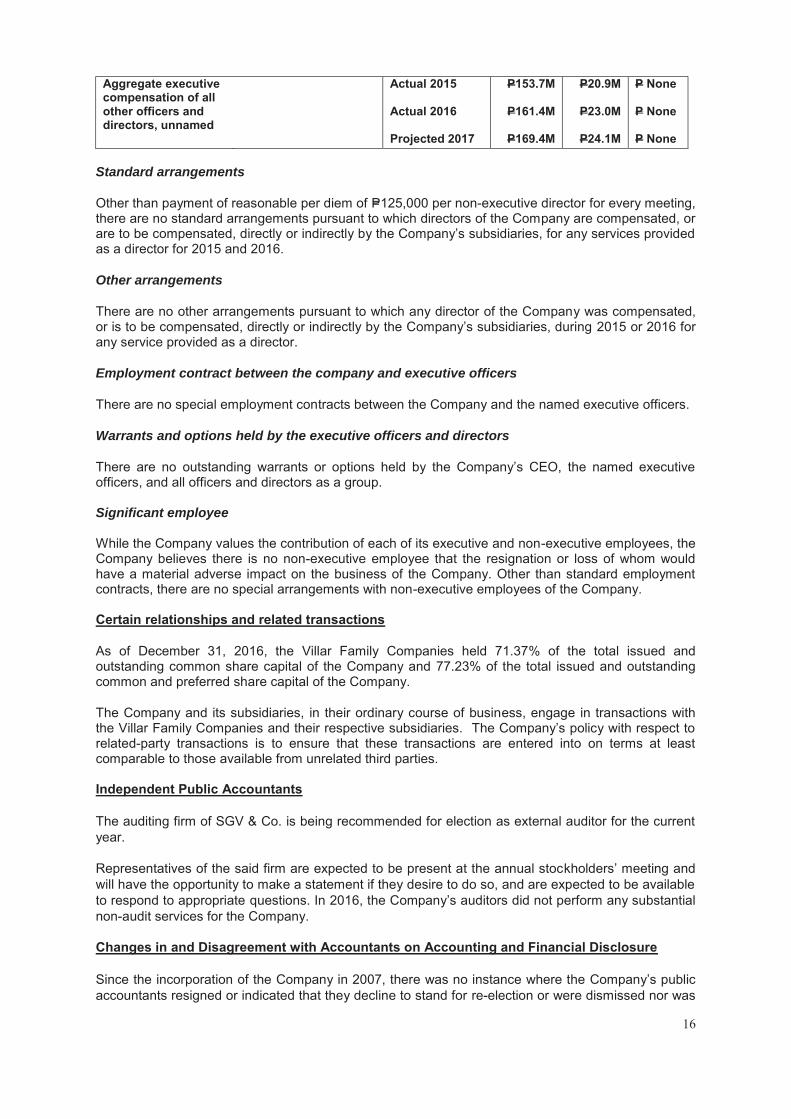
Aggregate executive compensation of all other officers and directors, unnamed
Actual 2015 Actual 2016 Projected 2017
P153.7M
P161.4M
P169.4M
P20.9M
P23.0M
P24.1M
P None P None P None
Standard arrangements
Other than payment of reasonable per diem of P=125,000 per non-executive director for every meeting, there are no standard arrangements pursuant to which directors of the Company are compensated, or are to be compensated, directly or indirectly by the Company’s subsidiaries, for any services provided as a director for 2015 and 2016.
Other arrangements
There are no other arrangements pursuant to which any director of the Company was compensated, or is to be compensated, directly or indirectly by the Company’s subsidiaries, during 2015 or 2016 for any service provided as a director.
Employment contract between the company and executive officers
There are no special employment contracts between the Company and the named executive officers.
Warrants and options held by the executive officers and directors
There are no outstanding warrants or options held by the Company’s CEO, the named executive officers, and all officers and directors as a group. Significant employee While the Company values the contribution of each of its executive and non-executive employees, the Company believes there is no non-executive employee that the resignation or loss of whom would have a material adverse impact on the business of the Company. Other than standard employment contracts, there are no special arrangements with non-executive employees of the Company. Certain relationships and related transactions
As of December 31, 2016, the Villar Family Companies held 71.37% of the total issued and outstanding common share capital of the Company and 77.23% of the total issued and outstanding common and preferred share capital of the Company.
The Company and its subsidiaries, in their ordinary course of business, engage in transactions with the Villar Family Companies and their respective subsidiaries. The Company’s policy with respect to related-party transactions is to ensure that these transactions are entered into on terms at least comparable to those available from unrelated third parties. Independent Public Accountants The auditing firm of SGV & Co. is being recommended for election as external auditor for the current year.
Representatives of the said firm are expected to be present at the annual stockholders’ meeting and will have the opportunity to make a statement if they desire to do so, and are expected to be available to respond to appropriate questions. In 2016, the Company’s auditors did not perform any substantial non-audit services for the Company. Changes in and Disagreement with Accountants on Accounting and Financial Disclosure Since the incorporation of the Company in 2007, there was no instance where the Company’s public accountants resigned or indicated that they decline to stand for re-election or were dismissed nor was

17
there any instance where the Company had any disagreement with its public accountants on any accounting or financial disclosure issue. The 2016 audit of the Company is in compliance with paragraph (3)(b)(iv) of SRC Rule 68, as amended, which provides that the external auditor should be rotated, or the handling partner changed, every five (5) years or earlier.
For Changes in Accounting Policies, refer to Note 4 - Summary of Significant Accounting Policies under Changes in Accounting Policies and Disclosures discussion on the Consolidated Financial Statements as of and for the years ended December 31, 2016, 2015, and 2014 included in this report. Audit Committee’s Approval Policies and Procedures
In relation to the audit of the Company’s annual financial statements, the Company's Corporate Governance Manual provides that the audit committee shall, among other activities, (i) evaluate significant issues reported by the external auditors in relation to the adequacy, efficiency and effectiveness of policies, controls, processes and activities of the Company; (ii) ensure that other non-audit work provided by the external auditors are not in conflict with their functions as external auditors; and (iii) ensure the compliance of the Company with acceptable auditing and accounting standards and regulations. The Audit Committee of the Company is composed of Ms. Marilou Adea, Chairman, and Mr. Ruben Fruto and Ms. Cynthia Javarez, members. External Audit and Audit-Related Fees The following table sets out the aggregate fees billed for each of the last two years for professional services rendered by SGV & Co.
2015 2016 (In P Thousands) Audit and Audit-Related Fees:
Fees for services that are normally provided by the external auditor in connection with statutory and regulatory filings or engagements
P 19,878
P 19,060 All other fees ̶ ̶ Total P 19,878 P 19,060
SGV & Co. does not have any direct or indirect interest in the Company
Tax Fees Except as provided above, the Company did not pay any tax fees and other fees to its external auditors. OTHER MATTERS Action with Respect to Reports The following reports will be submitted for approval by the stockholders: 1. The President's Report; and 2. Audited Financial Statements for the year 2016. Other Proposed Actions 1. Ratification of all acts and resolutions of the Board of Directors and Management for the year
2016 and until 31 March 2017 as set forth in the minutes of the meetings of the Board of Directors held during the same period and in the disclosures that have been duly filed with the SEC and the PSE. These minutes cover various resolutions of the Board, including declaration of cash dividends, approval of 2015 and 2016 Audited Financial Statements, resignation/election of members of the Board of Directors, refinancing of dollar loan obligations, guarantee subsidiaries

18
bilateral loans and additional Dollar Notes issued, issuance of Corporate Notes, authorizing the opening of bank accounts and designating the Company’s authorized signatories for various transactions in the normal course of business of the Company.
2. Election of External Auditors Voting Procedures Manner of voting
In all items for approval, except in the election of directors, each share of stock entitles its registered owner to one vote. For the purpose of electing directors, a stockholder may vote such number of his shares for as many persons as there are directors to be elected or he may cumulate said shares and give one candidate as many votes as the number of directors to be elected multiplied by the number of his shares shall equal, or he may distribute them in the same principle among as many candidates as he shall see fit. Unless required by law, or demanded by a stockholder present or represented at the meeting and entitled to vote thereat, voting need not be by ballot and will be done by show of hands.
Voting requirements
(a) With respect to the election of directors, candidates who received the highest number of votes
shall be declared elected. (b) With respect to the adoption of the Audited Financial Statements for the year ended 31
December 2016, as well as the approval or ratification of the other actions set forth under the heading “Other Proposed Actions” above, the vote of majority of the outstanding capital stock entitled to vote and represented in the meeting is required to approve such matters.
Method of counting votes
The Corporate Secretary will be responsible for counting votes based on the number of shares entitled to vote owned by the stockholders who are present or represented by proxies at the Annual Meeting of the stockholders.
UPON THE WRITTEN REQUEST OF A STOCKHOLDER, THE COMPANY UNDERTAKES TO FURNISH SAID STOCKHOLDER A COPY OF SEC FORM 17-A FREE OF CHARGE, EXCEPT FOR EXHIBITS ATTACHED THERETO WHICH SHALL BE CHARGED AT COST. ANY WRITTEN REQUEST FOR A COPY OF SEC FORM 17-A SHALL BE ADDRESSED AS FOLLOWS:
Vista Land & Lifescapes, Inc. 3rd Level Starmall Las Piñas C.V. Starr Avenue, Philamlife Village, Pamplona,
Las Piñas City, Philippines
Attention: Brian N. Edang
A copy of the Interim Unaudited Financial Statements (“IUFS”) of the Company as of and for the quarter ended March 31, 2017 with Management Discussion and Analysis shall be posted in the website of the Company (www.vistaland.com.ph) on or before June 10, 2017. A hard copy of the same IUFS will be provided to any requesting shareholder, as soon as said IUFS becomes available but in no case later than June 10, 2017. Any request for a hard copy of the aforementioned IUFS should be sent to the abovegiven address.

19
PART II
MANAGEMENT REPORT I. FINANCIAL STATEMENTS The Consolidated Financial Statements of the Company as of and for the year ended December 31, 2016 are incorporated herein in the accompanying Index to Financial Statements and Supplementary Schedules. II. INFORMATION ON INDEPENDENT ACCOUNTANT
SGV & Co., independent certified public accountants, audited the Company's consolidated financial statements without qualification as of and for the years ended December 31, 2016, 2015, and 2014, included in this report.
SGV & Co. has acted as the Company's external auditors since 2008 and as Camella Homes, Inc.’s external auditors since 1994. Michael C. Sabado is the current audit partner for the Company and the other subsidiaries The Company has not had any disagreements on accounting and financial disclosures with its current external auditors for the same periods or any subsequent interim period. SGV & Co. has neither shareholdings in the Company nor any right, whether legally enforceable or not, to nominate persons or to subscribe for the securities in the Company. SGV & Co. will not receive any direct or indirect interest in the Company or in any securities thereof (including options, warrants or rights thereto) pursuant to or in connection with the Offer. The foregoing is in accordance with the Code of Ethics for Professional Accountants in the Philippines set by the Board of Accountancy and approved by the Professional Regulation Commission.
In relation to the audit of the Company's annual financial statements, the Company's Corporate Governance Manual provides that the audit committee shall, among other activities (i) evaluate significant issues reported by the external auditors in relation to the adequacy, efficiency and effectiveness of policies, controls, processes and activities of the Company; (ii) ensure that other non-audit work provided by the external auditors are not in conflict with their functions as external auditors; and (iii) ensure the compliance of the Company with acceptable auditing and accounting standards and regulations.
The following table sets out the aggregate fees billed for each of the last two years for professional services rendered by SGV & Co.
2015 2016 (In P Thousands) Audit and Audit-Related Fees:
Fees for services that are normally provided by the external auditor in connection with statutory and regulatory filings or engagements
P 19,878
P 19,060 All other fees ̶ ̶ Total P 19,878 P 19,060
SGV & Co. does not have any direct or indirect interest in the Company

20
III. MANAGEMENT’S DISCUSSION AND ANALYSIS OR PLAN OF OPERATION REVIEW OF YEAR END 2016 VS YEAR END 2015 RESULTS OF OPERATIONS Revenues Real Estate The Company recorded revenue from real estate sales amounting to P=25,025.2 million for the year ended December 31, 2016 an increase of 2% from P=24,502.2 million in same period last year. This was primarily attributable to the increase in the overall completion rate of sold inventories of its business units particularly of Camella and Communities Philippines. The Company uses the Percentage of completion method of revenue recognition where revenue is recognized in reference to the stages of development of the properties.
Real estate revenue of Camella Homes increased by 20% to P=8,199.8 million for the year ended December 31, 2016 from P=6,807.5 million for the year ended December 31, 2015. This increase was principally attributable to the increase in the number of sold homes completed or under construction in the Mega Manila area in the low-cost and affordable housing segment during the year.
Real estate revenue of Communities Philippines increased by 8% to P=13,092.7 million for the
year ended December 31, 2016 from P=12,134.7 million for the year ended December 31, 2015. This increase was principally attributable to the increase in the number of sold homes completed or under construction outside the Mega Manila area in the low-cost and affordable housing segment during the year.
Real estate revenue of Crown Asia decreased to P=985.1 million for the year ended December 31, 2016 from P=1,314.0 million for the year ended December 31, 2015. This decrease was principally attributable to the decline in the number of sold homes completed or under construction in the Mega Manila area in the middle-income housing segment during the year.
Real estate revenue of Brittany decreased by 34% to P=645.4 million for the year ended
December 31, 2016 from P=981.9 million in the same period last year. This decrease was principally attributable to the decrease in the number of sold homes completed or under construction in the Mega Manila area in the high-end housing segment, which was a reflection of the Company’s focus on meeting the increased demand for housing in the low-cost and affordable segment serviced by its other business units.
Real estate revenue from Vista Residences decreased by 36% to P=2,102.1 million for the year ended December 31, 2016 from P=3,264.1 million for the year ended December 31, 2015. This decrease was principally attributable to the decrease in the number of sold condominium units completed or under construction during the year. Vista Residences is the business unit of Vista Land that develops and sells vertical projects across the Philippines.
Rental income Rental income increased by 85% from P=2,367.9 million for the year ended December 31, 2015 to P=4,375.3 million for the year ended December 31, 2016. The increase was primarily attributable the additional gross floor area leased out of our investment properties as well as increase in rental rates of our existing malls. Interest income from installment contract receivable Interest income from installment contract receivable decreased by 10% from P=710.3 million for the year ended December 31, 2015 to P=642.6 million for the year ended December 31, 2016. The decrease was primarily attributable decrease in the interest collected from buyers opting to get in-house financing as more of our buyers are getting bank mortgages to finance their purchase.

21
Miscellaneous Income Miscellaneous income decreased by 25% from P=1,268.6 million for the year ended December 31, 2015 to P=952.5 million for the year ended December 31, 2016. The decrease was primarily attributable the forfeited reservation fees and partial payments from customers whose sales contracts are cancelled before completion of required down payment as well as increase in other operating income and parking fees from our malls. Interest income from investments Interest income from investments increased by 46% from P=593.0 million for the year ended December 31, 2015 to P=864.4 million for the year ended December 31, 2016. The increase was primarily attributable to the increase in the amount invested by the Company to various debt instruments. The Company’s investments increased during the year due to the proceeds from various fund raising activities for the year. Other income (expenses) Other expense of P=7.0 million for the year ended December 31, 2015 increased to P=25.7 million for the year ended December 31, 2016. The increase in the other expense was primarily attributable increase in the foreign exchange losses recorded for the year from our interest payments to our dollar loans. Costs and Expenses Cost and expenses increased by 3% to P=19,915.5 million for the year ended December 31, 2016 from P=19,305.5 million for the year ended December 31, 2015.
Cost of real estate sales increased by 1% from P=12,253.9 million for the year ended December 31, 2015 to P=12,321.0 million for the year ended December 31, 2016 primarily due to the increase in the overall recorded sales of Vista Land’s business units.
Operating expenses increased by 8% from P=7,051.6 million for the year ended December 31, 2015 to P=7,594.5 million for the year ended December 31, 2016 primarily due to the following:
o an increase in commissions from P=1,247.6 million for the year ended December 31, 2015 to P=1,376.4 million for the year ended December 31, 2016 resulting from increase in sales of the Company during the year.
o an increase in salaries, wages and employee benefits from P=1,247.6 million for the
year ended December 31, 2015 to P=1,281.7 million for the year ended December 31, 2016 resulting from the increase in total number of employees hired to keep pace with the Company’s expansion into new geographic areas and new projects in both commercial and residential segment.
o an increase in depreciation and amortization from P=798.9 million for the year ended
December 31, 2015 to P=1,030.0 million in the year ended December 31, 2016 due to the increase in investment properties and additions to property and equipment for the year.
Interest and other financing charges Interest and other financing charges increased by 15% from P=1,941.4 million for the year ended December 31, 2015 to P=2,236.3 million for the year ended December 31, 2016. The increase was primarily attributable increase in the interest bearing debt of the Company for the year. Provision for Income Tax Provision for income tax increased by 58% from P=1,001.0 million for the year ended December 31, 2015 to P=1,582.2 million for the year ended December 31, 2016 primarily due to a higher taxable base for the year.
22
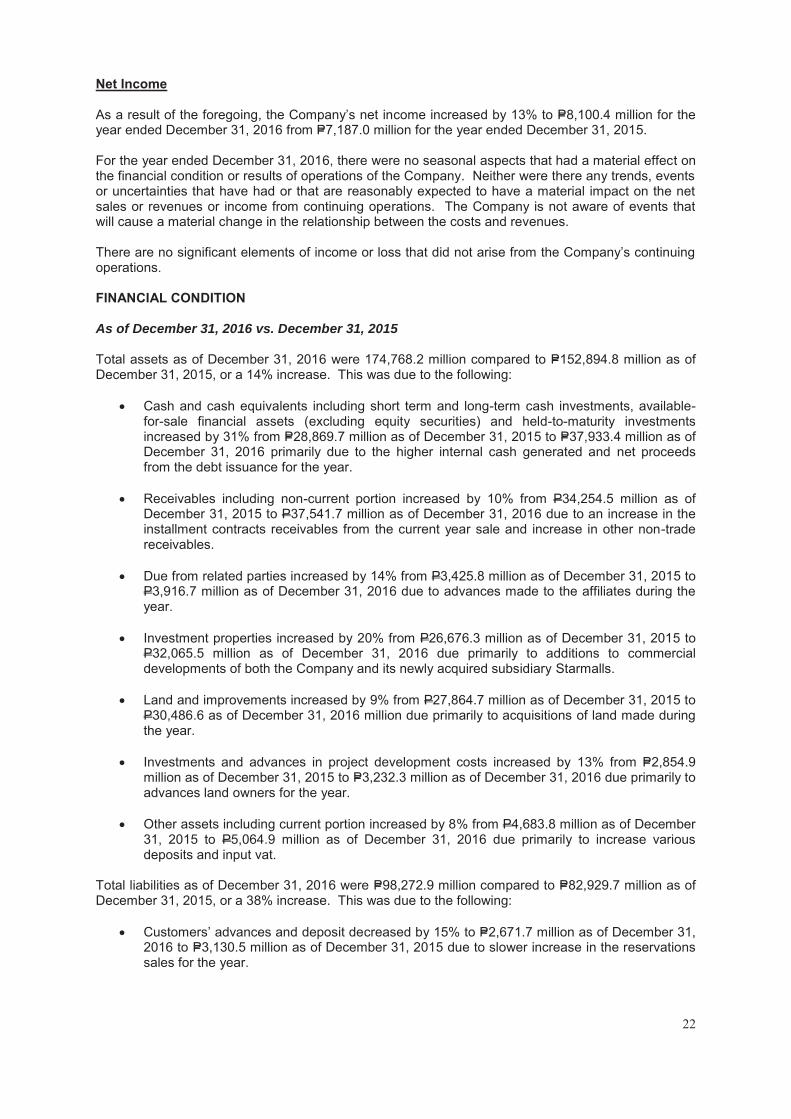
Net Income As a result of the foregoing, the Company’s net income increased by 13% to P=8,100.4 million for the year ended December 31, 2016 from P=7,187.0 million for the year ended December 31, 2015. For the year ended December 31, 2016, there were no seasonal aspects that had a material effect on the financial condition or results of operations of the Company. Neither were there any trends, events or uncertainties that have had or that are reasonably expected to have a material impact on the net sales or revenues or income from continuing operations. The Company is not aware of events that will cause a material change in the relationship between the costs and revenues. There are no significant elements of income or loss that did not arise from the Company’s continuing operations. FINANCIAL CONDITION As of December 31, 2016 vs. December 31, 2015 Total assets as of December 31, 2016 were 174,768.2 million compared to P=152,894.8 million as of December 31, 2015, or a 14% increase. This was due to the following:
Cash and cash equivalents including short term and long-term cash investments, available-for-sale financial assets (excluding equity securities) and held-to-maturity investments increased by 31% from P=28,869.7 million as of December 31, 2015 to P=37,933.4 million as of December 31, 2016 primarily due to the higher internal cash generated and net proceeds from the debt issuance for the year.
Receivables including non-current portion increased by 10% from P34,254.5 million as of
December 31, 2015 to P37,541.7 million as of December 31, 2016 due to an increase in the installment contracts receivables from the current year sale and increase in other non-trade receivables.
Due from related parties increased by 14% from P3,425.8 million as of December 31, 2015 to P3,916.7 million as of December 31, 2016 due to advances made to the affiliates during the year.
Investment properties increased by 20% from P26,676.3 million as of December 31, 2015 to P32,065.5 million as of December 31, 2016 due primarily to additions to commercial developments of both the Company and its newly acquired subsidiary Starmalls.
Land and improvements increased by 9% from P27,864.7 million as of December 31, 2015 to P30,486.6 as of December 31, 2016 million due primarily to acquisitions of land made during the year.
Investments and advances in project development costs increased by 13% from P=2,854.9
million as of December 31, 2015 to P=3,232.3 million as of December 31, 2016 due primarily to advances land owners for the year.
Other assets including current portion increased by 8% from P4,683.8 million as of December 31, 2015 to P5,064.9 million as of December 31, 2016 due primarily to increase various deposits and input vat.
Total liabilities as of December 31, 2016 were P=98,272.9 million compared to P=82,929.7 million as of December 31, 2015, or a 38% increase. This was due to the following:
Customers’ advances and deposit decreased by 15% to P=2,671.7 million as of December 31, 2016 to P=3,130.5 million as of December 31, 2015 due to slower increase in the reservations sales for the year.

23
Income tax payable decreased by 15% million from P=158.2 million as of December 31, 2015 to P=134.0 million as of December 31, 2016 due primarily to settlements for the year.
Notes payable including non-current portion increased by 30% from P=30,428.9 million as of December 31, 2015 to P=39,525.1 million as of December 31, 2016 due primarily to the issuance of dollar notes and peso corporate notes for the year.
Bank loans including non-current portion increased by 18% from P=30,539.7 million as of December 31, 2015 to P=36,087.2 million as of December 31, 2016 due to availments made during the period.
Loans payable (representing the sold portion of the Company’s installment contracts receivables with recourse) including non-current portion, increased by 5% from P=3,694.9 million as of December 31, 2015 to P=3,887.3 million as of December 31, 2016 due to sale of receivables for the year.
Pension liabilities decreased by 14% from P114.5 million as of December 31, 2015 to P98.1 million as of December 31, 2016 due to actuarial adjustments for the year.
Deferred tax liabilities – net increased by 31% from P1,247.1 million as of December 31, 2015
to P1,628.5 million as of December 31, 2016 due to adjustments of previously recorded deferred tax liabilities.
Other noncurrent liabilities increased by 13% from P=2,097.4 million as of December 31, 2015 to P=2,378.5 million as of December 31, 2015 due to payment of liabilities for purchase land.
Total stockholder’s equity increased by 9% from P=69,965.1 million as of December 31, 2015 to P=76,495.3 million as of December 31, 2016 due to issuance of common stock, buyback of shares and the net income recorded for the year ended December 31, 2016. Considered as the top five key performance indicators of the Company as shown below:
Notes:
(a) Current Ratio: This ratio is obtained by dividing the Current Assets of the Company by its Current liabilities. This ratio is used as a test of the
Company’s liquidity.
(b) Liability-to-equity ratio: This ratio is obtained by dividing the Company’s Total Liabilities by its Total Equity. The ratio reveals the proportion of
liability and equity a company is using to finance its business. It also measures a company’s borrowing capacity.
(c) Interest expense/Income before interest expense: This ratio is obtained by dividing interest expense for the period by its income before interest
expense. This ratio shows whether a company is earning enough profits before interest to pay its interest cost comfortably
(d) Return on assets: This ratio is obtained by dividing the Company’s net income by its total assets. This measures the Company’s earnings in
relation to all of the resources it had at its disposal.
(e) Return on equity: This ratio is obtained by dividing the Company’s net income by its total equity. This measures the rate of return on the
ownership interest of the Company’s stockholders.
Because there are various calculation methods for the performance indicators above, the Company’s presentation of such may not be comparable to
similarly titled measures used by other companies.
Current ratio as of December 31, 2016 decreased from that of December 31, 2015 due primarily to the increase in the current portion of bank loans and loans payable.
Key Performance Indicators 12/31/2016 12/31/2015 Current ratio (a) 3.12:1 3.42:1 Liability-to-equity ratio (b) 1.28:1 1.19:1 Interest expense/Income before
Interest expense (c) 18.8% 19.2%
Return on assets (d) 4.6% 4.7% Return on equity (e) 10.6% 10.3%

24
Liability-to-equity ratio increased due to the increase in the total liabilities brought by the proceeds from banks loans and notes payable. Interest expense as a percentage of income before interest expense decreased in the year ended December 31, 2016 compared to the ratio for the year ended December 31, 2015 due to the lower interest expense for the year. Return on asset remained constant for December 31, 2016 compared to that on December 31, 2015. Return on equity slightly increased due primarily to the higher net income reported for the year ended December 31, 2016.
Material Changes to the Company’s Balance Sheet as of December 31, 2015 compared to December 31, 2014 (increase/decrease of 5% or more)
Cash and cash equivalents including short term and long-term cash investments, available-for-sale financial assets (excluding equity securities) and held-to-maturity investments increased by 31% from P=28,869.7 million as of December 31, 2015 to P=37,933.4 million as of December 31, 2016 primarily due to the higher internal cash generated and net proceeds from the debt issuance for the year.
Receivables including non-current portion increased by 10% from P34,254.5 million as of December 31, 2015 to P37,541.7 million as of December 31, 2016 due to an increase in the installment contracts receivables from the current year sale and increase in other non-trade receivables.
Due from related parties increased by 14% from P3,425.8 million as of December 31, 2015 to P3,916.7 million as of December 31, 2016 due to advances made to the affiliates during the year.
Investment properties increased by 20% from P26,676.3 million as of December 31, 2015 to P32,065.5 million as of December 31, 2016 due primarily to additions to commercial developments of both the Company and its newly acquired subsidiary Starmalls.
Land and improvements increased by 9% from P27,864.7 million as of December 31, 2015 to P30,486.6 as of December 31, 2016 million due primarily to acquisitions of land made during the year.
Investments and advances in project development costs increased by 13% from P=2,854.9 million as of December 31, 2015 to P=3,232.3 million as of December 31, 2016 due primarily to advances land owners for the year.
Other assets including current portion increased by 8% from P4,683.8 million as of December 31, 2015 to P5,064.9 million as of December 31, 2016 due primarily to increase various deposits and input vat. Customers’ advances and deposit decreased by 15% to P=2,671.7 million as of December 31, 2016 to P=3,130.5 million as of December 31, 2015 due to slower increase in the reservations sales for the year.
Income tax payable decreased by 15% million from P=158.2 million as of December 31, 2015 to P=134.0 million as of December 31, 2016 due primarily to settlements for the year.
Notes payable including non-current portion increased by 30% from P=30,428.9 million as of December 31, 2015 to P=39,525.1 million as of December 31, 2016 due primarily to the issuance of dollar notes and peso corporate notes for the year.
Bank loans including non-current portion increased by 18% from P=30,539.7 million as of December 31, 2015 to P=36,087.2 million as of December 31, 2016 due to availments made during the period.

25
Loans payable (representing the sold portion of the Company’s installment contracts receivables with recourse) including non-current portion, increased by 5% from P=3,694.9 million as of December 31, 2015 to P=3,887.3 million as of December 31, 2016 due to sale of receivables for the year.
Pension liabilities decreased by 14% from P114.5 million as of December 31, 2015 to P98.1 million as of December 31, 2016 due to actuarial adjustments for the year.
Deferred tax liabilities – net increased by 31% from P1,247.1 million as of December 31, 2015 to P1,628.5 million as of December 31, 2016 due to adjustments of previously recorded deferred tax liabilities.
Other noncurrent liabilities increased by 13% from P=2,097.4 million as of December 31, 2015 to P=2,378.5 million as of December 31, 2015 due to payment of liabilities for purchase land. Total stockholder’s equity increased by 9% from P=69,965.1 million as of December 31, 2015 to P=76,495.3 million as of December 31, 2016 due to issuance of common stock, buyback of shares and the net income recorded for the year ended December 31, 2016.
Material Changes to the Company’s Statement of income for the year ended December 31, 2015 compared to the year ended December 31, 2014 (increase/decrease of 5% or more)
Revenue from real estate sales amounting to P=25,025.2 million for the year ended December 31, 2016 an increase of 2% from P=24,502.2 million in same period last year primarily attributable to the increase in the overall completion rate of sold inventories of its business units particularly of Camella and Communities Philippines. Rental income increased by 85% from P=2,367.9 million for the year ended December 31, 2015 to P=4,375.3 million for the year ended December 31, 2016 primarily attributable the additional gross floor area leased out of our investment properties as well as increase in rental rates of our existing malls. Interest income from installment contract receivable decreased by 10% from P=710.3 million for the year ended December 31, 2015 to P=642.6 million for the year ended December 31, 2016 primarily attributable decrease in the interest collected from buyers opting to get in-house financing as more of our buyers are getting bank mortgages to finance their purchase. Miscellaneous income decreased by 25% from P=1,268.6 million for the year ended December 31, 2015 to P=952.5 million for the year ended December 31, 2016 primarily attributable the forfeited reservation fees and partial payments from customers whose sales contracts are cancelled before completion of required down payment as well as increase in other operating income and parking fees from our malls. Interest income from investments increased by 46% from P=593.0 million for the year ended December 31, 2015 to P=864.4 million for the year ended December 31, 2016 primarily attributable to the increase in the amount invested by the Company to various debt instruments. The Company’s investments increased during the year due to the proceeds from various fund raising activities for the year.
Operating expenses increased by 8% from P=7,051.6 million for the year ended December 31, 2015 to P=7,594.5 million for the year ended December 31, 2016 primarily due to the increase in commissions resulting from increase in sales for the year, increase in salaries, wages and increase in depreciation and amortization due to the increase in investment properties and additions to property and equipment for the year.
Interest and other financing charges increased by 15% from P=1,941.4 million for the year ended December 31, 2015 to P=2,236.3 million for the year ended December 31, 2016 primarily attributable increase in the interest bearing debt of the Company for the year.

26
Provision for income tax increased by 58% from P=1,001.0 million for the year ended December 31, 2015 to P=1,582.2 million for the year ended December 31, 2016 primarily due to a higher taxable base for the year.
The Company’s net income increased by 13% to P=8,100.4 million for the year ended December 31, 2016 from P=7,187.0 million for the year ended December 31, 2015.
There are no other material changes in the Company’s financial position (changes of 5% or more) and condition that will warrant a more detailed discussion. Further, there are no material events and uncertainties known to management that would impact or change reported financial information and condition on the Company. REVIEW OF YEAR END 2015 VS YEAR END 2014 RESULTS OF OPERATIONS Revenues Real Estate The Company recorded revenue from real estate sales amounting to P=24,502.2 million for the year ended December 31, 2015 an increase of 10% from P=22,320.7 million in same period last year. This was primarily attributable to the increase in the overall completion rate of sold inventories of its business units particularly of Communities Philippines, Vista Residences and Crown Asia. The Company uses the Percentage of completion method of revenue recognition where revenue is recognized in reference to the stages of development of the properties.
Real estate revenue from Vista Residences increased by 57% to P=3,264.1 million for the year ended December 31, 2015 from P=2,073.3 million for the year ended December 31, 2014. This increase was principally attributable to the increase in the number of sold condominium units completed or under construction during the year. Vista Residences is the business unit of Vista Land that develops and sells vertical projects across the Philippines.
Real estate revenue of Camella Homes increased to P=6,807.5 million for the year ended
December 31, 2015 from P=6,257.4 million for the year ended December 31, 2014. This increase was principally attributable to the increase in the number of sold homes completed or under construction in the Mega Manila area in the low-cost and affordable housing segment during the year.
Real estate revenue of Communities Philippines increased by 17% to P=12,134.7 million for
the year ended December 31, 2015 from P=10,373.3 million for the year ended December 31, 2014. This increase was principally attributable to the increase in the number of sold homes completed or under construction outside the Mega Manila area in the low-cost and affordable housing segment during the year.
Real estate revenue of Crown Asia decreased to P=1,314.0 million for the year ended
December 31, 2015 from P=2,327.9 million for the year ended December 31, 2014. This decrease was principally attributable to the decline in the number of sold homes completed or under construction in the Mega Manila area in the middle-income housing segment during the year.
Real estate revenue of Brittany decreased by 18% to P=981.9 million for the year ended
December 31, 2015 from P=1,203.4 million in the same period last year. This decrease was principally attributable to the decrease in the number of sold homes completed or under construction in the Mega Manila area in the high-end housing segment, which was a reflection of the Company’s focus on meeting the increased demand for housing in the low-cost and affordable as well as in the middle-income housing segments serviced by its other business units.

27
Rental income Rental income increased by 51% from P=1,567.8 million for the year ended December 31, 2014 to P=2,367.9 million for the year ended December 31, 2015. The increase was primarily attributable the additional gross floor area of our investment properties as well as increase in rental rates of our existing malls. Interest income from installment contract receivable Interest income from installment contract receivable decreased by 7% from P=760.6 million for the year ended December 31, 2014 to P=710.3 million for the year ended December 31, 2015. The decrease was primarily attributable decrease in the interest collected from buyers opting to get in-house financing as more of our buyers are getting bank mortgages to finance their purchase. Miscellaneous Income Miscellaneous income increased by 28% from P=990.3 million for the year ended December 31, 2014 to P=1,268.6 million for the year ended December 31, 2015. The increase was primarily attributable the forfeited reservation fees and partial payments from customers whose sales contracts are cancelled before completion of required down payment as well as increase in other operating income and parking fees from our malls. Interest income from investments Interest income from investments increased by 35% from P=439.0 million for the year ended December 31, 2014 to P=593.0 million for the year ended December 31, 2015. The increase was primarily attributable to the increase in the amount invested by the Company to various debt instruments. The Company’s investments increased during the year due to the proceeds from various fund raising activities. Other income (expenses) Other expense of P=29.3 million for the year ended December 31, 2014 decreased by 76% to P=7.0 million for the year ended December 31, 2015. The decrease in the other expense was primarily attributable decrease in the foreign exchange losses recorded for the year. Costs and Expenses Cost and expenses increased by 10% to P=19,305.5 million for the year ended December 31, 2015 from P=17,618.2 million for the year ended December 31, 2014.
Cost of real estate sales increased by 11% from P=11,032.3 million for the year ended December 31, 2014 to P=12,253.9 million for the year ended December 31, 2015 primarily due to the increase in the overall recorded sales of Vista Land’s business units.
Operating expenses increased by 7% from P=6,586.0 million for the year ended December 31,
2014 to P=7,051.6 million for the year ended December 31, 2015 primarily due to the following:
o an increase in commissions from P=1,207.3 million for the year ended December 31, 2014 to P=1,247.6 million for the year ended December 31, 2015 resulting from increase in sales of the Company during the year.
o an increase in salaries, wages and employee benefits from P=973.6 million for the year
ended December 31, 2014 to P=1,247.6 million for the year ended December 31, 2015 resulting from the increase in total number of employees hired to keep pace with the Company’s expansion into new geographic areas and new projects.
o an increase in depreciation and amortization from P=722.1 million for the year ended
December 31, 2014 to P=798.9 million in the year ended December 31, 2015 due to the increase in investment properties and additions to property and equipment for the year.
Interest and other financing charges Interest and other financing charges increased by 38% from P=1,403.0 million for the year ended December 31, 2014 to P=1,941.4 million for the year ended December 31, 2015. The increase was primarily attributable increase in the interest bearing debt of the Company for the year.

28
Provision for Income Tax Provision for income tax increased by 35% from P=741.4 million for the year ended December 31, 2014 to P=1,001.0 million for the year ended December 31, 2015 primarily due to a higher taxable base for the year. Net Income As a result of the foregoing, the Company’s net income increased by 14% to P=7,187.0 million for the year ended December 31, 2015 from P=6,286.4 million for the year ended December 31, 2014. For the year ended December 31, 2015, there were no seasonal aspects that had a material effect on the financial condition or results of operations of the Company. Neither were there any trends, events or uncertainties that have had or that are reasonably expected to have a material impact on the net sales or revenues or income from continuing operations. The Company is not aware of events that will cause a material change in the relationship between the costs and revenues. There are no significant elements of income or loss that did not arise from the Company’s continuing operations. FINANCIAL CONDITION As of December 31, 2015 vs. December 31, 2014 Total assets as of December 31, 2015 were P=152,894.8 million compared to P=124,987.5 million as of December 31, 2014, or a 22% increase. This was due to the following:
Cash and cash equivalents including short term and long-term cash investments, available-for-sale financial assets (excluding equity securities) and held-to-maturity investments increased by 4% from P=27,687.9 million as of December 31, 2014 to P=28,869.7 million as of December 31, 2015 primarily due to the net proceeds from the issuance of dollar notes for the year.
Receivables including non-current portion increased by 22% from P27,985.8 million as of December 31, 2014 to P34,254.5 million as of December 31, 2015 due to an increase in the installment contracts receivables from the current year sale and increase in other non-trade receivables.
Due from related parties decreased by 7% from P3,679.0 million as of December 31, 2014 to P3,425.8 million as of December 31, 2015 due to settlements made by the affiliates during the year.
Real estate inventories increased by 28% from P17,926.0 million as of December 31, 2014 to P22,855.7 million as of December 31, 2015 due to the launching and opening of new projects during the year.
Investment properties increased by 64% from P16,312.0 million as of December 31, 2014 to
P26,676.3 million as of December 31, 2015 due primarily to additions to commercial developments of both the Company and its newly acquired subsidiary Starmalls.
Land and improvements increased by 10% from P25,262.2 million as of December 31, 2014 to P27,864.7 as of December 31, 2015 million due primarily to acquisitions of land made during the year.
Property and equipment increased by 68% from P476.1 million as of December 31, 2014 to
P801.0 million as of December 31, 2015 due to acquisitions made during the year.
Investments and advances in project development costs increased by 80% from P=1,583.8 million as of December 31, 2014 to P=2,854.9 million as of December 31, 2015 due primarily to advances land owners for the year.
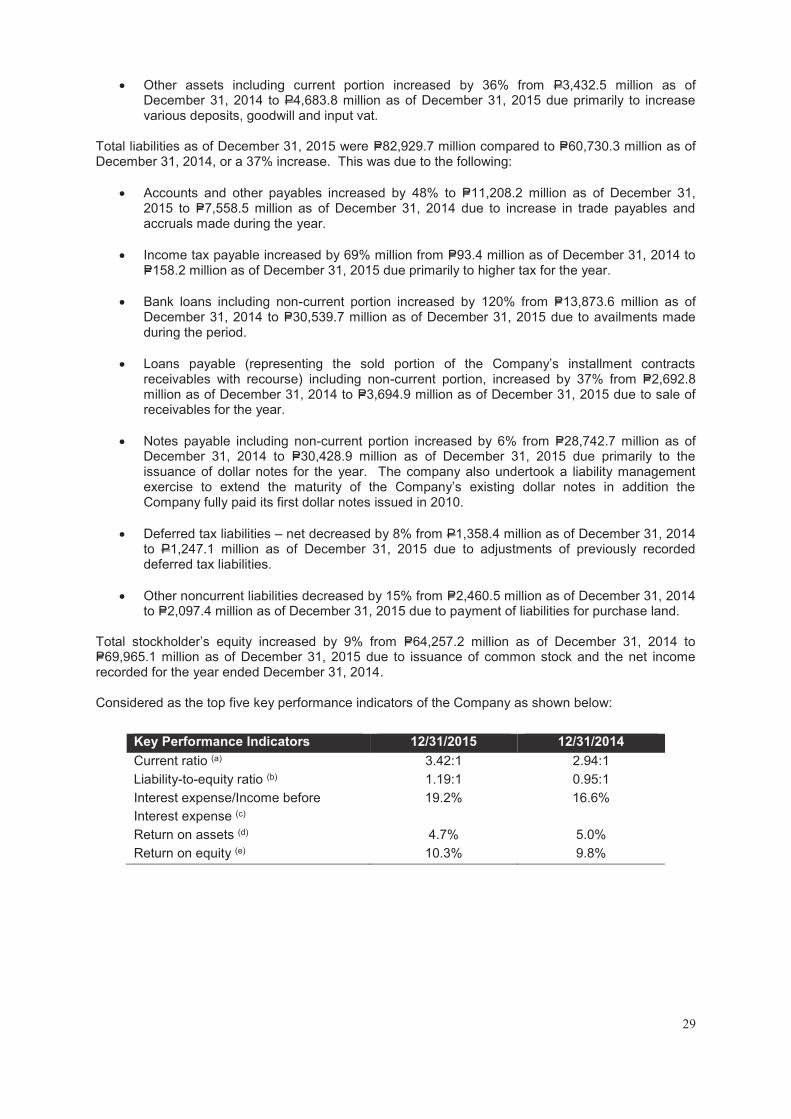
29
Other assets including current portion increased by 36% from P3,432.5 million as of December 31, 2014 to P4,683.8 million as of December 31, 2015 due primarily to increase various deposits, goodwill and input vat.
Total liabilities as of December 31, 2015 were P=82,929.7 million compared to P=60,730.3 million as of December 31, 2014, or a 37% increase. This was due to the following:
Accounts and other payables increased by 48% to P=11,208.2 million as of December 31, 2015 to P=7,558.5 million as of December 31, 2014 due to increase in trade payables and accruals made during the year.
Income tax payable increased by 69% million from P=93.4 million as of December 31, 2014 to P=158.2 million as of December 31, 2015 due primarily to higher tax for the year.
Bank loans including non-current portion increased by 120% from P=13,873.6 million as of December 31, 2014 to P=30,539.7 million as of December 31, 2015 due to availments made during the period.
Loans payable (representing the sold portion of the Company’s installment contracts receivables with recourse) including non-current portion, increased by 37% from P=2,692.8 million as of December 31, 2014 to P=3,694.9 million as of December 31, 2015 due to sale of receivables for the year.
Notes payable including non-current portion increased by 6% from P=28,742.7 million as of December 31, 2014 to P=30,428.9 million as of December 31, 2015 due primarily to the issuance of dollar notes for the year. The company also undertook a liability management exercise to extend the maturity of the Company’s existing dollar notes in addition the Company fully paid its first dollar notes issued in 2010.
Deferred tax liabilities – net decreased by 8% from P1,358.4 million as of December 31, 2014
to P1,247.1 million as of December 31, 2015 due to adjustments of previously recorded deferred tax liabilities.
Other noncurrent liabilities decreased by 15% from P=2,460.5 million as of December 31, 2014 to P=2,097.4 million as of December 31, 2015 due to payment of liabilities for purchase land.
Total stockholder’s equity increased by 9% from P=64,257.2 million as of December 31, 2014 to P=69,965.1 million as of December 31, 2015 due to issuance of common stock and the net income recorded for the year ended December 31, 2014. Considered as the top five key performance indicators of the Company as shown below:
Key Performance Indicators 12/31/2015 12/31/2014 Current ratio (a) 3.42:1 2.94:1 Liability-to-equity ratio (b) 1.19:1 0.95:1 Interest expense/Income before Interest expense (c)
19.2% 16.6%
Return on assets (d) 4.7% 5.0% Return on equity (e) 10.3% 9.8%

30
Notes:
(a) Current Ratio: This ratio is obtained by dividing the Current Assets of the Company by its Current liabilities. This ratio is used as a test of the
Company’s liquidity.
(b) Liability-to-equity ratio: This ratio is obtained by dividing the Company’s Total Liabilities by its Total Equity. The ratio reveals the proportion of
liability and equity a company is using to finance its business. It also measures a company’s borrowing capacity.
(c) Interest expense/Income before interest expense: This ratio is obtained by dividing interest expense for the period by its income before interest
expense. This ratio shows whether a company is earning enough profits before interest to pay its interest cost comfortably
(d) Return on assets: This ratio is obtained by dividing the Company’s net income by its total assets. This measures the Company’s earnings in
relation to all of the resources it had at its disposal.
(e) Return on equity: This ratio is obtained by dividing the Company’s net income by its total equity. This measures the rate of return on the
ownership interest of the Company’s stockholders.
Because there are various calculation methods for the performance indicators above, the Company’s presentation of such may not be comparable to
similarly titled measures used by other companies.
Current ratio as of December 31, 2015 increased from that of December 31, 2014 due primarily to the increase in the current portion of receivables and real estate inventories. Debt-to-equity ratio increased due to the increase in the total liabilities brought by the issuance of dollar notes. Interest expense as a percentage of income before interest expense increased in the year ended December 31, 2015 compared to the ratio for the year ended December 31, 2014 due to the higher earnings for the year. Return on asset decreased for December 31, 2015 compared to that on December 31, 2014 due primarily to the increase in total assets resulting primarily to the newly acquired subsidiary. Return on equity increased due primarily to the higher net income reported for the year ended December 31, 2015.
Material Changes to the Company’s Balance Sheet as of December 31, 2015 compared to December 31, 2014 (increase/decrease of 5% or more)
Receivables including non-current portion increased by 22% from P27,985.8 million as of December 31, 2014 to P34,254.5 million as of December 31, 2015 due to an increase in the installment contracts receivables from the current year sale and increase in other non-trade receivables.
Due from related parties decreased by 7% from P3,679.0 million as of December 31, 2014 to P3,425.8 million as of December 31, 2015 due to settlements made by the affiliates during the year.
Real estate inventories increased by 28% from P17,926.0 million as of December 31, 2014 to P22,855.7 million as of December 31, 2015 due to the launching and opening of new projects during the year.
Investment properties increased by 64% from P16,312.0 million as of December 31, 2014 to P26,676.3 million as of December 31, 2015 due primarily to additions to commercial developments of both the Company and its newly acquired subsidiary Starmalls.
Land and improvements increased by 10% from P25,262.2 million as of December 31, 2014 to P27,864.7 as of December 31, 2015 million due primarily to acquisitions of land made during the year.
Property and equipment increased by 68% from P476.1 million as of December 31, 2014 to P801.0 million as of December 31, 2015 due to acquisitions made during the year.

31
Investments and advances in project development costs increased by 80% from P=1,583.8 million as of December 31, 2014 to P=2,854.9 million as of December 31, 2015 due primarily to advances land owners for the year.
Other assets including current portion increased by 36% from P3,432.5 million as of December 31, 2014 to P4,683.8 million as of December 31, 2015 due primarily to increase various deposits, goodwill and input vat. Accounts and other payables increased by 48% to P=11,208.2 million as of December 31, 2015 to P=7,558.5 million as of December 31, 2014 due to increase in trade payables and accruals made during the year.
Income tax payable increased by 69% million from P=93.4 million as of December 31, 2014 to P=158.2 million as of December 31, 2015 due primarily to higher tax for the year.
Bank loans including non-current portion increased by 120% from P=13,873.6 million as of December 31, 2014 to P=30,539.7 million as of December 31, 2015 due to availments made during the period.
Loans payable (representing the sold portion of the Company’s installment contracts receivables with recourse) including non-current portion, increased by 37% from P=2,692.8 million as of December 31, 2014 to P=3,694.9 million as of December 31, 2015 due to sale of receivables for the year.
Notes payable including non-current portion increased by 6% from P=28,742.7 million as of December 31, 2014 to P=30,428.9 million as of December 31, 2015 due primarily to the issuance of dollar notes for the year. The company also undertook a liability management exercise to extend the maturity of the Company’s existing dollar notes in addition the Company fully paid its first dollar notes issued in 2010.
Deferred tax liabilities – net decreased by 8% from P1,358.4 million as of December 31, 2014 to P1,247.1 million as of December 31, 2015 due to adjustments of previously recorded deferred tax liabilities.
Other noncurrent liabilities decreased by 15% from P=2,460.5 million as of December 31, 2014 to P=2,097.4 million as of December 31, 2015 due to payment of liabilities for purchase land. Total stockholder’s equity increased by 9% from P=64,257.2 million as of December 31, 2014 to P=69,965.1 million as of December 31, 2015 due to issuance of common stock and the net income recorded for the year ended December 31, 2014.
Material Changes to the Company’s Statement of income for the year ended December 31, 2015 compared to the year ended December 31, 2014 (increase/decrease of 5% or more)
Revenue from real estate sales amounting to P=24,502.2 million for the year ended December 31, 2015 an increase of 10% from P=22,320.7 million in same period last year. Rental income increased by 47% from P=1,527.0 million for the year ended December 31, 2014 to P=2,246.1 million for the year ended December 31, 2015 primarily due to the additional gross floor area of our investment properties as well as increase in rental rates of our existing malls. Interest income from installment contract receivable decreased by 7% from P=760.6 million for the year ended December 31, 2014 to P=710.3 million for the year ended December 31, 2015 primarily due to the decrease in the interest collected from buyers opting to get in-house financing as more of our buyers are getting bank mortgages to finance their purchase. Miscellaneous income increased by 37% from P=900.0 million for the year ended December 31, 2014 to P=1,231.0 million for the year ended December 31, 2015 primarily due to the forfeited reservation fees and partial payments from customers whose sales contracts are cancelled before completion of required down payment as well as increase in other operating income and parking fees from our malls.
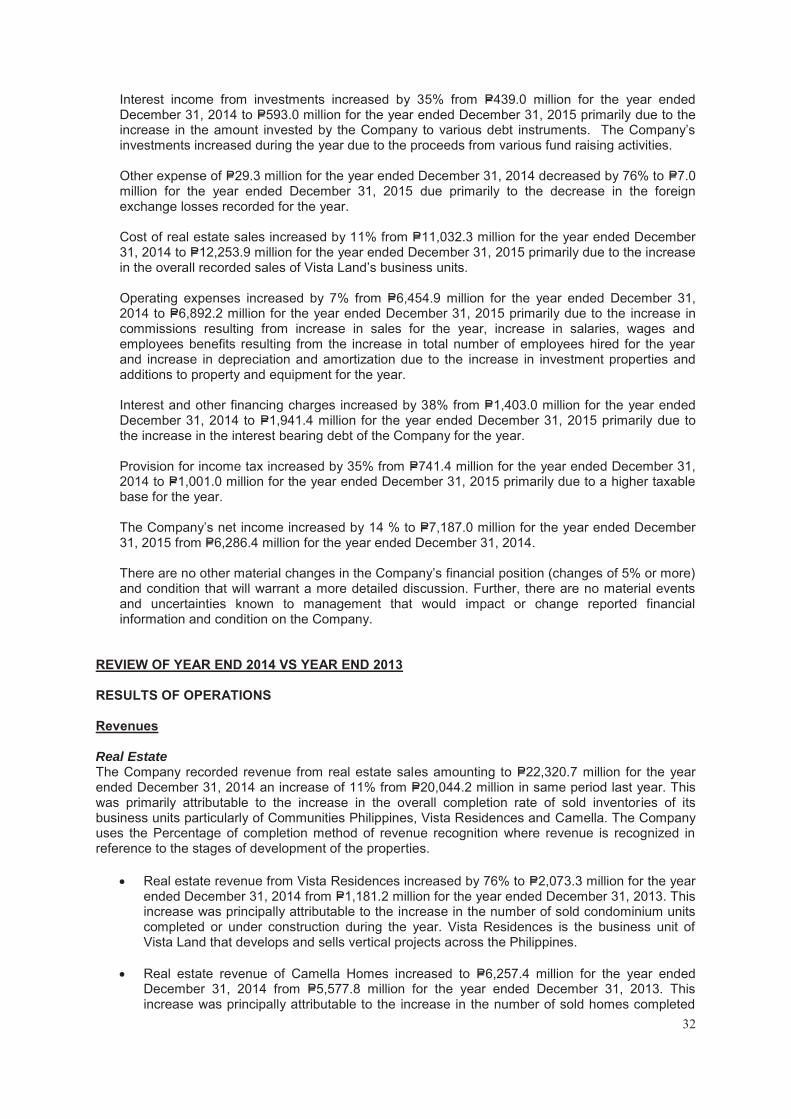
32
Interest income from investments increased by 35% from P=439.0 million for the year ended December 31, 2014 to P=593.0 million for the year ended December 31, 2015 primarily due to the increase in the amount invested by the Company to various debt instruments. The Company’s investments increased during the year due to the proceeds from various fund raising activities.
Other expense of P=29.3 million for the year ended December 31, 2014 decreased by 76% to P=7.0 million for the year ended December 31, 2015 due primarily to the decrease in the foreign exchange losses recorded for the year.
Cost of real estate sales increased by 11% from P=11,032.3 million for the year ended December 31, 2014 to P=12,253.9 million for the year ended December 31, 2015 primarily due to the increase in the overall recorded sales of Vista Land’s business units.
Operating expenses increased by 7% from P=6,454.9 million for the year ended December 31, 2014 to P=6,892.2 million for the year ended December 31, 2015 primarily due to the increase in commissions resulting from increase in sales for the year, increase in salaries, wages and employees benefits resulting from the increase in total number of employees hired for the year and increase in depreciation and amortization due to the increase in investment properties and additions to property and equipment for the year. Interest and other financing charges increased by 38% from P=1,403.0 million for the year ended December 31, 2014 to P=1,941.4 million for the year ended December 31, 2015 primarily due to the increase in the interest bearing debt of the Company for the year.
Provision for income tax increased by 35% from P=741.4 million for the year ended December 31, 2014 to P=1,001.0 million for the year ended December 31, 2015 primarily due to a higher taxable base for the year. The Company’s net income increased by 14 % to P=7,187.0 million for the year ended December 31, 2015 from P=6,286.4 million for the year ended December 31, 2014. There are no other material changes in the Company’s financial position (changes of 5% or more) and condition that will warrant a more detailed discussion. Further, there are no material events and uncertainties known to management that would impact or change reported financial information and condition on the Company.
REVIEW OF YEAR END 2014 VS YEAR END 2013 RESULTS OF OPERATIONS Revenues Real Estate The Company recorded revenue from real estate sales amounting to P=22,320.7 million for the year ended December 31, 2014 an increase of 11% from P=20,044.2 million in same period last year. This was primarily attributable to the increase in the overall completion rate of sold inventories of its business units particularly of Communities Philippines, Vista Residences and Camella. The Company uses the Percentage of completion method of revenue recognition where revenue is recognized in reference to the stages of development of the properties.
Real estate revenue from Vista Residences increased by 76% to P=2,073.3 million for the year ended December 31, 2014 from P=1,181.2 million for the year ended December 31, 2013. This increase was principally attributable to the increase in the number of sold condominium units completed or under construction during the year. Vista Residences is the business unit of Vista Land that develops and sells vertical projects across the Philippines.
Real estate revenue of Camella Homes increased to P=6,257.4 million for the year ended
December 31, 2014 from P=5,577.8 million for the year ended December 31, 2013. This increase was principally attributable to the increase in the number of sold homes completed

33
or under construction in the Mega Manila area in the low-cost and affordable housing segment during the year.
Real estate revenue of Communities Philippines increased by 11% to P=10,373.3 million for
the year ended December 31, 2014 from P=9,358.6 million for the year ended December 31, 2013. This increase was principally attributable to the increase in the number of sold homes completed or under construction outside the Mega Manila area in the low-cost and affordable housing segment during the year.
Real estate revenue of Crown Asia decreased by 5% to P=2,327.9 million for the year ended
December 31, 2014 from P=2,460.4 million for the year ended December 31, 2013. This decrease was principally attributable to the decline in the number of sold homes completed or under construction in the Mega Manila area in the middle-income housing segment during the year.
Real estate revenue of Brittany decreased by 17% to P=1,203.4 million for the year ended
December 31, 2014 from P=1,446.7 million in the same period last year. This decrease was principally attributable to the decrease in the number of sold homes completed or under construction in the Mega Manila area in the high-end housing segment, which was a reflection of the Company’s focus on meeting the increased demand for housing in the low-cost and affordable as well as in the middle-income housing segments serviced by its other business units.
Rental income Rental income increased by 15% from P=1,332.2 million for the year ended December 31, 2014 to P=1,527.0 million for the year ended December 31, 2015. The increase was primarily attributable the additional gross floor area of our investment properties as well as increase in rental rates of our existing malls. Interest income from installment contract receivable Interest income from installment contract receivable increased by 4% from P728.3 million for the year ended December 31, 2013 to P=760.6 million for the year ended December 31, 2014. The increase was primarily attributable increase in the interest collected from buyers opting to get in-house financing. Miscellaneous Income Miscellaneous income increased by 6% from P=845.2 million for the year ended December 31, 2014 to P=900.0 million for the year ended December 31, 2015. The increase was primarily attributable the forfeited reservation fees and partial payments from customers whose sales contracts are cancelled before completion of required down payment as well as increase in other operating income and parking fees from our malls. Interest income from investments Interest income from investments increased by 73% from P253.4 million for the year ended December 31, 2013 to P=439.0 million for the year ended December 31, 2014. The increase was primarily attributable to the increase in the amount invested by the Company to various debt instruments. The Company’s investments increased during the year due to the proceeds from various fund raising activities. Other income (expenses) Other expense of P=36.7 million for the year ended December 31, 2014 decreased by 20% to P=29.3 million for the year ended December 31, 2015. The decrease in the other expense was primarily attributable decrease in the foreign exchange losses recorded for the year. Costs and Expenses Cost and expenses increased by 11% to P=17,487.1 million for the year ended December 31, 2014 from P=15,690.2 million for the year ended December 31, 2013.

34
Cost of real estate sales increased by 12% from P=9,878.8 million for the year ended December 31, 2013 to P=11,032.3 million for the year ended December 31, 2014 primarily due to the increase in the overall recorded sales of Vista Land’s business units.
Operating expenses increased by 11% from P=5,811.4 million for the year ended December 31, 2013 to P=6,454.9 million for the year ended December 31, 2014 primarily due to the following:
o an increase in commissions from P=1,117.2 million in the year ended December 31, 2013 to P=1,207.3 million in the year ended December 31, 2014 resulting from increase in sales of the Company during the year.
o an increase in salaries, wages and employee benefits from P=812.8 million for the year
ended December 31, 2013 to P=973.6 million for the year ended December 31, 2014 resulting from the increase in total number of employees hired to keep pace with the Company’s expansion into new geographic areas and new projects.
o an increase in depreciation and amortization from P=593.2 million for the year ended December 31, 2014 to P=722.1 million in the year ended December 31, 2015 due the increase investment properties and additions to property and equipment for the year.
Provision for Income Tax Provision for income tax increased by 25% from P=593.9 million for the year ended December 31, 2013 to P=741.4 million for the year ended December 31, 2014 primarily due to a higher taxable base for the year. Net Income As a result of the foregoing, the Company’s net income increased by 14% to P=6,286.4 million for the year ended December 31, 2014 from P=5,520.0 million for the year ended December 31, 2013. For the year ended December 31, 2014, there were no seasonal aspects that had a material effect on the financial condition or results of operations of the Company. Neither were there any trends, events or uncertainties that have had or that are reasonably expected to have a material impact on the net sales or revenues or income from continuing operations. The Company is not aware of events that will cause a material change in the relationship between the costs and revenues. There are no significant elements of income or loss that did not arise from the Company’s continuing operations. FINANCIAL CONDITION As of December 31, 2014 vs. December 31, 2013 Total assets as of December 31, 2014 were P=124,987.5 million compared to P=98,468.6 million as of December 31, 2013, or a 28% increase. This was due to the following:
Cash and cash equivalents including short term and long-term cash investments, available-for-sale financial assets (excluding unquoted equity securities) and held-to-maturity investments increased by 74% from P=15,904.0 million as of December 31, 2013 to P=27,687.9 million as of December 31, 2014 primarily due to the net proceeds from the issuance of dollar notes and retail peso bond for the year.
Due from related parties increased by 62% to P3,679.0 million as of December 31, 2014 from
P2,277.6 million as of December 31, 2013 due to advances made to affiliates during the year.
Real estate inventories increased by 13% from P15,818.5 million as of December 31, 2013 to P17,926.0 million as of December 31, 2014 due to the launching and opening of new projects during the year.

35
Investment properties increased by 34% from P12,199.2 million as of December 31, 2013 to P16,312.0 million as of December 31, 2014 due primarily to additions to commercial developments of the Company and its subsidiary Starmalls.
Land and improvements increased by 33% from P18,939.4 million as of December 31, 2013 to P25,262.2 as of December 31, 2014 million due primarily to acquisitions of land made during the year.
Property and equipment increased by 22% from P389.6 million as of December 31, 2013 to
P476.1 million as of December 31, 2014 due to acquisitions made during the year.
Investments and advances in project development costs decreased by 12% from P=1,793.7 million as of December 31, 2013 to P= 1,583.8 million as of December 31, 2014 due primarily to the reclassifications of advances to a company that became a wholly owned subsidiary of the Group.
Other assets including current portion increased by 32% from P2,609.5 million as of December 31, 2013 to P3,432.5 million as of December 31, 2014 due primarily to increase in creditable withholding taxes and various deposits.
Total liabilities as of December 31, 2014 were P=60,730.3 million compared to P=39,354.0 million as of December 31, 2013, or a 54% increase. This was due to the following:
Accounts and other payables increased by 6% from P=7,147.4 million as of December 31, 2014 to P=7,558.5 million as of December 31, 2013 due to accruals made during the year.
Customers’ advances and deposits increased by 48% from P2,214.3 million as of December 31, 2013 to P=3,267.6 million as of December 31, 2014 due to the increase in deposits required from buyers during the initial stage of a sale transaction.
Income tax payable increased by 36% million from P=68.5 million as of December 31, 2013 to
P=93.4 million as of December 31, 2014 due primarily to higher tax for the year
Bank loans including non-current portion increased by 36% from P=10,232.7 million as of December 31, 2013 toP=13,873.6 million as of December 31, 2014 due to availments made during the period.
Loans payable (representing the sold portion of the Company’s installment contracts receivables with recourse) including non-current portion, decreased by 14% from P=3,149.2 million as of December 31, 2013 to P=2,692.8 million as of December 31, 2014 due to the payments for the year and decrease in sold receivables during the year.
Notes payable increased by 112% from P=13,554.3 million as of December 31, 2013 to P=28,742.7 million as of December 31, 2014 due primarily to the issuance of dollar notes and peso retail bond for the year.
Deferred tax liabilities – net decreased by 14% from P1,571.9 million as of December 31,
2013 to P1,358.4 million as of December 31, 2014 due to adjustments of previously recorded deferred tax liabilities.
Other noncurrent liabilities increased by 118% from P=1,126.4 million as of December 31, 2013 to P=2,460.5 million as of December 31, 2014 due to the increase in the liabilities for purchased land as a result of additional land acquired during the year.
Total stockholder’s equity increased by 9% from P=59,114.5 million as of December 31, 2013 to P=64,257.2 million as of December 31, 2014 due to the net income recorded for the year ended December 31, 2014.

36
Considered as the top five key performance indicators of the Company as shown below:
Notes:
(a) Current Ratio: This ratio is obtained by dividing the Current Assets of the Company by its Current liabilities. This ratio is used as a test of the
Company’s liquidity.
(b) Liability-to-equity ratio: This ratio is obtained by dividing the Company’s Total Liabilities by its Total Equity. The ratio reveals the proportion of
liability and equity a company is using to finance its business. It also measures a company’s borrowing capacity.
(c) Interest expense/Income before interest expense: This ratio is obtained by dividing interest expense for the period by its income before interest
expense. This ratio shows whether a company is earning enough profits before interest to pay its interest cost comfortably
(d) Return on assets: This ratio is obtained by dividing the Company’s net income by its total assets. This measures the Company’s earnings in
relation to all of the resources it had at its disposal.
(e) Return on equity: This ratio is obtained by dividing the Company’s net income by its total equity. This measures the rate of return on the
ownership interest of the Company’s stockholders.
Because there are various calculation methods for the performance indicators above, the Company’s presentation of such may not be comparable to
similarly titled measures used by other companies.
Current ratio as of December 31, 2014 decreased from that of December 31, 2013 due primarily to the increase in current portion of the notes and bank loans. Debt-to-equity ratio increased due to the increase in the total liabilities brought by the issuance of dollar notes and peso retail bond for the year. Interest expense as a percentage of income before interest expense decreased in the year ended December 31, 2014 compared to the ratio for the year ended December 31, 2013 due to the higher capitalized interest for the year. Return on asset decreased for December 31, 2014 compared to that on December 31, 2013 due primarily to the increase in total assets resulting from the increase in total cash and cash investments for the period. Return on equity increased due primarily to the higher net income reported for the year ended December 31, 2014.
Material Changes to the Company’s Balance Sheet as of December 31, 2014 compared to December 31, 2013 (increase/decrease of 5% or more)
Cash and cash equivalents including short term and long-term cash investments, available-for-sale financial assets (excluding unquoted equity securities) and held-to-maturity investments increased by 74% from P=15,904.0 million as of December 31, 2013 to P=27,687.9 million as of December 31, 2014 primarily due to the net proceeds from the issuance of dollar notes and retail peso bond for the year.
Due from related parties increased by 62% to P3,679.0 million as of December 31, 2014 from P2,277.6 million as of December 31, 2013 due to advances made to affiliates during the year.
Real estate inventories increased by 13% from P15,818.5 million as of December 31, 2013 to P17,926.0 million as of December 31, 2014 due to the launching and opening of new projects during the year.
Key Performance Indicators 12/31/2014 12/31/2013 Current ratio (a) 2.94:1 3.75:1 Liability-to-equity ratio (b) 0.95:1 0.67:1 Interest expense/Income before Interest expense (c) 16.6% 18.2% Return on assets (d) 5.0% 5.6% Return on equity (e) 9.8% 9.3%

37
Investment properties increased by 34% from P12,199.2 million as of December 31, 2013 to P16,312.0 million as of December 31, 2014 due primarily to additions to commercial developments of the Company and its subsidiary Starmalls.
Land and improvements increased by 33% from P18,939.4 million as of December 31, 2013 to P25,262.2 as of December 31, 2014 million due primarily to acquisitions of land made during the year.
Property and equipment increased by 22% from P389.6 million as of December 31, 2013 to P476.1 million as of December 31, 2014 due to acquisitions made during the year. Investments and advances in project development costs decreased by 12% from P=1,793.7 million as of December 31, 2013 to P= 1,583.8 million as of December 31, 2014 due primarily to the reclassifications of advances to a company that became a wholly owned subsidiary of the Group.
Other assets including current portion increased by 32% from P2,609.5 million as of December 31, 2013 to P3,432.5 million as of December 31, 2014 due primarily to increase in creditable withholding taxes and various deposits.
Accounts and other payables increased by 6% from P=7,147.4 million as of December 31, 2014 to P=7,558.5 million as of December 31, 2013 due to accruals made during the year.
Customers’ advances and deposits increased by 48% from P2,214.3 million as of December 31, 2013 to P=3,267.6 million as of December 31, 2014 due to the increase in deposits required from buyers during the initial stage of a sale transaction.
Income tax payable increased by 36% million from P=68.5 million as of December 31, 2013 to P=93.4 million as of December 31, 2014 due primarily to higher tax for the year
Bank loans including non-current portion increased by 36% from P=10,232.7 million as of December 31, 2013 toP=13,873.6 million as of December 31, 2014 due to availments made during the period.
Loans payable (representing the sold portion of the Company’s installment contracts receivables with recourse) including non-current portion, decreased by 14% from P=3,149.2 million as of December 31, 2013 to P=2,692.8 million as of December 31, 2014 due to the payments for the year and decrease in sold receivables during the year.
Notes payable increased by 112% from P=13,554.3 million as of December 31, 2013 to P=28,742.7 million as of December 31, 2014 due primarily to the issuance of dollar notes and peso retail bond for the year.
Deferred tax liabilities – net decreased by 14% from P1,571.9 million as of December 31, 2013 to P1,358.4 million as of December 31, 2014 due to adjustments of previously recorded deferred tax liabilities.
Other noncurrent liabilities increased by 118% from P=1,126.4 million as of December 31, 2013 to P=2,460.5 million as of December 31, 2014 due to the increase in the liabilities for purchased land as a result of additional land acquired during the year. Total stockholder’s equity increased by 9% from P=59,114.5 million as of December 31, 2013 to P=64,257.2 million as of December 31, 2014 due to the net income recorded for the year ended December 31, 2013.
Material Changes to the Company’s Statement of income for the year ended December 31, 2014 compared to the year ended December 31, 2013 (increase/decrease of 5% or more)
Revenue from real estate sales amounting to P=22,320.7 million for the year ended December 31, 2014 an increase of 11% from P=20,044.2 million in same period last year.

38
Rental income increased by 15% from P=1,332.2 million for the year ended December 31, 2014 to P=1,527.0 million for the year ended December 31, 2015 primarily due to the additional gross floor area of our investment properties as well as increase in rental rates of our existing malls.
Miscellaneous income increased by 6% from P=845.2 million for the year ended December 31, 2014 to P=900.0 million for the year ended December 31, 2015 primarily due to the forfeited reservation fees and partial payments from customers whose sales contracts are cancelled before completion of required down payment as well as increase in other operating income and parking fees from our malls. Interest income from investments increased by 73% from P253.4 million for the year ended December 31, 2013 to P=439.0 million for the year ended December 31, 2014 primarily due to the increase in the amount invested by the Company to various debt instruments. The Company’s investments increased during the year due to the proceeds from various fund raising activities. Other expense of P=36.7 million for the year ended December 31, 2014 decreased by 20% to P=29.3 million for the year ended December 31, 2015 primarily due to the decrease in the foreign exchange losses recorded for the year.
Cost of real estate sales increased by 12% from P=9,878.8 million for the year ended December 31, 2013 to P=11,032.3 million for the year ended December 31, 2014 primarily due to the increase in the overall recorded sales of Vista Land’s business units.
Operating expenses increased by 11% from P=5,811.4 million for the year ended December 31, 2013 to P=6,454.9 million for the year ended December 31, 2014 primarily due to the increase in commissions resulting from increase in sales of the Company during the year, increase in salaries, wages and employee benefits resulting from the increase in total number of employees hired to keep pace with the Company’s expansion into new geographic areas and new projects, and increase in depreciation and due to the increase investment properties and additions to property and equipment for the year.
Provision for income tax increased by 25% from P=593.9 million for the year ended December 31, 2013 to P=741.4 million for the year ended December 31, 2014 primarily due to a higher taxable base for the year.
The Company’s net income increased by 14% to P=6,286.4 million for the year ended December 31, 2014 from P=5,520.0 million for the year ended December 31, 2013.
There are no other material changes in the Company’s financial position (changes of 5% or more) and condition that will warrant a more detailed discussion. Further, there are no material events and uncertainties known to management that would impact or change reported financial information and condition on the Company.
IV. NATURE AND SCOPE OF BUSINESS Vista Land & Lifescapes, Inc. (Vista Land) is one of the leading integrated property developers in the Philippines and the largest homebuilder in the country overall. The Company believes that it is one of the few leading integrated property developers in the Philippines that are focused on the mass market. The Company operates its residential property development business and commercial property development business through six distinct business units. Brittany, Crown Asia, Camella Homes, Communities Philippines and Vista Residences are focused on residential property development while Starmalls is involved in commercial property development. Briefly, these business units may be distinguished as follows:
Brittany. Brittany caters to the high-end market segment in Mega Manila, offering luxury houses in master-planned communities, priced at ₱12.0 million and above;
Crown Asia. Crown Asia caters to the upper mid-cost housing segment in Mega Manila, primarily offering houses priced between ₱4.0 million and ₱12.0 million;

39
Camella Homes. For 40 years, Camella Homes has serviced the low-cost and affordable housingsegment (houses priced below ₱4.0 million) in the Mega Manila area. Camella Homes markets its houses primarily under the “Camella” brand. According to the PSRC “SALIGAN” Study, Camella was acknowledged as the most preferred brand overall in the Philippine housing market, with a brand awareness rate and brand preference rate of 99% and 56%, respectively;
Communities Philippines. Communities Philippines and its subsidiaries offer residential properties outside the Mega Manila area under the “Camella” and “Crown Asia” brands. The Company believes that Communities Philippines and its subsidiaries have the widest coverage of developments in the regions outside Mega Manila of any homebuilder in the Philippines and utilizes Camella Homes’ and Crown Asia’s expertise and designs to offer houses in areas outside of the Mega Manila area that it believes are at par, in terms of quality, with the developments in the Mega Manila area;
Vista Residences, Inc. Vista Residences offers vertical residential projects in the Mega Manila area in the low to upper mid-cost segments. Vertical home projects generally involve longer project development periods as well as some facilities, amenities and other specifications not often found in horizontal homes; and
Starmalls, Inc. Starmalls is a major developer, owner and operator of retail malls that target mass market retail consumers in the Philippines and also develops and operates BPO commercial centers.
The Company has no sale or revenues and net income contributed by foreign sales for 2016, 2015, and 2014. V. MARKET FOR REGISTRANT’S COMMON EQUITY AND RELATED STOCKHOLDERS
MATTERS Market Information The Company’s common shares are listed with the Philippine Stock Exchange. The Company was listed on June 25, 2007.
2017 2016 2015 2014 Quarter High Low Close High Low Close High Low Close High Low Close
1st 5.10 4.65 5.08 5.00 3.65 4.66 8.59 6.80 8.59 5.47 5.07 5.27 2nd - - - 5.48 4.55 5.34 8.42 6.30 6.35 6.44 5.30 6.12 3rd - - - 6.45 5.12 5.39 7.30 5.03 5.03 6.26 5.81 6.17 4th - - - 5.39 4.82 4.95 5.83 5.03 5.18 7.20 5.89 7.20
The market capitalization of VLL as of December 31, 2016 based on the closing price of P4.95/share on December 29, 2016, the last trading date for the fourth quarter of 2015, was approximately P63.6 billion. As of April 27, 2017, VLL’s market capitalization stood at P67.8 billion based on the P5.29/share closing price. Common There are approximately 966 holders of common equity security of the Company as of March 31, 2016 (based on the number of accounts registered with the Stock Transfer Agent). The following are the top 20 holders of the common securities of the Company:
Name No. of Shares Percentage1 1 FINE PROPERTIES, INC.2 6,650,638,065 51.85% 2 PCD NOMINEE CORPORATION ( FOREIGN ) 2,774,223,795 21.63% 3 ALTHORP HOLDINGS, INC. 3 1,235,292,469 9.63% 4 PCD NOMINEE CORPORATION (FILIPINO) 863,858,785 6.74%

40
5 MANUELA CORPORATION4 752,208,215 5.86% 6 MANUEL B. VILLAR, JR. 4 293,969,986 2.29% 7 MANUEL PAOLO A. VILLAR5 222,796,324 1.74% 8 BESTIMES INVESTMENT LIMITED 26,814,493 0.21% 9 JOHN T. LAO 2,853,000 0.02%
10 SULFICIO TAGUD JR. &/OR ESTER TAGUD 401,000 0.00% 11 TOMAS L. CHUA 400,000 0.00% 12 FEDERAL HOMES, INC. 324,850 0.00% 13 ACRIS CORPORATION 300,000 0.00% 14 CHRISTIAN A. AGUILAR 290,617 0.00% 15 BENJAMARIE THERESE N. SERRANO 200,000 0.00% 16 MARIBETH TOLENTINO 200,000 0.00% 17 CHERYL JOYCE YOUNG 200,000 0.00% 18 LUCIO W. YAN &/OR CLARA Y. YAN 150,000 0.00% 19 FRANCISCO A. UY 120,000 0.00% 20 MAXIMO S. UY &/OR LIM HUE HUA 120,000 0.00%
Total 12,825,361,599 99.99% Others 1,564,477 0.01% TOTAL OUTSTANDING, ISSUED AND SUBSCRIBED 12,826,926,076 100.00%
1 based on the total outstanding, issued and subscribed shares of 12,926,928,276 as of March 31, 2016 2 Includes 3,188,590,904 lodged under PCD Nominee Corp. (Filipino) 3Includes 10,983,363 shares owned by ML&H Corporation which have been merged with Althorp Holdings, Inc. and
1,224,309,106 lodged under PCD Nominee Corp. (Filipino) 4Lodged under PCD Nominee Corp. (Filipino) 5Includes 222,596,324 lodged under PCD Nominee Corp. (Filipino)
Preferred
Stockholder’s Name No. of Preferred
Shares Percentage
(of Preferred Shares)
1 FINE PROPERTIES, INC. 3,300,000,000 100.000% Total outstanding, issued and subscribed 3,300,000,000 100.000%
Dividends
P0.1185 per share Regular Cash Dividend Declaration Date: September 28, 2016 Record date: October 13, 2016 Payment date: October 28, 2016
P0.1357 per share Regular Cash Dividend Declaration Date: September 15, 2015 Record date: September 30, 2015 Payment date: October 15, 2015 P0.11858 per share Regular Cash Dividend Declaration Date: September 15, 2014 Record date: September 30, 2014 Payment date: October 24, 2014 P0.102 per share Regular Cash Dividend Declaration Date: September 11, 2013 Record date: September 26, 2013 Payment date: October 22, 2013

41
P0.0839 per share Regular Cash Dividend Declaration Date: September 17, 2012 Record date: October 02, 2012 Payment date: October 26, 2012
P0.04 per share Special Cash Dividend Declaration Date: June 15, 2012 Record date: July 02, 2012 Payment date: July 26, 2012
P0.07 per share Regular Cash Dividend Declaration Date: September 13, 2011 Record date: September 28, 2011 Payment date: October 24, 2011 P0.035 per share Special Cash Dividend Declaration Date: May 17, 2011 Record date: June 01, 2011 Payment date: June 28, 2011
Dividend Policy The Company's Board is authorized to declare dividends. A cash dividend declaration does not require any further approval from the Company's shareholders. A stock dividend declaration requires the further approval of shareholders representing not less than two-thirds of the Company's outstanding capital stock. Dividends may be declared only from unrestricted retained earnings. In relation to foreign shareholders, dividends payable may not be remitted using foreign exchange sourced from the Philippine banking system unless the investment was first registered with the Banko Sentral ng Pilipinas. The Company is allowed under Philippine laws to declare property and stock dividends, subject to certain requirements. Record Date
Pursuant to existing Philippine SEC rules, cash dividends declared by a company must have a record date not less than 10 nor more than 30 days from the date the cash dividends are declared. With respect to stock dividends, the record date is to be not less than 10 or more than 30 days from the date of shareholder approval, provided however, that the set record date is not to be less than 10 trading days from receipt by the PSE of the notice of declaration of stock dividend. In the event that a stock dividend is declared in connection with an increase in authorized capital stock, the corresponding record date is to be fixed by the Philippine SEC.
Dividends
The Company declares dividends to shareholders of record, which are paid from the Company's unrestricted retained earnings.
The Company intends to maintain an annual cash dividend payment ratio for its Shares of approximately 20% of its consolidated net income from the preceding fiscal year, subject to the requirements of the applicable laws and regulations and the absence of circumstances which may restrict the payment of such dividends. Circumstances which could restrict the payment of cash dividends include, but are not limited to, when the Company undertakes major projects and developments requiring substantial cash expenditures or when it is restricted from paying cash dividends by its loan covenants. The Company's Board, may, at any time, modify such dividend payout ratio depending upon the results of operations and future projects and plans of the Company.

42
Recent Sale of Unregistered Securities On December 28, 2016, the Company entered into a Corporate Notes Facility Agreement with certain financial institutions and China Bank Capital Corporation as Mandated Lead Arranger and Bookrunner, for the issuance by the Company of long-term corporate notes with a principal amount of up to Php8,000.0 million (the “Corporate Notes”). The proceeds from the issuance of the Corporate Notes will be utilized for the purpose of pre-funding the 2017 capital expenditures, refinancing of existing indebtedness and to fund other general corporate expenses. On 29 December 2016, the Company made an initial drawdown in the amount of Php5,150,000,000.00. The interest at 6.19% per annum is payable quarterly in arrears while the principal amount is payable in 2% annual amortizations on each principal repayment date with the balance to be repaid on maturity date. The Corporate Notes are guaranteed by the Company’s subsidiaries. Pursuant to the terms and conditions relating to the acquisition by the Company of 88.3% ownership in STR (the “STR Acquisition”), the Company issued a total of 4,575,395,762 common shares to Fine Properties, Inc., Althorp Holdings, Inc., Manuela Corporation, Mr. Manuel B. Villar, Jr. and Mr. Manuel Paolo A. Villar in November 2015 and February 2016, respectively. The issuance of such shares is an exempt transaction under Section 10.1(k) of the SRC. On 23 February 2016, Fine Properties. Inc. sold a total of 2,119,227 listed common shares of VLL to certain minority shareholders of Starmalls which availed of the reinvestment option, as part of the terms and conditions of the tender offer conducted by the Company in relation to the STR Acquisition. The foregoing sale of shares by Fine is exempt from registration requirements pursuant to Section 10.2 of the SRC, as confirmed by the SEC in a letter dated 16 December 2015. On April 20, 2012, the Company secured a Corporate Note Facility of up to P4.5 billion from financial institutions. On April 24, 2012, the Parent Company issued Corporate Notes that bear fixed interest rate of 7.27% and shall mature on April 25, 2017. On June 26, 2012, the Parent Company exercise the over-subscription option and issued additional Corporate Notes amounting to P300 million. The carrying value of the Corporate Notes as of December 31, 2016 amounted to P1,089 million (see Note 21 of the 2016 Audited Financial Statements). Stock Options None VI. COMPLIANCE WITH LEADING PRACTICE ON CORPORATE GOVERNANCE
The Company’s Board has adopted a Manual on Corporate Governance on March 31, 2007. The Company’s Manual on Corporate Governance describes the terms and conditions by which the Company intends to conduct sound corporate governance practices that are consistent with the relevant laws and regulations of the Republic of the Philippines, and which seek to enhance business transparency and build shareholder value.
Ultimate responsibility and oversight of the Company’s adherence to superior corporate governance practices rests with the Board of Directors. As a policy matter, the Board will hold monthly meetings, at which any number of relevant corporate governance issues may be raised for discussion.
Practical oversight of the Company’s corporate governance standards is exercised through the Board’s three standing committees:
The Audit Committee is charged with internal audit oversight over all of the Company’s business transactions and the effective management of risk.
The Nomination Committee is charged with ensuring that potential candidates for the Board are fully qualified as well as ensuring that the Board maintains adequate independent membership.
The Compensation and Remuneration Committee is charged with ensuring that fair and competitive compensation policies are maintained.

43
The Company is committed to building a solid reputation for sound corporate governance practices, including a clear understanding by its Directors of the Company’s strategic objectives, structures to ensure that such objectives are realized, systems to ensure the effective management of risks and the systems to ensure the Company’s obligations are identified and discharged in all aspects of its business. Each January, the Company will issue a certification to the Philippines Securities and Exchange Commission and the Philippine Stock Exchange that it has fulfilled its corporate governance obligations.
As of the date of this report, there are no known material deviations from the Company’s Manual of Corporate governance. The Company is taking further steps to enhance adherence to principles and practices of good corporate governance.


*SGVFS021624*A member firm of Ernst & Young Global Limited
C O V E R S H E E Tfor
AUDITED FINANCIAL STATEMENTS
SEC Registration Number
C S 2 0 0 7 0 3 1 4 5
C O M P A N Y N A M E
V I S T A L A N D & L I F E S C A P E S , I N C .
A N D S U B S I D I A R I E S
PRINCIPAL OFFICE ( No. / Street / Barangay / City / Town / Province )
3 r d L e v e l S t a r m a l l L a s P i ñ a s ,
C V S t a r r A v e n u e , P h i l a m l i f e V i
l l a g e , P a m p l o n a , L a s P i ñ a s C i t
y
Form Type Department requiring the report Secondary License Type, If Applicable
A A C F S
C O M P A N Y I N F O R M A T I O N
Company’s Email Address Company’s Telephone Number Mobile Number
[email protected] 226 3552 N/A
No. of Stockholders Annual Meeting (Month / Day) Fiscal Year (Month / Day)
971 6/15 12/31
CONTACT PERSON INFORMATION
The designated contact person MUST be an Officer of the Corporation
Name of Contact Person Email Address Telephone Number/s Mobile Number
Cynthia J. Javarez [email protected]
226-3552 loc.0098
0917-857-7447
CONTACT PERSON’s ADDRESS
3rd Level Starmall Las Piñas, CV Starr Avenue, Philamlife Village, Pamplona, Las Piñas CityNOTE 1 : In case of death, resignation or cessation of office of the officer designated as contact person, such incident shall be reported to the Commissionwithin thirty (30) calendar days from the occurrence thereof with information and complete contact details of the new contact person designated.
2 : All Boxes must be properly and completely filled-up. Failure to do so shall cause the delay in updating the corporation’s records withthe Commission and/or non-receipt of Notice of Deficiencies. Further, non-receipt of Notice of Deficiencies shall not excuse the corporation from liability for itsdeficiencies.
*SGVFS021624*
INDEPENDENT AUDITOR’S REPORT
The Stockholders and the Board of DirectorsVista Land & Lifescapes, Inc.3rd Level Starmall Las PiñasCV Starr Avenue, Philamlife VillagePamplona, Las Piñas City
Opinion
We have audited the consolidated financial statements of Vista Land and Lifescapes, Inc. and itssubsidiaries (the Group), which comprise the consolidated statements of financial position as atDecember 31, 2016 and 2015, and the consolidated statements of comprehensive income, consolidatedstatements of changes in equity and consolidated statements of cash flows for each of the three years inthe period ended December 31, 2016, and notes to the consolidated financial statements, including asummary of significant accounting policies.
In our opinion, the accompanying consolidated financial statements present fairly, in all material respects,the consolidated financial position of the Group as at December 31, 2016 and 2015, and its consolidatedfinancial performance and its consolidated cash flows for each of the three years in the period endedDecember 31, 2016 in accordance with Philippine Financial Reporting Standards (PFRSs).
Basis for Opinion
We conducted our audits in accordance with Philippine Standards on Auditing (PSAs). Ourresponsibilities under those standards are further described in the Auditor’s Responsibilities for the Auditof the Consolidated Financial Statements section of our report. We are independent of the Group inaccordance with the Code of Ethics for Professional Accountants in the Philippines (Code of Ethics)together with the ethical requirements that are relevant to our audit of the consolidated financialstatements in the Philippines, and we have fulfilled our other ethical responsibilities in accordance withthese requirements and the Code of Ethics. We believe that the audit evidence we have obtained issufficient and appropriate to provide a basis for our opinion.
Key Audit Matters
Key audit matters are those matters that, in our professional judgment, were of most significance in ouraudit of the consolidated financial statements of the current period. These matters were addressed in thecontext of our audit of the consolidated financial statements as a whole, and in forming our opinionthereon, and we do not provide a separate opinion on these matters. For each matter below, ourdescription of how our audit addressed the matter is provided in that context.
We have fulfilled the responsibilities described in the Auditor’s Responsibilities for the Audit of theConsolidated Financial Statements section of our report, including in relation to these matters.Accordingly, our audit included the performance of procedures designed to respond to our assessment ofthe risks of material misstatement of the consolidated financial statements. The results of our auditprocedures, including the procedures performed to address the matters below, provide the basis for ouraudit opinion on the accompanying consolidated financial statements.
SyCip Gorres Velayo & Co.6760 Ayala Avenue1226 Makati CityPhilippines
Tel: (632) 891 0307Fax: (632) 819 0872ey.com/ph
BOA/PRC Reg. No. 0001, December 14, 2015, valid until December 31, 2018SEC Accreditation No. 0012-FR-4 (Group A), November 10, 2015, valid until November 9, 2018
A member firm of Ernst & Young Global Limited

*SGVFS021624*
- 2 -
Recognition of real estate revenue and costs
The Group applies the percentage of completion (POC) method in determining real estate revenue andcosts. For residential lots and condominium units, the POC is based on the proportion of cost incurred todate over total estimated cost of the real estate project. For residential houses, the POC is based on thephysical proportion of work determined based on the bill of quantities applied to the construction. Thecost of sales is determined based on the estimated project development costs applied with the respectiveproject’s POC. The assessment process for the POC and the estimated project development costs requirestechnical determination by management’s specialists (project engineers) and involves significantmanagement judgment as disclosed in Note 5 to the consolidated financial statements.
Audit Response
We obtained an understanding of the Group’s process for determining the POC, including the costaccumulation process, and for determining and updating the total estimated project development costs,and performed tests of the relevant controls. We obtained the certified POC reports prepared by theproject engineers and assessed the competence, capabilities and objectivity of the project engineers byconsidering their qualifications, experience and reporting responsibilities.
For selected projects, we compared the certified POC and traced cost accumulated against supportingdocuments such as the accomplishment reports from the contractors. We obtained the opening fact sheetindicating work breakdown structure and total project development costs as estimated by the projectengineers. For changes in estimated cost components, we compared these against the addendum to theopening fact sheet and supporting contractor’s change order form. We likewise performed inquiries withthe project development engineers for the revisions. We visited selected project sites and made relevantinquiries with project engineers. We performed test computation of the percentage of completioncalculation of management.
Valuation of receivable from tenants
Accounts receivable arising from leasing operations are significant to the Group as it representsapproximately 10.00% of the accounts receivable balance. Furthermore, the valuation of accountsreceivable required management judgment and subjective assumptions due to the credit risks associatedwith trade receivables. The Group records both general and specific allowance for accounts receivable asdisclosed in Note 33 to the consolidated financial statements.
Audit Response
We obtained an understanding of the Group’s specific impairment process over accounts receivable andtested the relevant controls. We obtained an understanding of the Group’s credit policy and the processesfor identifying impairment indicators, including the process for identifying past due accounts receivable.For individually significant accounts receivable, we assessed the valuation by considering the terms of theunderlying contracts and correspondences, the lessee’s payment history including the payments madesubsequent to year end, and the lessee’s current financial condition. With respect to the Group’scollective impairment testing for accounts receivable, we tested the groupings of the receivables based oncredit risk characteristics and compared the loss rates applied against the historical data. We alsoreviewed the Group’s disclosures regarding accounts receivable and related impairment allowance, therelated risks such as credit risk, and the aging of accounts receivable.
A member firm of Ernst & Young Global Limited
*SGVFS021624*
- 3 -
Other Information
Management is responsible for the other information. The other information comprises the informationincluded in the SEC Form 20-IS (Definitive Information Statement), SEC Form 17-A and Annual Reportfor the year ended December 31, 2016, but does not include the consolidated financial statements and ourauditor’s report thereon. The SEC Form 20-IS (Definitive Information Statement), SEC Form 17-A andAnnual Report for the year ended December 31, 2016 are expected to be made available to us after thedate of this auditor’s report.
Our opinion on the consolidated financial statements does not cover the other information and we will notexpress any form of assurance conclusion thereon.
In connection with our audits of the consolidated financial statements, our responsibility is to read theother information identified above when it becomes available and, in doing so, consider whether the otherinformation is materially inconsistent with the consolidated financial statements or our knowledgeobtained in the audits, or otherwise appears to be materially misstated.
Responsibilities of Management and Those Charged with Governance for the ConsolidatedFinancial Statements
Management is responsible for the preparation and fair presentation of the consolidated financialstatements in accordance with PFRSs, and for such internal control as management determines isnecessary to enable the preparation of consolidated financial statements that are free from materialmisstatement, whether due to fraud or error.
In preparing the consolidated financial statements, management is responsible for assessing the Group’sability to continue as a going concern, disclosing, as applicable, matters related to going concern andusing the going concern basis of accounting unless management either intends to liquidate the Group or tocease operations, or has no realistic alternative but to do so.
Those charged with governance are responsible for overseeing the Group’s financial reporting process.
Auditor’s Responsibilities for the Audit of the Consolidated Financial Statements
Our objectives are to obtain reasonable assurance about whether the consolidated financial statements as awhole are free from material misstatement, whether due to fraud or error, and to issue an auditor’s reportthat includes our opinion. Reasonable assurance is a high level of assurance, but is not a guarantee that anaudit conducted in accordance with PSAs will always detect a material misstatement when it exists.Misstatements can arise from fraud or error and are considered material if, individually or in theaggregate, they could reasonably be expected to influence the economic decisions of users taken on thebasis of these consolidated financial statements.
A member firm of Ernst & Young Global Limited

*SGVFS021624*
- 4 -
As part of an audit in accordance with PSAs, we exercise professional judgment and maintainprofessional skepticism throughout the audit. We also:
Identify and assess the risks of material misstatement of the consolidated financial statements,whether due to fraud or error, design and perform audit procedures responsive to those risks, andobtain audit evidence that is sufficient and appropriate to provide a basis for our opinion. The risk ofnot detecting a material misstatement resulting from fraud is higher than for one resulting from error,as fraud may involve collusion, forgery, intentional omissions, misrepresentations, or the override ofinternal control.
Obtain an understanding of internal control relevant to the audit in order to design audit proceduresthat are appropriate in the circumstances, but not for the purpose of expressing an opinion on theeffectiveness of the Group’s internal control.
Evaluate the appropriateness of accounting policies used and the reasonableness of accountingestimates and related disclosures made by management.
Conclude on the appropriateness of management’s use of the going concern basis of accounting and,based on the audit evidence obtained, whether a material uncertainty exists related to events orconditions that may cast significant doubt on the Group’s ability to continue as a going concern. Ifwe conclude that a material uncertainty exists, we are required to draw attention in our auditor’sreport to the related disclosures in the consolidated financial statements or, if such disclosures areinadequate, to modify our opinion. Our conclusions are based on the audit evidence obtained up tothe date of our auditor’s report. However, future events or conditions may cause the Group to ceaseto continue as a going concern.
Evaluate the overall presentation, structure and content of the consolidated financial statements,including the disclosures, and whether the consolidated financial statements represent the underlyingtransactions and events in a manner that achieves fair presentation.
Obtain sufficient appropriate audit evidence regarding the financial information of the entities orbusiness activities within the Group to express an opinion on the consolidated financial statements.We are responsible for the direction, supervision and performance of the audit. We remain solelyresponsible for our audit opinion.
We communicate with those charged with governance regarding, among other matters, the planned scopeand timing of the audit and significant audit findings, including any significant deficiencies in internalcontrol that we identify during our audit.
We also provide those charged with governance with a statement that we have complied with relevantethical requirements regarding independence, and to communicate with them all relationships and othermatters that may reasonably be thought to bear on our independence, and where applicable, relatedsafeguards.
A member firm of Ernst & Young Global Limited

*SGVFS021624*
- 5 -
From the matters communicated with those charged with governance, we determine those matters thatwere of most significance in the audit of the consolidated financial statements of the current period andare therefore the key audit matters. We describe these matters in our auditor’s report unless law orregulation precludes public disclosure about the matter or when, in extremely rare circumstances, wedetermine that a matter should not be communicated in our report because the adverse consequences ofdoing so would reasonably be expected to outweigh the public interest benefits of such communication.
The engagement partner on the audit resulting in this independent auditor’s report is Michael C. Sabado.
SYCIP GORRES VELAYO & CO.
Michael C. SabadoPartnerCPA Certificate No. 89336SEC Accreditation No. 0664-AR-2 (Group A), March 26, 2014, valid until April 30, 2017Tax Identification No. 160-302-865BIR Accreditation No. 08-001998-73-2015, February 27, 2015, valid until February 26, 2018PTR No. 5908755, January 3, 2017, Makati City
March 20, 2017
A member firm of Ernst & Young Global Limited

*SGVFS021624*
VISTA LAND & LIFESCAPES, INC. AND SUBSIDIARIESCONSOLIDATED STATEMENTS OF FINANCIAL POSITION
December 312016 2015
ASSETS
Current AssetsCash and cash equivalents (Notes 8, 32 and 33) P=8,902,537,938 P=6,043,056,436Short-term cash investments (Notes 9, 20, 32 and 33) 99,998,562 2,097,301,354Available-for-sale financial assets (Notes 9, 32 and 33) 1,792,527,121Held-to-maturity investments (Notes 9, 20, 32 and 33) 1,709,730,739Receivables (Notes 10, 32 and 33) 28,329,412,070 24,968,393,887Receivables from related parties (Notes 30 and 32) 3,916,669,458 3,425,750,173Real estate inventories (Note 11) 22,954,662,398 22,855,688,651Other current assets (Note 12) 3,807,341,953 3,814,635,967
Total Current Assets 71,512,880,239 63,204,826,468
Noncurrent AssetsAvailable-for-sale financial assets (Notes 9, 32 and 33) 6,452,537,732 7,378,966,659Held-to-maturity investments (Notes 9, 20, 32 and 33) 19,141,877,715 13,521,560,251Receivables - net of current portion (Notes 10, 32 and 33) 9,212,259,033 9,286,067,234Investments and advances in project development costs
(Note 16) 3,232,311,240 2,854,925,126Property and equipment (Note 15) 822,250,208 800,974,912Investment properties (Notes 14 and 32) 32,065,532,674 26,676,323,236Land and improvements (Note 13) 30,486,623,405 27,864,677,850Deferred tax assets - net (Note 29) 437,178,971 290,024,057Other noncurrent assets (Notes 7 and 17) 1,404,793,498 1,016,432,445
Total Noncurrent Assets 103,255,364,476 89,689,951,770P=174,768,244,715 P=152,894,778,238
LIABILITIES AND EQUITY
Current LiabilitiesAccounts and other payables (Notes 18, 32 and 33) P=11,400,373,514 P=11,208,248,722Customers’ advances and deposits (Note 19) 2,671,745,547 3,130,533,165Income tax payable 133,960,233 158,201,953Dividends payable (Note 23) 24,962,710 20,113,117Current portion of:
Notes payable (Notes 15, 21, 32 and 33) 475,475,872 4,652,684Bank loans (Notes 20, 32 and 33) 5,972,290,312 3,360,953,001Loans payables (Notes 20, 32 and 33) 1,122,548,064 574,356,966
Total Current Liabilities 21,801,356,252 18,457,059,608
(Forward)

*SGVFS021624*
- 2 -
December 312016 2015
Noncurrent LiabilitiesNotes payable - net of current portion
(Notes 21, 32 and 33) P=39,049,639,700 P=30,424,254,984Bank loans - net of current portion
(Notes 15, 20, 32 and 33) 30,114,951,980 27,178,787,750Loans payable - net of current portion
(Notes 20, 32 and 33) 2,764,704,543 3,120,532,136Pension liabilities (Note 28) 98,133,829 114,472,861Deferred tax liabilities - net (Note 29) 2,065,642,208 1,537,167,122Other noncurrent liabilities (Notes 22 and 33) 2,378,510,004 2,097,414,418
Total Noncurrent Liabilities 76,471,582,264 64,472,629,271Total Liabilities 98,272,938,516 82,929,688,879
Equity (Note 23)Attributable to equity holders of the Parent Company
Common stock 13,114,136,376 12,654,891,753Preferred stock 33,000,000 33,000,000Additional paid-in capital 30,655,429,349 29,470,640,861Treasury shares (Note 4) (6,917,014,956) (6,297,793,026)Retained earnings 36,953,581,723 30,483,778,682Other comprehensive income (Notes 9 and 28) 1,111,006,329 742,530,256
74,950,138,821 67,087,048,526Non-controlling interest (Note 31) 1,545,167,378 2,878,040,833
Total Equity 76,495,306,199 69,965,089,359P=174,768,244,715 P=152,894,778,238
See accompanying Notes to Consolidated Financial Statements.

*SGVFS021624*
VISTA LAND & LIFESCAPES, INC. AND SUBSIDIARIESCONSOLIDATED STATEMENTS OF COMPREHENSIVE INCOME
Years Ended December 312016 2015 2014
REVENUEReal estate (Note 6) P=25,025,209,355 P=24,502,151,823 P=22,320,714,822Rental income (Note 6) 4,375,326,206 2,367,884,677 1,567,760,156Interest income from installment contracts
receivable (Note 24) 642,642,195 710,281,570 760,648,667Miscellaneous income (Note 25) 952,508,345 1,268,588,080 990,297,771
30,995,686,101 28,848,906,150 25,639,421,416
COSTS AND EXPENSESCosts of real estate sales (Notes 6, 11 and 26) 12,320,996,040 12,253,889,631 11,032,282,041Operating expenses (Notes 6, 25 and 26) 7,594,509,417 7,051,573,364 6,585,954,442
19,915,505,457 19,305,462,995 17,618,236,483
OTHER INCOME (EXPENSES)Interest income from investments (Note 24) 864,375,335 592,984,716 439,017,279Interest and other financing charges (Note 24) (2,236,266,176) (1,941,407,759) (1,403,040,478)Others (Notes 9, 16, 21 and 27) (25,686,465) (7,017,664) (29,286,094)
(1,397,577,306) (1,355,440,707) (993,309,293)
INCOME BEFORE INCOME TAX 9,682,603,338 8,188,002,448 7,027,875,640
PROVISION FOR INCOME TAX (Note 29) 1,582,235,418 1,000,999,492 741,431,182
NET INCOME P=8,100,367,920 P=7,187,002,956 P=6,286,444,458
NET INCOME ATTRIBUTABLE TO:Equity holders of the Parent Company (Note 31) P=7,906,941,679 P=7,031,723,340 P=6,156,162,273Noncontrolling interest (Note 31) 193,426,241 155,279,616 130,282,185
NET INCOME P=8,100,367,920 P=7,187,002,956 P=6,286,444,458
EARNINGS PER SHARE FOR NET INCOMEATTRIBUTABLE TO EQUITYHOLDERS OF THE PARENTCOMPANY - BASIC AND DILUTED(Notes 4, 7 and 31) P=0.676 P=0.622 P=0.486
(Forward)

*SGVFS021624*
- 2 -
Years Ended December 312016 2015 2014
NET INCOME P=8,100,367,920 P=7,187,002,956 P=6,286,444,458
OTHER COMPREHENSIVE INCOME(LOSS)
Other comprehensive loss to be reclassified toprofit or loss in subsequent periods:Cumulative translation adjustments (Note 4) (25,685,005) 40,073,509 (11,847,958)Changes in fair value of available-for-sale financial assets (Note 9) 479,370,673 572,270,028 (50,694,522)
Other comprehensive income (loss) not to bereclassified to profit or loss in subsequentperiods:
Remeasurement gain (loss) - net of tax (Note 28) 30,275,144 232,522,343 (38,339,128)
483,960,812 844,865,880 (100,881,608)
TOTAL COMPREHENSIVE INCOME P=8,584,328,732 P=8,031,868,836 P=6,185,562,850
TOTAL COMPREHENSIVE INCOME ATTRIBUTABLE TO:Equity holders of the Parent Company P=8,395,129,349 P=8,054,806,603 P=6,173,553,693Non-controlling interest 189,199,383 (22,937,767) 12,009,157
P=8,584,328,732 P=8,031,868,836 P=6,185,562,850
See accompanying Notes to Consolidated Financial Statements.

*SGVFS015264*
VIS
TA
LA
ND
& L
IFE
SCA
PES,
IN
C. A
ND
SU
BSI
DIA
RIE
SC
ON
SOL
IDA
TE
D S
TA
TE
ME
NT
S O
F C
HA
NG
ES
IN E
QU
ITY
Cap
ital S
tock
(Not
e 23
)A
dditi
onal
Pai
d-in
Dep
osit
for
futu
reR
etai
ned
Rem
easu
rem
ent
Gai
ns (L
osse
s) o
n R
etir
emen
tC
umul
ativ
eO
ther
Trea
sury
Non
-Con
trol
ling
Com
mon
Stoc
kPr
efer
red
Stoc
kC
a pita
l(N
otes
7 a
nd 2
3)Su
bscr
iptio
n (N
ote
7)E
arni
ngs
(Not
e 23
)O
blig
atio
n(N
ote
28)
Tran
slat
ion
Adj
ustm
ents
Com
preh
ensi
ve In
com
eSh
ares
(Not
es 7
and
23)
Inte
rest
(Not
e 7)
Tota
l
For
the
Yea
r E
nded
Dec
embe
r 31
, 201
6
Bal
ance
s as
at J
anua
ry 1
, 201
6P=1
2,65
4,89
1,75
3P=3
3,00
0,00
0P=2
9,47
0,64
0,86
1P=–
P=30,
483,
778,
682
P=254
,701
,182
P=25,
088,
203
P=462
,740
,871
(P=6,
297,
793,
026)
P=2,8
78,0
40,8
33P=6
9,96
5,08
9,35
9N
et in
com
e–
––
–7,
906,
941,
679
–19
3,42
6,24
18,
100,
367,
920
Oth
er co
mpr
ehen
sive
inco
me
––
––
–34
,502
,002
–47
9,37
0,67
3(4
,226
,858
)50
9,64
5,81
7C
umul
ativ
e tra
nsla
tion
adju
stm
ents
––
––
––
(25,
685,
005)
––
–(2
5,68
5,00
5)To
tal c
ompr
ehen
sive
inco
me
for t
he y
ear
––
––
7,90
6,94
1,67
934
,502
,002
(25,
685,
005)
479,
370,
673
189,
199,
383
8,58
4,32
8,73
2Tr
easu
ry sh
ares
––
––
––
––
(619
,221
,930
)–
(619
,221
,930
)C
ash
divi
dend
dec
lare
d–
––
–(1
,437
,138
,638
)–
––
–(2
1,36
7,43
5)(1
,458
,506
,073
)Is
suan
ce (a
cqui
sitio
n) o
f add
ition
al sh
ares
(Not
es 7
and
23)
459,
244,
623
–1,
184,
788,
488
–(1
,026
,399
)–
(118
,685
,198
)–
(1,5
00,7
05,4
03)
23,6
16,1
11
Bal
ance
s as
at D
ecem
ber
31, 2
016
P=13,
114,
136,
376
P=33,
000,
000
P=30,
655,
429,
349
P=P=3
6,95
3,58
1,72
3P=2
88,1
76,7
85(P=
596,
802)
P=823
,426
,346
(P=6,
917,
014,
956)
P=1,5
45,1
67,3
78P=7
6,49
5,30
6,19
9
For
the
Yea
r E
nded
Dec
embe
r 31
, 201
5
Bal
ance
s as
at J
anua
ry 1
, 201
5 (N
ote
7)P=8
,538
,740
,614
P=33,
000,
000
P=23,
318,
019,
607
P=5,1
53,8
50,6
44P=2
4,59
3,20
3,95
1(P=
758,
928)
(P=14
,985
,306
)(P=
109,
529,
157)
P=P=2
,745
,698
,984
P=64,
257,
240,
409
Net
inco
me
––
––
7,03
1,72
3,34
0–
155,
279,
616
7,18
7,00
2,95
6O
ther
com
preh
ensiv
e in
com
e–
––
––
255,
460,
110
–57
2,27
0,02
8(2
2,93
7,76
7)80
4,79
2,37
1Ex
chan
ge d
iffer
ence
s on
trans
latio
n–
––
––
–40
,073
,509
––
–40
,073
,509
Tota
l com
preh
ensiv
e in
com
e fo
r the
yea
r–
––
–7,
031,
723,
340
255,
460,
110
40,0
73,5
0957
2,27
0,02
8–
132,
341,
849
8,03
1,86
8,83
6Tr
easu
ry sh
ares
aris
ing
from
acq
uisit
ion
(Not
e 7)
––
––
––
––
(6,2
97,7
93,0
26)
–(6
,297
,793
,026
)C
ash
divi
dend
dec
lare
d–
––
–(1
,141
,148
,609
)–
––
––
(1,1
41,1
48,6
09)
Dep
osit
for f
utur
e st
ock
subs
crip
tion
app
lied
to c
apita
l sto
ck, n
et o
fef
fect
from
acq
uisit
ion
(Not
e 7)
4,11
6,15
1,13
9–
6,15
2,62
1,25
4(5
,153
,850
,644
)–
––
––
–5,
114,
921,
749
Bal
ance
s as
at D
ecem
ber
31, 2
015
P=12,
654,
891,
753
P=33,
000,
000
P=29,
470,
640,
861
P=–P=3
0,48
3,77
8,68
2P=2
54,7
01,1
82P=2
5,08
8,20
3P=4
62,7
40,8
71(P=
6,29
7,79
3,02
6)P=2
,878
,040
,833
P=69,
965,
089,
359
For
the
Yea
r E
nded
Dec
embe
r 31
, 201
4
Bal
ance
s as
at J
anua
ry 1
, 201
4 (N
ote
7)P=8
,538
,740
,614
P=33,
000,
000
P=23,
348,
339,
324
P=5,1
53,8
50,6
44P=1
9,44
9,56
5,54
2P=4
9,58
9,35
7(P=
3,13
7,34
8)(P=
58,8
34,6
35)
P=P=2
,603
,407
,642
P=59,
114,
521,
140
Net
inco
me
––
––
6,15
6,16
2,27
3–
130,
282,
185
6,28
6,44
4,45
8O
ther
com
preh
ensiv
e in
com
e(5
0,34
8,28
5)(9
6,11
3,30
8)12
,009
,157
(134
,452
,436
)U
nrea
lized
gai
ns/lo
sses
recl
assi
fied
to p
rofit
or l
oss (
Not
e 9)
––
––
45,4
18,7
8645
,418
,786
Exch
ange
diff
eren
ces o
n tra
nsla
tion
––
––
––
(11,
847,
958)
––
–(1
1,84
7,95
8)To
tal c
ompr
ehen
sive
inco
me
for t
he y
ear
––
––
6,15
6,16
2,27
3(5
0,34
8,28
5)(1
1,84
7,95
8)(5
0,69
4,52
2)–
142,
291,
342
6,18
5,56
2,85
0C
ash
divi
dend
s–
––
–(1
,012
,523
,864
)–
––
––
(1,0
12,5
23,8
64)
Effe
ct o
f acq
uisit
ion
on lo
ss o
n di
spos
alof
Sta
rmal
ls su
bsid
iary
(Not
e 7)
––
(30,
319,
717)
––
––
––
–(3
0,31
9,71
7)
Bal
ance
s as
at D
ecem
ber
31, 2
014
P=8,5
38,7
40,6
14P=3
3,00
0,00
0P=2
3,31
8,01
9,60
7P=5
,153
,850
,644
P=24,
593,
203,
951
(P=75
8,92
8)(P=
14,9
85,3
06)
(P=10
9,52
9,15
7)P=–
P=2,7
45,6
98,9
84P=6
4,25
7,24
0,40
9
See
acco
mpa
nyin
g N
otes
to C
onso
lidat
ed F
inan
cial
Sta
tem
ents
.

*SGVFS021624*
VISTA LAND & LIFESCAPES, INC. AND SUBSIDIARIESCONSOLIDATED STATEMENTS OF CASH FLOWS
Years Ended December 312016 2015 2014
CASH FLOWS FROM OPERATING ACTIVITIESIncome before income tax P=9,682,603,338 P=8,188,002,448 P=7,027,875,640Adjustments for:
Interest and other financing charges (Note 24) 2,236,266,176 1,941,407,759 1,403,040,478Depreciation and amortization
(Notes 14, 15, 17 and 26) 1,043,631,634 798,919,810 722,140,062Retirement expense 83,952,065 133,810,647 98,914,692Unrealized foreign exchange losses (Note 27) 25,686,466 7,017,664 29,286,094Interest income (Note 24) (1,507,017,530) (1,303,266,286) (1,199,665,946)
Operating income before working capital changes 11,565,122,149 9,765,892,042 8,081,591,020Decrease (increase) in:
Receivables (3,169,538,371) (6,265,802,211) (513,289,939)Receivables from related parties (491,051,066) 364,088,665 (1,354,821,629)Real estate inventories 2,992,738,576 2,658,695,127 332,811,573Other current assets (1,085,417,762) (1,722,494,050) (1,536,570,684)
Increase (decrease) in:Accounts and other payables 186,801,504 (470,148,127) 1,774,904,197Customers’ advances and deposits (458,787,618) (282,115,644) 1,053,386,094
Provision for impairment losses on receivables (Note 26) 1,974,771 50,544,672 5,394,498
Plan assets contributions paid (Note 28) (39,636,583) (49,065,754) (55,017,703)Net cash flows provided by operations 9,502,205,600 4,049,594,720 7,788,387,427Interest received 1,387,371,148 1,253,284,503 1,199,665,946Income tax paid (156,934,010) (333,101,968) (206,121,596)Interest paid (Notes 12 and 29) (4,759,217,196) (2,231,493,638) (1,104,751,879)Net cash flows provided by operating activities 5,973,425,542 2,738,283,617 7,677,179,898
CASH FLOWS FROM INVESTING ACTIVITIESProceeds from:
Short-term cash investments 2,097,301,354 4,381,309,667 1,062,398,621Long-term cash investments 2,869,912,500Sale of available for sale securities 297,152,115Disposal of an investment in AFS (Note 9) (30,319,717)
Acquisitions of:System development costs (Note 17) (48,198,547) (35,148,803) (29,303,925)Short-term cash investments (99,998,562) (2,097,301,354) (2,212,389,667)Property and equipment (Note 15) (277,907,204) (393,787,786) (344,770,688)AFS financial assets (Note 9) (386,727,521) (88,606,466) (4,857,326,566)Land and improvements (Note 13) (3,664,137,702) (6,659,305,848) (8,804,599,746)Investment properties (Note 14) (4,963,319,563) (11,019,720,166) (4,494,940,211)HTM investments (Note 9) (7,330,048,203) (3,288,972,300) (7,361,033,567)Acquisition of shares (Notes 7) (144,174,203)
(Forward)
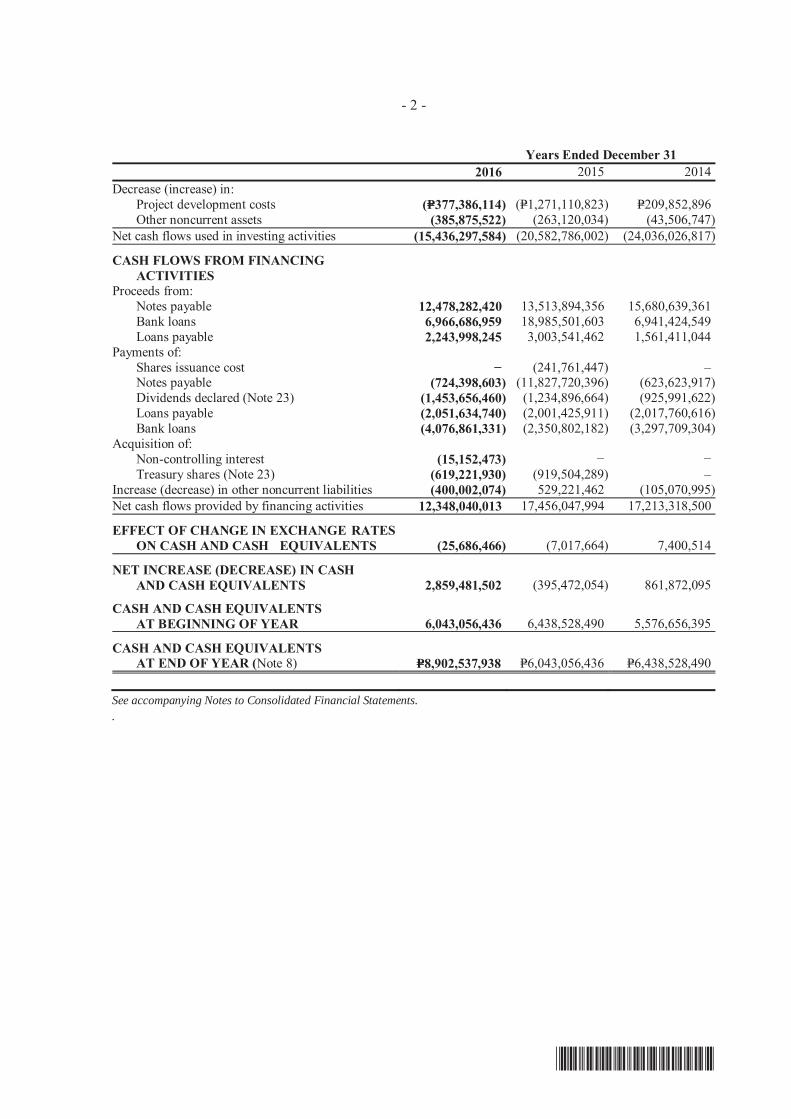
*SGVFS021624*
- 2 -
Years Ended December 312016 2015 2014
Decrease (increase) in:Project development costs (P=377,386,114) (P=1,271,110,823) P=209,852,896Other noncurrent assets (385,875,522) (263,120,034) (43,506,747)
Net cash flows used in investing activities (15,436,297,584) (20,582,786,002) (24,036,026,817)
CASH FLOWS FROM FINANCING ACTIVITIESProceeds from:
Notes payable 12,478,282,420 13,513,894,356 15,680,639,361Bank loans 6,966,686,959 18,985,501,603 6,941,424,549Loans payable 2,243,998,245 3,003,541,462 1,561,411,044
Payments of:Shares issuance cost (241,761,447)Notes payable (724,398,603) (11,827,720,396) (623,623,917)Dividends declared (Note 23) (1,453,656,460) (1,234,896,664) (925,991,622)Loans payable (2,051,634,740) (2,001,425,911) (2,017,760,616)Bank loans (4,076,861,331) (2,350,802,182) (3,297,709,304)
Acquisition of:Non-controlling interest (15,152,473)Treasury shares (Note 23) (619,221,930) (919,504,289)
Increase (decrease) in other noncurrent liabilities (400,002,074) 529,221,462 (105,070,995)Net cash flows provided by financing activities 12,348,040,013 17,456,047,994 17,213,318,500
EFFECT OF CHANGE IN EXCHANGE RATES ON CASH AND CASH EQUIVALENTS (25,686,466) (7,017,664) 7,400,514
NET INCREASE (DECREASE) IN CASH AND CASH EQUIVALENTS 2,859,481,502 (395,472,054) 861,872,095
CASH AND CASH EQUIVALENTS AT BEGINNING OF YEAR 6,043,056,436 6,438,528,490 5,576,656,395
CASH AND CASH EQUIVALENTS AT END OF YEAR (Note 8) P=8,902,537,938 P=6,043,056,436 P=6,438,528,490
See accompanying Notes to Consolidated Financial Statements..
*SGVFS021624*
VISTA LAND & LIFESCAPES, INC. AND SUBSIDIARIESNOTES TO CONSOLIDATED FINANCIAL STATEMENTS
1. Corporate Information
Vista Land & Lifescapes, Inc. (the Parent Company) was incorporated in the Republic of thePhilippines and registered with the Securities and Exchange Commission (SEC) onFebruary 28, 2007. The Parent Company’s registered office address and principal place ofbusiness is at 3rd Level Starmall Las Piñas, CV Starr Avenue, Philamlife Village, Pamplona,Las Piñas City. The Parent Company is a publicly-listed investment holding company which is51.79% owned by Fine Properties, Inc., (ultimate Parent Company) and its subsidiaries, 48.21%owned by PCD Nominee Corporations and the other entities and individuals.
The Parent Company is the holding company of the Vista Group (the Group) which is engaged inreal estate industry. The Group has six (6) wholly-owned subsidiaries, namely: BrittanyCorporation (Brittany), Crown Asia Properties, Inc. (CAPI), Vista Residences, Inc. (VRI),Camella Homes, Inc. (CHI), Communities Philippines, Inc. (CPI) and VLL International Inc.(VII), and an 88.34% owned subsidiary, Starmalls, Inc. The Group is divided to horizontal,vertical and commercial and others segment. The Group caters on the development and sale ofresidential lots and units and residential high-rise condominium through its horizontal and verticalprojects, respectively. Its commercial and other segment focuses on the development, leasing andmanagement of shopping malls and commercial centers all over the Philippines and hoteloperations.
On November 10, 2015, the Parent Company acquired Starmalls, Inc. and its subsidiaries(Starmalls Group) namely, Masterpiece Asia Properties, Inc. and Manuela Corporation (Note 7).
Starmalls Group is a major developer, owner and operator of retail malls that target mass marketretail consumers in the Philippines. It also develops and operates business process outsourcing(“BPO”) commercial centers. As of December 31, 2016, Starmalls Group, through itssubsidiaries, owned and operated retail malls in key cities and municipalities in the Philippinesand BPO commercial centers in Metro Manila.
The Vista Group’s commercial assets portfolio have a combined gross floor area of 882,009 sq.m.as of December 31, 2016.
2. Basis of Preparation
The accompanying consolidated financial statements of the Group have been prepared on ahistorical cost basis, except for the available-for-sale (AFS) financial assets which have beenmeasured at fair value. The consolidated financial statements are presented in Philippine Peso (P=)which is the functional and presentation currency of the Parent Company, and all amounts arerounded to the nearest Philippine Peso unless otherwise indicated.
Statement of ComplianceThe consolidated financial statements of the Group have been prepared in compliance withPhilippine Financial Reporting Standards (PFRS).

- 2 -
*SGVFS021624*
Basis of ConsolidationThe consolidated financial statements comprise the financial statements of the Group as at and forthe years ended December 31, 2016 and 2015 and for each of the three year period endedDecember 31, 2016.
The financial statements of the subsidiaries are prepared for the same reporting year as the Group,using consistent accounting policies. All intra-group balances, transactions, unrealized gains andlosses resulting from intra-group transactions and dividends are eliminated in full.
Subsidiaries are fully consolidated from the date of acquisition, being the date on which the Groupobtains control, and continue to be consolidated until the date when such control ceases. TheGroup controls an entity when it is exposed, or has rights, to variable returns from its involvementwith the entity and has the ability to affect those returns through its power over the entity.Specifically, the financial statements of the subsidiaries are prepared for the same reporting periodas the Parent Company, using consistent accounting policies.
Non-controlling interests represent the portion of profit or loss and net assets in subsidiaries notwholly-owned and are presented separately in the consolidated statements of comprehensiveincome, consolidated statements of changes in equity and consolidated statements of financialposition, separately from the Parent Company’s equity.
Losses within a subsidiary are attributed to the non-controlling interests even if that results in adeficit balance.
A change in the ownership interest of a subsidiary, without a loss of control, is accounted for as anequity transaction. If the Group loses control over a subsidiary, it:
Derecognizes the assets (including goodwill) and liabilities of the subsidiary, the carryingamount of any non-controlling interest, and the cumulative translation differences recorded inequity.
Recognizes the fair value of the consideration received, fair value of any investment retained,and any surplus or deficit in profit or loss.
Reclassifies the parent’s share of components previously recognized in other comprehensiveincome to profit or loss or retained earnings, as appropriate.
This policy is in accordance with PFRS 10, Consolidated Financial Statements.
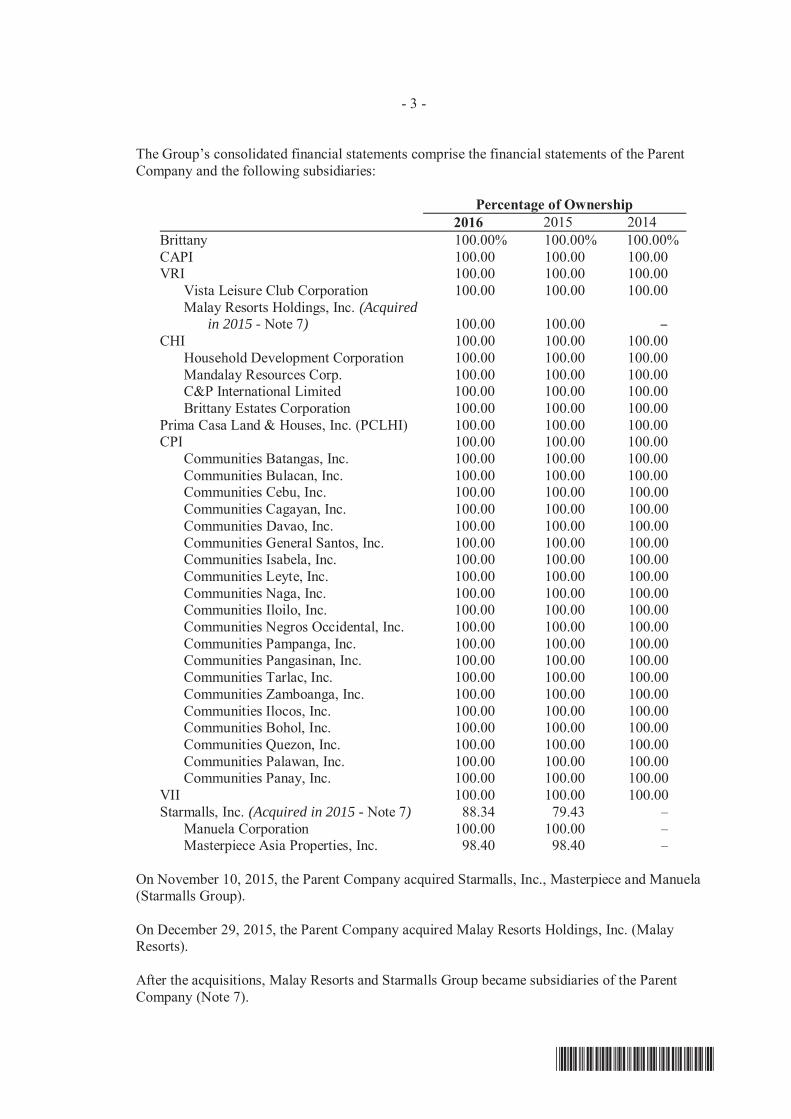
- 3 -
*SGVFS021624*
The Group’s consolidated financial statements comprise the financial statements of the ParentCompany and the following subsidiaries:
Percentage of Ownership2016 2015 2014
Brittany 100.00% 100.00% 100.00%CAPI 100.00 100.00 100.00VRI 100.00 100.00 100.00
Vista Leisure Club Corporation 100.00 100.00 100.00Malay Resorts Holdings, Inc. (Acquired in 2015 - Note 7) 100.00 100.00
CHI 100.00 100.00 100.00Household Development Corporation 100.00 100.00 100.00Mandalay Resources Corp. 100.00 100.00 100.00C&P International Limited 100.00 100.00 100.00Brittany Estates Corporation 100.00 100.00 100.00
Prima Casa Land & Houses, Inc. (PCLHI) 100.00 100.00 100.00CPI 100.00 100.00 100.00
Communities Batangas, Inc. 100.00 100.00 100.00Communities Bulacan, Inc. 100.00 100.00 100.00Communities Cebu, Inc. 100.00 100.00 100.00Communities Cagayan, Inc. 100.00 100.00 100.00Communities Davao, Inc. 100.00 100.00 100.00Communities General Santos, Inc. 100.00 100.00 100.00Communities Isabela, Inc. 100.00 100.00 100.00Communities Leyte, Inc. 100.00 100.00 100.00Communities Naga, Inc. 100.00 100.00 100.00Communities Iloilo, Inc. 100.00 100.00 100.00Communities Negros Occidental, Inc. 100.00 100.00 100.00Communities Pampanga, Inc. 100.00 100.00 100.00Communities Pangasinan, Inc. 100.00 100.00 100.00Communities Tarlac, Inc. 100.00 100.00 100.00Communities Zamboanga, Inc. 100.00 100.00 100.00Communities Ilocos, Inc. 100.00 100.00 100.00Communities Bohol, Inc. 100.00 100.00 100.00Communities Quezon, Inc. 100.00 100.00 100.00Communities Palawan, Inc. 100.00 100.00 100.00Communities Panay, Inc. 100.00 100.00 100.00
VII 100.00 100.00 100.00Starmalls, Inc. (Acquired in 2015 - Note 7) 88.34 79.43
Manuela Corporation 100.00 100.00Masterpiece Asia Properties, Inc. 98.40 98.40
On November 10, 2015, the Parent Company acquired Starmalls, Inc., Masterpiece and Manuela(Starmalls Group).
On December 29, 2015, the Parent Company acquired Malay Resorts Holdings, Inc. (MalayResorts).
After the acquisitions, Malay Resorts and Starmalls Group became subsidiaries of the ParentCompany (Note 7).
- 4 -
*SGVFS021624*
3. Changes in Accounting Policies
The Group applied for the first time certain pronouncements, which are effective for annualperiods beginning on or after January 1, 2016. Adoption of these pronouncements did not have asignificant impact on the Group’s financial position or performance unless otherwise indicated.
Amendments to PFRS 10, Consolidated Financial Statements, PFRS 12, Disclosure ofInterests in Other Entities, and PAS 28, Investments in Associates and Joint Ventures,Investment Entities: Applying the Consolidation Exception
These amendments clarify that the exemption in PFRS 10 from presenting consolidatedfinancial statements applies to a parent entity that is a subsidiary of an investment entity thatmeasures all of its subsidiaries at fair value. They also clarify that only a subsidiary of aninvestment entity that is not an investment entity itself and that provides support services tothe investment entity parent is consolidated. The amendments also allow an investor (that isnot an investment entity and has an investment entity associate or joint venture) to retain thefair value measurement applied by the investment entity associate or joint venture to itsinterests in subsidiaries when applying the equity method.
Amendments to PFRS 11, Joint Arrangements, Accounting for Acquisitions of Interests inJoint Operations
The amendments to PFRS 11 require a joint operator that is accounting for the acquisition ofan interest in a joint operation, in which the activity of the joint operation constitutes abusiness (as defined by PFRS 3), to apply the relevant PFRS 3 principles for businesscombinations accounting. The amendments also clarify that a previously held interest in ajoint operation is not remeasured on the acquisition of an additional interest in the same jointoperation while joint control is retained. In addition, a scope exclusion has been added toPFRS 11 to specify that the amendments do not apply when the parties sharing joint control,including the reporting entity, are under common control of the same ultimate controllingparty.
The amendments apply to both the acquisition of the initial interest in a joint operation and theacquisition of any additional interests in the same joint operation.
PFRS 14, Regulatory Deferral Accounts
PFRS 14 is an optional standard that allows an entity, whose activities are subject to rate-regulation, to continue applying most of its existing accounting policies for regulatory deferralaccount balances upon its first-time adoption of PFRS. Entities that adopt PFRS 14 mustpresent the regulatory deferral accounts as separate line items on the statement of financialposition and present movements in these account balances as separate line items in thestatement of income and other comprehensive income. The standard requires disclosures onthe nature of, and risks associated with, the entity’s rate-regulation and the effects of that rate-regulation on its financial statements.

- 5 -
*SGVFS021624*
Amendments to PAS 1, Presentation of Financial Statements, Disclosure Initiative
The amendments are intended to assist entities in applying judgment when meeting thepresentation and disclosure requirements in PFRSs. They clarify the following:
• That entities shall not reduce the understandability of their financial statements by eitherobscuring material information with immaterial information; or aggregating material itemsthat have different natures or functions
• That specific line items in the statement of income and other comprehensive income andthe statement of financial position may be disaggregated
• That entities have flexibility as to the order in which they present the notes to financialstatements
• That the share of other comprehensive income of associates and joint ventures accountedfor using the equity method must be presented in aggregate as a single line item, andclassified between those items that will or will not be subsequently reclassified to profit orloss.
Amendments to PAS 16, Property, Plant and Equipment and PAS 38, Intangible Assets,Clarification of Acceptable Methods of Depreciation and Amortization
The amendments clarify the principle in PAS 16 and PAS 38 that revenue reflects a pattern ofeconomic benefits that are generated from operating a business (of which the asset is part)rather than the economic benefits that are consumed through use of the asset. As a result, arevenue-based method cannot be used to depreciate property, plant and equipment and mayonly be used in very limited circumstances to amortize intangible assets.
Amendments to PAS 16 and PAS 41, Agriculture: Bearer Plants
The amendments change the accounting requirements for biological assets that meet thedefinition of bearer plants. Under the amendments, biological assets that meet the definition ofbearer plants will no longer be within the scope of PAS 41. Instead, PAS 16 will apply. Afterinitial recognition, bearer plants will be measured under PAS 16 at accumulated cost (beforematurity) and using either the cost model or revaluation model (after maturity). Theamendments also require that produce that grows on bearer plants will remain in the scope ofPAS 41 measured at fair value less costs to sell. For government grants related to bearerplants, PAS 20, Accounting for Government Grants and Disclosure of Government Assistance,will apply.
Amendments to PAS 27, Separate Financial Statements, Equity Method in Separate FinancialStatements
The amendments allow entities to use the equity method to account for investments insubsidiaries, joint ventures and associates in their separate financial statements. Entitiesalready applying PFRS and electing to change to the equity method in its separate financialstatements will have to apply that change retrospectively.

- 6 -
*SGVFS021624*
Annual Improvements to PFRSs 2012 - 2014 Cycle
• Amendment to PFRS 5, Non-current Assets Held for Sale and Discontinued Operations,Changes in Methods of Disposal
The amendment is applied prospectively and clarifies that changing from a disposalthrough sale to a disposal through distribution to owners and vice-versa should not beconsidered to be a new plan of disposal, rather it is a continuation of the original plan.There is, therefore, no interruption of the application of the requirements in PFRS 5. Theamendment also clarifies that changing the disposal method does not change the date ofclassification.
• Amendment to PFRS 7, Financial Instruments: Disclosures, Servicing Contracts
PFRS 7 requires an entity to provide disclosures for any continuing involvement in atransferred asset that is derecognized in its entirety. The amendment clarifies that aservicing contract that includes a fee can constitute continuing involvement in a financialasset. An entity must assess the nature of the fee and arrangement against the guidance forcontinuing involvement in PFRS 7 in order to assess whether the disclosures are required.The amendment is to be applied such that the assessment of which servicing contractsconstitute continuing involvement will need to be done retrospectively. However,comparative disclosures are not required to be provided for any period beginning beforethe annual period in which the entity first applies the amendments.
• Amendment to PFRS 7, Applicability of the Amendments to PFRS 7 to Condensed InterimFinancial Statements
This amendment is applied retrospectively and clarifies that the disclosures on offsettingof financial assets and financial liabilities are not required in the condensed interimfinancial report unless they provide a significant update to the information reported in themost recent annual report.
• Amendment to PAS 19, Employee Benefits, Discount Rate: Regional Market Issue
This amendment is applied prospectively and clarifies that market depth of high qualitycorporate bonds is assessed based on the currency in which the obligation is denominated,rather than the country where the obligation is located. When there is no deep market forhigh quality corporate bonds in that currency, government bond rates must be used.
• Amendment to PAS 34, Interim Financial Reporting, Disclosure of Information‘Elsewhere in the Interim Financial Report’
The amendment is applied retrospectively and clarifies that the required interimdisclosures must either be in the interim financial statements or incorporated by cross-reference between the interim financial statements and wherever they are included withinthe greater interim financial report (e.g., in the management commentary or risk report).
Pronouncements issued but not yet effective are listed below. Unless otherwise indicated, theGroup does not expect that the future adoption of the said pronouncements to have a significantimpact on its consolidated financial statements. The Group intends to adopt the followingpronouncements when they become effective.

- 7 -
*SGVFS021624*
Effective beginning on or after January 1, 2017
Amendment to PFRS 12, Clarification of the Scope of the Standard (Part of AnnualImprovements to PFRSs 2014 - 2016 Cycle)
The amendments clarify that the disclosure requirements in PFRS 12, other than those relatingto summarized financial information, apply to an entity’s interest in a subsidiary, a jointventure or an associate (or a portion of its interest in a joint venture or an associate) that isclassified (or included in a disposal group that is classified) as held for sale.
Amendments to PAS 7, Statement of Cash Flows, Disclosure Initiative
The amendments to PAS 7 require an entity to provide disclosures that enable users offinancial statements to evaluate changes in liabilities arising from financing activities,including both changes arising from cash flows and non-cash changes (such as foreignexchange gains or losses). On initial application of the amendments, entities are not requiredto provide comparative information for preceding periods. Early application of theamendments is permitted.
Application of amendments will result in additional disclosures in the 2017 consolidatedfinancial statements of the Group.
Amendments to PAS 12, Income Taxes, Recognition of Deferred Tax Assets for UnrealizedLosses
The amendments clarify that an entity needs to consider whether tax law restricts the sourcesof taxable profits against which it may make deductions on the reversal of that deductibletemporary difference. Furthermore, the amendments provide guidance on how an entityshould determine future taxable profits and explain the circumstances in which taxable profitmay include the recovery of some assets for more than their carrying amount.
Entities are required to apply the amendments retrospectively. However, on initial applicationof the amendments, the change in the opening equity of the earliest comparative period maybe recognized in opening retained earnings (or in another component of equity, asappropriate), without allocating the change between opening retained earnings and othercomponents of equity. Entities applying this relief must disclose that fact. Early application ofthe amendments is permitted.
Effective beginning on or after January 1, 2018
Amendments to PFRS 2, Share-based Payment, Classification and Measurement of Share-based Payment Transactions
The amendments to PFRS 2 address three main areas: the effects of vesting conditions on themeasurement of a cash-settled share-based payment transaction; the classification of a share-based payment transaction with net settlement features for withholding tax obligations; andthe accounting where a modification to the terms and conditions of a share-based paymenttransaction changes its classification from cash settled to equity settled.
On adoption, entities are required to apply the amendments without restating prior periods, butretrospective application is permitted if elected for all three amendments and if other criteriaare met. Early application of the amendments is permitted.

- 8 -
*SGVFS021624*
Amendments to PFRS 4, Insurance Contracts, Applying PFRS 9, Financial Instruments, withPFRS 4
The amendments address concerns arising from implementing PFRS 9, the new financialinstruments standard before implementing the forthcoming insurance contracts standard. Theyallow entities to choose between the overlay approach and the deferral approach to deal withthe transitional challenges. The overlay approach gives all entities that issue insurancecontracts the option to recognize in other comprehensive income, rather than profit or loss, thevolatility that could arise when PFRS 9 is applied before the new insurance contracts standardis issued. On the other hand, the deferral approach gives entities whose activities arepredominantly connected with insurance an optional temporary exemption from applyingPFRS 9 until the earlier of application of the forthcoming insurance contracts standard orJanuary 1, 2021.
The overlay approach and the deferral approach will only be available to an entity if it has notpreviously applied PFRS 9.
PFRS 15, Revenue from Contracts with Customers
PFRS 15 establishes a new five-step model that will apply to revenue arising from contractswith customers. Under PFRS 15, revenue is recognized at an amount that reflects theconsideration to which an entity expects to be entitled in exchange for transferring goods orservices to a customer. The principles in PFRS 15 provide a more structured approach tomeasuring and recognizing revenue.
The new revenue standard is applicable to all entities and will supersede all current revenuerecognition requirements under PFRSs. Either a full or modified retrospective application isrequired for annual periods beginning on or after January 1, 2018.
The Group is in the business of selling of real estate properties which are executed throughseparate identified contracts with customers.
Sale of real estate propertiesThe Group is currently assessing the impact of the adoption of the standard to other incomederived from its operations.
PFRS 9, Financial Instruments
PFRS 9 reflects all phases of the financial instruments project and replaces PAS 39, FinancialInstruments: Recognition and Measurement, and all previous versions of PFRS 9. Thestandard introduces new requirements for classification and measurement, impairment, andhedge accounting. PFRS 9 is effective for annual periods beginning on or after January 1,2018, with early application permitted. Retrospective application is required, but providingcomparative information is not compulsory. For hedge accounting, the requirements aregenerally applied prospectively, with some limited exceptions.

- 9 -
*SGVFS021624*
The adoption of PFRS 9 will have an effect on the classification and measurement of theGroup’s financial assets and impairment methodology for financial assets, but will have noimpact on the classification and measurement of the Group’s financial liabilities. The adoptionwill also have an effect on the Group’s application of hedge accounting and on the amount ofits credit losses. The Group is currently assessing the impact of adopting this standard.
Amendments to PAS 28, Measuring an Associate or Joint Venture at Fair Value (Part ofAnnual Improvements to PFRSs 2014 - 2016 Cycle)
The amendments clarify that an entity that is a venture capital organization, or otherqualifying entity, may elect, at initial recognition on an investment-by-investment basis, tomeasure its investments in associates and joint ventures at fair value through profit or loss.They also clarify that if an entity that is not itself an investment entity has an interest in anassociate or joint venture that is an investment entity, the entity may, when applying the equitymethod, elect to retain the fair value measurement applied by that investment entity associateor joint venture to the investment entity associate’s or joint venture’s interests in subsidiaries.This election is made separately for each investment entity associate or joint venture, at thelater of the date on which (a) the investment entity associate or joint venture is initiallyrecognized; (b) the associate or joint venture becomes an investment entity; and (c) theinvestment entity associate or joint venture first becomes a parent. The amendments should beapplied retrospectively, with earlier application permitted.
Amendments to PAS 40, Investment Property, Transfers of Investment Property
The amendments clarify when an entity should transfer property, including property underconstruction or development into, or out of investment property. The amendments state that achange in use occurs when the property meets, or ceases to meet, the definition of investmentproperty and there is evidence of the change in use. A mere change in management’sintentions for the use of a property does not provide evidence of a change in use. Theamendments should be applied prospectively to changes in use that occur on or after thebeginning of the annual reporting period in which the entity first applies the amendments.Retrospective application is only permitted if this is possible without the use of hindsight.
Philippine Interpretation IFRIC-22, Foreign Currency Transactions and AdvanceConsideration
The interpretation clarifies that in determining the spot exchange rate to use on initialrecognition of the related asset, expense or income (or part of it) on the derecognition of anon-monetary asset or non-monetary liability relating to advance consideration, the date of thetransaction is the date on which an entity initially recognizes the nonmonetary asset or non-monetary liability arising from the advance consideration. If there are multiple payments orreceipts in advance, then the entity must determine a date of the transactions for each paymentor receipt of advance consideration. The interpretation may be applied on a fully retrospectivebasis. Entities may apply the interpretation prospectively to all assets, expenses and income inits scope that are initially recognized on or after the beginning of the reporting period in whichthe entity first applies the interpretation or the beginning of a prior reporting period presentedas comparative information in the financial statements of the reporting period in which theentity first applies the interpretation.

- 10 -
*SGVFS021624*
Effective beginning on or after January 1, 2019
PFRS 16, Leases
Under the new standard, lessees will no longer classify their leases as either operating orfinance leases in accordance with PAS 17, Leases. Rather, lessees will apply the single-assetmodel. Under this model, lessees will recognize the assets and related liabilities for mostleases on their balance sheets, and subsequently, will depreciate the lease assets and recognizeinterest on the lease liabilities in their profit or loss. Leases with a term of 12 months or less orfor which the underlying asset is of low value are exempted from these requirements.
The accounting by lessors is substantially unchanged as the new standard carries forward theprinciples of lessor accounting under PAS 17. Lessors, however, will be required to disclosemore information in their financial statements, particularly on the risk exposure to residualvalue.
Entities may early adopt PFRS 16 but only if they have also adopted PFRS 15. Whenadopting PFRS 16, an entity is permitted to use either a full retrospective or a modifiedretrospective approach, with options to use certain transition reliefs.
The Group is currently assessing the impact of adopting PFRS 16.
Deferred effectivity
Amendments to PFRS 10 and PAS 28, Sale or Contribution of Assets between an Investor andits Associate or Joint Venture
The amendments address the conflict between PFRS 10 and PAS 28 in dealing with the loss ofcontrol of a subsidiary that is sold or contributed to an associate or joint venture. Theamendments clarify that a full gain or loss is recognized when a transfer to an associate orjoint venture involves a business as defined in PFRS 3, Business Combinations. Any gain orloss resulting from the sale or contribution of assets that does not constitute a business,however, is recognized only to the extent of unrelated investors’ interests in the associate orjoint venture.
On January 13, 2016, the Financial Reporting Standards Council postponed the originaleffective date of January 1, 2016 of the said amendments until the International AccountingStandards Board has completed its broader review of the research project on equity accountingthat may result in the simplification of accounting for such transactions and of other aspects ofaccounting for associates and joint ventures.
4. Summary of Significant Accounting Policies
Cash and Cash EquivalentsCash includes cash on hand and in banks. Cash equivalents are short-term, highly liquidinvestments that are readily convertible to known amounts of cash with original maturities of three(3) months or less from dates of placement and that are subject to an insignificant risk of changesin value.

- 11 -
*SGVFS021624*
Short-term Cash InvestmentsShort-term cash investments consist of money market placements made for varying periods ofmore than three (3) months and up to twelve (12) months. These investments earn interest at therespective short-term rates.
Financial InstrumentsDate of recognitionThe Group recognizes a financial asset or a financial liability in the consolidated statement offinancial position when it becomes a party to the contractual provisions of the instrument.Purchases or sales of financial assets that require delivery of assets within the time frameestablished by regulation or convention in the marketplace are recognized on the trade date, whichis the date when the Group commits to purchase or sell the asset.
Initial recognition of financial instrumentsAll financial assets and financial liabilities are initially recognized at fair value. Except forfinancial assets and liabilities at fair value through profit or loss (FVPL), the initial measurementof financial assets and liabilities include transaction costs. The Group classifies its financial assetsin the following categories: financial assets at FVPL, held-to-maturity (HTM) investments, AFSfinancial assets, and loans and receivables.
The Group classifies its financial liabilities as financial liabilities at FVPL or other financialliabilities.
The classification depends on the purpose for which the investments were acquired and whetherthese are quoted in an active market. The financial assets of the Group are of the nature of loansand receivable, AFS financial assets and HTM financial assets, while its financial liabilities are ofthe nature of other financial liabilities. Management determines the classification at initialrecognition and re-evaluates such designation, where allowed and appropriate, at every reportingdate.
Financial instruments are classified as liability or equity in accordance with the substance of thecontractual arrangement. Interest, dividends, gains and losses relating to a financial instrument ora component that is a financial liability, are reported as expense or income. Distributions toholders of financial instruments classified as equity are charged directly to equity, net of anyrelated income tax benefits.
Determination of fair valueThe fair value for financial instruments traded in active markets at the reporting date is based onits quoted market price or dealer price quotations without any deduction for transaction costs.When current bid and ask prices are not available, the price of the most recent transaction providesevidence of the current fair value as long as there has not been a significant change in economiccircumstances since the time of the transaction.
For all other financial instruments not listed in an active market, the fair value is determined byusing appropriate valuation techniques. Valuation techniques include net present valuetechniques, comparison to similar instruments for which market observable prices exist, optionpricing models, and other relevant valuation models.
“Day 1” differenceWhere the transaction price in a non-active market is different from the fair value from otherobservable current market transactions in the same instrument or based on a valuation techniquewhose variables include only data from observable market, the Group recognizes the difference

- 12 -
*SGVFS021624*
between the transaction price and fair value (a “Day 1” difference) in profit or loss under “Interestincome” and “Interest and other financing charges” accounts unless it qualifies for recognition assome other type of asset or liability. In cases where fair value is determined using data which isnot observable, the difference between the transaction price and model value is only recognized inprofit or loss when the inputs become observable or when the instrument is derecognized. Foreach transaction, the Group determines the appropriate method of recognizing the “Day 1”difference amount.
Loans and receivablesLoans and receivables are nonderivative financial assets with fixed or determinable payments thatare not quoted in an active market. They are not entered into with the intention of immediate orshort-term resale and are not classified as financial assets held-for-trading, designated as AFS oras financial assets at FVPL. Receivables are recognized initially at fair value, which normallypertains to the billable amount. After initial measurement, loans and receivables are subsequentlymeasured at cost or at amortized cost using the effective interest method, less allowance forimpairment losses. Amortized cost is calculated by taking into account any discount or premiumon acquisition and fees that are an integral part of the effective interest rate (EIR). Theamortization, if any, is included in profit or loss. The losses arising from impairment ofreceivables are recognized in profit or loss. These financial assets are included in current assets ifmaturity is within twelve (12) months from the financial reporting date. Otherwise, these areclassified as noncurrent assets.
This accounting policy applies primarily to the Group’s cash and cash equivalents, short-term cashinvestments, long-term cash investments and receivables except for receivable from contractorsand receivable from brokers.
HTM investmentsHTM investments are quoted non-derivative financial assets with fixed or determinable paymentsand fixed maturities for which management has the positive intention and ability to hold tomaturity. Where the Group sells or reclassifies other than an insignificant amount of HTMinvestments, the entire category would be tainted and reclassified at fair value as AFS financialassets. After initial measurement, these financial assets are subsequently measured at amortizedcost using the effective interest method, less allowance for impairment. Amortized cost iscalculated by taking into account any discount or premium on acquisition and fees that are anintegral part of the EIR. The amortization is included as part of interest income in the statement ofcomprehensive income. Gains and losses are recognized in profit or loss in the statement ofcomprehensive income when the HTM investments are derecognized. Any impairment losses arecharged to current operations.
As of December 31, 2016 and 2015, the Group has investments in HTM (Note 9).
AFS financial assetsAFS financial assets are nonderivative financial assets that are designated as such or do not qualifyto be classified or designated as financial assets at FVPL, HTM investments or loans andreceivables. These are purchased and held indefinitely, and may be sold in response to liquidityrequirements or changes in market conditions.
After initial measurement, AFS financial assets are subsequently measured at fair value withunrealised gains or losses recognised in OCI and credited to the OCI until the investment isderecognised, at which time, the cumulative gain or loss is recognised in other operating income,or the investment is determined to be impaired, when the cumulative loss is reclassified from the

- 13 -
*SGVFS021624*
OCI to the statement of profit or loss in finance costs. Interest earned whilst holding AFSfinancial assets is reported as interest income using the EIR method.
When the investment is disposed of, the cumulative gain or loss previously recognized in OCI isrecognized as gain or loss on disposal in profit or loss. Where the Group holds more than oneinvestment in the same security these are deemed to be disposed of on a first-in first-out basis.Interest earned on holding AFS financial assets are reported as interest income using the EIR.Dividends earned on holding AFS financial assets are recognized in profit or loss as part ofmiscellaneous income when the right to receive payment has been established. The losses arisingfrom impairment of such investments are recognized as provisions for impairment losses in profitor loss.
When the fair value of AFS equity financial assets cannot be measured reliably because of lack ofreliable estimates of future cash flows and discount rates necessary to calculate the fair value ofunquoted equity instruments, these investments are carried at cost, less any impairment losses.
As of December 31, 2016 and 2015, AFS financial assets comprise of unquoted and quoted debtand equity securities. The Group’s AFS financial assets in quoted securities pertain to investmentsin fixed maturity bond fund while unquoted equity securities pertain to investments in preferredshares issued by utilities companies.
Other financial liabilitiesOther financial liabilities are initially recognized at the fair value of the consideration received lessdirectly attributable transaction costs.
After initial recognition, other financial liabilities are subsequently measured at amortized costusing the effective interest method. Amortized cost is calculated by taking into account anydiscount or premium on the issue and fees that are an integral part of the EIR. Gains and lossesare recognized in profit or loss when the liabilities are derecognized (redemption is a form ofderecognition), as well as through the amortization process. Any effects of restatement of foreigncurrency-denominated liabilities are recognized in profit or loss.
The financial liabilities measured at cost are accounts and other payables and payable to relatedparties and other liabilities. The financial liabilities measured at amortized cost are bank loans,loans payable, liabilities for purchased land, long-term notes and notes payable.
Derecognition of Financial Assets and Financial LiabilitiesFinancial assetA financial asset (or, where applicable, a part of a group of financial assets) is derecognizedwhere: (a) the rights to receive cash flows from the assets have expired; (b) the Group retains theright to receive cash flows from the asset, but has assumed an obligation to pay them in fullwithout material delay to a third-party under a “pass-through” arrangement; or (c) the Group hastransferred its right to receive cash flows from the asset and either: (i) has transferred substantiallyall the risks and rewards of the asset, or (ii) has neither transferred nor retained the risks andrewards of the asset but has transferred control of the asset.
Where the Group has transferred its rights to receive cash flows from an asset or has entered into apass-through arrangement, and has neither transferred nor retained substantially all the risks andrewards of the asset nor transferred control of the asset, the asset is recognized to the extent of theGroup’s continuing involvement in the asset. Continuing involvement that takes the form of aguarantee over the transferred asset is measured at the lower of the original carrying amount of theasset and the maximum amount of consideration that the Group could be required to repay.

- 14 -
*SGVFS021624*
Financial liabilityA financial liability is derecognized when the obligation under the liability is discharged orcancelled or has expired. Where an existing financial liability is replaced by another from thesame lender on substantially different terms, or the terms of an existing liability are substantiallymodified, such an exchange or modification is treated as a derecognition of the original liabilityand the recognition of a new liability, and the difference in the respective carrying amounts isrecognized in profit or loss.
Impairment of Financial AssetsThe Group assesses at each financial reporting date whether there is objective evidence that afinancial asset or group of financial assets is impaired. A financial asset or a group of financialassets is deemed to be impaired if, and only if, there is objective evidence of impairment as aresult of one or more events that has occurred after the initial recognition of the asset (an incurred‘loss event’) and that loss event (or events) has an impact on the estimated future cash flows of thefinancial asset or the group of financial assets that can be reliably estimated. Evidence ofimpairment may include indications that the borrower or a group of borrowers is experiencingsignificant financial difficulty, default or delinquency in interest or principal payments, and whereobservable data indicate that there is measurable decrease in the estimated future cash flows, suchas changes in arrears or economic conditions that correlate with defaults.
Financial assets carried at amortized costThe Group first assesses whether an objective evidence of impairment exists individually forfinancial assets that are individually significant. If there is objective evidence that an impairmentloss on a financial asset carried at amortized cost (i.e., loans and receivables or HTM investments)has been incurred, the amount of the loss is measured as the difference between the assets’carrying amount and the present value of the estimated future cash flows discounted at the assetsoriginal EIR (excluding future credit losses that have not been incurred). If it is determined thatno objective evidence of impairment exists for an individually assessed financial asset, the asset,together with the other assets that are not individually significant and were thus not individuallyassessed for impairment, is included in a group of financial assets with similar credit riskcharacteristics and that group of financial assets is collectively assessed for impairment.Assets that are individually assessed for impairment and for which an impairment loss is orcontinues to be recognized are not included in a collective assessment of impairment.
For the purpose of a collective evaluation of impairment, financial assets are grouped on the basisof credit risk characteristics such as selling price of the lots and residential houses, past-due statusand term.
Future cash flows in a group of financial assets that are collectively evaluated for impairment areestimated on the basis of historical loss experience for assets with credit risk characteristics similarto those in the group. Historical loss experience is adjusted on the basis of current observable datato reflect the effects of current conditions that did not affect the period on which the historical lossexperience is based and to remove the effects of conditions in the historical period that do not existcurrently. The methodology and assumptions used for estimating future cash flows are reviewedregularly by the Group to reduce any differences between loss estimates and actual lossexperience.
The carrying amount of the asset is reduced through the use of an allowance account and theamount of loss is charged to profit or loss. Financial assets carried at amortized costs, togetherwith the associated allowance accounts, are written off when there is no realistic prospect of futurerecovery and all collateral has been realized. If, in a subsequent year, the amount of the estimatedimpairment loss decreases because of an event occurring after the impairment was recognized, the

- 15 -
*SGVFS021624*
previously recognized impairment loss is reversed. Any subsequent reversal of an impairmentloss is recognized in profit or loss, to the extent that the carrying value of the asset does not exceedits amortized cost at the reversal date.
AFS financial assets carried at fair value
For AFS financial assets, the Group assesses at each reporting date whether there is objectiveevidence that an investment or a group of investments is impaired. In the case of equityinvestments classified as AFS, objective evidence would include a significant or prolonged declinein the fair value of the investment below its cost. ‘Significant’ is evaluated against the original costof the investment and ‘prolonged’ against the period in which the fair value has been below itsoriginal cost. When there is evidence of impairment, the cumulative loss - measured as thedifference between the acquisition cost and the current fair value, less any impairment loss on thatinvestment previously recognised in the statement of profit or loss - is removed from OCI andrecognised in the statement of profit or loss. Impairment losses on equity investments are notreversed through profit or loss; increases in their fair value after impairment are recognised inOCI.
The determination of what is ‘significant’ or ‘prolonged’ requires judgement. In making thisjudgement, the Group evaluates, among other factors, the duration or extent to which the fair valueof an investment is less than its cost. In the case of debt instruments classified as AFS, theimpairment is assessed based on the same criteria as financial assets carried at amortised cost.However, the amount recorded for impairment is the cumulative loss measured as the differencebetween the amortised cost and the current fair value, less any impairment loss on that investmentpreviously recognised in the statement of profit or loss.
Future interest income continues to be accrued based on the reduced carrying amount of the asset,using the rate of interest used to discount the future cash flows for the purpose of measuring theimpairment loss. The interest income is recorded as part of finance income. If, in a subsequentyear, the fair value of a debt instrument increases and the increase can be objectively related to anevent occurring after the impairment loss was recognised in the statement of profit or loss, theimpairment loss is reversed through the statement of profit or loss.
AFS financial assets carried at costIf there is an objective evidence that an impairment loss on an unquoted equity instrument that isnot carried at fair value because its fair value cannot be reliably measured, the amount of the lossis measured as the difference between the carrying amount and the present value of estimatedfuture cash flows discounted at the current market rate of return for a similar financial asset.
Offsetting Financial InstrumentsFinancial assets and financial liabilities are offset and the net amount reported in the consolidatedstatement of financial position if, and only if, there is a currently enforceable legal right to offsetthe recognized amounts and there is an intention to settle on a net basis, or to realize the asset andsettle the liability simultaneously.
Business Combination and GoodwillBusiness combinations are accounted for using the acquisition method. The cost of an acquisitionis measured as the aggregate of the consideration transferred, measured at acquisition date fairvalue and the amount of any non-controlling interest in the acquiree. For each businesscombination, the acquirer measures the non-controlling interest in the acquiree either at fair valueor at the proportionate share of the acquiree’s identifiable net assets.

- 16 -
*SGVFS021624*
When the Group acquires a business, it assesses the financial assets and liabilities assumed forappropriate classification and designation in accordance with the contractual terms, economiccircumstances and pertinent conditions as at the acquisition date. This includes the separation ofembedded derivatives in host contracts by the acquiree.
Any contingent consideration to be transferred by the acquirer will be recognized at fair value atthe acquisition date. Subsequent changes to the fair value of the contingent consideration which isdeemed to be an asset or liability will be recognized in accordance with PAS 39 either in profit orloss or as a change to OCI. If the contingent consideration is classified as equity, it should not beremeasured until it is finally settled within equity.
Goodwill is initially measured at cost being the excess of the aggregate of the considerationtransferred and the amount recognized for non-controlling interest over the net identifiable assetsacquired and liabilities assumed. If this consideration is lower than the fair value of the net assetsof the subsidiary acquired, the difference is recognized in profit or loss as bargain purchase gain.
Following initial recognition, goodwill is measured at cost less any accumulated impairment loss.Goodwill is reviewed for impairment, annually or more frequently if events or changes incircumstances indicate that the carrying value may be impaired. For purposes of impairmenttesting, goodwill acquired in a business combination is, from the acquisition date, allocated to eachof the Group’s CGUs, or groups of CGUs, that are expected to benefit from the synergies of thecombination, irrespective of whether other assets or liabilities of the Group are assigned to thoseunits or groups of units.
Each unit or group of units to which the goodwill is allocated should:
represent the lowest level within the Group at which the goodwill is monitored for internalmanagement purposes; and
not be larger than an operating segment determined in accordance with PFRS 8, OperatingSegments.
Impairment is determined by assessing the recoverable amount of the CGU (or group of CGUs), towhich the goodwill relates. Where the recoverable amount of the CGU (or group of CGUs) is lessthan the carrying amount, an impairment loss is recognized. Where goodwill forms part of a CGU(or group of CGUs) and part of the operation within that unit is disposed of, the goodwillassociated with the operation disposed of is included in the carrying amount of the operation whendetermining the gain or loss on disposal of the operation. Goodwill disposed of in thesecircumstances is measured based on the relative values of the operation disposed of and theportion of the CGU retained. If the acquirer’s interest in the net fair value of the identifiableassets, liabilities and contingent liabilities exceeds the cost of the business combination, theacquirer shall recognize immediately in the consolidated statement of income any excessremaining after reassessment.
PFRS 3 provides that if the initial accounting for a business combination can be determined onlyprovisionally by the end of the period in which the combination is effected because either the fairvalues to be assigned to the acquiree’s identifiable assets, liabilities or contingent liabilities or thecost of the combination can be determined only provisionally, the acquirer shall account for thecombination using those provisional values. The acquirer shall recognize any adjustments to thoseprovisional values as a result of completing the initial accounting within twelve months of theacquisition date as follows: (i) the carrying amount of the identifiable asset, liability or contingentliability that is recognized or adjusted as a result of completing the initial accounting shall becalculated as if its fair value at the acquisition date had been recognized from that date;

- 17 -
*SGVFS021624*
(ii) goodwill or any gain recognized shall be adjusted by an amount equal to the adjustment to thefair value at the acquisition date of the identifiable asset, liability or contingent liability beingrecognized or adjusted; and (iii) comparative information presented for the periods before theinitial accounting for the combination is complete shall be presented as if the initial accounting hasbeen completed from the acquisition date.
For business combinations under common control an entity can choose to account for thecombinations using the acquisition method or pooling of interest method.
Under the pooling of interest method, the assets and liabilities of the combining entities arereflected at their carrying amounts. No adjustments are made to reflect fair values, or recognizeany new assets or liabilities, at the date of the combination. No goodwill is recognized. Theadjustments made, if any, are only to the extent to harmonize accounting policies within theGroup.
At consolidation, any difference between the consideration paid or transferred and the equityacquired is reflected within equity. As applicable, the difference is recognized as part of theadditional paid-in capital.
However, where an entity selects the acquisition method of accounting, the transaction must havesubstance from the perspective of the reporting entity. When evaluating whether the transactionhas substance, the following factors are considered:
(a) the purpose of the transaction;(b) the involvement of outside parties in the transaction, such as non-controlling interests or other
third parties;(c) whether or not the transaction is conducted at fair values;(d) the existing activities of the entities involved in the transactions;(e) whether or not it is bringing entities together into a “reporting entity” that didn’t exist before;
and(f) where a new company is established, whether it is undertaken as an integral part of an IPO or
spin-off or other change in control and significant change in ownership.
Under acquisition method, the Group can either measure the consideration transferred at theacquisition-date fair value of the consideration actually given or elect to impute an additionalequity contribution to recognize total consideration equivalent to the fair value of the businessreceived. Whichever method is adopted should be applied consistently, and the entity shoulddisclose its chosen accounting policy.
Real Estate InventoriesReal estate inventories consist of subdivision land, residential houses and lots and condominiumunits for sale and development. These are properties acquired or being constructed for sale in theordinary course of business rather than to be held for rental or capital appreciation. These are heldas inventory and are measured at the lower of cost and net realizable value (NRV).
- 18 -
*SGVFS021624*
Cost includes: Acquisition cost of subdivision land; Amounts paid to contractors for construction and development of subdivision land and
residential and condominium units; and Capitalized borrowing costs, planning and design costs, cost of site preparation, professional
fees for legal services, property transfer taxes, construction overheads and other related costs.
Nonrefundable commissions paid to sales or marketing agents on the sale of real estate units areexpensed when paid.
NRV is the estimated selling price in the ordinary course of the business, based on market pricesat the reporting date, less costs to complete and the estimated costs of sale. The carrying amountof inventories is reduced through the use of allowance account and the amount of loss is chargedto profit or loss.
The cost of inventory recognized in profit or loss on disposal is determined with reference to thespecific costs incurred on the property sold and an allocation of any non-specific costs. The totalcosts are allocated pro-rata based on the relative size of the property sold.
Model House AccessoriesModel house accessories are measured at the lower of cost and NRV.
Land and ImprovementsLand and improvements consists of properties for future developments and are carried at the lowerof cost or NRV. Costs include cost incurred for development and improvements of the properties.Upon start of development, the related cost of the land is transferred to real estate inventories.
Prepaid ExpensesPrepaid expenses are carried at cost less the amortized portion. These typically compriseprepayments for marketing fees, taxes and licenses, rentals and insurance.
Creditable Withholding TaxThis pertains to the tax withheld at source by the Group’s customer and is creditable against theincome tax liability of the Group.
Construction MaterialsConstruction materials are valued at the lower of cost or NRV. Cost is determined using themoving average method. NRV is the replacement cost.
Value-Added Tax (VAT)The input value-added tax pertains to the 12% indirect tax paid by the Group in the course of theGroup’s trade or business on local purchase of goods or services.
Output VAT pertains to the 12% tax due on the local sale of goods or services by the Group.
If at the end of any taxable month, the output VAT exceeds the input VAT, the outstandingbalance is included under “Accounts and other payables” account. If the input VAT exceeds theoutput VAT, the excess shall be carried over to the succeeding months and included under “Othercurrent asset” account.

- 19 -
*SGVFS021624*
Investment PropertiesInvestment properties comprise completed property and property under construction orre-development that are held to earn rentals or for capital appreciation or both. Investmentproperties, except for land, are carried at cost less accumulated depreciation and amortization andany impairment in value. Land is carried at cost less any impairment in value.
Expenditures incurred after the investment property has been put in operation, such as repairs andmaintenance costs, are normally charged against income in the period in which the costs areincurred.
Construction-in-progress (CIP) is stated at cost. This includes cost of construction and other directcosts. CIP is not depreciated until such time as the relevant assets are completed and put intooperational use. Construction-in-progress are carried at cost and transferred to the relatedinvestment property account when the construction and related activities to prepare the propertyfor its intended use are complete, and the property is ready for occupation.
Depreciation and amortization are computed using the straight-line method over the estimateduseful lives (EUL) of the assets, regardless of utilization. The EUL and the depreciation andamortization method are reviewed periodically to ensure that the period and method ofdepreciation and amortization are consistent with the expected pattern of economic benefits fromitems of investment properties.
The EUL of buildings and building improvements is 10 to 40 years.
Investment properties are derecognized when either they have been disposed of or when theinvestment property is permanently withdrawn from use and no future economic benefit isexpected from its disposal. Any gain or loss on the retirement or disposal of an investmentproperty is recognized in profit or loss in the year of retirement or disposal.
Transfers are made to investment property when there is a change in use, evidenced by ending ofowner-occupation, commencement of an operating lease to another party or ending of constructionor development. Transfers are made from investment property when, and only when, there is achange in use, evidenced by commencement of owner-occupation or commencement ofdevelopment with a view to sale. Transfers between investment property, owner-occupiedproperty and inventories do not change the carrying amount of the property transferred and theydo not change the cost of the property for measurement or for disclosure purposes.
Property and EquipmentProperty and equipment are carried at cost less accumulated depreciation and amortization and anyimpairment in value.
The initial cost of property and equipment consists of its purchase price, including import duties,taxes and any directly attributable costs of bringing the asset to its working condition and locationfor its intended use. Expenditures incurred after the property and equipment have been put intooperation, such as repairs and maintenance are normally charged against operations in the periodin which the costs are incurred.

- 20 -
*SGVFS021624*
Depreciation and amortization of property and equipment commences once the property andequipment are available for use and computed using the straight-line basis over the EUL ofproperty and equipment as follows:
YearsBuilding and building improvements 10 to 40Transportation equipment 2 to 5Office furniture, fixtures and equipment 2 to 5Construction equipment 2 to 5Other fixed assets 1 to 5
Building improvements are amortized on a straight-line basis over the term of the lease or theEUL of the asset, whichever is shorter.
The useful lives and depreciation and amortization method are reviewed annually to ensure thatthe period and method of depreciation and amortization are consistent with the expected pattern ofeconomic benefits from items of property and equipment.
When property and equipment are retired or otherwise disposed of, the cost of the relatedaccumulated depreciation and amortization and accumulated provision for impairment losses, ifany, are removed from the accounts and any resulting gain or loss is credited to or charged againstcurrent operations.
Fully depreciated and amortized property and equipment are retained in the accounts until they areno longer in use. No further depreciation and amortization is charged against current operations.
Investments and Advances in Project Development CostsInvestments and advances in project development costs pertain to costs incurred on various on-going projects under the land development agreements (LDAs) entered into by the Group withindividuals, corporate entities and related parties for the development of real estate projects.
Systems Development CostsCosts associated with developing or maintaining computer software programs are recognized asexpense as incurred. Costs that are directly associated with identifiable and unique softwarecontrolled by the Group and will generate economic benefits exceeding costs beyond one year, arerecognized as intangible assets to be measured at cost less accumulated amortization and provisionfor impairment losses, if any.
System development costs recognized as assets are amortized using the straight-line method overtheir useful lives, but not exceeding a period of three years. Where an indication of impairmentexists, the carrying amount of computer system development costs is assessed and written downimmediately to its recoverable amount.
Impairment of Nonfinancial AssetsThis accounting policy relates to property and equipment, investment properties, investment in anassociate, investments in project development costs and a joint venture, model house accessoriesand systems development costs.
The Group assesses as at reporting date whether there is an indication that nonfinancial assets maybe impaired. If any such indication exists, or when annual impairment testing for an asset isrequired, the Group makes an estimate of the asset’s recoverable amount. An asset’s recoverableamount is calculated as the higher of the asset’s or cash-generating unit’s fair value less costs to

- 21 -
*SGVFS021624*
sell and its value in use and is determined for an individual asset, unless the asset does notgenerate cash inflows that are largely independent of those assets or groups of assets. Where thecarrying amount of an asset exceeds its recoverable amount, the asset is considered impaired andis written down to its recoverable amount. In assessing value in use, the estimated future cashflows are discounted to their present value using a pre-tax discount rate that reflects current marketassessment of the time value of money and the risks specific to the asset. Impairment losses ofcontinuing operations are recognized in profit or loss in those expense categories consistent withthe function of the impaired asset.
An assessment is made at each financial reporting date as to whether there is an indication thatpreviously recognized impairment losses may no longer exist or may have decreased. If suchindication exists, the recoverable amount is estimated. A previously recognized impairment loss isreversed only if there has been a change in the estimates used to determine the asset’s recoverableamount since the last impairment loss was recognized. If that is the case, the carrying amount ofthe asset is increased to its recoverable amount. That increased amount cannot exceed thecarrying amount that would have been determined, net of depreciation and amortization, had noimpairment loss been recognized for the asset in prior years. Such reversal is recognized in profitor loss unless the asset is carried at revalued amount, in which case the reversal is treated asrevaluation increase in OCI. After such reversal, the depreciation and amortization charge isadjusted in future periods to allocate the asset’s revised carrying amount, less any residual value,on a systematic basis over its remaining useful life.
EquityWhen the shares are sold at premium, the difference between the proceeds at the par value iscredited to “Additional paid-in capital” account. Direct costs incurred related to equity issuanceare chargeable to “Additional paid-in capital” account. If additional paid-in capital is notsufficient, the excess is charged against retained earnings. When the Group issues more than oneclass of stock, a separate account is maintained for each class of stock and the number of sharesissued.
Retained earnings represent accumulated earnings of the Group less dividends declared. Itincludes the accumulated equity in undistributed earnings of consolidated subsidiaries which arenot available for dividends until declared by the subsidiaries.
Own equity instruments which are reacquired (treasury shares) are recognized at cost anddeducted from equity. No gain or loss is recognized in profit or loss on the purchase, sale, issue orcancellation of the Group’s own equity instruments. Any difference between the carrying amountand the consideration, if reissued, is recognized in additional paid-in capital. Voting rights relatedto treasury shares are nullified for the Group and no dividends are allocated to them respectively.When the shares are retired, the capital stock account is reduced by its par value and the excess ofcost over par value upon retirement is debited to additional paid-in capital to the extent of thespecific or average additional paid-in capital when the shares were issued and to retained earningsfor the remaining balance.
The retained earnings is restricted to payments of dividends to the extent of the cost of treasuryshares.
Treasury SharesOwn equity instruments which are acquired (treasury shares) are recognized at cost and deductedfrom equity. No gains or loss is recognized in the profit or loss on the purchase, sale, issue orcancellation of the Parent Company’s own equity instruments.

- 22 -
*SGVFS021624*
Revenue and Cost RecognitionRevenue is recognized to the extent that it is probable that the economic benefits will flow to theGroup and the revenue can be reliably measured.
Real estate revenueFor real estate sales, the Group assesses whether it is probable that the economic benefits will flowto the Group when the sales prices are collectible. Collectability of the sales price is demonstratedby the buyer’s commitment to pay, which in turn is supported by substantial initial and continuinginvestments that give the buyer a stake in the property sufficient that the risk of loss throughdefault motivates the buyer to honor its obligation to the seller. Collectability is also assessed byconsidering factors such as the credit standing of the buyer, age and location of the property.
Revenue from sales of completed real estate projects is accounted for using the full accrualmethod. In accordance with Philippine Interpretations Committee, Q&A 2006-01, the percentage-of-completion (POC) method is used to recognize income from sales of projects where the Grouphas material obligations under the sales contract to complete the project after the property is sold,the equitable interest has been transferred to the buyer, construction is beyond preliminary stage(i.e., engineering, design work, construction contracts execution, site clearance and preparation,excavation and the building foundation are finished, and the costs incurred or to be incurred can bemeasured reliably). Under this method, revenue is recognized as the related obligations arefulfilled, measured principally on the basis of the estimated completion of a physical proportion ofthe contract work.
Any excess of collections over the recognized receivables are included in the “Customers’advances and deposits” account in the liabilities section of the consolidated statement of financialposition.
When a sale of real estate does not meet the requirements for revenue recognition, the sale isaccounted for under the deposit method. Under this method, revenue is not recognized, and thereceivable from the buyer is not recorded. The real estate inventories continue to be reported onthe consolidated statement of financial position as “Real estate inventories” and the relatedliability as deposits under “Customers’ advances and deposits”.
Cost of real estate sales is recognized consistent with the revenue recognition method applied.Cost of subdivision land and condominium units sold before the completion of the development isdetermined on the basis of the acquisition cost of the land plus its full development costs, whichinclude estimated costs for future development works, as determined by the Group’s in-housetechnical staff.
Income from forfeited reservations and collectionsIncome from forfeited reservation and collections is recognized when the deposits from potentialbuyers are deemed nonrefundable due to prescription of the period for entering into a contractedsale. Such income is also recognized, subject to the provisions of Republic Act 6552, RealtyInstallment Buyer Act, upon prescription of the period for the payment of required amortizationsfrom defaulting buyers.

- 23 -
*SGVFS021624*
Rental incomeRental income from investment property is accounted for on a straight-line basis over the leaseterm.
Interest incomeInterest is recognized using the effective interest method, i.e, the rate, that exactly discountsestimated future cash receipts through the expected life of the financial instrument to the netcarrying amount of the financial asset.
Unearned discount is recognized as income over the terms of the financial assets at amortized cost(i.e., loans and receivables or HTM investments) using the effective interest method and is shownas deduction for the financial assets.
Dividend and miscellaneous incomeDividend and miscellaneous income are recognized when the Group’s right to receive payment isestablished.
Pension CostDefined benefit planThe net defined benefit liability or asset is the aggregate of the present value of the defined benefitobligation at the end of the reporting period reduced by the fair value of plan assets, adjusted forany effect of limiting a net defined benefit asset to the asset ceiling. The asset ceiling is thepresent value of any economic benefits available in the form of refunds from the plan orreductions in future contributions to the plan.
The cost of providing benefits under the defined benefit plans is actuarially determined using theprojected unit credit (PUC) method.
Defined benefit costs comprise the following:
(a) service cost;(b) net interest on the net defined benefit liability or asset; and(c) remeasurements of net defined benefit liability or asset.
Service costs which include current service costs, past service costs and gains or losses on non-routine settlements are recognized as expense in profit or loss. Past service costs are recognizedwhen plan amendment or curtailment occurs.
Net interest on the net defined benefit liability or asset is the change during the period in the netdefined benefit liability or asset that arises from the passage of time which is determined byapplying the discount rate based on high quality corporate bonds to the net defined benefit liabilityor asset. Net interest on the net defined benefit liability or asset is recognized as expense orincome in profit or loss.
Remeasurements comprising actuarial gains and losses, return on plan assets and any change inthe effect of the asset ceiling (excluding net interest on defined benefit liability) are recognizedimmediately in OCI in the period in which they arise. Remeasurements are not reclassified toprofit or loss in subsequent periods.
Plan assets are assets that are held by a long-term employee benefit fund or qualifying insurancepolicies. Plan assets are not available to the creditors of the Group, nor can they be paid directlyto the Group. Fair value of plan assets is based on market price information. When no market

- 24 -
*SGVFS021624*
price is available, the fair value of plan assets is estimated by discounting expected future cashflows using a discount rate that reflects both the risk associated with the plan assets and thematurity or expected disposal date of those assets (or, if they have no maturity, the expectedperiod until the settlement of the related obligations).
The Group’s right to be reimbursed of some or all of the expenditure required to settle a definedbenefit obligation is recognized as a separate asset at fair value when and only whenreimbursement is virtually certain.
Income TaxesCurrent taxCurrent tax assets and liabilities for the current and prior periods are measured at the amountexpected to be recovered from or paid to the taxation authorities. The tax rates and tax laws usedto compute the amount are those that are enacted or substantively enacted by the reporting date.
Deferred taxDeferred tax is provided using the liability method on temporary differences, with certainexceptions, at the reporting date between the tax bases of assets and liabilities and their carryingamounts for financial reporting purposes.
Deferred tax liabilities are recognized for all taxable temporary differences, with certainexceptions. Deferred tax liabilities shall be recognized for all taxable temporary differencesassociated with investments in subsidiaries, associates and interests in joint ventures when thetiming of reversal of the temporary differences can be controlled and it is probable that thetemporary differences will not reverse in foreseeable future. Otherwise, no deferred tax liability isset up.
Deferred tax assets are recognized for all deductible temporary differences, carryforward benefitof unused tax credits from excess of minimum corporate income tax (MCIT) over the regularcorporate income tax and unused net operating loss carryover (NOLCO), to the extent that it isprobable that taxable income will be available against which the deductible temporary differencesand carryforward benefits of unused tax credits from MCIT and NOLCO can be utilized.
Deferred tax assets shall be recognized for deductible temporary differences associated withinvestments in subsidiaries, associates and interests in joint ventures only to the extent that it isprobable that the temporary differences will reverse in the foreseeable future and taxable profitwill be available against which the temporary differences can be utilized.
The carrying amount of deferred tax assets is reviewed at each financial reporting date andreduced to the extent that it is no longer probable that sufficient taxable income will be availableto allow the deferred tax assets to be utilized. Unrecognized deferred tax assets are reassessed ateach financial reporting date and are recognized to the extent that it has become probable thatfuture taxable income will allow the deferred tax asset to be recovered.
Deferred tax assets and liabilities are measured at the tax rate that is expected to apply in theperiod when the asset is realized or the liability is settled, based on tax rates and tax laws that havebeen enacted or substantively enacted at the reporting date.
Deferred tax relating to items recognized outside profit or loss is recognized outside profit or lossin the consolidated statement of comprehensive income. Deferred tax items recognized incorrelation to the underlying transaction either in other comprehensive income or directly inequity.
- 25 -
*SGVFS021624*
Deferred tax assets and deferred tax liabilities are offset if a legally enforceable right exists to setoff current tax assets against current tax liabilities, and the deferred taxes relate to the sametaxable entity and the same taxation authority.
CommissionsThe Group recognizes commissions when services are rendered by the broker. The commissionexpense is accrued upon receipt of down payment from the buyer comprising a substantial portionof the contract price and the capacity to pay and credit worthiness of buyers have been reasonablyestablished for sales under the deferred cash payment arrangement.
Borrowing CostsBorrowing costs directly attributable to the acquisition or construction of an asset that necessarilytakes a substantial period of time to get ready for its intended use or sale are capitalized as part ofthe cost of the respective assets (included in “Real estate inventories” and “Investment properties”accounts in the consolidated statement of financial position). All other borrowing costs areexpensed in the period in which they occur. Borrowing costs consist of interest and other coststhat an entity incurs in connection with the borrowing of funds.
The interest capitalized is calculated using the Group’s weighted average cost of borrowings afteradjusting for borrowings associated with specific developments. Where borrowings are associatedwith specific developments, the amounts capitalized is the gross interest incurred on thoseborrowings less any investment income arising on their temporary investment.
Interest is capitalized from the commencement of the development work until the date of practicalcompletion. The capitalization of finance costs is suspended if there are prolonged periods whendevelopment activity is interrupted. Interest is also capitalized on the purchase cost of a site ofproperty acquired specifically for redevelopment but only where activities necessary to prepare theasset for redevelopment are in progress.
Operating ExpensesOperating expenses constitute costs of administering the business. These are recognized asexpenses when incurred.
LeasesThe determination of whether an arrangement is, or contains a lease is based on the substance ofthe arrangement at inception date, and requires an assessment of whether the fulfillment of thearrangement is dependent on the use of a specific asset or assets and the arrangement conveys aright to use the asset. A reassessment is made after inception of the lease only if one of thefollowing applies:
(a) there is a change in contractual terms, other than a renewal or extension of the arrangement; arenewal option is exercised or extension granted, unless that term of the renewal or extensionwas initially included in the lease term;
(b) there is a change in the determination of whether fulfillment is dependent on a specified asset;or
(c) there is a substantial change to the asset.
Where a reassessment is made, lease accounting shall commence or cease from the date when thechange in circumstances gave rise to the reassessment for any of the scenarios above, and at thedate of renewal or extension period for the second scenario.

- 26 -
*SGVFS021624*
Group as a lesseeLeases where the lessor retains substantially all the risks and benefits of ownership of the asset areclassified as operating leases. Operating lease payments are recognized as an expense in profit orloss in the statement of comprehensive income on a straight-line basis over the lease term.Indirect costs incurred in negotiating an operating lease are added to the carrying value of theleased asset and recognized over the lease term on the same bases as the lease income. Minimumlease payments are recognized on a straight-line basis while the variable rent is recognized as anexpense based on the terms of the lease contract.
Group as a lessorLeases where the lessor does not transfer substantially all the risks and benefits of ownership ofthe assets are classified as operating leases. Initial direct costs incurred in negotiating operatingleases are added to the carrying amount of the leased asset and recognized over the lease term onthe same basis as the rental income. Contingent rents are recognized as revenue in the period inwhich they are earned.
Foreign Currency TranslationEach entity in the Group determines its own functional currency and items included in theconsolidated financial statements of each entity are measured using that functional currency.Transactions in foreign currencies are initially recorded in the functional currency rate ruling atthe date of the transaction. Monetary assets and liabilities denominated in foreign currencies areretranslated at the functional currency rate of exchange ruling at the reporting date. Exchangegains or losses arising from foreign exchange transactions are credited to or charged againstoperations for the period.
The functional currency of C&P International Limited and VII is the US Dollar. As of reportingdate, the assets and liabilities of foreign subsidiaries, with functional currencies other than thefunctional currency of the Parent Company, are translated into the presentation currency of theGroup using the closing foreign exchange rate prevailing at the reporting date, and their respectiveincome and expenses at the weighted average rates for the year. The exchange differences arisingon the translation are recognized in OCI. On disposal of a foreign operation, the component ofOCI relating to that particular foreign operation shall be recognized in profit or loss in theconsolidated statement of comprehensive income.
Basic and Diluted Earnings Per Share (EPS)Basic EPS is computed by dividing net income for the year attributable to common stockholdersby the weighted average number of common shares issued and outstanding during the yearadjusted for any subsequent stock dividends declared. Diluted EPS is computed by dividing netincome for the year by the weighted average number of common shares issued and outstandingduring the year after giving effect to assumed conversion of potential common shares. Thecalculation of diluted EPS does not assume conversion, exercise, or other issue of potentialcommon shares that would have an antidilutive effect on earnings per share.
As of December 31, 2016, 2015 and 2014, the Group has no potential dilutive common shares(Note 31).
The basic and diluted EPS for the years ended December 31, 2015 and 2014 have beenretroactively adjusted to take into consideration the effect of the pooling of interest method inaccounting the acquisition of Starmalls Group (Notes 7 and 31).

- 27 -
*SGVFS021624*
Segment ReportingThe Group’s operating businesses are organized and managed separately according to the natureof the products and services provided, with each segment representing a strategic business unitthat offers different products and serves different markets. Financial information on operatingsegments is presented in Note 6 to the consolidated financial statements.
ProvisionsProvisions are recognized when the Group has a present legal or constructive obligation as a resultof past events, it is more likely than not that an outflow of resources will be required to settle theobligation, and the amount can be reliably estimated. Provisions are not recognized for futureoperating losses.
Provisions are measured at the present value of the expenditures expected to be required to settlethe obligation using a pre-tax rate that reflects the current market assessment of the time value ofmoney and the risk specific to the obligation. Where discounting is used, the increase in theprovision due to the passage of time is recognized as interest expense. Where the Group expectssome or all of a provision to be reimbursed, the reimbursement is recognized only when thereimbursement is virtually certain. The expense relating to any provision is presented in statementof comprehensive income net of any reimbursement.
ContingenciesContingent liabilities are not recognized in the consolidated financial statements. These aredisclosed unless the possibility of an outflow of resources embodying economic benefits isremote. Contingent assets are not recognized in the consolidated financial statements butdisclosed when an inflow of economic benefits is probable.
Events After the Financial Reporting DatePost year-end events that provide additional information about the Group’s position at thereporting date (adjusting events) are reflected in the consolidated financial statements. Any postyear-end events that are not adjusting events are disclosed in the consolidated financial statementswhen material.
5. Significant Accounting Judgments and Estimates
The preparation of accompanying consolidated financial statements in compliance with PFRSrequires management to make estimates and assumptions that affect the amounts reported in theconsolidated financial statements and accompanying notes. The estimates and assumptions usedin the consolidated financial statements are based upon management’s evaluation of relevant factsand circumstances as at the date of the consolidated financial statements. Actual results coulddiffer from such estimates.
Judgments and estimates are continually evaluated and are based on historical experience andother factors, including expectations of future events that are believed to be reasonable under thecircumstances.
JudgmentsIn the process of applying the Group’s accounting policies, management has made the followingjudgments, apart from those involving estimations, which have the most significant effect on theamounts recognized in the consolidated financial statements:

- 28 -
*SGVFS021624*
Revenue and cost recognitionSelecting an appropriate revenue recognition method for a particular real estate sale transactionrequires certain judgments based on, among others:
Buyer’s commitment on the sale which may be ascertained through the significance of thebuyer’s initial investment; and
Stage of completion of the project.
Collectability of the sales priceFor real estate sales, in determining whether the sales prices are collectible, the Group considersthat initial and continuing investments by the buyer of about 5% would demonstrate the buyer’scommitment to pay.
Classification of financial instrumentsThe Group exercises judgment in classifying a financial instrument, or its component parts, on theinitial recognition as a financial asset, a financial liability or an equity instrument in accordancewith the substance of the contractual arrangement and the definitions of a financial asset, afinancial liability or an equity instrument. The substance of the financial instrument, rather thanits legal form, governs its classification in the consolidated statement of financial position.
In addition, the Group classifies financial assets by evaluating, among other, whether the asset isquoted or not in an active market. Included in the evaluation on whether a financial asset isquoted in an active market is the determination of whether quoted prices are readily and regularlyavailable, and whether those prices represent actual and regularly occurring market transactions onan arm’s length basis.
The Group classifies certain quoted nonderivative financial assets with fixed or determinablepayments and fixed maturities as HTM investments. This classification required significantjudgment. In making this judgment, the group evaluates its intention and ability to hold suchinvestments to maturity. If the Group fails to keep these investments to maturity other than incertain specific circumstances, the Group will be required to reclassify the entire portfolio as AFSfinancial assets. Consequently, the investment would therefore be measured at fair value and notat amortized cost.
Distinction between real estate inventories and land and improvementsThe Group determines whether a property will be classified as Real estate inventories or Land andimprovements. In making this judgment, the Group considers whether the property will be sold inthe normal operating cycle (Real estate inventories) or whether it will be retained as part of theGroup’s strategic landbanking activities for development or sale in the medium or long-term(Land and improvements). Land and improvements that are to be developed in the subsequentyear are classified as part of the current assets.
Operating lease commitments - the Group as lesseeThe Group has entered into contract of lease for some of the office space it occupies. The Grouphas determined that all significant risks and benefits of ownership on these properties will beretained by the lessor. In determining significant risks and benefits of ownership, the Groupconsidered, among others, the significance of the lease term as compared with the EUL of therelated asset. The Group accordingly accounted for these as operating leases.
Operating lease commitments - the Group as lessorThe Group has entered into commercial property leases on its investment property portfolio. TheGroup has determined that it retains all significant risks and rewards of ownership of these

- 29 -
*SGVFS021624*
properties as the Group considered among others the length of the lease term as compared with theEUL of the assets.
Classification of property as investment property or real estate inventoriesThe Group determines whether a property is classified as investment property or inventoryproperty as follows:
Investment property comprises land and buildings (principally offices, commercial and retailproperty) which are not occupied substantially for use by, or in the operations of, the Group,nor for sale in the ordinary course of business, but are held primarily to earn rental income andcapital appreciation.
Inventory comprises property that is held for sale in the ordinary course of business.Principally, this is residential and commercial property that the Group develops and intends tosell before or on completion of construction.
Distinction between investment properties and land and improvementsThe Group determines a property as investment property if such is not intended for sale in theordinary course of business, but are held primarily to earn rental income and capital appreciation.Land and improvements comprise property that is retained as part of the Group’s strategiclandbanking activities for development or sale in the medium or long-term.
Distinction between investment properties and owner-occupied propertiesThe Group determines whether a property qualifies as an investment property. In making itsjudgment, the Group considers whether the property generates cash flows largely independent ofthe other assets held by an entity. Owner-occupied properties generate cash flows that areattributable not only to property but also to the other assets used in the production or supplyprocess.
Some properties comprise a portion that is held to earn rentals or for capital appreciation andanother portion that is held for use in the production or supply of goods or services or foradministrative purposes. If these portions cannot be sold separately, the property is accounted foras an investment property only if an insignificant portion is held for use in the production orsupply of goods or services or for administrative purposes. Judgment is applied in determiningwhether ancillary services are so significant that a property does not qualify as investmentproperty. The Group considers each property separately in making its judgment.
Business CombinationThe Group determined that Starmalls and its subsidiaries are under common control and accountedthe acquisition of Starmalls Group under the pooling of interest method. No goodwill isrecognized (Note 7).
The Group determined that Malay Resorts is not under common control and accounted theacquisition of Malay Resorts under the acquisition method. The Group determines whether thereare separate intangible assets and contingent liabilities and assessed that there are none atacquisition date. Goodwill arising from this business combination amounted to P=147.27 million(Note 7).

- 30 -
*SGVFS021624*
Management’s Use of EstimatesThe key assumptions concerning the future and other key sources of estimation uncertainty at thereporting date, that have a significant risk of causing a material adjustment to the carryingamounts of assets and liabilities within the next financial year are discussed below.
Revenue and cost recognitionThe assessment process for the percentage of completion (POC) and the estimated projectdevelopment costs requires technical determination by management’s specialists (projectengineers) and involves significant management judgment. The Group applies the POC method indetermining real estate revenue and costs. For residential lots and condominium units, the POC isbased on the proportion of cost incurred to date over total estimated cost of the real estate project.For residential houses, the POC is based on the physical proportion of work determined based onthe bill of quantities applied to the construction. The cost of sales is determined based on theestimated project development costs applied with the respective project’s POC.
The related balances from real estate transactions follow:
2016 2015 2014Real estate sales P=25,025,209,355 P=24,502,151,823 P=22,320,714,822Costs of real estate sales
(Notes 11 and 26) 12,320,996,040 12,253,889,631 11,032,282,041
Determining fair values of financial assets and liabilitiesFair value determinations for financial assets and liabilities are based generally on listed marketprices or broker or dealer quotations. If prices are not readily determinable or if liquidating thepositions is reasonably expected to affect market prices, fair value is based on either internalvaluation models or management’s estimate of amounts that could be realized under currentmarket condition, assuming an orderly liquidation over a reasonable period of time. Fair valuedisclosures are provided in Note 32.
Impairment of financial assets
(i) AFS securitiesThe Group determines that AFS securities are impaired when there has been a significant orprolonged decline in the fair value below its cost. This determination of what is significant orprolonged requires judgment. The Group treats ‘significant’ generally as 20% or more of theoriginal cost of investment, and ‘prolonged’, greater than twelve (12) months. In making thisjudgment, the Group evaluates among other factors, the normal volatility in share price ofsimilar equity securities.
In addition, in the case of unquoted equity securities, impairment may be appropriate whenthere is evidence of deterioration in the financial health of the investee, dismal industry andsector performance, adverse changes in technology, and negative operational and financingcash flows.
The carrying values of AFS financial assets pertaining to fixed maturity bond funds amountedto P=8,079.23 million and P=7,207.76 million as of December 31, 2016 and 2015, respectively(Note 9).

- 31 -
*SGVFS021624*
(ii) Loans and receivablesThe Group reviews its receivables on a periodic basis to assess impairment of receivables atan individual and collective level. In assessing for impairment, the Group determines whetherthere is any objective evidence indicating that there is a measurable decrease in the estimatedfuture cash flows of its loans and receivables. This evidence may include observable dataindicating that there has been an adverse change in the payment status of borrowers, orindustry-wide or local economic conditions that correlate with defaults on receivables. Thesefactors include, but are not limited to age of balances, financial status of counterparties,payment behavior and known market factors. The Group reviews the age and status ofreceivables, and identifies individually significant accounts that are to be provided withallowance.
For the purpose of a collective evaluation of impairment, loans are grouped on the basis ofsuch credit risk characteristics as type of borrower, collateral type, past-due status and term.
The amount and timing of recorded expenses for any period would differ if the Group madedifferent judgments or utilized different estimates. An increase in allowance for impairmentwould increase recorded expenses and decrease net income.
Loans and receivables, net of allowance for impairment losses, amounted toP=37,541.67 million and P=34,254.46 million as of December 31, 2016 and 2015, respectively(Note 10). The allowance for impairment on loans and receivables amounted toP=393.34 million and P=392.30 million as of December 31, 2016 and 2015, respectively.
(iii)HTM investmentsThe Group assesses at end of each reporting period whether there is any objective evidencethat its HTM investments is impaired. Objective evidence that a financial asset is impairedincludes observable data that comes to the attention of the holder of the assets about thefollowing loss events:
a. significant financial difficulty of the issuer or the obligor;b. a breach of contract, such as a default or delinquency in interest or principal payments;c. the lender, for the economic or legal reasons relating to the borrower’s financial difficulty,
granting to the borrower a concession that the lender would not otherwise consider;d. it becoming probable that the borrower will enter bankruptcy or other financial
reorganization;e. the disappearance of an active market for that financial asset because of the financial
difficulties; orf. observable data indication that there is a measurable decrease in the estimated future cash
flows ranging from a group of financial assets since the initial recognition of those assets,although the decrease cannot yet be identified with the individual financial assets in thegroup.
HTM investments as of December 31, 2016 and 2015 amounted to P=20,851.61 million andP=13,521.56 million, respectively (Note 9).
Evaluation of net realizable value of real estate inventories and land and improvementsReal estate inventories and land and improvements are valued at the lower of cost or NRV. Thisrequires the Group to make an estimate of the real estate for sale inventories and land andimprovements’ estimated selling price in the ordinary course of business, cost of completion andcosts necessary to make a sale to determine the NRV. The Group adjusts the cost of its real estateinventories and land and improvements to NRV based on its assessment of the recoverability of
- 32 -
*SGVFS021624*
these assets. In determining the recoverability of these assets, management considers whetherthese assets are damaged, if their selling prices have declined and management’s plan indiscontinuing the real estate projects. Estimated selling price is derived from publicly availablemarket data and historical experience, while estimated selling costs are basically commissionexpense based on historical experience. Management would also obtain the services of anindependent appraiser to determine the fair value of undeveloped land based on the latest sellingprices of the properties of the same characteristics of the land and improvements.
Real estate inventories amounted to P=22,954.66 million and P=22,855.69 million as ofDecember 31, 2016, 2015 and 2014, respectively (Note 11). Land and improvements amounted toP=30,486.62 million and P=27,864.68 million as of December 31, 2016 and 2015, respectively(Note 13).
Evaluation of impairmentThe Group reviews investment in an associate, investments in project development costs,investment properties, property and equipment, system development costs and goodwill forimpairment of value. This includes considering certain indications of impairment such assignificant changes in asset usage, significant decline in assets’ market value, obsolescence orphysical damage of an asset, significant underperformance relative to expected historical orprojected future operating results and significant negative industry or economic trends.
The Group estimates the recoverable amount as the higher of the fair value les cost to sell andvalue in use. In determining the present value of estimated future cash flows expected to begenerated from the continued use of the assets, the Group is required to make estimates andassumptions that may affect investment in an associate, investments in project development costs,investment properties, property and equipment and system development cost.
The fair value less costs to sell calculation is based on available data from binding salestransactions in an arm’s length transaction of similar assets or observable market prices lessincremental costs for disposing of the asset. The value in use calculation is based on a discountedcash flow model. The cash flows are derived from the budget for the next five years and do notinclude restructuring activities that the Group is not yet committed to or significant futureinvestments that will enhance the asset’s performance of the cash generating unit being tested.The recoverable amount is most sensitive to the discount rate used for the discounted cash flowmodel as well as the expected future cash inflows and the growth rate used for extrapolationpurposes.
Based on management assessment as of December 31, 2016, 2015 and 2014, no indicators ofimpairment exist for investment in associate, investments in project development costs and a jointventure, investment properties, property and equipment, and systems development costs.
The aggregate carrying values of investment properties, property and equipment, investmentsand advances in project development costs, system development costs and goodwill amounted toP=36,290.06 million and P=30,499.71 million as of December 31, 2016 and 2015, respectively(Notes 14, 15, 16 and 17).
Estimating useful lives of investment propertiesThe Group estimates the useful lives of investment properties based on the period over which theassets are expected to be available for use. The EUL of investment properties is reviewed at leastannually and is updated if expectations differ from previous estimates due to physical wear andtear and technical or commercial obsolescence on the use of these investment properties. It is

- 33 -
*SGVFS021624*
possible that future results of operations could be materially affected by changes in these estimatesbrought about by changes in factors mentioned above.
The carrying value of investment properties amounted to P=32,065.53 million andP=26,676.32 million as of December 31, 2016 and 2015, respectively (Note 14).
Fair value of financial instrumentsWhere the fair values of financial assets and financial liabilities recorded in the consolidatedstatement of financial position cannot be derived from active markets, they are determined usinginternal valuation techniques using generally accepted market valuation models. The inputs tothese models are taken from observable markets where possible, but where this is not feasibleestimates are used in establishing fair values. These estimates may include considerations ofliquidity, volatility, and correlation. Certain financial assets and liabilities were initially recordedat its fair value by using the discounted cash flow methodology. See Note 32 to the consolidatedfinancial statements for the related balances.
6. Segment Information
For management purposes, the Group’s operating segments are organized and managed separatelyaccording to the nature of the products provided, with each segment representing a strategicbusiness unit that offers different products and serves different markets. The Group has threereportable operating segments as follows:
Horizontal ProjectsThis segment pertains to the housing market segment of the Group. It caters on the developmentand sale of residential lots and units.
Vertical ProjectsThis segment caters on the development and sale of residential high-rise condominium projectsacross the Philippines. Vertical home projects involve dealing with longer gestation periods andhas requirements that are different from those of horizontal homes.
Commercial and othersThis segment pertains to the development, leasing and management of shopping malls andcommercial centers all over the Philippines. It also includes activities from holding companiesand others. This includes the financial information of Starmalls Group as a leasing entity.
Management monitors the operating results of its business units separately for the purpose ofmaking decisions about resource allocation and performance assessment. Segment performance isevaluated based on segment operating income or loss before income tax and earnings beforeincome tax, depreciation and amortization (EBITDA). Segment operating income or loss beforeincome tax is based on the same accounting policies as consolidated operating income or loss. Nooperating segments have been aggregated to form the above reportable operating businesssegments. The chief operating decision-maker (CODM) has been identified as the chief executiveofficer. The CODM reviews the Group’s internal reports in order to assess performance of theGroup.

- 34 -
*SGVFS021624*
Transfer prices between operating segments are on an arm’s length basis in a manner similar totransactions with third parties.
The amount of segment assets and liabilities are based on the measurement principles that aresimilar with those used in measuring the assets and liabilities in the consolidated statements offinancial position which is in accordance with PFRS. The segment assets are presented separatelyfrom the receivables from related parties, AFS financial assets, HTM investments and deferredtaxes. Segment liabilities are presented separately from the payables to related parties anddeferred tax liabilities.
The financial information about the operations of these business segments is summarized below:
December 31, 2016
Horizontal VerticalCommercial
and OthersIntersegmentAdjustments Consolidated
(Amounts in thousands)Real estate revenue P=21,218,234 P=3,806,975 P=– P=– P=25,025,209Rental income 4,432,991 (57,665) 4,375,326Miscellaneous income (Note 25) 742,807 147,574 120,868 (58,741) 952,508
21,961,041 3,954,549 4,553,859 (116,406) 30,353,043Costs and operating expenses* 14,548,731 2,947,945 1,481,222 (92,373) 18,885,525Segment income (loss) before income tax 7,412,310 1,006,604 3,072,637 (24,033) 11,467,518Interest income (Note 24) 1,460,035 35,697 11,286 1,507,018Others (Notes 9, 16, 21 and 27) 3,052,113 (3,077,799) (25,686)EBITDA 11,924,458 1,042,301 3,083,923 (3,101,832) 12,948,850Interest and other financing charges (Note 24) (2,715,089) (222,901) (298,276) 1,000,000 (2,236,266)Depreciation and amortization (Notes 14, 15, 17
and 26)(222,185) (34,513) (773,282) (1,029,980)
Income before income tax 8,987,184 784,887 2,012,365 (2,101,832) 9,682,604Provision for income tax (Note 29) 932,733 (55,373) 704,875 1,582,235Net income P=8,054,451 P=840,260 P=1,307,490 (P=2,101,832) P=8,100,369Other InformationSegment assets P=58,039,357 P=6,275,771 P=31,912,438 P=45,090,158 P=141,317,724Receivables from related parties (Notes 30 and 33) 8,148,875 (4,565,888) 333,682 3,916,669AFS financial assets (Note 9) 11,968,496 (3,723,431) 8,245,065HTM investments (Note 9) 20,851,608 20,851,608Deferred tax assets - net (Note 29) 437,179 437,179Total Assets P=66,188,232 P=1,709,883 P=65,503,403 P=41,366,727 P=174,768,245Segment liabilities P=88,733,513 (P=6,231,300) P=13,702,551 P=2,532 P=96,207,296Deferred tax liabilities - net (Note 29) 1,552,865 24,281 843,589 (355,093) 2,065,642Total Liabilities P=90,286,378 (P=6,207,019) P=14,546,140 (P=352,561) P=98,272,938Capital expenditures** P=20,106,300 P=3,388,000 P=7,429,020 P= P=30,923,320Depreciation and amortization (Notes 14, 15, 17
and 26) 222,185 34,513 773,282 1,029,980Provision for impairment losses (Note 26) 1,974 1,974*Cost and expenses include costs of real estate sales and operating expenses less depreciation and amortization amounting P=1,029.98 million (Note 26).**Capital expenditures is inclusive of the amounts of construction/development costs.

- 35 -
*SGVFS021624*
December 31, 2015
Horizontal VerticalCommercial
and OthersIntersegmentAdjustments Consolidated
(Amounts in Thousands)Real estate revenue P=20,156,987 P=4,345,165 P=– P=– P=24,502,152Rental income – 2,410,194 (42,309) 2,367,885Miscellaneous income (Note 25) 334,922 125,862 828,605 (20,801) 1,268,588
20,491,909 4,471,027 3,238,799 (63,110) 28,138,625Costs and operating expenses* 13,007,272 3,370,012 1,992,357 136,903 18,506,544Segment income (loss) before income tax 7,484,637 1,101,015 1,246,442 (200,013) 9,632,081Interest income (Note 24) 683,143 30,355 589,768 – 1,303,266Others (Notes 9, 16, 21 and 27) 194,205 – 5,743,291 (5,944,513) (7,017)EBITDA 8,361,985 1,131,370 7,579,501 (6,144,526) 10,928,330Interest and other financing charges (Note 24) (156,103) (179,005) (3,118,895) 1,512,595 (1,941,408)Depreciation and amortization (Notes 14, 15, 17 and 26) (222,441) (76,619) (499,860) (798,920)Income before income tax 7,983,441 875,746 3,960,746 (4,631,931) 8,188,002Provision for income tax (Note 29) 913,068 30,593 412,431 (355,093) 1,000,999Net income P=7,070,373 P=845,153 P=3,548,315 (P=4,276,838) P=7,187,003Other InformationSegment assets P=69,338,387 P=14,241,712 P=127,804,018 (P=83,105,640) P=128,278,477Receivables from related parties (Notes 30 and 33) 21,249,133 (4,011,665) (13,813,881) 2,163 3,425,750AFS financial assets (Note 9) (3,803,394) – 7,245,756 3,936,605 7,378,967HTM investments (Note 9) – – 13,521,560 – 13,521,560Deferred tax assets - net (Note 29) – – 290,024 – 290,024Total Assets P=86,784,126 P=10,230,047 P=135,047,477 (P=79,166,872) P=152,894,778Segment liabilities P=41,839,502 (P=3,370,613) P=43,592,930 (P=669,298) P=81,392,521Deferred tax liabilities - net (Note 29) 1,507,071 321,459 39,314 (330,677) 1,537,167Total Liabilities P=43,346,573 P=(3,049,154) P=43,632,244 (P=(999,975) P=82,929,688Capital expenditures** P=20,654,000 P=4,506,000 P=6,339,583 P=– P=31,499,583Depreciation and amortization (Notes 14, 15, 17 and 26) 222,441 76,619 499,860 – 798,920Provision for impairment losses (Note 26) – – 50,545 – 50,545*Cost and expenses include costs of real estate sales and operating expenses less depreciation and amortization amounting P=798.92 million (Note 26).**Capital expenditures is inclusive of the amounts of construction/development costs.
December 31, 2014
Horizontal VerticalCommercial
and OthersIntersegmentAdjustments Consolidated
(Amounts in Thousands)Real estate revenue P=18,315,172 P= 4,089,990 P=– (P=84,447) P=22,320,715Rental income 1,567,760 1,567,760Miscellaneous income (Note 25) 320,317 116,823 570,276 (17,118) 990,298
18,635,489 4,206,813 2,138,036 (101,565) 24,878,773Costs and operating expenses* 12,913,531 3,128,766 1,000,878 (147,078) 16,896,097Segment income (loss) before income tax 5,721,958 1,078,047 1,137,158 45,513 7,982,676Interest income (Note 24) 750,857 37,630 411,842 (663) 1,199,666Others (Notes 9, 16, 21 and 27) (549,295) – 2,989,839 (2,469,830) (29,286)EBITDA 5,923,520 1,115,677 4,538,839 (2,424,980) 9,153,056Interest and other financing charges (Note 24) 1,116,554 (153,885) (2,366,090) 381 (1,403,040)Depreciation and amortization (Notes 14, 15, 17 and 26) (198,295) (68,878) (454,967) – (722,140)Income before income tax 6,841,779 892,914 1,717,782 (2,424,599) 7,027,876Provision for income tax (Note 29) 483,176 78,626 176,630 (1) 741,431Net income P=6,358,603 P=814,288 P=1,541,152 (P=2,424,598) P=6,286,445Other InformationSegment assets 54,960,107 13,868,186 48,797,381 (13,827,453) P=103,798,221Receivables from related parties (Notes 30 and 33) (13,608,589) (3,665,144) 21,707,371 (754,628) 3,679,010AFS financial assets (Note 9) 41,499 – 6,979,346 – 7,020,845HTM investments (Note 9) – – 10,232,588 – 10,232,588Deferred tax assets - net (Note 29) 256,863 – – 256,863Total Assets P=41,649,880 P=10,203,042 P=87,716,686 (P=14,582,081) P=124,987,527Segment liabilities P=9,766,947 P=4,619,757 P=44,333,667 P=433,030 P=59,153,401Deferred tax liabilities - net (Note 29) 1,108,167 382,658 124,473 – 1,615,298Total Liabilities P=10,875,114 P=5,002,415 P=44,458,140 P=433,030 P=60,768,699Capital expenditures** P=18,197,000 P=2,935,000 P=3,667 P=– P=21,135,667Depreciation and amortization (Notes 14, 15, 17 and 26) 198,295 68,878 454,967 – 722,140Provision for impairment losses (Note 26) 5,394 – – – 5,394*Cost and expenses include costs of real estate sales and operating expenses less depreciation and amortization amounting P=722.14 million (Note 26).**Capital expenditures is inclusive of the amounts of construction/development costs.

- 36 -
*SGVFS021624*
No operating segments have been aggregated to form the above reportable segments.
Capital expenditure consists of construction costs, land acquisition and land development costs.
The Group has no revenue from transactions with a single external customer amounting 10% ormore of the Group’s revenue.
7. Business Combinations
Acquisition of Starmalls GroupStarmalls, Inc. was incorporated in the Philippines and duly registered with the SEC onOctober 16, 1969, originally to pursue mineral exploration. After obtaining SEC approval,Starmalls, Inc. later changed its primary business and is now presently engaged in holdinginvestments in shares of stock and real estate business. Prior to the acquisition of VLLI,Starmalls, Inc. is 30.5% owned by Fine Properties, Inc. and 69.5% owned by PCD NomineeCorporation and other entities and individuals. The shares of stock of Starmalls, Inc. are listed atthe PSE.
Starmalls Group is a major developer, owner and operator of retail malls that target mass marketretail consumers in the Philippines. It also develops and operates BPO commercial centers. As ofDecember 31, 2016, Starmalls Group, through its subsidiaries, owned and operated 11 retail mallsin key cities and municipalities in the Philippines and three BPO commercial centers in MetroManila.
On November 10, 2015, VLLI signed an agreement with the existing shareholders of StarmallsGroup and acquired approximately 88.34% or 7,443.19 million shares of the outstanding capitalstock of Starmalls, Inc. for a total consideration of P=33,537.36 million. Starmalls, Inc. hassubsidiaries namely Manuela Corporation and Masterpiece Asia Properties, Inc. with thefollowing percentages of ownership:
Masterpiece Asia Properties, Inc. (MAPI) 100.0%Manuela Corporation (Manuela) 98.4%
Upon execution of the agreement, VLLI paid P=2,681.25 million to the Fine Group. As a conditionto the acquisition of Starmalls Group, Fine Group invested the 97.5% of the total considerationfrom the disposal or P=32,698.93 million representing 4,573.28 million shares of VLLI at P=7.15 pershare. The shares were issued out of VLLI’s increase in its authorized capital stock which wasapplied and approved by the SEC on November 11, 2015.
Starmalls, Inc. and its subsidiaries became subsidiaries of VLLI as at December 31, 2015.
Both VLLI and Starmalls Group are entities under common control of Fine Group. Accordingly,VLLI accounted for the acquisition of Starmalls Group under the pooling-of-interest method ofaccounting.

- 37 -
*SGVFS021624*
Under the pooling-of-interest method, VLLI accounted the acquisition as follows:
Assets and liabilities reflected as at reporting date is the combined assets and liabilities ofStarmalls Group and Vista Group using their existing historical carrying values prior to theacquisition;
Retained earnings reflects the accumulated earnings of Vista Group and the earnings ofStarmalls Group as if the entities had always been combined;
Capital stock represents the legal capital of VLLI; The difference between the consideration for the acquisition and the legal capital of Starmalls
that amounted to P=22,859.08 million is accounted for as “equity reserve” which waseventually closed to additional paid-in capital.
Below presents the condensed consolidated assets and liabilities of Starmalls Group at their bookvalues as of and for the year ended December 31, 2014 that was pooled to the VLLI consolidatedstatement of financial position.
(In thousands)Cash and cash equivalents P=1,571,505Trade and non-trade receivables 5,114,830Available for sale financial assets 343,861Prepayments and other assets 461,934Investment properties, property and equipment
and land 10,923,794Total Assets 18,415,924
Trade and other payables 1,139,830Bank loans 4,899,151
Other liabilities 398,363Total liabilities 6,437,344Paid-up Capital 10,900,830Treasury stock (1,578,228)
Other comprehensive income 2,001Retained earnings 2,518,184
Non-controlling interest 135,793Total Equity 11,978,580Total Liabilities and Equity P=18,415,924
The related condensed statement of income for the year ended December 31, 2014 that was pooledto the VLLI consolidated statement of income follows:
(In thousands)Rental income P=1,415,741Others 513,682
1,929,423Depreciation 427,197Other costs and expenses 753,114
1,180,311Income before tax 749,112Provision for income tax 172,228Income after tax P=576,884
As a result of the acquisition, the accounting policies of Starmalls Group have been realigned toVista Group. Accordingly, the fair values previously recognized on the Property and equipmentitems and Investment Properties of the Starmalls Group have been adjusted under the pooling-of-

- 38 -
*SGVFS021624*
interest method and recognized back to cost. The related effects of the change in the assets andretained earnings accounts amounted to P=8,993.29 million as of and for the year endedDecember 31, 2014. Also, net income for the year ended December 31, 2014 was adjusted to theextent of the depreciation on these assets and this amounted to P=220.12 million in 2014.
The consolidated financial statements as of and for the year ended December 31, 2014 have beenrestated to include the accounts of Starmalls Group as if the entities had always been combined.Accordingly, as of January 1, 2014, the VLLI common shares issued to Fine Group have beenrecognized as deposit for future stock subscription in the statement of changes in equity.
The 752.21 million VLLI shares in the amount of P=5,378.29 million issued to Manuela which itheld as of December 31, 2015 have been presented as treasury shares in the statement of financialposition and statement of changes in equity as of and for the years ended December 31, 2015.Manuela still holds the VLLI shares as of December 31, 2016.
Acquisition of Malay Resorts Holdings, Inc.On December 29, 2015, Vista Leisure Club Corporation (a subsidiary of Vista Residences, Inc.)acquired 100% ownership of Malay Resorts Holdings, Inc. (Malay Resorts) for a total cashconsideration of P=157.00 million. Malay Resorts owns and operates the Boracay Sands Hotel.Malay Resorts is not under common control. Accordingly, the Group accounted the businesscombination under the acquisition method.
Below is a summary of the fair values of assets acquired and liabilities assumed as of date ofacquisition:
AssetsCash and cash equivalents P=12,825,797Trade receivables 3,443,198Property and equipment 166,829,102Other assets 2,580,316
185,678,413LiabilitiesAccounts and other payables 31,693,123Payable to related parties 119,841,731Deferred tax liabilities - net 24,415,579
175,950,433Net assets 9,727,980Goodwill 147,272,020Acquisition cost P=157,000,000
As no material adjustments have been identified on the provisional values of assets acquired andliabilities assumed, the goodwill amounting P=147.27 million that was provisionally determined in2015 did not change in 2016.
The cost of acquisition is determined as follows:
Cash paid P=157,000,000Fair value of equity interest in Malay Resorts held before business
combinationP=157,000,000

- 39 -
*SGVFS021624*
Cash on acquisition follows:
Cash paid P=157,000,000Cash acquired from Malay Resorts 12,825,797Net cash outflow P=144,174,203
From the date of acquisition on December 29, 2015, the Group’s share in the revenue and net lossof Malay Resorts amounted to nil. If the combination had taken place at the beginning of 2015,the Group’s share in the revenue and net loss of Malay Resorts would have been P=22.27 millionand P=6.39 million, respectively.
8. Cash and Cash Equivalents
This account consists of:
2016 2015Cash on hand P=22,563,506 P=24,794,371Cash in banks 5,676,944,237 5,238,640,190Cash equivalents 3,203,030,195 779,621,875
P=8,902,537,938 P=6,043,056,436
Cash in banks earns interest at the prevailing bank deposit rates. Cash equivalents are short-term,highly liquid investments that are made for varying periods of up to three (3) months dependingon the immediate cash requirements of the Group and earn interest as follows:
2016 2015 2014Philippine Peso 0.10% to 5.00% 1.00% to 2.00% 0.25% to 4.00%US Dollar 0.13% to 3.00% 1.38% to 2.00% 0.25% to 1.25%
Interest earned from cash in banks and cash equivalents for the years ended December 31, 2016,2015 and 2014 amounted to P=141.14 million, P=69.34 million and P=32.30 million, respectively(Note 24).
No cash and cash equivalents are used to secure the obligations of the Group.
9. Investments
Short-term cash investmentsShort-term cash investments consist of money market placements with maturities of more thanthree months up to one year and earn annual interest at the respective short-term investment rates,as follows:
2016 2015 2014Philippine Peso 1.38% to 2.50% 3.50% to 5.00% 1.50% to 5.00%US Dollar 0.50% 0.50% to 3.75% 1.75% to 3.75%
As of December 31, 2016 and 2015, short term cash investments amounted to P=100.00 million andP=2,097.30 million, respectively.

- 40 -
*SGVFS021624*
On February 29, 2016, the Group terminated short term cash investments amounting$40.00 million (P=1,946.21 million). The net cash proceeds from the termination amounted toP=1,910.84 million. The US dollar denominated short-term cash investments amounted to nil andUS$40.00 million (P=1,899.51 million) as of December 31, 2016 and 2015, respectively.
Interest earned from short-term and long-term investments for the years endedDecember 31, 2016, 2015 and 2014 amounted to P=2.21 million, P=41.13 million and P=164.57million, respectively (Note 24).
AFS financial assetsThis account consists of equity and debt securities as follow:
2016 2015Equity securities
Quoted P=69,588,143 P=74,961,985Unquoted 96,248,934 96,248,934
Debt securitiesQuoted 8,079,227,776 7,207,755,740
P=8,245,064,853 P=7,378,966,659
Quoted equity and debt securitiesThis account consists of investments in fixed maturity bond funds and equity shares. As ofDecember 31, 2016 and 2015, the investments have an aggregate fair value of P=8,148.82 millionand P=7,282.72 million. The excess of fair value over costs as of December 31, 2016 and 2015amounted to P=942.11 and P=462.74 million, respectively. This is shown under “Othercomprehensive income” account in the equity section in the consolidated statements of financialposition. The year on year movement in the market values of AFS investments are shown as partof “Changes in fair value of AFS financial assets” in the consolidated statement of comprehensiveincome.
The movements in the unrealized gain (losses) for the years ended December 31, 2016, 2015 and2014 follows:
2016 2015 2014Balance at beginning of year P=462,742,703 (P=109,527,323) (P=58,834,635)Changes in fair value of quoted
AFS financial assetsEquity securities 5,373,842 16,735,567Debt securities 473,996,831 572,270,026 (112,847,041)
Fair value gain on AFS financialasset reclassified to profit orloss 45,418,786
Balance at end of year P=942,113,376 P=462,742,703 (P=109,527,323)
In 2016 and 2015, there were no disposals of AFS financial assets that resulted to gain or loss. In2014, disposals of AFS financial assets resulted to gain amounting P=45.42 million which wastransferred from the cumulative changes in fair value of AFS financial assets to the profit or lossin 2014.

- 41 -
*SGVFS021624*
The cost of the AFS financial assets under debt securities as of December 31, 2016 and 2015amounted to P=8,079.23 million and P=7,207.76 million, respectively.
Details on the quoted debt securities follow:
2016 2015Balance at beginning of year P=7,207,755,740 P=6,635,485,714Acquisition during the year 397,475,205
7,605,230,945 6,635,485,714Changes in fair value of AFS during the year 473,996,831 572,270,026
P=8,079,227,776 P=7,207,755,740
The investments in fixed maturity bond funds are maturing in June 2017 and December 2018.
Unquoted equity securitiesThis account pertains to unlisted preferred shares in a public utility company which the Group willcontinue to carry as part of the infrastructure that it provides for its real estate developmentprojects and other operations. These are carried at cost less impairment, if any.
The rollforward in this account follows:
2016 2015Balance at beginning of year P=96,248,934 P=44,703,353Acquisitions during the year 51,545,581Balance at end of year P=96,248,934 P=96,248,934
HTM investmentsThis account consists of the Group’s investments in various US dollar-denominated debt securitieswith annual interest rates ranging from 1.63% to 11.00%. Interest income from HTM investmentsamounted to P=721.02 million, P=482.51 million and P=244.14 million in 2016, 2015 and 2014,respectively (Note 24).
In 2016 and 2015, no impairment losses were recognized on these investments.
The following presents the breakdown of debt securities classified as HTM investments bycontractual maturity dates as of December 31, 2016 and 2015.
2016 2015Due in one (1) year or less P=1,709,730,739 P=–Due after 1 year through five (5) years 19,141,877,715 13,521,560,251Balance at end of year P=20,851,608,454 P=13,521,560,251
In 2016 and 2015, the Group acquired additional HTM investments amounting US$162.93 millionand US$62.75 million with EIR of 4%.

- 42 -
*SGVFS021624*
HTM investments amounting $321.50 million and $305.00 million are used to secure the bankloans of the Parent Company amounting P=13,551.25 million and P=12,200.00 million as ofDecember 31, 2016 and 2015, respectively. The fair values of the investments used as collateralamounted to P=15,984.98 million and P=14,353.30 million as of December 31, 2016 and 2015,respectively (Note 20).
10. Receivables
This account consists of:
2016 2015Installment contracts receivable at
amortized cost (Note 20) P=28,123,412,383 P=26,430,215,542Accrued interest receivable 250,598,211 164,513,965Accounts receivable at amortized cost:
Tenants 3,678,408,992 1,539,408,649Contractors 3,053,343,074 3,767,663,294Private company 516,783,255 507,262,275Buyers 393,680,822 517,675,602Brokers 245,038,144 205,757,420Others 1,673,749,316 1,514,268,763
37,935,014,197 34,646,765,510Less allowance for impairment losses 393,343,094 392,304,389
37,541,671,103 34,254,461,121Less noncurrent portion at amortized cost 9,212,259,033 9,286,067,234
P=28,329,412,070 P=24,968,393,887
Installment contracts receivable at amortized costInstallment contracts receivable consist of accounts collectible in equal monthly installments withvarious terms up to a maximum of 15 years. These are carried at amortized cost. Thecorresponding titles to the subdivision or condominium units sold under this arrangement aretransferred to the buyers only upon full payment of the contract price. The installment contractsreceivable are interest-bearing except for those with installment terms within two years. Annualinterest rates on installment contracts receivables range from 17.00% to 19.00%. Total interestincome recognized amounted to P=642.64 million, P=710.28 million and P=760.65 million in 2016,2015 and 2014, respectively (Note 24).
Accrued interest receivableAccrued interest receivable arise from the Debt AFS and HTM of the Parent and VII amounted toP=250.60 million and P=164.51 million as of December 31, 2016 and 2015, respectively.
Accounts Receivable at amortized costThe accounts receivables at amortized cost are non-interest bearing and collectible within oneyear. This consists of the following:
Receivable from tenantsReceivable from tenants pertain to billings related to the rental operations of the Group.

- 43 -
*SGVFS021624*
Receivable from contractorsReceivable from contractors are recouped from settlement of progress billings which occur withinone year from the date the receivables arose.
Receivable from buyersReceivables from buyers represent the share of the joint venture partners from the proceeds of realestate sale. The arrangement is covered by a marketing agreement that is separate and distinctfrom Land Development Agreements (LDA). These sales do not form part of the Group'srevenue. Collections from buyers are remitted to the joint venture partners net of any marketingfees agreed by the parties.
Receivable from brokersReceivable from brokers are recouped from progress billing settlement.
OthersOther receivables consist mainly of receivables from various individuals and private entities andother nontrade receivables. These are non-interest bearing and are due and demandable.
Receivables amounting P=393.43 million and P=392.30 million as of December 31, 2016 and 2015,respectively, are provided with impairment losses as follow:
InstallmentContracts
ReceivableAccounts
Receivable TotalAt December 31, 2014 P=137,053,344 P=210,100,871 P=347,154,215Provision for the year (Note 26) – 61,913,264 61,913,264Write-off (16,763,090) – (16,763,090)At December 31, 2015 120,290,254 272,014,135 392,304,389Provision for the year (Note 26) 1,974,771 1,974,771Write-off (936,066) (936,066)At December 31, 2016 P=120,290,254 P=273,052,840 P=393,343,094
The impairment losses above pertain to individually impaired accounts. No impairment lossesresulted from performing collective impairment test.
In 2016 and 2015 installment contracts receivables with a total nominal amount ofP=1,622.28 million and P=2,971.39 million, respectively, were recorded at amortized cost amountingP=1,579.38 million and P=2,933.11 million, respectively. These are installment contracts receivablesthat are to be collected in two years which are noninterest-bearing. The fair value upon initialrecognition is derived using discounted cash flow model using the discount rates ranging from1.57% to 3.79% for those recognized in 2016 and 1.20% to 5.80% for those recognized in 2015.Interest income recognized from these receivables amounted to P=33.56 million, P=37.94 million,and P=32.31 million in 2016, 2015 and 2014, respectively (Note 24). The unamortized discountamounted to P=42.90 million and P=38.28 million as of December 31, 2016 and 2015, respectively.

- 44 -
*SGVFS021624*
Rollforward in unamortized discount arising from noninterest-bearing receivables is as follows:
2016 2015Balance at beginning of year P=38,281,459 P=32,034,487Additions 38,177,053 44,189,376Accretion (Note 24) (33,562,135) (37,942,404)Balance at end of year P=42,896,377 P=38,281,459
In 2016 and 2015, the Group entered into various purchase agreements with financial institutionswhereby the Group sold its installment contracts receivables on a with recourse basis. Thepurchase agreements provide substitution of contracts that became in default. The Group stillretains the sold receivables in the installment contracts receivables account and records theproceeds from these sales as loans payable (Note 20). The carrying value of installment contractsreceivables sold and the corresponding loans payable amounted to P=2,786.09 million andP=2,791.12 million as of December 31, 2016. As of December 31, 2015, the carrying value ofinstallment contracts receivables sold and the corresponding loans payable amounted toP=3,052.66 million and P=3,003.54 million, respectively. Receivables on a with recourse basis areused as collateral to secure the corresponding loans payables obtained.
11. Real Estate Inventories
Rollforward of the account follows:
2016 2015Balance at beginning of year P=22,855,688,651 P=17,926,024,166Construction/development costs incurred 8,894,337,775 8,961,353,466Land costs transferred from land and improvements
(Note 13) 1,652,120,088 4,056,799,427Land acquired during the year 433,919,689 2,519,233,798Borrowing costs capitalized (Note 24) 1,439,592,235 1,646,167,425Cost of real estate sales (Note 26) (12,320,996,040) (12,253,889,631)
P=22,954,662,398 P=22,855,688,651
The real estate inventories are carried at cost. No inventories are recorded at amounts lower thancost in 2016 and 2015.
This account consists of:
2016 2015Subdivision land for sale and development P=26,397,818,296 P=23,620,781,681Less reserve for land development costs 9,441,025,424 7,242,443,575
16,956,792,872 16,378,338,106Condominium units for sale and development 4,928,409,728 5,173,097,242Residential house units for sale and development 1,069,459,798 1,304,253,303
5,997,869,526 6,477,350,545P=22,954,662,398 P=22,855,688,651

- 45 -
*SGVFS021624*
Subdivision land for sale and development represents real estate subdivision projects in which theGroup has been granted license to sell by the Housing and Land Use Regulatory Board of thePhilippines. It also includes raw land inventories that are under development and those that areabout to undergo development.
Real estate inventories recognized as cost of sales amounted to P=12,321.00 million in 2016,P=12,253.89 million in 2015 and P=11,032.28 million in 2014, and are included as cost of real estatesales in the consolidated statements of comprehensive income (Note 26). Cost of real estate salesincludes acquisition cost of subdivision land, amount paid to contractors, development costs,capitalized borrowing costs and other costs attributable to bringing the real estate inventories to itsintended condition.
Construction and development costs represent approximately 75.00% to 85.00% of the cost ofsales.
Borrowing cost capitalized in 2016, 2015 and 2014 amounted to P=1,439.59 million,P=1,646.17 million and P=1,381.83 million, respectively (Note 24). The capitalization rate used todetermine the borrowing costs eligible for capitalization is 6.47% in 2016, 12.24% in 2015 and9.71% in 2014.
Except as stated, there are no other real estate inventories used as collateral or pledged as securityto secure the borrowings of the Group (Note 20).
12. Other Current Assets
This account consists of:
2016 2015Input VAT P=1,515,109,110 P=1,532,485,446Prepaid expenses 1,237,047,665 1,051,203,303Creditable withholding taxes 713,937,469 894,264,046Construction materials and others 326,774,056 331,863,769Deposits for real estate purchases and others 14,473,653 4,819,403
P=3,807,341,953 P=3,814,635,967
The input VAT is applied against output VAT. The remaining balance is recoverable in futureperiods.
Prepaid expenses mainly include prepayments for marketing fees, taxes and licenses, rentals andinsurance.
The Group will be able to apply the creditable withholding taxes against income tax payable. Asof December 31, 2016 and 2015, the Group applied creditable withholding taxes amountingP=962.87 million and P=738.82 million, respectively.
Construction materials pertain to supplies used in the constructions and developments.
Deposits for real estate purchases substantially represent the Group’s payments to real estateproperty owners for the acquisition of certain real estate properties. Although the terms of theagreements provided that the deeds of absolute sale for the subject properties are to be executedonly upon fulfillment by both parties of certain undertakings and conditions, including the
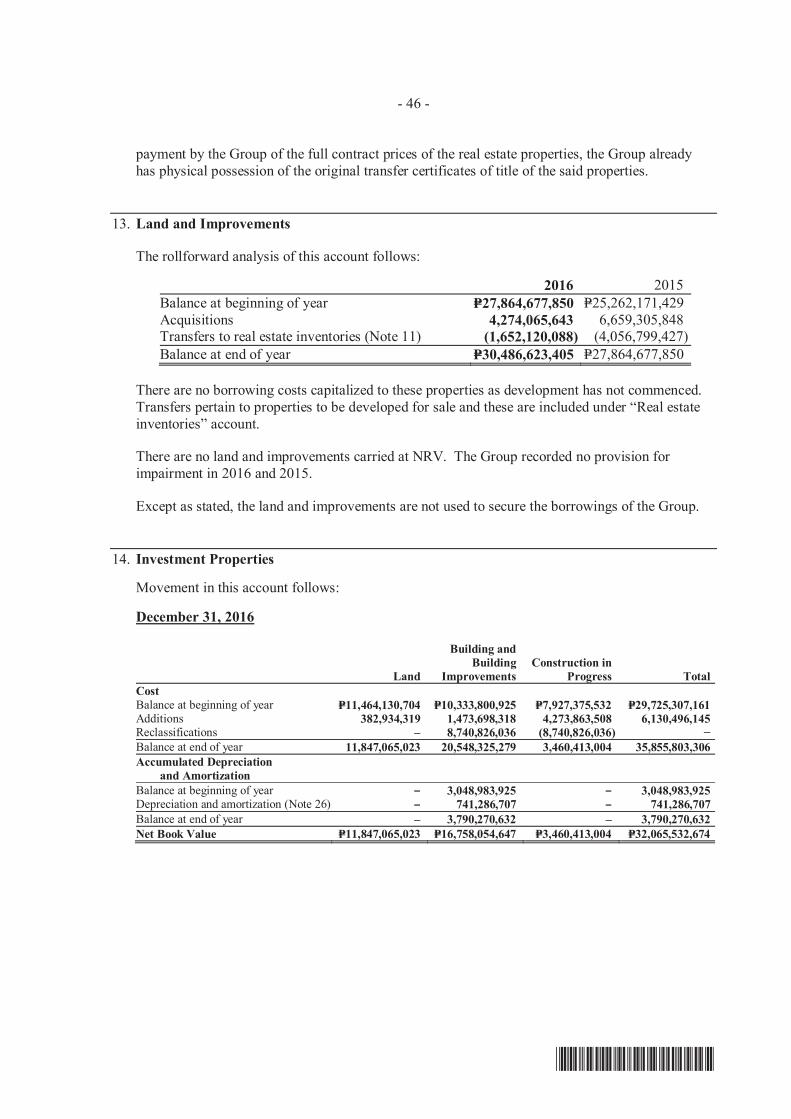
- 46 -
*SGVFS021624*
payment by the Group of the full contract prices of the real estate properties, the Group alreadyhas physical possession of the original transfer certificates of title of the said properties.
13. Land and Improvements
The rollforward analysis of this account follows:
2016 2015Balance at beginning of year P=27,864,677,850 P=25,262,171,429Acquisitions 4,274,065,643 6,659,305,848Transfers to real estate inventories (Note 11) (1,652,120,088) (4,056,799,427)Balance at end of year P=30,486,623,405 P=27,864,677,850
There are no borrowing costs capitalized to these properties as development has not commenced.Transfers pertain to properties to be developed for sale and these are included under “Real estateinventories” account.
There are no land and improvements carried at NRV. The Group recorded no provision forimpairment in 2016 and 2015.
Except as stated, the land and improvements are not used to secure the borrowings of the Group.
14. Investment Properties
Movement in this account follows:
December 31, 2016
Land
Building andBuilding
ImprovementsConstruction in
Progress TotalCostBalance at beginning of year P=11,464,130,704 P=10,333,800,925 P=7,927,375,532 P=29,725,307,161Additions 382,934,319 1,473,698,318 4,273,863,508 6,130,496,145Reclassifications 8,740,826,036 (8,740,826,036)Balance at end of year 11,847,065,023 20,548,325,279 3,460,413,004 35,855,803,306Accumulated Depreciation
and AmortizationBalance at beginning of year 3,048,983,925 3,048,983,925Depreciation and amortization (Note 26) 741,286,707 741,286,707Balance at end of year – 3,790,270,632 – 3,790,270,632Net Book Value P=11,847,065,023 P=16,758,054,647 P=3,460,413,004 P=32,065,532,674

- 47 -
*SGVFS021624*
December 31, 2015
Land
Building andBuilding
ImprovementsConstruction in
Progress TotalCostBalance at beginning of year P=8,383,819,304 P=8,370,773,726 P=2,013,711,623 P=18,768,304,653Transfers (to) from:
Property and equipment (Note 15) 62,717,658 62,717,658 Additions 3,080,311,400 794,334,830 7,019,638,620 10,894,284,850 Reclassifications 1,105,974,711 (1,105,974,711)Balance at end of year 11,464,130,704 10,333,800,925 7,927,375,532 29,725,307,161Accumulated Depreciation
and AmortizationBalance at beginning of year 2,456,329,924 P=2,456,329,924Depreciation and amortization (Note 26) 592,654,001 592,654,001Balance at end of year – 3,048,983,925 – 3,048,983,925Net Book Value P=11,464,130,704 P=7,284,817,000 P=7,927,375,532 P=26,676,323,236
The investment properties consist mainly of land and commercial centers that are held to earnrental income. These include Vista Malls and Starmalls that are located in key cities andmunicipalities in the Philippines and three BPO commercial centers in Metro Manila, with acombined gross floor area of 882,009 sq.m. The construction in progress represents capitalizedcosts arising from construction of commercial centers that are located in Molino and Kawit,Cavite. The percentage of completion of various constructions in progress ranges from 4% to90% in 2016 and from 40% to 98% in 2015 and are due to be completed on various dates startingJuly 2014 up to June 2018.
The reclassification of P=8,740.83 million in 2016 from construction in progress to building andimprovements represent completed BPO commercial center in Las Pinas and retail malls in SanJose del Monte, Molino, Imus, Sta. Rosa and Bataan with gross floor area of 265,730 sq. m. Theremaining P=3,460.41 million under the construction in progress account represents ongoingdevelopment in Taguig, Molino and Kawit, Cavite.
Rental income earned from investment properties amounted to P=4,375.33 million,P=2,367.88 million and P=1,567.76 million in 2016, 2015 and 2014, respectively (Note 25). Repairsand maintenance costs recognized under “operating expenses” arising from investment propertiesamounted to P=107.12 million, P=279.59 million and P=231.46 million for the years endedDecember 31, 2016, 2015 and 2014, respectively (Note 26). Cost of property operationsamounted to P=1,874.25 million, P=996.96 million and P=904.76 million for the years endedDecember 31, 2016, 2015 and 2014. For the terms and conditions on the lease, refer to Note 34.
Except as stated, there are no other investment properties used as collateral or pledged as securityto secure the borrowings of the Group (Note 20).
The Group has no restrictions on the realizability of its investment properties and no contractualobligations to either purchase or construct or develop investment properties or for repairs,maintenance and enhancements.
Building and improvements that are intended to be developed for commercial and retail purposesthat are made available for lease were transferred to investment property in 2016 and 2015 andthese amounted to nil and P=62.72 million, respectively, (Note 15). .

- 48 -
*SGVFS021624*
The fair value of the land amounted to P=28,344.29 million and P=28,258.46 million as ofDecember 31, 2016 and 2015, respectively. This is based on the most recent selling price ofsimilar property. The parcels of land are located in cities and municipalities like Mandaluyong,Las Pinas, Taguig, Naga, Imus, San Jose del Monte, Sta. Rosa, Alabang and Kawit.
As of December 31, 2016 and 2015, the aggregate fair values of investment properties amountedto P=51,801.83 million and P=45,023.81 million, respectively. Fair value is the price that would bereceived to sell an asset in an orderly transaction between market participants at the measurementdate.
The firms that conducted the appraisal of the investment properties are SEC accredited.
The valuation techniques adopted for the measurement of fair values are the market approach forthe land and cost approach for the buildings and land improvements.
The market price per square meter of these investment properties ranged from P=3,502.00 toP=129,999.00. Except for the land, the estimated useful life of the investment properties is 10 to 40years.
Borrowing costs capitalized to investment properties in 2016 and 2015 amounted toP=1,167.18 million and P=468.63 million, respectively (Note 24).
15. Property and Equipment
The rollforward analyses of this account follow:
December 31, 2016
Land
Building andBuilding
ImprovementsTransportation
Equipment
OfficeFurniture,
Fixtures andEquipment
ConstructionEquipment
Other FixedAssets Total
CostBalance at beginning of year P=83,333,600 P=446,793,455 P=546,741,889 P=587,206,720 P=246,744,788 P=154,985,876 P=2,065,806,328Additions 127,166,105 7,324,645 28,652,665 84,208,684 30,555,108 277,907,207Balance at end of year 83,333,600 573,959,560 554,066,534 615,859,385 330,953,472 185,540,984 2,343,713,535Accumulated Depreciation
and AmortizationBalance at beginning of year 229,338,282 385,358,664 463,724,899 83,104,688 103,304,883 1,264,831,416Depreciation and amortization
(Note 26) 109,945,304 41,338,289 77,672,381 22,890,659 4,785,278 256,631,911Balance at end of year 339,283,586 426,696,953 541,397,280 105,995,347 108,090,161 1,521,463,327Net Book Value P=83,333,600 P=234,675,974 P=127,369,581 P=74,462,105 P=224,958,125 P=77,450,823 P=822,250,208

- 49 -
*SGVFS021624*
December 31, 2015
Land
Building andBuilding
ImprovementsTransportation
Equipment
OfficeFurniture,
Fixtures andEquipment
ConstructionEquipment
Other FixedAssets Total
CostBalance at beginning of year P= P=278,179,628 P=500,246,727 P=481,388,601 P=178,441,744 P=129,650,398 P=1,567,907,098Additions 83,333,600 203,242,750 46,495,162 109,729,444 88,815,785 29,000,147 560,616,888Transfers to investment properties
(Note 14) (34,628,923) (3,911,325) (20,512,741) (3,664,669) (62,717,658)Balance at end of year 83,333,600 446,793,455 546,741,889 587,206,720 246,744,788 154,985,876 2,065,806,328Accumulated Depreciation
and AmortizationBalance at beginning of year 160,350,322 361,798,676 408,919,197 81,851,715 78,910,834 1,091,830,744Depreciation and amortization
(Note 26) 68,987,960 23,559,988 54,805,702 1,252,973 24,394,049 173,000,672Balance at end of year 229,338,282 385,358,664 463,724,899 83,104,688 103,304,883 1,264,831,416Net Book Value P=83,333,600 P=217,455,173 P=161,383,225 P=123,481,821 P=163,640,100 P=51,680,993 P=800,974,912
Depreciation and amortization expense charged to operations amounted to P=1,029.98 million,P=798.92 million and P=722.14 million for the years ended December 31, 2016, 2015 and 2014(Note 26). respectively.
As of December 31, 2016 and 2015, fully depreciated assets that are still actively in use amountedto P=220.91 million and P=177.82 million, respectively.
The Group’s transportation equipment with a carrying value of P=66.74 million andP=103.99 million as of December 31, 2016 and 2015, respectively, were pledged as collateral underchattel mortgage to secure the car loans of the Group with various financial institutions (Note 20).
There are no other property and equipment items pledged or used as collateral to secure theliabilities of the group.
16. Investments and Advances in Project Development Costs
Investments and advances in project development costs pertain to deposits, cash advances andother charges in connection with the Land Development Agreements (LDA) entered into by theGroup with individuals, corporate entities and related parties for the development of real estateprojects. The LDA provides, among others, the following: a) the Group will undertake theimprovement, subdivision and development of the real estate project within a certain period asprescribed by the LDA, subject to certain conditions to be fulfilled by the real estate propertyowner; and b) the parties shall divide among themselves all saleable inventories of the real estateprojects or the proceeds from the sale of real estate projects in accordance with the ratio mutuallyagreed.

- 50 -
*SGVFS021624*
The following are the subsidiaries that have outstanding LDAs accounted for as investments andadvances in project development costs:
Entity Project 2016 2015PCLHI Horizontal P=1,103,277,582 P=885,837,030Brittany Horizontal 829,260,419 826,665,329CAPI Horizontal 596,617,680 588,857,179HDC Horizontal 317,424,319 243,341,136CPI Horizontal 272,361,240 221,854,452VRI Vertical 113,370,000 88,370,000
P=3,232,311,240 P=2,854,925,126
17. Other Noncurrent Assets
This account consists of:
2016 2015Deposits P=1,026,167,814 P=566,133,243Model house accessories at cost 208,658,041 282,817,090Goodwill (Note 7) 147,272,020 147,272,020Systems development costs 22,695,623 20,210,092
P=1,404,793,498 P=1,016,432,445
Deposits include deposits for real estate purchases and deposits to utility companies which willeither be applied or recouped against future billings or refunded upon completion of the real estateprojects. These deposits are necessary for the construction and development of real estate projectsof the Group.
Model house accessories pertain to the furniture and fixture and other interior decorations usedand displayed in the model house inventory.
The rollforward analyses of system development costs follow:
2016 2015Balance at beginning of year P=20,210,092 P=18,326,426Additions 48,198,547 35,148,803Amortization (Note 26) (45,713,016) (33,265,137)Balance at end of year P=22,695,623 P=20,210,092
Amortization of system development costs amounted to P=45.71 million, P=33.27 million andP=41.42 million for the years ended December 31, 2016, 2015 and 2014, respectively. These areincluded in the “Depreciation and amortization” account under “Operating expenses” in thestatement of comprehensive income (Note 26).

- 51 -
*SGVFS021624*
18. Accounts and Other Payables
This account consists of:
2016 2015Accounts payable
Contractors P=3,157,581,768 P=3,142,057,973Suppliers 978,485,959 1,069,720,751Buyers 160,069,831 122,946,304Incidental costs 793,241,102 580,810,574
Liabilities for purchased land (Note 22) 1,728,397,118 2,083,876,736Accrued expenses 1,525,065,470 1,421,137,175Retentions payable (Note 22) 1,020,918,247 1,088,054,189Commissions payable 809,619,299 599,500,719Deferred output tax (Note 22) 695,644,782 469,616,216Other payables 531,349,938 630,528,085
P=11,400,373,514 P=11,208,248,722
Accounts payable - contractors pertain to contractors’ billings for construction services related tothe development of various projects of the Group. These are expected to be settled within a yearafter the financial reporting date.
Accounts payable - suppliers represent construction materials, marketing collaterals, officesupplies and property and equipment ordered and delivered but not yet due. These are expected tobe settled within a year from recognition date.
Accounts payable - buyers pertain to refunds arising from the cancellation of contract to sellagreement which is determined based on the required refund under the Maceda Law.
Accounts payable - incidental costs pertain to liabilities incurred in relation to land acquisitions.This includes payable for titling costs, clearing, security and such other additional costs incurred.
Liabilities for purchased land are payables to various real estate property sellers. Under the termsof the agreements executed by the Group covering the purchase of certain real estate properties,the titles of the subject properties shall be transferred to the Group only upon full payment of thereal estate payables. The fair value of liabilities for purchased land is derived using the discountedcash flow model using the discount rate ranging from 2.67% to 4.59% with EIR ranging from0.73% to 3.52%. The unamortized discount as of December 31, 2016 and 2015 amounted toP=178.92 million and P=80.35 million, respectively. The related accretion amounted toP=71.17 million, P=64.99 million and P=75.28 million in 2016, 2015 and 2014, respectively. Theseare presented in “Accretion of unamortized discount” under “Interest income and interest andother financing charges” (Note 24). Liabilities for purchased land that are payable beyond oneyear from year end date are reported as noncurrent liabilities (Note 22).
Accrued expenses consist mainly of accruals for project cost estimate, interest on bonds and bankloans, light and power, marketing costs, professional fees, postal and communication, supplies,repairs and maintenance, transportation and travel, security and insurance. Accruals for marketingcosts amounted to P=509.57 million and P=465.09 million as of December 31, 2016 and 2015,respectively.

- 52 -
*SGVFS021624*
Retentions payable pertains to 10.00% retention from the contractors’ progress billings which willbe released after the completion of contractors’ project. The 10.00% retention serves as a holdoutamount withheld from the contractor to cover for back charges that may arise from quality issuesin affected projects. Retention payables that are payable beyond one year from year end date arepresented as noncurrent liability (Note 22).
Commissions payable pertain to fees due to brokers for services rendered.
Deferred output tax pertains to the VAT charged to the buyers on installment upon contracting butwhich were not yet collected as of reporting date. Further, upon collection on the installmentreceivables, the equivalent output tax from collected installment receivables are included in thecurrent VAT payable on the month where such collection is made. The deferred output VATpertaining to installment receivables that are beyond one year from year end date are presented asnoncurrent liabilities (Note 22).
Other payables include amounts pertaining to other non-trade liabilities such as salaries relatedpremiums, withholding taxes and VAT payable. The majority of this pertains to withholding taxeswith amounts of P=75.31 million and P=74.17 million as of December 31, 2016 and 2015,respectively.
The accounts payable and other payables are noninterest-bearing and are expected to be settledwithin a year after the reporting date.
19. Customers’ Advances and Deposits
This account consists of customers’ reservation fees, downpayments and excess of collectionsover the installment contracts receivable.
The Group requires buyers of residential houses and lots to pay a minimum percentage of the totalselling price before the two parties enter into a sale transaction.
Payments from buyers which have not reached the minimum required percentage are presented ascustomers’ advances and deposits. When the level of required payment is reached by the buyer, asale is recognized and these deposits and downpayments are applied against the related installmentcontracts receivable.
The excess of collections over the recognized receivables is applied against the POC in thesucceeding years.
20. Bank Loans and Loans Payable
Bank LoansBank loans pertain to the borrowings of the Group from various local financial institutions. Thesebank loans are obtained to finance capital expenditures and for general corporate purposes.

- 53 -
*SGVFS021624*
Details follow:
2016 2015Parent company P=23,734,479,509 P=16,106,752,927Subsidiaries 12,352,762,383 14,432,987,824
36,087,241,892 30,539,740,751Less current portion 5,972,290,312 3,360,953,001
P=30,114,951,580 P=27,178,787,750
On April 17, 2013, the Group entered into a bilateral loan agreement with local banks. A portionof the corporate notes was redeemed in 2013 and bank loans with principal amount ofP=1,700.00 million were issued during the year which bears annual fixed interest rate of 7.27%.The bank loan will mature on April 17, 2017. As of December 31, 2016 and 2015 the outstandingbalance of the loans amounted to P=200.00 million and P=600.00 million, respectively.
These bilateral loans are divided into three banks with principal balances of P=800.00 million(secured), P=600.00 million (unsecured) and P=300.00 million (unsecured), respectively. Thebilateral loan with the principal balance of P=800.00 million requires VLLI to maintain current ratioof 1:1.75, debt to equity ratio of 1:1.00 and debt-service coverage ratio (DSCR) of 1:1.00. Thesewere complied with by the Group as of December 31, 2015 and 2016.
In June 2013, the Group obtained unsecured P=1,000.00 million and secured P=5,000.00 millionpeso-denominated bank loans from local banks which bear annual fixed interest rate of 5.90% and5.75%, respectively. The loans will mature in June 2018. The principal balance of the loans willbe paid in twelve (12) and twenty (20) equal quarterly installments, respectively. TheP=5,000.00 million loan requires the VLLI to maintain current ratio of 1:1.75 and DSCR of 1:1.00.These were complied with by the Group as of December 31, 2015 and 2016.
On September 11, 2014, the Group obtained a peso-denominated bank loan from a local bankamounting P=1,500.00 million with interest of 4.25% per annum. The bank loan matures andrenewed annually. The note will mature on July 17, 2017. The loan is secured by the same HTMinvestments of VII amounting US$37.50 million.
In 2015, the Group have various peso-denominated bank loans from different local banksamounting P=12,200.00 million with fixed interest rates ranging from 3.58% to 4.31% per annum.The loans are secured by a hold-out on the HTM investments of VII amountingUS$305.00 million.
In November 2015, the Company acquired Starmalls together with P=10,748.25 million loans fromvarious local banks. These loans bear fixed interest rates ranging from 4.50% to 7.25% per annumwhich are payable in six months to seven years. These loans are secured by selected investmentproperties amounting to P=3,906.84 million (Note 14).
In 2016, the Parent Company have various peso-denominated bank loans from different localbanks amounting P=13,551.25 million with fixed interest rates ranging from 3.88% to 4.00% perannum. The loans will mature on various dates starting March 23, 2017 to December 20, 2017.The loans are secured by a hold-out on the HTM investments of VII amounting $325.00 million.
On September 23, 2016, the Group obtained a 7-year unsecured peso-denominated loan from alocal bank amounting P=3,500.00 million which bears annual fixed interest rate of 5.00%. Theprincipal balance of the loan will be paid in twenty eight (28) equal quarterly installments
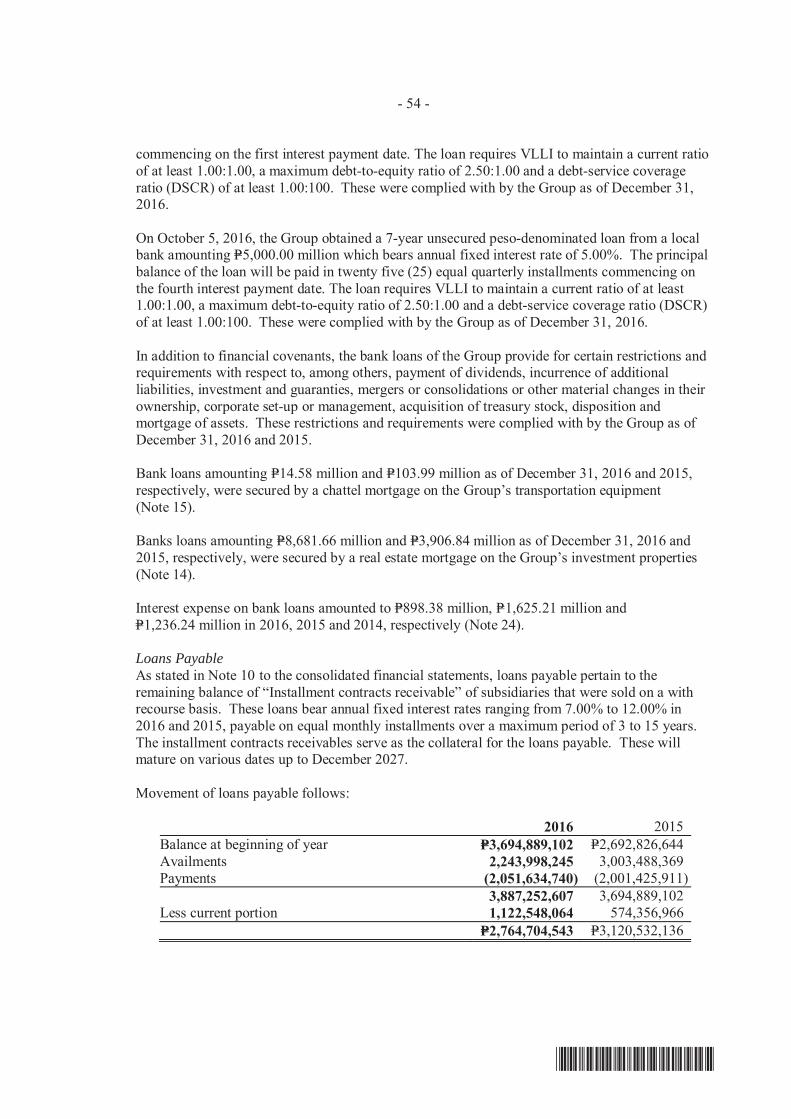
- 54 -
*SGVFS021624*
commencing on the first interest payment date. The loan requires VLLI to maintain a current ratioof at least 1.00:1.00, a maximum debt-to-equity ratio of 2.50:1.00 and a debt-service coverageratio (DSCR) of at least 1.00:100. These were complied with by the Group as of December 31,2016.
On October 5, 2016, the Group obtained a 7-year unsecured peso-denominated loan from a localbank amounting P=5,000.00 million which bears annual fixed interest rate of 5.00%. The principalbalance of the loan will be paid in twenty five (25) equal quarterly installments commencing onthe fourth interest payment date. The loan requires VLLI to maintain a current ratio of at least1.00:1.00, a maximum debt-to-equity ratio of 2.50:1.00 and a debt-service coverage ratio (DSCR)of at least 1.00:100. These were complied with by the Group as of December 31, 2016.
In addition to financial covenants, the bank loans of the Group provide for certain restrictions andrequirements with respect to, among others, payment of dividends, incurrence of additionalliabilities, investment and guaranties, mergers or consolidations or other material changes in theirownership, corporate set-up or management, acquisition of treasury stock, disposition andmortgage of assets. These restrictions and requirements were complied with by the Group as ofDecember 31, 2016 and 2015.
Bank loans amounting P=14.58 million and P=103.99 million as of December 31, 2016 and 2015,respectively, were secured by a chattel mortgage on the Group’s transportation equipment(Note 15).
Banks loans amounting P=8,681.66 million and P=3,906.84 million as of December 31, 2016 and2015, respectively, were secured by a real estate mortgage on the Group’s investment properties(Note 14).
Interest expense on bank loans amounted to P=898.38 million, P=1,625.21 million andP=1,236.24 million in 2016, 2015 and 2014, respectively (Note 24).
Loans PayableAs stated in Note 10 to the consolidated financial statements, loans payable pertain to theremaining balance of “Installment contracts receivable” of subsidiaries that were sold on a withrecourse basis. These loans bear annual fixed interest rates ranging from 7.00% to 12.00% in2016 and 2015, payable on equal monthly installments over a maximum period of 3 to 15 years.The installment contracts receivables serve as the collateral for the loans payable. These willmature on various dates up to December 2027.
Movement of loans payable follows:
2016 2015Balance at beginning of year P=3,694,889,102 P=2,692,826,644Availments 2,243,998,245 3,003,488,369Payments (2,051,634,740) (2,001,425,911)
3,887,252,607 3,694,889,102Less current portion 1,122,548,064 574,356,966
P=2,764,704,543 P=3,120,532,136
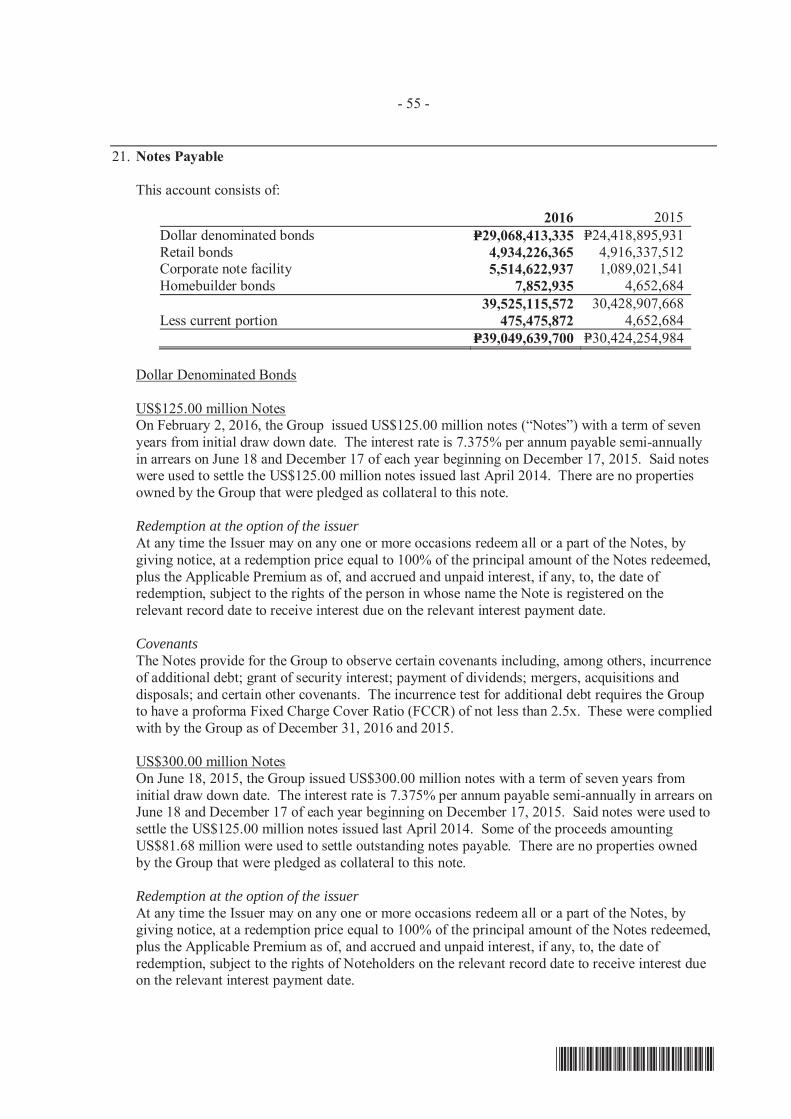
- 55 -
*SGVFS021624*
21. Notes Payable
This account consists of:
2016 2015Dollar denominated bonds P=29,068,413,335 P=24,418,895,931Retail bonds 4,934,226,365 4,916,337,512Corporate note facility 5,514,622,937 1,089,021,541Homebuilder bonds 7,852,935 4,652,684
39,525,115,572 30,428,907,668Less current portion 475,475,872 4,652,684
P=39,049,639,700 P=30,424,254,984
Dollar Denominated Bonds
US$125.00 million NotesOn February 2, 2016, the Group issued US$125.00 million notes (“Notes”) with a term of sevenyears from initial draw down date. The interest rate is 7.375% per annum payable semi-annuallyin arrears on June 18 and December 17 of each year beginning on December 17, 2015. Said noteswere used to settle the US$125.00 million notes issued last April 2014. There are no propertiesowned by the Group that were pledged as collateral to this note.
Redemption at the option of the issuerAt any time the Issuer may on any one or more occasions redeem all or a part of the Notes, bygiving notice, at a redemption price equal to 100% of the principal amount of the Notes redeemed,plus the Applicable Premium as of, and accrued and unpaid interest, if any, to, the date ofredemption, subject to the rights of the person in whose name the Note is registered on therelevant record date to receive interest due on the relevant interest payment date.
CovenantsThe Notes provide for the Group to observe certain covenants including, among others, incurrenceof additional debt; grant of security interest; payment of dividends; mergers, acquisitions anddisposals; and certain other covenants. The incurrence test for additional debt requires the Groupto have a proforma Fixed Charge Cover Ratio (FCCR) of not less than 2.5x. These were compliedwith by the Group as of December 31, 2016 and 2015.
US$300.00 million NotesOn June 18, 2015, the Group issued US$300.00 million notes with a term of seven years frominitial draw down date. The interest rate is 7.375% per annum payable semi-annually in arrears onJune 18 and December 17 of each year beginning on December 17, 2015. Said notes were used tosettle the US$125.00 million notes issued last April 2014. Some of the proceeds amountingUS$81.68 million were used to settle outstanding notes payable. There are no properties ownedby the Group that were pledged as collateral to this note.
Redemption at the option of the issuerAt any time the Issuer may on any one or more occasions redeem all or a part of the Notes, bygiving notice, at a redemption price equal to 100% of the principal amount of the Notes redeemed,plus the Applicable Premium as of, and accrued and unpaid interest, if any, to, the date ofredemption, subject to the rights of Noteholders on the relevant record date to receive interest dueon the relevant interest payment date.

- 56 -
*SGVFS021624*
CovenantsThe Notes provide for the Group to observe certain covenants including, among others, incurrenceof additional debt; grant of security interest; payment of dividends; mergers, acquisitions anddisposals; and certain other covenants. The incurrence test for additional debt requires the Groupto have a proforma FCCR of not less than 2.5x. These were complied with by the Group as ofDecember 31, 2016 and 2015.
On September 29, 2016, VII repurchased US$54.54 million out of the US$425.00 million notesoutstanding balance prior to the repurchase date.
US$350.00 million NotesOn April 29, 2014, the Group issued unsecured US$225.00 million Notes due April 29, 2019 torefinance its debt and for general corporate purposes. The interest rate of 7.45% per annum ispayable semi-annually in arrears on April 29 and October 29 of each year commencing onOctober 29, 2014.
On September 11, 2014, an additional unsecured note, with the same terms and conditions withthe above notes, were issued by the Group amounting US$125.00 million. The notes were issuedat 102% representing a yield to maturity of 6.935%.
The Notes are unconditionally and irrevocably guaranteed by the Parent Company and itssubsidiaries. Other pertinent provisions of the Notes follow:
Redemption at the option of the issuerAt any time the Group may redeem all or part of the Notes, at a redemption price equal to 100% ofthe principal amount of the notes redeemed, plus the applicable premium as of, and accrued andunpaid interest, if any, to the date of the redemption, subject to the rights of note holders on therelevant record date to receive interest due on the relevant interest payment date.
Redemption upon a change of controlUnless the Notes are previously redeemed, repurchased and cancelled, the issuer will, no later than30 days following a change of control make an offer to purchase all outstanding Notes at apurchase price equal to 101% of their principal amount together with accrued and unpaid interest,if any. Change of control includes the sale of all or substantially all the properties or assets of theissuer or its restricted subsidiaries.
CovenantsThe Notes provide for the Group to observe certain covenants including, among others, incurrenceof additional debt; grant of security interest; payment of dividends; mergers, acquisitions anddisposals; and certain other covenants. The incurrence test for additional debt requires the Groupto have a proforma FCCR of not less than 2.5x. These were complied with by the Group as ofDecember 31, 2016 and 2015.
US$100.00 million NotesOn October 4, 2013, VII issued unsecured US$100.00 million bonds with a term of five yearsfrom the issue date. The interest rate is 6.75% per annum payable semi-annually in arrears onApril 4 and October 4 of each year commencing on April 4, 2014.

- 57 -
*SGVFS021624*
The Notes are unconditionally and irrevocably guaranteed by the Group and Subsidiaries. Otherpertinent provisions of the Notes follow:
Redemption at the option of the issuer - equity clawbackAt any time prior to September 30, 2013, the Group may redeem up to 35% of the aggregateprincipal amount of the US Notes originally issued at a redemption price equal to 106.75% of theprincipal amount, plus accrued and unpaid interest, if any, to the date of redemption with the netcash proceeds of an equity offering; provided that: (i) at least 65% of the aggregate principalamount of US Notes originally issued remains outstanding immediately after the occurrence ofsuch redemption and (ii) the redemption occurs within 60 days of the date of the closing of suchequity offering. The Notes contains an equity clawback option.
Redemption at the option of the issuer - early redemptionAt any time the Group may redeem all or part of the Notes, at a redemption price equal to 100% ofthe principal amount of the notes redeemed, plus the applicable premium as of, and accrued andunpaid interest, if any, to the date of the redemption, subject to the rights of note holders on therelevant record date to receive interest due on the relevant interest payment date.
CovenantsThe Notes provide for the Group to observe certain covenants including, among others, incurrenceof additional debt; grant of security interest; payment of dividends; mergers, acquisitions anddisposals; and certain other covenants. The incurrence test for additional debt requires the Groupto have a proforma FCCR of not less than 2.5x. These were complied with by the Group as ofDecember 31, 2016 and 2015.
On September 29, 2016, VII repurchased US$10.70 million out of the remainingUS$62.51 million notes outstanding prior to the repurchase date.
Retail BondsOn May 9, 2014, the Group offered and issued unsecured fixed-rate Peso Retail Bonds with anaggregate principal amount of P=3,000.00 million and an overallotment option of up toP=2,000.00 million. The proceeds of the issuance shall be used to partially finance certaincommercial development projects of CPI and its subsidiaries. There are no securities pledged ascollateral for these bonds.
The offer is comprised of five year fixed rate bonds due on November 9, 2019 and seven yearfixed rate bonds due on May 9, 2021 with interest rate of 5.65% and 5.94% per annum,respectively. Interest on the Retail Bonds shall be payable quarterly in arrears starting onAugust 9, 2014 for the first interest payment date and on February 9, May 9, August 9 andNovember 9 each year for each subsequent interest payment date.
The Retail Bonds shall be repaid at maturity at par plus any outstanding interest, unless the Groupexercises its early redemption option. The maturity date for the Five Year Bonds and Seven YearBonds shall be on November 9, 2019 and on May 9, 2021, respectively.
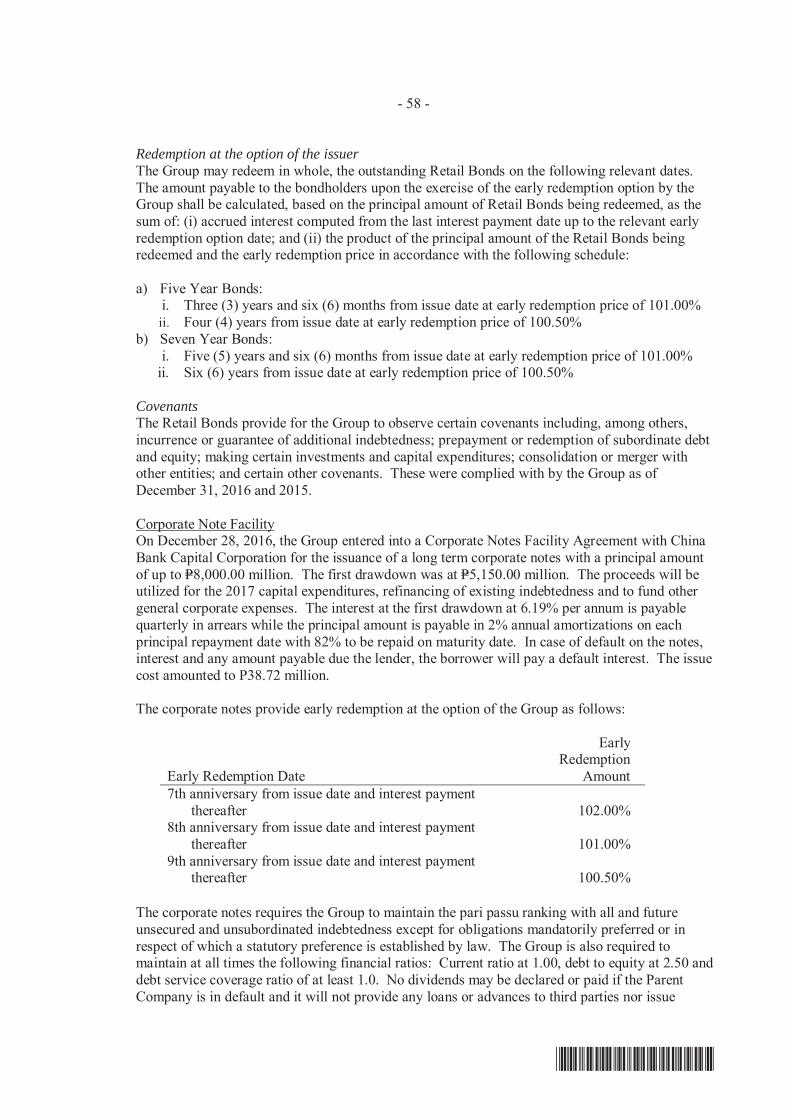
- 58 -
*SGVFS021624*
Redemption at the option of the issuerThe Group may redeem in whole, the outstanding Retail Bonds on the following relevant dates.The amount payable to the bondholders upon the exercise of the early redemption option by theGroup shall be calculated, based on the principal amount of Retail Bonds being redeemed, as thesum of: (i) accrued interest computed from the last interest payment date up to the relevant earlyredemption option date; and (ii) the product of the principal amount of the Retail Bonds beingredeemed and the early redemption price in accordance with the following schedule:
a) Five Year Bonds:i. Three (3) years and six (6) months from issue date at early redemption price of 101.00%ii. Four (4) years from issue date at early redemption price of 100.50%
b) Seven Year Bonds:i. Five (5) years and six (6) months from issue date at early redemption price of 101.00%
ii. Six (6) years from issue date at early redemption price of 100.50%
CovenantsThe Retail Bonds provide for the Group to observe certain covenants including, among others,incurrence or guarantee of additional indebtedness; prepayment or redemption of subordinate debtand equity; making certain investments and capital expenditures; consolidation or merger withother entities; and certain other covenants. These were complied with by the Group as ofDecember 31, 2016 and 2015.
Corporate Note FacilityOn December 28, 2016, the Group entered into a Corporate Notes Facility Agreement with ChinaBank Capital Corporation for the issuance of a long term corporate notes with a principal amountof up to P=8,000.00 million. The first drawdown was at P=5,150.00 million. The proceeds will beutilized for the 2017 capital expenditures, refinancing of existing indebtedness and to fund othergeneral corporate expenses. The interest at the first drawdown at 6.19% per annum is payablequarterly in arrears while the principal amount is payable in 2% annual amortizations on eachprincipal repayment date with 82% to be repaid on maturity date. In case of default on the notes,interest and any amount payable due the lender, the borrower will pay a default interest. The issuecost amounted to P38.72 million.
The corporate notes provide early redemption at the option of the Group as follows:
Early Redemption Date
EarlyRedemption
Amount7th anniversary from issue date and interest payment thereafter 102.00%8th anniversary from issue date and interest payment thereafter 101.00%9th anniversary from issue date and interest payment thereafter 100.50%
The corporate notes requires the Group to maintain the pari passu ranking with all and futureunsecured and unsubordinated indebtedness except for obligations mandatorily preferred or inrespect of which a statutory preference is established by law. The Group is also required tomaintain at all times the following financial ratios: Current ratio at 1.00, debt to equity at 2.50 anddebt service coverage ratio of at least 1.0. No dividends may be declared or paid if the ParentCompany is in default and it will not provide any loans or advances to third parties nor issue

- 59 -
*SGVFS021624*
guarantees other than the benefit of any of its subsidiaries and in the ordinary course of business.These were complied with by the Group as of December 31, 2016.
As part of the issuance of the corporate notes, the subsidiaries of the Parent Company that acted asguarantors, irrevocably and unconditionally, are: Brittany Corporation, Camella Homes, Inc.,Crown Asia Properties, Inc. Communities Philippines, Inc. Starmalls, Inc. and Vista Residences,Inc.
On April 20, 2012, the Group secured a Peso Corporate Note Facility of up to P=4,500.00 millionfrom certain financial institutions to fund the Group’s on-going real estate development projects,to refinance or replace existing borrowings and for general corporate purposes. The CorporateNotes shall bear annual fixed interest rate based on applicable bench mark rate on drawdown dateplus a certain spread and will mature five (5) years from drawdown date. The notes will matureon April 25, 2017 with interest rate of 7.27% per annum. There are no properties owned by theGroup that are pledged as collateral for this specific note.
CovenantsThe Corporate Note Facility provides for the Group to observe certain covenants including, amongothers, incurrence of additional debt; dividend restrictions; maintenance of financial ratios;granting of loans; and certain other covenants. The financial ratios are current ratio, debt toequity ratio, DCCR and FCCR which are to be maintained at 1.75, 1.50, 100 and 2.50,respectively. These were complied with by the Group as of December 31, 2016 and 2015.
Homebuilder BondsOn November 16, 2012, the Group offered and issued to the public unsecured Homebuilder Pesobonds (the Bonds) of up to P=2,500.00 million with an initial offering of P=500.40 million forfunding general corporate purposes. There are no properties pledged as collateral for theHomebuilder Bonds.
The first tranche was issued in equal monthly installments of up to P=13.90 million over a period ofthirty-six (36) months, commencing on November 16, 2012 at a fixed interest rate of 5.00% perannum and shall mature three (3) years from the initial issue date. As of December 31, 2016 and2015, total bonds issued by the Parent Company amounted to P=371.84 million andP=369.87 million, respectively. On November 2015, the company paid out P=362.97 million uponmaturity. The carrying value of the bonds as of December 31, 2016 and 2015 amounted toP=6.01 million and P=272.12 million, respectively.
Other pertinent provisions of the bonds follow:
Redemption at the option of the issuerAt any time prior to November 16, 2015, the Group may redeem the bonds if the bondholderselects the application of payment for the purchase of the Group’s property provided that: (i) earlyapplication of payment is only available to eligible bondholders allowed by law to purchase theselected property of the Group; (ii) the bondholder expresses his intention to apply the paymentfor the purchase of the Group’s property through written notice to the Group; and (iii) the Groupapproves the early application of payment. However, the bondholder can avail itself of this earlyapplication of payment only if: (i) such bondholder is able to fully pay or obtain firm bank or in-house financing; and (ii) the property of the bondholder’s choice is from what the Group makesavailable to the bondholder to choose from.

- 60 -
*SGVFS021624*
Extension optionThe bondholder may opt to extend the maturity of the bonds held and subscribe additional bondsfor another twenty four (24) months, for and at the same monthly subscription payment, with thefollowing terms:
The first tranche of the bonds will have a maximum aggregate principal amount ofP=834.00 million, including any and all additional subscriptions;
All subscriptions held by bondholders who exercised the extension option shall mature on thefifth (5th) anniversary of the initial issue date;
Upon exercise of the extension option at least six (6) months prior to the initial maturity date,all subscriptions held shall bear interest on principal amount at a fixed rate of 6.75% perannum, applied prospectively from the initial maturity date to the extended maturity date; and
Interest will not be compounded and shall be payable on the relevant maturity date or on theearly redemption date, as may be applicable, less the amount of any applicable withholdingtaxes.
Interest expense on notes payable amounted to P=3,866.16 million, P=2,302.00 million andP=1,478.69 million in 2016, 2015 and 2014, respectively (Note 24).
22. Other Noncurrent Liabilities
This account consists of:
2016 2015Liabilities for purchased land (Note 18) P=1,809,275,473 P=1,199,347,532Retentions payable (Note 18) 457,264,712 614,073,575Deferred output tax - net of current portion (Note 18) 111,969,819 283,993,311
P=2,378,510,004 P=2,097,414,418
23. Equity
Capital StockThe details of the Parent Company’s capital stock follow:
2016 2015 2014CommonAuthorized shares 17,900,000,000 17,900,000,000 11,900,000,000Par value per share P=1.00 P=1.00 P=1.00Issued shares 13,114,136,376 12,654,891,753 8,538,740,614Treasury shares (P=6,917,014,956) (P=6,297,793,026) P=–Value of shares issued P=13,114,136,376 P=12,654,891,753 P=8,538,740,614
PreferredAuthorized shares 10,000,000,000 10,000,000,000 10,000,000,000Par value per share P=0.01 P=0.01 P=0.01Issued and outstanding shares 3,300,000,000 3,300,000,000 3,300,000,000Value of shares issued P=33,000,000 P=33,000,000 P=33,000,000

- 61 -
*SGVFS021624*
Common sharesIn February 2016, the Parent Company issued 459.24 million new common shares out of theunissued portion of its authorized capital stock at issue price of P=7.15 per share orP=3,283.60 million, out of which additional paid-in capital amounted to P=2,824.35 million (Note 7).
In November 2015, the Securities and Exchange Commission approved the increase in theauthorized capital stock of the Company from P=12,000.00 million divided into: (i) 11,900,000,000common shares with par value of P=1.00 per share, or an aggregate par value of P=11,900.00 million;and (ii) 10,000,000,000 preferred shares with par value of P=0.01 per share, or an aggregate par valueof P=100.00 million to P=18,000.00 million divided into: (i) 17,900,000,000 common shares with parvalue of P=1.00 per share, or an aggregate par value of P=17,900.00 million and (ii) 10,000,000,000preferred shares with par value of P=0.01 per share, or an aggregate par value of P=100.00 million.
As of December 31, 2015, the Company issued 4,116,151,139 common shares out of the increase inthe authorized capital stock. The issuance of the common shares that amounted to P=29,187.77million, out of which additional paid-in capital amounted to P=25,071.57 million. The issuance ofthe common shares pertains to the Company’s acquisition of Starmalls Group (Note 7). Thecommon shares issued at P=1.00 par value per share totaled P=13,114.14 million,P=12,655.89 million and P=8,539.74 million for the years ended December 31, 2016, 2015 and 2014,respectively.
The movement in the Parent Company’s common stock and amounts involved follows:
2016 2015 2014Shares Amount Shares Amount Shares Amount
At January 1 12,654,891,753 P=12,654,891,753 8,538,740,614 P=8,538,740,614 8,538,740,614 P=8,538,740,614Issuances 459,244,623 459,244,623 4,116,151,139 4,116,151,139 – –At December 31 13,114,136,376 P=13,114,136,376 12,654,891,753 P=12,654,891,753 8,538,740,614 P=8,538,740,614
Preferred sharesOn March 21, 2013, the Parent Company issued in favor of Fine Properties, Inc. (“Fine Properties”),3,300.00 million new preferred shares out of the unissued portion of its authorized capital stock atpar or an aggregate issue price of P=33.00 million. The subscription price was fully paid on thesame date.
The preferred shares are voting, non-cumulative, non-participating, non-convertible and non-redeemable. The BOD may determine the dividend rate which shall in no case be more than10% per annum.
Registration Track RecordOn July 26, 2007, the Parent Company launched its follow-on offer where a total of8,538,740,614 common shares were offered at an offering price of P=6.85 per share. Theregistration statement was approved on June 25, 2007. After the listing in 2007, there have beensubsequent issuances on November 10, 2015 and December 22, 2015 covering a total of4,116,151,139 shares. The Parent Company has 971 and 992 existing certified shareholders as ofDecember 31, 2016 and 2015, respectively.
Treasury SharesAs of December 31, 2016, treasury shares totaling 274,685,200 in 2016 and 147,867,100 in 2015of the Parent Company amounting P=1,538.73 million and P=919.50 million, respectively, representsthe shares of stock held by the Parent Company, while treasury shares (752,208,215) amounting

- 62 -
*SGVFS021624*
P=5,378.29 million represents Parent Company stocks held by Manuela. These treasury shares arerecorded at cost.
On March 17, 2015, the BOD of the Parent Company approved the buyback of its common sharesup to the extent of the total purchase price of P=1,500.00 million subject to the prevailing marketprice at the time of the buyback over a 24-month period but subject to periodic review by themanagement.
For the years ended December 31, 2016 and 2015, the Parent Company bought back from themarket a total of 126,818,100 shares or P=619.22 million in value and 147,867,100 orP=919.50 million in value, respectively.
The movement in the Parent Company’s treasury shares follows:
2016 2015 2014Shares Amount Shares Amount Shares Amount
At January 1 147,867,100 P=919,504,288 P= P=Additions 126,818,100 619,221,931 147,867,100 919,504,288 – –At December 31 274,685,200 P=1,538,726,219 147,867,100 P=919,504,288 P=
Retained EarningsIn accordance with SRC Rule No. 68, As Amended (2011), Annex 68-C, the Parent Company’sretained earnings available for dividend declaration as of December 31, 2016, after reconcilingitems, amounted to P=2,243.71 million.
Retained earnings include the accumulated equity in undistributed earnings of consolidatedsubsidiaries of P=31,356.20 million, P=25,684.72 million and P=20,430.27 million in 2016, 2015 and2014, respectively. These are not available for dividends until declared by the subsidiaries.Also, the retained earnings is restricted to payments of dividends to the extent of cost of treasuryshares in the amount of P=1,538.73 million, P=919.50 million and nil as at and for the years endedDecember 31, 2016, 2015 and 2014, respectively.
Under the Tax Code of the Philippines, publicly listed companies are allowed to accumulateretained earnings in excess of capital stock and are exempt from improperly accumulated earningstax. Nonetheless, the retained earnings available for dividend declaration, after reconciling items,as of and for the year ended December 31, 2016 amounted to P=2,243.71 million, which is belowthe paid-up capital of P=43,802.57 million. The paid up capital includes capital stock andadditional paid-in capital of the Parent Company.
On September 15, 2014, the BOD approved the declaration of a regular cash dividendamounting P=1,012.52 million or P=0.119 per share, payable to all stockholders of record as ofSeptember 30, 2014. The said dividends were paid on October 24, 2014.
On September 15, 2015, the BOD approved the declaration of a regular cash dividendamounting P=1,694.43 million or P=0.1357 per share, in favor of all stockholders of record as ofSeptember 15, 2015, payable on September 30, 2015.
On September 28, 2016, the BOD approved the declaration of a regular cash dividendamounting P=1,437.14 million or P=0.1185 per share, in favor of all stockholders of record as ofSeptember 28, 2016, payable on October 13, 2016.

- 63 -
*SGVFS021624*
Non-controlling interestIn 2016, the Vista Group acquired additional 750,265,955 shares of Starmalls, Inc. for a totalconsideration of P=3,383.70 million. The transaction was accounted for as an equity transactionsince there was no change in control. The movements within equity are accounted as follows:
Fair value of consideration paid P=3,383,699,457Book value of shares 1,500,705,403Difference charged to equity 1,882,994,054Attributable to OCI 119,711,596Equity reserves recognized in additional paid in capital P=1,763,282,458
Capital ManagementThe primary objective of the Group’s capital management policy is to ensure that debt and equitycapital are mobilized efficiently to support business objectives and maximize shareholder value.The Group establishes the appropriate capital structure for each business line that properly reflectsits premier credit rating and allows it the financial flexibility, while providing it sufficient cushionto absorb cyclical industry risks.
The Group considers debt as a stable source of funding. The Group lengthened the maturityprofile of its debt portfolio and makes it a point to spread out its debt maturities by not having asignificant percentage of its total debt maturing in a single year.
The Group manages its capital structure and makes adjustments to it, in the light of changes ineconomic conditions. It monitors capital using leverage ratios on both a gross debt and net debtbasis. As of December 31, 2016, 2015 and 2014, the Group had the following ratios:
2016 2015 2014Current ratio 302% 342% 295%Debt-to-equity ratio 99% 87% 66%Net debt-to-equity ratio 49% 46% 23%Asset-to-equity ratio 230% 219% 194%
As of December 31, 2016, 2015 and 2014, the Group had complied with all externally imposedcapital requirements (Notes 20 and 21). No changes were made in the objectives, policies orprocesses for managing capital during the years ended December 31, 2016, 2015 and 2014.
The Group considers as capital the equity attributable to equity holders of the Group.The following table shows the component of the Group’s equity which it manages as capital as ofDecember 31, 2016, 2015 and 2014:
2016 2015 2014Total paid-up capital P=43,802,565,725 P=42,158,532,614 P=31,889,760,221Deposits for future stock
subscription (Note 7) – 5,153,850,644Retained earnings 36,953,581,723 30,483,778,682 24,593,203,951Treasury shares (6,917,014,956) (6,297,793,026) –Other comprehensive income
(loss) 1,111,006,329 742,530,256 (125,273,391)Non-controlling interest 1,545,167,378 2,878,040,833 2,745,698,984
P=76,495,306,199 P=69,965,089,359 P=64,257,240,409

- 64 -
*SGVFS021624*
Financial Risk AssessmentThe Group’s financial condition and operating results would not be materially affected by thecurrent changes in liquidity, credit, interest, currency and market conditions.
Credit risks continue to be managed through defined credit policies and continuing monitoring ofexposure to credit risks. The Group’s base of counterparties remains diverse. As such, it is notexposed to large concentration of credit risk.
Exposure to changes in interest rates is reduced by regularly availing of short-term loans as itrelates to its sold installment contracts receivables in order to cushion the impact of potentialincrease in loan interest rates.
Exposure to foreign currency holdings are as follows:
2016 2015Cash and cash equivalents US$6,195,197 US$48,806,149AFS financial assets 162,494,525 153,160,980HTM investments 419,380,701 287,325,972Notes payable (584,642,263) (518,888,566)
Liquidity risk is addressed with long-term funding already locked in, while funds are placed on ashort-term placement.
24. Interest Income and Interest and Other Financing Charges
Below are the details of interest income:
2016 2015 2014Installment contracts receivable P=609,080,060 P=672,339,166 P=728,341,032Accretion of unamortized discount
(Note 10) 33,562,135 37,942,404 32,307,635642,642,195 710,281,570 760,648,667
Cash and cash equivalents and short- term investments (Notes 8 and 9) 143,350,393 110,473,069 196,873,219HTM investments (Note 9) 721,024,942 482,511,647 242,144,060
864,375,335 592,984,716 439,017,279P=1,507,017,530 P=1,303,266,286 P=1,199,665,946
Interest and other financing charges consist of:
2016 2015 2014Interest expense on:
Bank loans (Note 20) P=898,383,961 P=1,625,206,609 P=1,236,243,521Notes payable (Note 21) 3,866,156,523 2,301,995,739 1,478,691,180
4,764,540,484 3,927,202,348 2,714,934,701Amounts capitalized (Notes 11 and 14) (2,606,768,817) (2,114,794,175) (1,400,462,510)Accretion of unamortized discount (Note 18) 71,169,719 64,987,041 75,280,869Interest cost on benefit obligation (Note 28) 7,324,790 64,012,545 13,287,418
P=2,236,266,176 P=1,941,407,759 P=1,403,040,478

- 65 -
*SGVFS021624*
The capitalization rate used to determine the borrowings eligible for capitalization is 6.47% in2016, 12.24% in 2015 and 9.71% in 2014.
25. Miscellaneous Income
Miscellaneous income mostly pertains to income from forfeited reservation fees and partialpayments from customers whose sales contracts are cancelled before completion of required downpayment (Note 19).
This also includes the operating income from the malls such as reimbursable expenses.
To conform with the 2016 presentation, the Group reclassified the excess of reimbursable lightand water expenses amounting P=159.34 million and P=131.09 million previously deducted from“Occupancy costs” to miscellaneous income in 2015 and 2014, respectively (Note 26).
26. Costs and Expenses
Cost of real estate salesCost includes acquisition cost of subdivision land, construction and development cost andcapitalized borrowing costs. Cost of real estate sales recognized for the years endedDecember 31, 2016, 2015 and 2014 amounted to P=12,321.00 million, P=12,253.89 million andP=11,032.28 million, respectively (Note 11).
Operating expensesThis account consists of:
2016 2015 2014Commissions P=1,376,399,761 P=1,247,561,867 P=1,207,335,847Salaries, wages and employees
benefits (Notes 28) 1,281,718,370 1,247,618,013 973,646,773Advertising and promotions 1,129,111,882 1,317,186,308 1,465,341,815Depreciation and amortization (Notes 14, 15 and 17) 1,029,980,066 798,919,810 722,140,062Repairs and maintenance (Note 14) 836,619,978 756,898,068 701,366,395Occupancy costs (Notes 25 and 34) 715,360,838 591,121,951 539,115,142Taxes and licenses 461,211,182 282,585,300 249,059,216Professional fees 300,101,628 305,200,669 249,373,403Representation and entertainment 86,656,689 125,947,227 129,932,712Transportation and travel 73,495,820 114,250,464 121,451,828Office expenses 39,597,211 56,259,898 44,779,613Provision for impairment losses on receivables (Note 10) 1,974,771 50,544,672 5,394,498Miscellaneous 262,281,221 157,479,117 177,017,138
P=7,594,509,417 P=7,051,573,364 P=6,585,954,442

- 66 -
*SGVFS021624*
Operating expenses represent the cost of administering the business of the Group. These arerecognized when the related services and costs have been incurred.
Rent expensesThe Group entered into various lease agreements for administrative and selling purposes. Theseagreements are renewed on an annual basis with advanced deposits. Rent expenses included under“Occupancy costs” amounted to P=136.74 million, P=142.71 million and P=171.21 million in 2016,2015 and 2014, respectively (Note 34).
Miscellaneous expensesMiscellaneous expenses include dues and subscriptions, donations and other expenditures.
27. Other Expenses
This account consists of foreign exchange losses amounting P=25.69 million, P=7.02 million andP=29.29 million in 2016, 2015 and 2014, respectively.
28. Retirement Plan
The Group has noncontributory defined benefit pension plan covering substantially all of itsregular employees. The benefits are based on current salaries and years of service and relatedcompensation on the last year of employment. The retirement is the only long-term employeebenefit.
The principal actuarial assumptions used to determine the pension benefits with respect to thediscount rate, salary increases and return on plan assets were based on historical and projectednormal rates.
The components of pension expense follow:
2016 2015 2014Current service cost (Note 26) P=83,952,065 P=133,810,647 P=89,506,451Interest cost (Note 24) 7,324,790 14,091,148 16,353,996Total pension expense P=91,276,855 P=147,901,795 P=105,860,447
Funded status and amounts recognized in the consolidated statements of financial position for thepension plan follow:
2016 2015 2014Defined benefit obligation P=532,630,210 P=491,637,680 P=632,840,548Plan assets (434,496,381) (377,164,819) (320,844,860)Liability recognized in the
consolidated statements offinancial position P=98,133,829 P=114,472,861 P=311,995,688

- 67 -
*SGVFS021624*
Changes in the combined present value of the combined defined benefit obligation are as follows:
2016 2015 2014Balance at beginning of year P=491,637,680 P=632,840,548 P=473,458,705Transfer in (13,215,360) – 9,408,241Current service cost 83,952,065 133,810,647 89,506,451Interest cost 22,847,291 28,683,671 32,010,427Elimination arising from disposed
subsidiary – – (9,352,497)Actuarial gain (52,591,466) (303,697,186) 37,809,221Balance at end of year P=532,630,210 P=491,637,680 P=632,840,548
Changes in the fair value of the combined plan assets are as follows:
2016 2015 2014Balance at January 1 P=377,164,819 P=320,844,860 P=250,700,633Interest income included in net
interest cost 15,522,501 14,592,524 15,656,431Actual return excluding amount
included in net interest cost 2,172,478 (7,338,319) (529,907)Contributions 39,636,583 49,065,754 55,017,703Balance at December 31 P=434,496,381 P=377,164,819 P=320,844,860
The movements in the combined net pension liabilities follow:
2016 2015 2014Balance at beginning of year P=114,472,862 P=311,995,688 P=222,758,072Pension expense 91,276,855 147,901,795 105,860,447Transfer in (13,215,360) – 9,408,241Elimination arising from disposed
subsidiary – – (9,352,497)Total amount recognized in OCI (54,763,945) (296,358,868) 38,339,128Contributions (39,636,583) (49,065,754) (55,017,703)Balance at end of year P=98,133,829 P=114,472,861 P=311,995,688
The Group immediately recognized to OCI any actuarial gains and losses.
The assumptions used to determine the pension benefits for the Group are as follows:
2016 2015 2014Discount rates 5.51% 5.65% 4.54%Salary increase rate 7.75% 7.75% 9.00%

- 68 -
*SGVFS021624*
The distribution of the plan assets at year end follows:
2016 2015 2014AssetsCash P=213,444,809 P=122,890,077 P=59,605,041Investments in private companies 198,399,874 202,148,585 –Investments in government
securities 27,126,277 51,215,649 259,210,683Receivables 2,112,871 2,159,162 2,086,354
441,083,831 378,413,473 320,902,078LiabilityTrust fee payable 552,834 320,546 244,563Net plan assets P=440,530,997 P=378,092,927 P=320,657,515
The carrying amounts disclosed above reasonably approximate fair value at year-end. The overallexpected rate of return on assets is determined based on the market prices prevailing on that date,applicable to the period over which the obligation is to be settled. The actual return on plan assetsamounted to P=2.17 million, P=7.34 million and P=0.53 million in 2016, 2015 and 2014, respectively.
The net unrealized gains on investments in government securities amounted toP=1.82 million, P=2.16 million and P=2.09 million as of December 31, 2016, 2015 and 2014,respectively.
The Group expects to contribute P=55.02 million to its retirement fund in 2017.
The sensitivity analyses that follow has been determined based on reasonably possible changes ofthe assumption occurring as at December 31, 2013, assuming if all other assumptions were heldconstant.
Rates PVO
Discount rate 5.51% +1% (P=424,982,613)-1% 621,330,187
Salary increase 7.75% +1% P=621,980,963-1% (423,677,825)
Each year, an Asset-Liability Matching Study (ALM) is performed with the result being analyzedin terms of risk-and-return profiles. Union Bank’s (UB) current strategic investment strategyconsists of 47.29% of cash, 6.33% of investments in government securities, 45.89% of investmentin private companies and 0.49% receivables. For the Group other than UB, the principaltechnique of the Group’s ALM is to ensure the expected return on assets to be sufficient to supportthe desired level of funding arising from the defined benefit plans.
29. Income Tax
Provision for income tax consists of:
2016 2015 2014Current:
RCIT/MCIT P=1,218,757,113 P=887,669,604 P=929,270,192Final 7,914,896 9,356,228 23,672,659
Deferred 355,563,409 103,973,660 (211,511,669)P=1,582,235,418 P=1,000,999,492 P=741,431,182

- 69 -
*SGVFS021624*
The components of the Group’s deferred taxes are as follows:
Net deferred tax assets:
2016 2015 2014Deferred tax assets on:
NOLCO P=2,911,709 P=9,613,462 P=14,458,816Unrealized foreign exchange
losses 20,826,711 – Excess of tax basis over book basis of deferred gross profit on real estate sales 397,686,311 258,901,652 229,043,040
Allowance for probable losses 6,614,982 3,607,800Accrual of retirement costs 21,649,338 20,365,354 14,756,290Allowance for impairment
losses on land and improvements 2,519,137 2,259,705
Carry forward benefit of MCIT 72,742Deferred tax component of OCI 10,427,970 6,639,768Unamortized discount
on receivables 4,075,483 5,857,946 2,024,217464,192,504 303,970,061 266,149,868
Deferred tax liabilities on:Excess of book basis over tax basis of deferred gross profit on real estate sales 2,358,131 1,187,878 9,287,035Capitalized interest and other expenses 8,829,861Deferred tax component of OCI 15,825,541 12,758,126
27,013,533 13,946,004 9,287,035P=437,178,971 P=290,024,057 P=256,862,833
Net deferred tax liabilities:
2016 2015 2014Deferred tax assets on:
Excess of book basis over tax basis of deferred gross profit on real estate sales P=559,451 P=1,990,319 P=4,949,970Allowance for impairment losses
on land and improvements 56,259,059 49,796,496 64,959,897Allowance for probable losses 105,145,815 82,443,193 82,443,193Accrual of retirement costs 70,267,721 100,089,396 76,013,491Carryforward benefit of MCIT 14,914,385 19,470,784 38,714,143Unamortized discount
on receivables 7,487,835 17,074,606 16,455,606NOLCO 50,582,310 60,247,102 50,086,744Unrealized foreign exchange
losses –Straight line lease adjustment 83,357,101 77,494,142 70,671,168Deferred tax component of OCI (14,297,532) 1,105,277 –Others 19,682,261 19,750,777
374,276,145 429,393,576 424,044,989
(Forward)

- 70 -
*SGVFS021624*
2016 2015 2014Deferred tax liabilities on:
Excess of book basis over tax basis of deferred gross profit on real estate sales P=1,320,017,722 P=1,188,315,051 P=1,771,822,647PAS 17 Rental Income 615,532,454 286,239,613 94,898,323Capitalized interest and other
expenses 410,868,230 364,574,878 119,970,571Deferred tax component of OCI 24,320,764 66,832,511Fair Value Adjustments - Malay 23,619,214 24,415,579Discount on rawlands payable 21,373,197 1,017,419 1,017,419Unamortized bond transaction
cost 13,809,483 35,165,647 44,827,287Retirement Expense 9,630,024 701,867Unrealized foreign exchange gain 747,265 6,104,039
2,439,918,353 1,966,560,698 2,039,342,153(P=2,065,642,208) (P=1,537,167,122) (P=1,615,297,164)
As of December 31, 2016, 2015 and 2014, the Group has deductible temporary differences,NOLCO and MCIT that are available for offset against future taxable income for which nodeferred tax assets have been recognized as follows:
2016 2015 2014NOLCO P=4,503,058,091 P=158,263,294 P=3,909,907,916Accrual of retirement cost 30,476,159 5,868,838 13,997,716MCIT 6,545,367 2,543,371 4,106,220Post-employment benefit
obligation 1,497,145 630,361 14,080,913Allowance on probable losses 26,742,003 26,742,003Unrealized foreign exchange loss 11,925,344 –
P=4,580,244,109 P=167,305,864 P=3,968,834,768
The related unrecognized deferred tax assets on these deductible temporary differences amountedto P=1,378.65 million, P=51.97 million and P=1,193.52 million as of December 31, 2016, 2015 and2014, respectively.
Deferred tax assets are recognized only to the extent that taxable income will be available againstwhich the deferred tax assets can be used. The subsidiaries will recognize a previouslyunrecognized deferred tax asset to the extent that it has become probable that future taxableincome will allow the deferred tax asset to be recovered.
As of December 31, 2016, the details of the unused tax credits from the excess of the MCIT overRCIT and NOLCO, which are available for offset against future income tax payable and taxableincome, respectively, over a period of three (3) years from the year of inception, follow:
NOLCO
Inception Year Amount Used/Expired Balance Expiry Year2013 P=1,297,633,329 (P=1,297,633,329) P= 20162014 1,578,172,076 (62,683,883) 1,515,488,193 20172015 1,562,731,542 1,562,731,542 20182016 1,589,720,373 1,589,720,373 2019
P=6,028,257,320 (P=1,360,317,212) P=4,667,940,108

- 71 -
*SGVFS021624*
MCIT
Inception Year Amount Used/Expired Balance Expiry Year2013 P=16,577,145 (P=16,577,145) P= 20162014 16,221,217 (10,937,783) 5,283,434 20172015 20,696,410 20,696,410 20182016 6,570,554 6,570,554 2019
P=60,065,326 (P=27,514,928) P=32,550,398
The reconciliation of the provision for income tax computed at the statutory income tax rate to theprovision for income tax shown in profit or loss follows:
2016 2015 2014Provision for income tax computed at the statutory income tax rate 30.00% 30.00% 29.83%Additions to (reductions in) income tax resulting from:
Nondeductible interest and other expenses 5.65 5.06 6.12
Change in unrecognized deferred tax assets 17.65 (12.20) (8.39)
Tax-exempt income (29.42) (11.31) (33.83)Expired MCIT and NOLCO (3.95) (0.04) 4.02Interest income already subjected
to final tax (0.04) (0.22) (0.44)Equity in net loss of an associate – 13.55Others (3.56) 0.61 (0.32)
Provision for income tax 16.33% 11.90% 10.54%
Board of Investments (BOI) IncentivesThe BOI issued in favor of certain subsidiaries in the Group a Certificate of Registration asDeveloper of Mass Housing Projects for its 11 projects in 2016, 5 projects in 2015 and 17 projectsin 2014, in accordance with the Omnibus Investment Code of 1987. Pursuant thereto, the projectshave been granted an Income Tax Holiday for a period of either three years for new projects, orfour years for expansion projects, commencing from the date of issuance of the Certificate ofRegistration.
30. Related Party Transactions
Parties are considered to be related if one party has the ability, directly or indirectly, to control theother party in making financial and operating decisions or the parties are subject to commoncontrol or common significant influence (referred to herein as “affiliates”). Related parties may beindividuals or corporate entities.
The Group in their regular conduct of business has entered into transactions with affiliates andother related parties principally consisting of advances and reimbursement of expenses andpurchase and sale of real estate properties. The Group’s policy is to settle its intercompanyreceivables and payables on a net basis.

- 72 -
*SGVFS021624*
The consolidated statement of financial position include the following amounts resulting from theforegoing transactions which represent amounts receivable (payable) to related parties as ofDecember 31, 2016 and 2015:
December 31, 2016
Related Party Relationship Nature of TransactionAmount/Volume
OutstandingBalance Terms Conditions
Fine Properties, Inc. Ultimate Parent Nontrade Receivables P=245,474,309 P=2,880,040,145 Non-interest bearing UnsecuredAll Value Group Entities under
Common Control Nontrade Receivables 23,020,397 941,544,680 Non-interest bearingUnsecured,
No impairmentGolden Haven Memorial
Park, Inc.Entities underCommon Control Nontrade Receivables (1,115,430) 85,716,091 Non-interest bearing
Unsecured,No impairment
Althorp Holdings, Inc.Entities underCommon Control Nontrade Payable 223,540,009 9,368,542 Non-interest bearing Unsecured
P=490,919,285 P=3,916,669,458
December 31, 2015
Related Party Relationship Nature of TransactionAmount/Volume
OutstandingBalance Terms Conditions
Fine Properties, Inc. Ultimate Parent Nontrade Receivables (P=156,171,890) P=2,634,565,836 Non-interest bearing UnsecuredAll Value Group Entities under
Common Control Nontrade Receivables 117,083,006 918,524,283 Non-interest bearingUnsecured,
No impairmentGolden Haven Memorial
Park, Inc.Entities underCommon Control Nontrade Receivables – 86,831,521 Non-interest bearing
Unsecured,No impairment
Althorp Holdings, Inc.Entities underCommon Control Nontrade Payable (214,171,467) (214,171,467) Non-interest bearing Unsecured
(P=253,260,351) P=3,425,750,173
Terms and conditions of transactions with related partiesThe US$125 million Notes issued by VII on February 2, 2016 and the US$300 million Notesissued by VII are unconditionally and irrevocably guaranteed by the Parent Company and itsSubsidiaries. No fees are charged for these guarantee agreements.
The P=5,150.00 million Corporate Notes issued by the Parent Company on February 2, 2016 areunconditionally and irrevocably guaranteed by Brittany Corporation, Camella Homes, Inc., CrownAsia Properties, Inc. Communities Philippines, Inc. Starmalls, Inc. and Vista Residences, Inc. Nofees are charged for these guarantee agreements.
Outstanding balances at year-end are unsecured, interest free and settlement occurs in cash. Theseprincipally consist of dividends, advances, reimbursement of expenses and management income.As of December 31, 2016 and 2015 the Group has not made any provision for impairment lossrelating to amounts owed by related parties. This assessment is undertaken each financial year byexamining the financial position of the related party and the market in which the related partyoperates.
Except as stated in Notes 20 and 21 to the consolidated financial statements, there have been noguarantees provided or received for any related party receivables or payables.
The compensation of key management personnel by benefit type follows:
2016 2015 2014Short-term employee benefits P=129,966,238 P=99,131,155 P=93,390,694Post-employment benefits 39,221,549 16,331,896 15,738,284
P=169,187,787 P=115,463,051 P=109,128,978
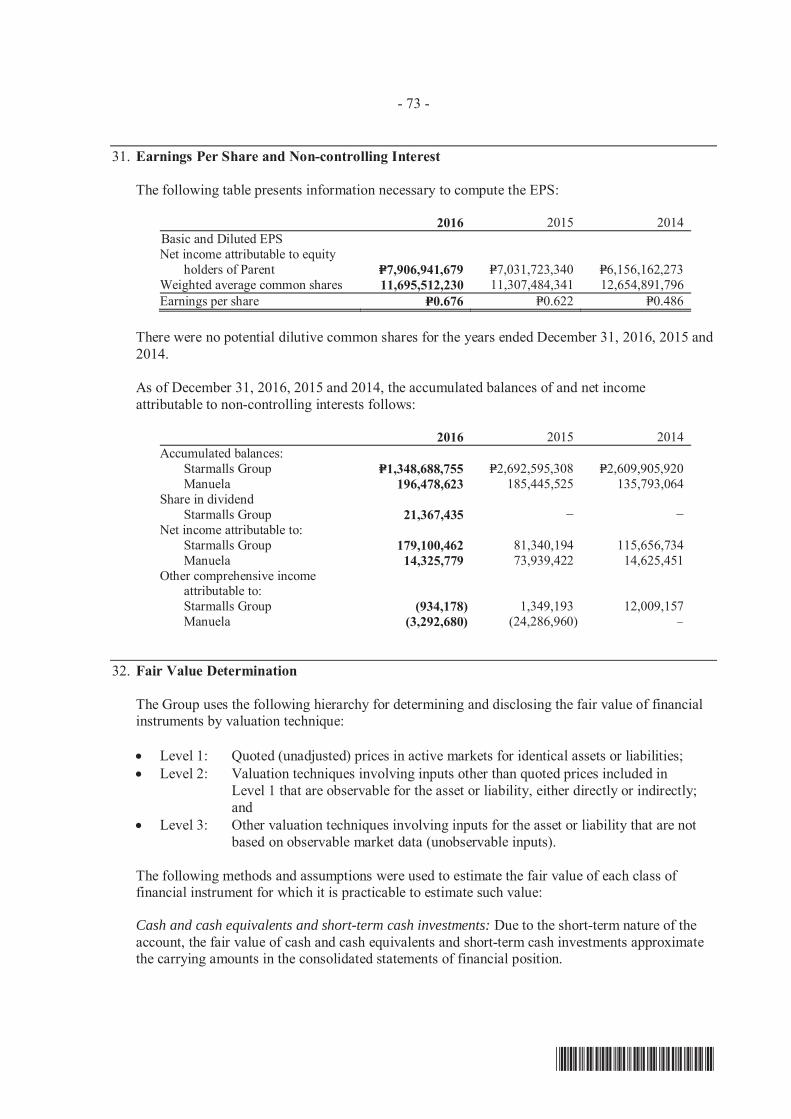
- 73 -
*SGVFS021624*
31. Earnings Per Share and Non-controlling Interest
The following table presents information necessary to compute the EPS:
2016 2015 2014Basic and Diluted EPSNet income attributable to equity
holders of Parent P=7,906,941,679 P=7,031,723,340 P=6,156,162,273Weighted average common shares 11,695,512,230 11,307,484,341 12,654,891,796Earnings per share P=0.676 P=0.622 P=0.486
There were no potential dilutive common shares for the years ended December 31, 2016, 2015 and2014.
As of December 31, 2016, 2015 and 2014, the accumulated balances of and net incomeattributable to non-controlling interests follows:
2016 2015 2014Accumulated balances:
Starmalls Group P=1,348,688,755 P=2,692,595,308 P=2,609,905,920Manuela 196,478,623 185,445,525 135,793,064
Share in dividendStarmalls Group 21,367,435
Net income attributable to:Starmalls Group 179,100,462 81,340,194 115,656,734Manuela 14,325,779 73,939,422 14,625,451
Other comprehensive incomeattributable to:Starmalls Group (934,178) 1,349,193 12,009,157Manuela (3,292,680) (24,286,960) –
32. Fair Value Determination
The Group uses the following hierarchy for determining and disclosing the fair value of financialinstruments by valuation technique:
Level 1: Quoted (unadjusted) prices in active markets for identical assets or liabilities; Level 2: Valuation techniques involving inputs other than quoted prices included in
Level 1 that are observable for the asset or liability, either directly or indirectly; and
Level 3: Other valuation techniques involving inputs for the asset or liability that are notbased on observable market data (unobservable inputs).
The following methods and assumptions were used to estimate the fair value of each class offinancial instrument for which it is practicable to estimate such value:
Cash and cash equivalents and short-term cash investments: Due to the short-term nature of theaccount, the fair value of cash and cash equivalents and short-term cash investments approximatethe carrying amounts in the consolidated statements of financial position.

- 74 -
*SGVFS021624*
Installment contracts receivables: Estimated fair value of installment contracts receivables isbased on the discounted value of future cash flows using the prevailing interest rates for similartypes of receivables as of the reporting date using the remaining terms of maturity. The discountrate used ranged from 1.57% to 3.79% in 2016 and 1.20% to 5.80% in 2015.
Other receivables: Due to the short-term nature of the account, the fair value of other receivablesapproximates the carrying amounts.
Receivables from related parties: Due to the short-term nature of the account, carrying amountsapproximate their fair values.
AFS financial assets: For AFS investment in unquoted equity securities, these are carried andpresented at cost since fair value is not reasonably determine due to the unpredictable nature offuture cash flows and without any other suitable methods of arriving at a reliable fair value.
The AFS financial assets carried at cost are preferred shares of a utility company issued to theGroup as a consequence of its subscription to the electricity services of the said utility companyneeded for the Group’s residential units. The said preferred shares have no active market and theGroup does not intend to dispose these because these are directly related to the continuity of itsbusiness.
For shares in open ended investment companies, fair value is by reference to net asset value pershare.
HTM investments: The fair value of HTM investments that are actively traded in organizedfinancial markets is determined by reference to quoted market bid prices, at the close of businesson the reporting date.
Investment properties: The valuation techniques adopted for the measurement of fair values arethe market approach for the land and cost approach for the buildings and building improvements.Accounts and other payables: fair values of accounts and other payables approximate theircarrying amounts in the consolidated statement of financial position due to the short-term natureof the transactions.
Payables to related parties: Due to the short-term nature of the account, carrying amountsapproximate their fair values.
Bank loans, loans payable, notes payable and liabilities for purchased land: Estimated fair valuesof bank loans and liabilities for purchased land are based on the discounted value of future cashflows using the applicable rates for similar types of loans. Interest rates used in discounting cashflows ranges from 2.45% to 7.45% for 2016 and 2.67% to 8.03% in 2015

- 75 -
*SGVFS021624*
The following table provides the fair value measurement hierarchy of the Group’s financial assetsand liabilities recognized as of December 31, 2016 and 2015:
December 31, 2016Level 1 Level 2 Level 3 Total
AssetsFinancial assets measured at fair value:
AFS financial assets - fixed maturitybond funds P=8,079,227,776 P=– P=– P=8,079,227,776
AFS financial assets - equitysecurities 3,774,100,001 3,204,170 3,777,304,171
Assets for which fair values are disclosed:Installment contract receivables 29,157,814,080 29,157,814,080Investment properties - land 28,344,294,702 28,344,294,702HTM investments 20,915,051,920 20,915,051,920
LiabilitiesFinancial liabilities measured at fair valueBank loans 36,462,525,254 36,462,525,254Loans payable 39,525,115,571 39,525,115,571Liabilities for purchased land 3,276,611,919 3,276,611,919
December 31, 2015Level 1 Level 2 Level 3 Total
AssetsFinancial assets measured at fair value:
AFS financial assets - fixed maturitybond funds P=7,244,717,725 P=– P=– P=7,244,717,725
Assets for which fair values are disclosed:Installment contract receivables – – 26,430,215,542 26,430,215,542Investment properties - land – 28,258,460,602 – 28,258,460,602HTM investments 14,127,412,000 – – 14,127,412,000
LiabilitiesFinancial liabilities measured at fair valueBank loans – – 30,539,740,751 30,539,740,751Loans payable – – 30,428,907,668 30,428,907,668Liabilities for purchased land – – 2,460,957,759 2,460,957,759
In 2016 and 2015, there were no transfers between Level 1 and Level 2 fair value measurements.Non-financial assets determined under Level 3 include installments contracts receivables andlong-term cash investments. No transfers between any levels of the fair value hierarchy took placein the equivalent comparative period.
Description of significant unobservable inputs to valuation:
Account Valuation Technique Significant Unobservable InputsInstallment contracts receivables Discounted cash flow analysis Discount rate
Land Market Data ApproachPrice per square meter, size,location, shape, time element andcorner influence
33. Financial Asset and Liabilities
Financial Risk Management Objectives and PoliciesFinancial riskThe Group’s principal financial liabilities comprise of bank loans, loans payable, notes payable,accounts and other payables and liabilities for purchased land. The main purpose of the Group’sfinancial liabilities is to raise financing for the Group’s operations. The Group has variousfinancial assets such as installment contracts receivables, cash and cash equivalents and short-term, long-term cash investments, HTM investments and AFS financial assets which arise directly

- 76 -
*SGVFS021624*
from its operations. The main risks arising from the use of financial instruments are interest raterisk, foreign currency risk, credit risk, equity price risk and liquidity risk.
The BOD reviews and approves with policies for managing each of these risks. The Groupmonitors market price risk arising from all financial instruments and regularly report financialmanagement activities and the results of these activities to the BOD.
The Group’s risk management policies are summarized below. The exposure to risk and how theyarise, as well as the Group’s objectives, policies and processes for managing the risk and themethods used to measure the risk did not change from prior years.
Cash flow interest rate riskThe Group’s exposure to market risk for changes in interest rates, relates primarily to its financialassets and liabilities that are interest-bearing.
The Group’s policy is to manage its interest cost by entering into fixed rate debts. The Group alsoregularly enters into short-term loans as it relates to its sold installment contracts receivables inorder to cushion the impact of potential increase in loan interest rates.
The table below shows the financial assets and liabilities that are interest-bearing for the years2016 and 2015:
December 31, 2016Effective
Interest Rate AmountFinancial assetsFixed rateCash and cash equivalents (excluding cash on hand) 0.10% to 0.50% P=8,879,974,838Short-term cash investments 1.37% to 2.50% 99,998,562HTM investments 1.33% to 3.12% 20,851,608,453Installment contracts receivable 1.33% to 3.50% 29,157,514,308
P=58,989,096,161
Financial liabilitiesFixed rateNotes payable 4.25% to 12.00% P=39,525,115,572Bank loans 3.57% to 11.50% 36,087,242,292Loans payable 1.50% to10.00% 3,887,252,607Liabilities for purchased land 1.49% to 2.38% 3,537,672,591
P=83,037,283,062
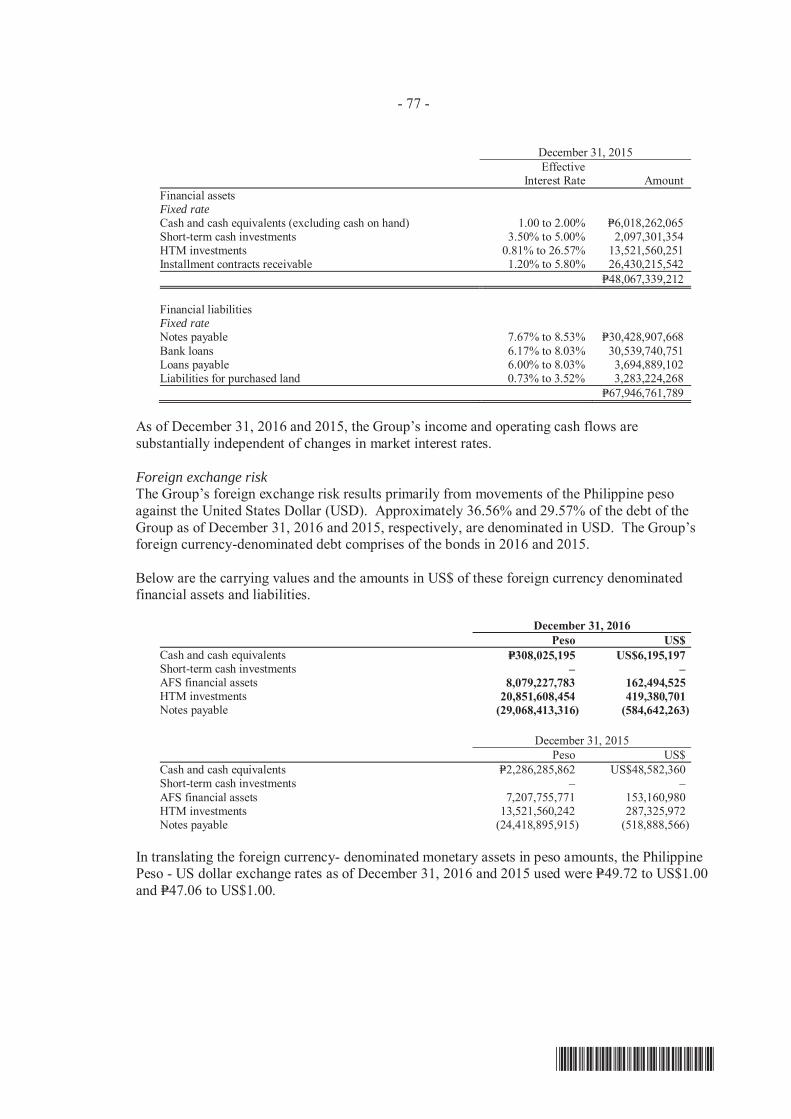
- 77 -
*SGVFS021624*
December 31, 2015Effective
Interest Rate AmountFinancial assetsFixed rateCash and cash equivalents (excluding cash on hand) 1.00 to 2.00% P=6,018,262,065Short-term cash investments 3.50% to 5.00% 2,097,301,354HTM investments 0.81% to 26.57% 13,521,560,251Installment contracts receivable 1.20% to 5.80% 26,430,215,542
P=48,067,339,212
Financial liabilitiesFixed rateNotes payable 7.67% to 8.53% P=30,428,907,668Bank loans 6.17% to 8.03% 30,539,740,751Loans payable 6.00% to 8.03% 3,694,889,102Liabilities for purchased land 0.73% to 3.52% 3,283,224,268
P=67,946,761,789
As of December 31, 2016 and 2015, the Group’s income and operating cash flows aresubstantially independent of changes in market interest rates.
Foreign exchange riskThe Group’s foreign exchange risk results primarily from movements of the Philippine pesoagainst the United States Dollar (USD). Approximately 36.56% and 29.57% of the debt of theGroup as of December 31, 2016 and 2015, respectively, are denominated in USD. The Group’sforeign currency-denominated debt comprises of the bonds in 2016 and 2015.
Below are the carrying values and the amounts in US$ of these foreign currency denominatedfinancial assets and liabilities.
December 31, 2016Peso US$
Cash and cash equivalents P=308,025,195 US$6,195,197Short-term cash investments – –AFS financial assets 8,079,227,783 162,494,525HTM investments 20,851,608,454 419,380,701Notes payable (29,068,413,316) (584,642,263)
December 31, 2015Peso US$
Cash and cash equivalents P=2,286,285,862 US$48,582,360Short-term cash investments – –AFS financial assets 7,207,755,771 153,160,980HTM investments 13,521,560,242 287,325,972Notes payable (24,418,895,915) (518,888,566)
In translating the foreign currency- denominated monetary assets in peso amounts, the PhilippinePeso - US dollar exchange rates as of December 31, 2016 and 2015 used were P=49.72 to US$1.00and P=47.06 to US$1.00.
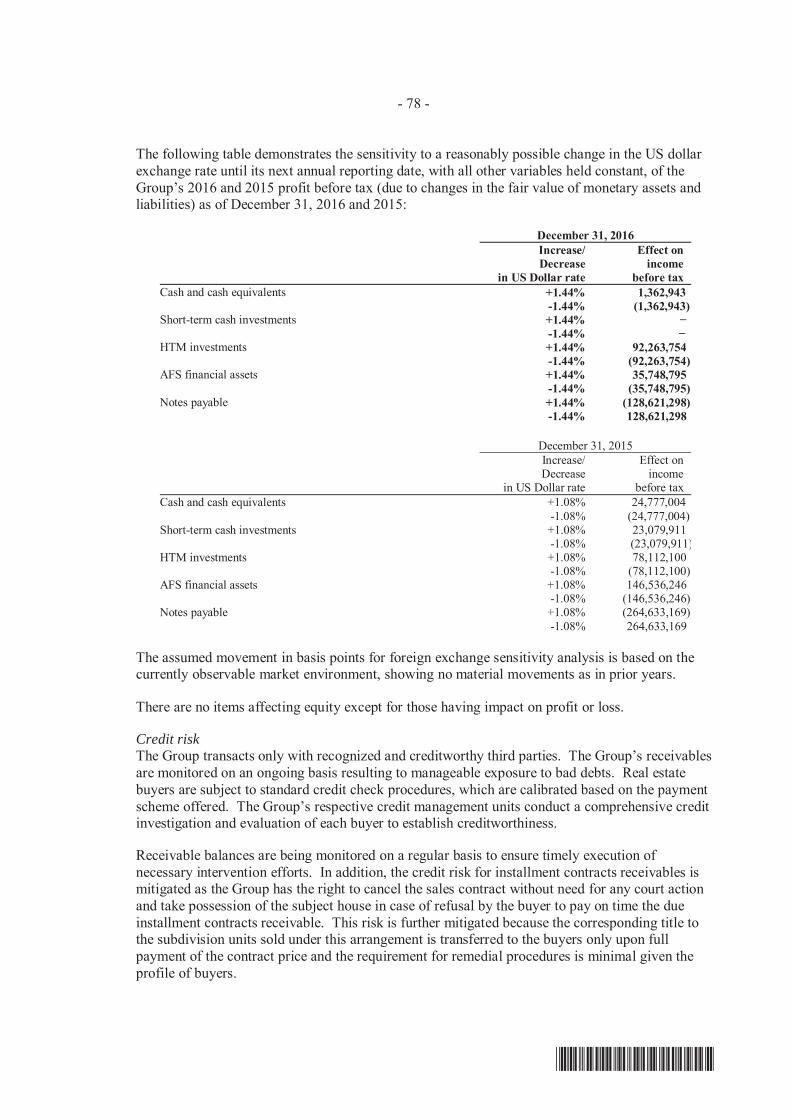
- 78 -
*SGVFS021624*
The following table demonstrates the sensitivity to a reasonably possible change in the US dollarexchange rate until its next annual reporting date, with all other variables held constant, of theGroup’s 2016 and 2015 profit before tax (due to changes in the fair value of monetary assets andliabilities) as of December 31, 2016 and 2015:
December 31, 2016Increase/Decrease
in US Dollar rate
Effect onincome
before taxCash and cash equivalents +1.44% 1,362,943
-1.44% (1,362,943)Short-term cash investments +1.44%
-1.44%HTM investments +1.44% 92,263,754
-1.44% (92,263,754)AFS financial assets +1.44% 35,748,795
-1.44% (35,748,795)Notes payable +1.44% (128,621,298)
-1.44% 128,621,298
December 31, 2015Increase/Decrease
in US Dollar rate
Effect onincome
before taxCash and cash equivalents +1.08% 24,777,004
-1.08% (24,777,004)Short-term cash investments +1.08% 23,079,911
-1.08% (23,079,911)HTM investments +1.08% 78,112,100
-1.08% (78,112,100)AFS financial assets +1.08% 146,536,246
-1.08% (146,536,246)Notes payable +1.08% (264,633,169)
-1.08% 264,633,169
The assumed movement in basis points for foreign exchange sensitivity analysis is based on thecurrently observable market environment, showing no material movements as in prior years.
There are no items affecting equity except for those having impact on profit or loss.
Credit riskThe Group transacts only with recognized and creditworthy third parties. The Group’s receivablesare monitored on an ongoing basis resulting to manageable exposure to bad debts. Real estatebuyers are subject to standard credit check procedures, which are calibrated based on the paymentscheme offered. The Group’s respective credit management units conduct a comprehensive creditinvestigation and evaluation of each buyer to establish creditworthiness.
Receivable balances are being monitored on a regular basis to ensure timely execution ofnecessary intervention efforts. In addition, the credit risk for installment contracts receivables ismitigated as the Group has the right to cancel the sales contract without need for any court actionand take possession of the subject house in case of refusal by the buyer to pay on time the dueinstallment contracts receivable. This risk is further mitigated because the corresponding title tothe subdivision units sold under this arrangement is transferred to the buyers only upon fullpayment of the contract price and the requirement for remedial procedures is minimal given theprofile of buyers.

- 79 -
*SGVFS021624*
With respect to credit risk arising from the other financial assets of the Group, which arecomprised of cash and cash equivalents, short-term and long-term cash investments and AFSfinancial assets, the Group’s exposure to credit risk arises from default of the counterparty, with amaximum exposure equal to the carrying amount of these instruments. The Group manages itscash by maintaining cash accounts with banks which have demonstrated financial soundness forseveral years. The Group’s investments in AFS are incidental to its housing projects and areconsidered by the Group to be of high quality because these are investments with the biggestelectric utility company in the country.
The table below shows the comparative summary of maximum credit risk exposure on financialassets as of December 31, 2016 and 2015:
2016Maximum
Credit ExposureFair Value of
CollateralNet Exposure to
Credit RiskFinancial
EffectLoans and ReceivablesCash and cash equivalents (excluding cash on hand) P=8,879,974,432 P=– P=8,879,974,432 P=–Short-term cash investments 99,998,562 – 99,998,562 –Receivables Installment contracts receivables 28,123,412,383 36,892,198,739 – 28,123,412,383 Others 9,811,601,814 – 9,811,601,814 –
46,914,987,191 36,892,198,739 18,791,574,808 28,123,412,383HTM investments 20,851,608,454 – 20,851,608,454 –AFS Financial AssetsInvestments in fixed maturity bond funds 8,079,227,776 – 8,079,227,776 –Investments in unquoted equity shares 96,248,934 – 96,248,934 –
P=75,942,072,355 P=36,892,198,739 P=47,818,659,972 P=28,123,412,383
2015Maximum
Credit ExposureFair Value of
CollateralNet Exposure to
Credit RiskFinancial
EffectLoans and ReceivablesCash and cash equivalents (excluding cash on hand) P=6,018,262,065 P=– P=6,018,262,065 P=–Short-term cash investments 2,097,301,354 – 2,097,301,354 –Receivables Installment contracts receivables 26,430,215,542 32,737,769,428 – 26,430,215,542 Others 7,824,245,579 – 7,824,245,579 –
42,370,024,540 32,737,769,428 15,939,808,998 26,430,215,542HTM investments 13,521,560,251 – 13,521,560,251 –AFS Financial AssetsInvestments in fixed maturity bond funds 7,244,717,725 – 7,244,717,725 –Investments in unquoted equity shares 134,248,934 – 134,248,934 –
P=63,270,551,450 P=32,737,769,428 P=36,840,335,908 P=26,430,215,542

- 80
-
*SGVFS021624*
Giv
en th
e G
roup
’s d
iver
se b
ase
of c
ount
erpa
rties
, it i
s no
t exp
osed
to la
rge
conc
entra
tions
of c
redi
t ris
k.A
s of
Dec
embe
r 31,
201
6 an
d 20
15, t
he a
ging
ana
lyse
s of
pas
t due
but
not
impa
ired
rece
ivab
les,
pre
sent
ed p
er c
lass
are
as
follo
ws:
Dec
embe
r 31
, 201
6
Nei
ther
Pas
tT
otal
of P
ast
Impa
ired
Due
Nor
Past
Due
But
Not
Impa
ire d
Due
But
Not
Fina
ncia
lIm
pair
ed<3
0 da
ys30
-60
days
60-9
0 da
ys>9
0 da
ysIm
pair
edA
sset
sT
otal
Insta
llmen
t con
tract
rece
ivab
les
P=25,
309,
207,
745
P=315
,834
,095
P=416
,439
,292
P=245
,423
,707
P=1,7
16,2
17,2
90P=2
,693
,914
,384
P=120
,290
,254
P=28,
123,
412,
383
Oth
er re
ceiv
able
s6,
259,
366,
612
857,
881,
681
83,7
37,8
1148
,887
,078
2,28
8,67
5,79
23,
279,
182,
362
273,
052,
840
9,81
1,60
1,81
4To
tal
P=31,
568,
574,
357
P=1,1
73,7
15,7
76P=5
00,1
77,1
03P=2
94,3
10,7
85P=4
,004
,893
,082
P=5,9
73,0
96,7
46P=3
93,3
43,0
94P=3
7,93
5,01
4,19
7
Dec
embe
r 31,
201
5
Nei
ther
Pas
tTo
tal o
f Pas
tIm
paire
dD
ue N
orPa
st D
ue B
ut N
ot Im
paire
dD
ue B
ut N
otFi
nanc
ial
Impa
ired
<30
days
30-6
0 da
ys60
-90
days
>90
days
Impa
ired
Ass
ets
Tota
lIn
stallm
ent c
ontra
ct re
ceiv
able
sP=2
3,56
0,43
1,71
8P=6
26,8
10,4
65P=1
44,9
27,1
31P=2
33,2
99,1
26P=1
,727
,693
,757
P=2,7
32,7
30,4
79P=1
37,0
53,3
45P=2
6,43
0,21
5,54
2O
ther
rece
ivab
les
5,29
5,92
3,16
218
3,51
8,42
624
3,90
4,40
520
1,72
2,97
52,
036,
229,
956
2,66
5,37
5,76
225
5,25
1,04
48,
216,
549,
968
Tota
lP=2
8,85
6,35
4,88
0P=8
10,3
28,8
91P=3
88,8
31,5
36P=4
35,0
22,1
01P=3
,763
,923
,713
P=5,3
98,1
06,2
41P=3
92,3
04,3
89P=3
4,64
6,76
5,51
0
Thos
e ac
coun
ts th
at a
re c
onsi
dere
d ne
ither
pas
t due
nor
impa
ired
are
rece
ivab
les
with
out a
ny d
efau
lt in
pay
men
ts an
d th
ose
acco
unts
whe
rein
the
man
agem
ent h
asas
sess
ed th
at re
cove
rabi
lity
is hi
gh.
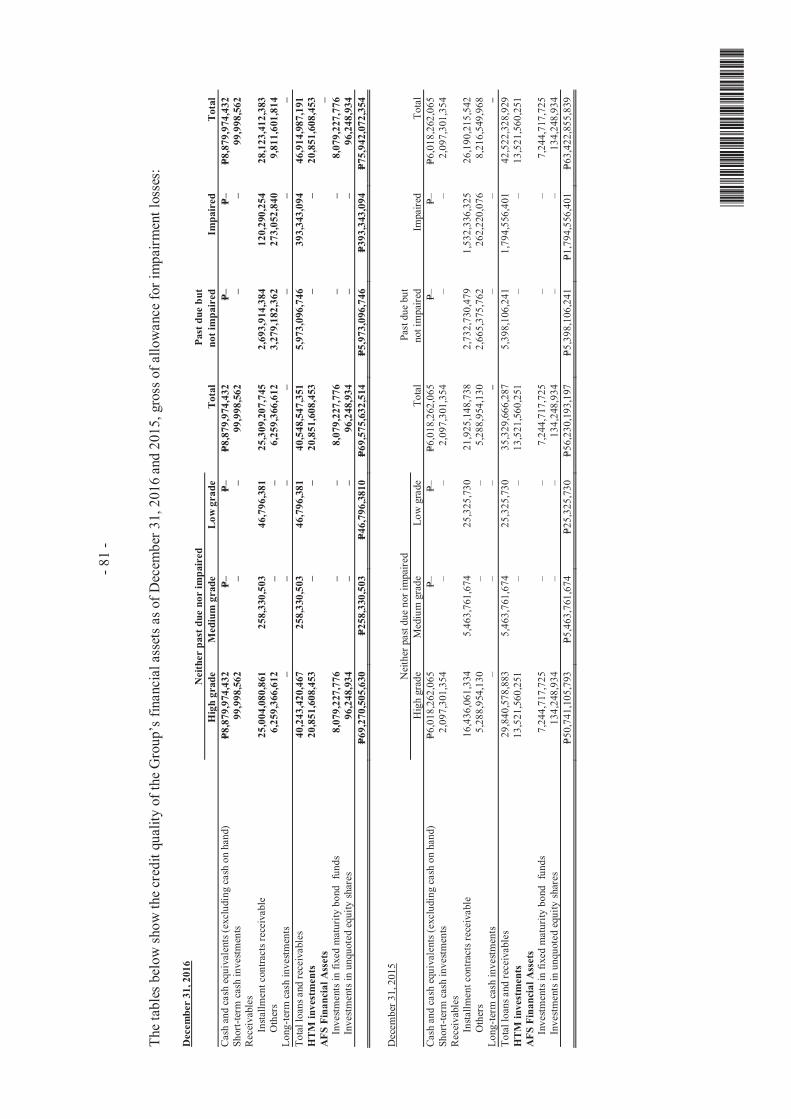
- 81
-
*SGVFS021624*
The
tabl
es b
elow
show
the
cred
it qu
ality
of t
he G
roup
’s fi
nanc
ial a
sset
s as o
f Dec
embe
r 31,
201
6 an
d 20
15, g
ross
of a
llow
ance
for i
mpa
irmen
t los
ses:
Dec
embe
r 31
, 201
6N
eith
er p
ast d
ue n
or im
pair
edPa
st d
ue b
utH
igh
grad
eM
ediu
m g
rade
Low
gra
deT
otal
not i
mpa
ired
Impa
ired
Tot
alCa
sh a
nd c
ash
equi
vale
nts (
excl
udin
g ca
sh o
n ha
nd)
P=8,8
79,9
74,4
32P=–
P=–P=8
,879
,974
,432
P=–P=–
P=8,8
79,9
74,4
32Sh
ort-t
erm
cas
h in
vestm
ents
99,9
98,5
62–
–99
,998
,562
––
99,9
98,5
62R
ecei
vabl
es
Insta
llmen
t con
tract
s rec
eiva
ble
25,0
04,0
80,8
6125
8,33
0,50
346
,796
,381
25,3
09,2
07,7
452,
693,
914,
384
120,
290,
254
28,1
23,4
12,3
83
Oth
ers
6,25
9,36
6,61
2–
–6,
259,
366,
612
3,27
9,18
2,36
227
3,05
2,84
09,
811,
601,
814
Long
-term
cas
h in
vestm
ents
––
––
––
–To
tal l
oans
and
rece
ivab
les
40,2
43,4
20,4
6725
8,33
0,50
346
,796
,381
40,5
48,5
47,3
515,
973,
096,
746
393,
343,
094
46,9
14,9
87,1
91H
TM
inve
stm
ents
20,8
51,6
08,4
53–
–20
,851
,608
,453
––
20,8
51,6
08,4
53A
FS F
inan
cial
Ass
ets
–In
vestm
ents
in fi
xed
mat
urity
bon
d fu
nds
8,07
9,22
7,77
6–
–8,
079,
227,
776
––
8,07
9,22
7,77
6In
vest
men
ts in
unq
uote
d eq
uity
sha
res
96,2
48,9
34–
–96
,248
,934
––
96,2
48,9
34P=6
9,27
0,50
5,63
0P=2
58,3
30,5
03P=4
6,79
6,38
10P=6
9,57
5,63
2,51
4P=5
,973
,096
,746
P=393
,343
,094
P=75,
942,
072,
354
Dec
embe
r 31,
201
5N
eith
er p
ast d
ue n
or im
paire
dPa
st d
ue b
utH
igh
grad
eM
ediu
m g
rade
Low
gra
deTo
tal
not i
mpa
ired
Impa
ired
Tota
lCa
sh a
nd c
ash
equi
vale
nts (
excl
udin
g ca
sh o
n ha
nd)
P=6,0
18,2
62,0
65P=–
P=–P=6
,018
,262
,065
P=–P=–
P=6,0
18,2
62,0
65Sh
ort-t
erm
cas
h in
vestm
ents
2,09
7,30
1,35
4–
–2,
097,
301,
354
––
2,09
7,30
1,35
4R
ecei
vabl
es
Insta
llmen
t con
tract
s rec
eiva
ble
16,4
36,0
61,3
345,
463,
761,
674
25,3
25,7
3021
,925
,148
,738
2,73
2,73
0,47
91,
532,
336,
325
26,1
90,2
15,5
42
Oth
ers
5,28
8,95
4,13
0–
–5,
288,
954,
130
2,66
5,37
5,76
226
2,22
0,07
68,
216,
549,
968
Long
-term
cas
h in
vestm
ents
––
––
–To
tal l
oans
and
rece
ivab
les
29,8
40,5
78,8
835,
463,
761,
674
25,3
25,7
3035
,329
,666
,287
5,39
8,10
6,24
11,
794,
556,
401
42,5
22,3
28,9
29H
TM
inve
stm
ents
13,5
21,5
60,2
51–
–13
,521
,560
,251
––
13,5
21,5
60,2
51A
FS F
inan
cial
Ass
ets
Inve
stmen
ts in
fixe
d m
atur
ity b
ond
fund
s7,
244,
717,
725
––
7,24
4,71
7,72
5–
–7,
244,
717,
725
Inve
stm
ents
in u
nquo
ted
equi
ty s
hare
s13
4,24
8,93
4–
–13
4,24
8,93
4–
–13
4,24
8,93
4P=5
0,74
1,10
5,79
3P=5
,463
,761
,674
P=25,
325,
730
P=56,
230,
193,
197
P=5,3
98,1
06,2
41P=1
,794
,556
,401
P=63,
422,
855,
839

- 82 -
*SGVFS021624*
High grade cash and cash equivalents and short-term and long-term cash investments are moneymarket placements and working cash fund placed, invested or deposited in local banks belongingto the top ten banks in the Philippines in terms of resources and profitability.
The Group’s high-grade receivables pertain to receivables from related parties and third partieswhich, based on experience, are highly collectible or collectible on demand, and of whichexposure to bad debt is not significant. Installment contract receivables under bank-financing areassessed to be high grade since accounts under bank-financing undergone credit evaluationperformed by two parties, the Group and the respective bank, thus credit evaluation underwent amore stringent criteria resulting to higher probability of having good quality receivables.
Medium grade accounts are active accounts with minimal to regular instances of payment default,due to ordinary/common collection issues. These accounts are typically not impaired as thecounterparties generally respond to credit actions and update their payments accordingly.
Low grade accounts are accounts which have probability of impairment based on historical trend.
Based on the Group’s experience, its loans and receivables are highly collectible or collectible ondemand. The receivables are collateralized by the corresponding real estate properties. In fewcases of buyer defaults, the Group can repossess the collateralized properties and held it for sale inthe ordinary course of business at the prevailing market price. The total of repossessed propertiesincluded in the “Real estate inventories” account in the consolidated statement of financialposition amounted to P=190.40 million, P=758.01 million and P=467.92 million as of December 31,2016, 2015 and 2014, respectively. The Group performs certain repair activities on the saidrepossessed assets in order to put their condition at a marketable state. Costs incurred in bringingthe repossessed assets to its marketable state are included in their carrying amounts.
The Group did not accrue any interest income on impaired financial assets.
Liquidity RiskThe Group monitors its cash flow position, debt maturity profile and overall liquidity position inassessing its exposure to liquidity risk. The Group maintains a level of cash deemed sufficient tofinance its cash requirements. Operating expenses and working capital requirements aresufficiently funded through cash collections. The Group’s loan maturity profile is regularlyreviewed to ensure availability of funding through adequate credit facilities with banks and otherfinancial institutions.
The extent and nature of exposures to liquidity risk and how they arise as well as the Group’sobjectives, policies and processes for managing the risk and the methods used to measure the riskare the same for 2016 and 2015.
Equity Price RiskThe Group's equity price risk exposure relates to financial assets whose values will fluctuate as aresult of changes in market prices, principally investment in mutual funds classified as AFSfinancial assets. Such securities are subject to price risk due to possible adverse changes in marketvalues of instruments arising from factors specific to individual instruments or their issuers orfactors affecting all instruments traded in the market. The Group invests in equity securities forvarious reasons, including reducing its overall exposure to interest rate risk.

- 83 -
*SGVFS021624*
In 2016, the Group determined the reasonably possible change in index using the specific adjusteddata for each equity security the Group holds as of the reporting dates. The adjusted data is theforecasted measure of the volatility of security or a portfolio in comparison to the market as awhole.
The analysis below is performed for reasonably possible movements in NAV per share with allother variables held constant, showing the impact on equity (that reflects adjustments due tochanges in market value of AFS financial assets):
Change inNAV per
ShareImpact on
EquityDecember 31, 2016 +9.51% P=3,004,878
-9.51% (3,004,878)
Change inNAV per
ShareImpact on
EquityDecember 31, 2015 +7.64% P=2,824,230
-7.64% (2,824,230)
The Group manages exposures to price risk by monitoring the changes in the market price of theinvestments and at some extent, diversifying the investment portfolio in accordance with the limitset by management.
Maturity Profile of Financial Assets and LiabilitiesThe tables below summarize the maturity profile of the Group’s financial assets and liabilities asof December 31, 2016 and 2015 based on undiscounted contractual payments, including interestreceivable and payable.
December 31, 2016
On Demand1 to
3 Months3 to
12 Months1 to
5 Years TotalFinancial AssetsLoans and receivablesCash and cash equivalents P=5,699,507,743 P=3,203,030,195 P=– P=– P=8,902,537,938Short-term cash investments – – 96,944,262 – 96,944,262Receivables from related parties – – 3,916,669,458 – 3,916,669,458Receivables
Installment contracts receivables 9,865,911,150 3,137,785,500 6,893,212,488 8,226,503,245 28,123,412,383Others 6,012,800,077 990,381,496 2,808,420,241 9,811,601,814
Long-term cash investment – – – – –HTM investments – – 1,709,730,739 19,141,877,715 20,851,608,454AFS Financial Assets
Investments mutual funds 254,929,521 1,537,597,600 6,286,700,655 8,079,227,776Investments in unquoted
equity shares 96,248,934 – – – 96,248,934Total undiscounted financial assets P=21,674,467,904 P=7,586,126,712 P=16,962,574,788 P=33,655,081,615 P=79,878,251,019
Financial LiabilitiesFinancial liabilities at amortized costBank loans P=4,760,773 P=23,246,444 P=5,936,148,446 P=30,498,369,589 P=36,462,525,252Loans payable 3,537,672 286,147,688 832,862,703 2,764,704,543 3,887,252,606Liabilities for purchased land 475,421,547 352,118,432 1,018,500,974 1,809,275,473 3,655,316,426Accounts payable and other payables 5,593,805,022 1,421,696,692 1,018,500,975 2,145,165,315 10,179,168,004Notes payable 208,061,469 259,561,469 5,047,000,000 5,514,622,938Total undiscounted financial liabilities P=6,077,525,014 P=2,291,270,725 P=9,065,574,567 P=42,264,514,920 P=59,698,885,226

- 84 -
*SGVFS021624*
December 31, 2015
On Demand1 to
3 Months3 to
12 Months1 to
5 Years TotalFinancial AssetsLoans and receivablesCash and cash equivalents P=5,263,434,561 P=779,621,875 P=– P=– P=6,043,056,436Short-term cash investments – – 2,097,301,354 – 2,097,301,354Receivables from related parties – – 3,450,908,441 – 3,450,908,441Receivables
Installment contracts receivables 1,041,641,598 2,051,685,782 14,010,871,913 9,326,016,249 26,430,215,542Others 3,305,740,034 2,973,294,317 1,545,211,228 7,824,245,579
Long-term cash investment – – – – –HTM investments – – – 13,521,560,251 13,521,560,251AFS Financial Assets
Investments mutual funds 7,244,717,725 – – – 7,244,717,725Investments in unquoted
equity shares 134,248,934 – – – 134,248,934Total undiscounted financial assets P=16,989,782,852 P=5,804,601,974 P=21,104,292,936 P=22,847,576,500 P=66,746,254,262
Financial LiabilitiesFinancial liabilities at amortized costBank loans P=61,494,697 P=762,223,814 P=12,911,064,635 P=16,804,957,605 P=30,539,740,751Loans payable 3,699,824 75,568,680 263,803,473 3,351,817,125 3,694,889,102Liabilities for purchased land 18,879,176 304,929,526 882,596,001 2,076,819,565 3,283,224,268Accounts payable and other payables 2,828,920,422 4,232,844,323 2,055,952,130 859,648,692 9,977,365,567Notes payable 735,422,926 29,693,484,742 30,428,907,668Total undiscounted financial liabilities P=2,912,994,119 P=5,375,566,343 P=16,848,839,165 P=52,786,727,729 P=77,924,127,356
34. Lease Commitments
The Group as LesseeThe Group has entered into noncancelable operating lease agreements for its several branchoffices with terms of one to five years. The lease agreements include escalation clauses that allowa reasonable increase in rates. The leases are payable on a monthly basis and are renewable undercertain terms and conditions.
Future minimum rentals payable under non-cancellable operating leases as of December 31, 2016and 2015 follow:
2016 2015Within one (1) year P=235,916,879 P=169,488,621After 1 year but not more than five (5) years 882,978,925 2,698,720,436
P=1,118,895,804 P=2,868,209,057
Rent expense included in the statements of comprehensive income for the years endedDecember 31, 2016, 2015 and 2014 amounted to P=136.70 million, P=142.71 million andP=171.21 million, respectively (Note 26).
The Group as LessorThe Group has entered into property leases on its investment property portfolio, consisting of theGroup’s surplus office spaces. These noncancelable leases have remaining lease terms of belowfifteen (15) years. All leases include a clause to enable upward revision of the rental charge on anannual basis based on prevailing market conditions.

- 85 -
*SGVFS021624*
Future minimum rentals receivable under noncancelable operating leases as of December 31, 2016and 2015 follow:
2016 2015Within 1 year P=2,265,562,198 P=1,246,280,635After 1 year but not more than 5 years 8,846,993,112 2,214,310,948More than 5 years 7,002,260,095 893,246,101
P=18,114,815,405 P=4,353,837,684
Rental income included in the statements of comprehensive income for the years endedDecember 31, 2016, 2015 and 2014 amounted to P=4,375.33 million, P=2,367.88 million andP=1,567.76 million, respectively (Note 24).
35. Notes to Consolidated Statements of Cash Flows
The Group’s noncash investing and financing activities pertain to the following:
a) Transfers from land and improvements to real estate inventories amounting P=1,652.12 million,P=4,056.79 million and P=2,187.79 million in 2016, 2015 and 2014, respectively.
b) Transfers from property and equipment to investment property amounting to P=62.72 million in2015 and P=12.09 million in 2014. There are no transfers in 2016.
c) Purchase of land that are payable from one to three years amounting P=609.93 million,P=2,606.29 million, and P=3,016.21 million in 2016, 2015 and 2014, respectively.
d) In 2016, pension liability amounting P=13.22 million was transferred to a related party.
Under the receivable discounting arrangements, the Group applies collections from installmentcontracts receivables against loans payable. The group considers the turnover of the receipts andpayments under this type of arrangement as quicker and relatively shorter. Where the Groupconsiders a quick turnaround, the receipts and payments are reported on a net basis. The effects onthe cash flows arising from financing activities presented on a net basis follow:
2016 2015 2014Proceeds from loans payable P=2,243,997,645 P=3,003,541,462 P=1,558,940,173Collection of installment contract receivables (1,839,906,656) (1,970,343,823) (2,017,760,661)Proceeds from loans payable -net P=404,090,989 P=1,033,197,639 (P=458,820,488)
2016 2015 2014Payments of loans payable (P=1,839,906,656) (P=1,970,343,823) (P=2,017,760,661)Collection of installment contract receivables 1,839,906,656 1,970,343,823 2,017,760,661Payments of loans payable - net P= P= P=
- 86 -
*SGVFS021624*
36. Commitments and Contingencies
The Group has entered into several contracts with contractors for the development of its real estateproperties. As of December 31, 2016 and 2015, these contracts have an estimated aggregate costof P=8,728.40 million and P=10,409.89 million, respectively. These contracts are due to becompleted on various dates starting January 2014 up to December 2020.
The progress billings are settled within one year from date of billings. These are unsecuredobligations and carried at cost.
The Group has various contingent liabilities from legal cases arising from the ordinary course ofbusiness which are either pending decision by the courts or are currently being contested by theGroup, the outcome of which are not presently determinable.
In the opinion of the management and its legal counsel, the eventual liability under these lawsuitsor claims, if any, will not have a material or adverse effect in the Group’s financial position andresults of operations.
37. Approval of the Financial Statements
The consolidated financial statements of the Group as of December 31, 2016 and 2015 and foreach of the three years in the period ended December 31, 2016 were authorized for issue by theBOD on March 20, 2017.

*SGVFS021624*
INDEPENDENT AUDITOR’S REPORTON SUPPLEMENTARY SCHEDULES
The Stockholders and the Board of DirectorsVista Land & Lifescapes, Inc.3rd Level Starmall Las PiñasCV Starr Avenue, Philamlife VillagePamplona, Las Piñas City
We have audited in accordance with Philippine Standards on Auditing the accompanying consolidatedfinancial statements of Vista Land & Lifescapes, Inc. and its subsidiaries (the Group) as at December 31,2016 and 2015 and for each of the three years in the period ended December 31, 2016 and have issued ourreport thereon dated March 20, 2017. Our audits were made for the purpose of forming an opinion on thebasic consolidated financial statements taken as a whole. The schedules listed in the Index toConsolidated Financial Statements and Supplementary Schedules are the responsibility of themanagement of Vista Land & Lifescapes, Inc. These schedules are presented for purposes of complyingwith Securities Regulation Code Rule No. 68, As Amended (2011) and are not part of the basicconsolidated financial statements. The schedules have been subjected to the auditing procedures appliedin the audit of the basic consolidated financial statements and, in our opinion, fairly state in all materialrespects in relation to the basic consolidated financial statements taken as a whole.
SYCIP GORRES VELAYO & CO.
Michael C. SabadoPartnerCPA Certificate No. 89336SEC Accreditation No. 0664-AR-2 (Group A), March 26, 2014, valid until April 30, 2017Tax Identification No. 160-302-865BIR Accreditation No. 08-001998-73-2015, February 27, 2015, valid until February 26, 2018PTR No. 5908755, January 3, 2017, Makati City
March 20, 2017
SyCip Gorres Velayo & Co.6760 Ayala Avenue1226 Makati CityPhilippines
Tel: (632) 891 0307Fax: (632) 819 0872ey.com/ph
BOA/PRC Reg. No. 0001, December 14, 2015, valid until December 31, 2018SEC Accreditation No. 0012-FR-4 (Group A), November 10, 2015, valid until November 9, 2018
A member firm of Ernst & Young Global Limited
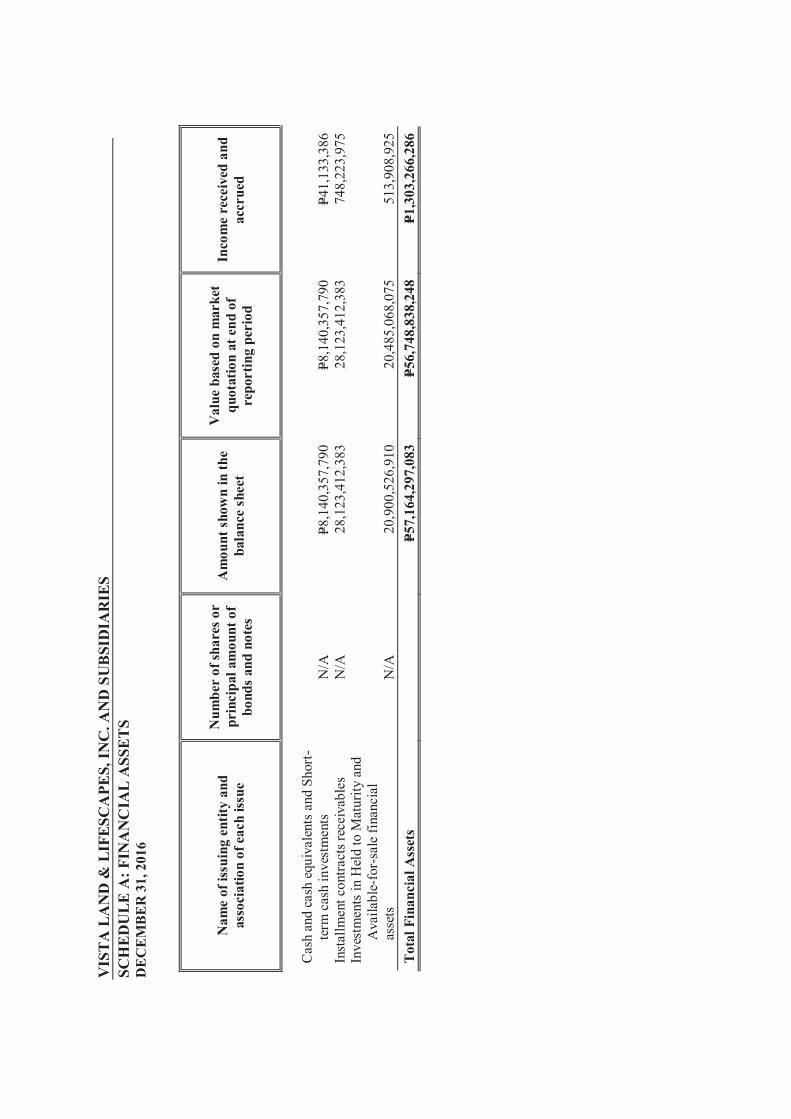
VIS
TA
LA
ND
& L
IFE
SCA
PES,
INC
. AN
D S
UB
SID
IAR
IES
SCH
ED
UL
E A
: FIN
AN
CIA
L A
SSE
TS
DE
CE
MB
ER
31,
201
6
Nam
e of
issu
ing
entit
y an
das
soci
atio
n of
eac
h iss
ue
Num
ber
of sh
ares
or
prin
cipa
l am
ount
of
bond
s an
d no
tes
Am
ount
sho
wn
in th
eba
lanc
e sh
eet
Val
ue b
ased
on
mar
ket
quot
atio
n at
end
of
repo
rtin
g pe
riod
Inco
me
rece
ived
and
accr
ued
Cas
h an
d ca
sh e
quiv
alen
ts a
nd S
hort
-
term
cas
h in
vest
men
tsN
/AP=8
,140
,357
,790
P=8,1
40,3
57,7
90P=4
1,13
3,38
6In
stal
lmen
t con
tract
s rec
eiva
bles
N/ A
28,1
23,4
12,3
8328
,123
,412
,383
748,
223,
975
Inve
stm
ents
in H
eld
to M
atur
ity a
nd
Ava
ilabl
e-fo
r-sa
le fi
nanc
ial
as
sets
N/A
20,9
00,5
26,9
1020
,485
,068
,075
513,
908,
925
Tot
al F
inan
cial
Ass
ets
P=57,
164,
297,
083
P=56,
748,
838,
248
P=1,3
03,2
66,2
86

VIS
TA
LA
ND
& L
IFE
SCA
PES,
INC
. AN
D S
UB
SID
IAR
IES
SCH
ED
UL
E B
: AM
OU
NT
S R
EC
EIV
AB
LE
FR
OM
DIR
EC
TO
RS,
OFF
ICE
RS,
EM
PLO
YE
ES,
RE
LA
TE
D P
AR
TIE
S A
ND
PRIN
CIP
AL
ST
OC
KH
OL
DE
R (O
TH
ER
TH
AN
RE
LA
TE
D P
AR
TIE
S)D
EC
EM
BE
R 3
1, 2
016
Nam
e an
d D
esig
natio
n of
debt
or
Bal
ance
at
begi
nnin
g of
peri
odA
dditi
ons
Am
ount
sco
llect
edA
mou
nts
wri
tten
off
Cur
rent
Not
curr
ent
Bal
ance
at
end
of p
erio
d
NO
T A
PPL
ICA
BL
E

VIS
TA
LA
ND
& L
IFE
SCA
PES,
INC
. AN
D S
UB
SID
IAR
IES
SCH
ED
UL
E C
: AM
OU
NT
S R
EC
EIV
AB
LE
S/PA
YA
BL
ES
FRO
M/T
O R
EL
AT
ED
PA
RT
IES
WH
ICH
AR
E E
LIM
INA
TE
DD
UR
ING
TH
E C
ON
SOL
IDA
TIO
N O
F FI
NA
NC
IAL
ST
AT
EM
EN
TS
DE
CE
MB
ER
31,
201
6
Nam
e an
dD
esig
natio
n of
Deb
tor
Bal
ance
at
Beg
inni
ng o
fPe
riod
Add
ition
sA
mou
nts
Col
lect
ed
Am
ount
sC
onve
rted
toA
PIC
/Cap
ital
Stoc
k
Cur
rent
Non
curr
ent
Bal
ance
at e
ndof
per
iod
NO
T A
PPL
ICA
BL
E-N
O T
RA
DE
AN
D N
ON
-TR
AD
E T
RA
NSA
CT
ION
S W
ITH
SU
BSI
DIA
RIE
S A
ND
AFF
ILIA
TE
S

VIS
TA
LA
ND
& L
IFE
SCA
PES,
INC
. AN
D S
UB
SID
IAR
IES
SCH
ED
UL
E D
: IN
TA
NG
IBL
E A
SSE
TS
DE
CE
MB
ER
31,
201
6
Des
crip
tion
Beg
inni
ngba
lanc
eA
dditi
ons
Am
ount
of
Am
ortiz
atio
nC
urre
ntN
ot C
urre
ntE
ndin
g ba
lanc
e
Syste
ms d
evel
opm
ent
co
stP=1
8,32
6,42
6P=3
5,14
8,80
3(P=
2,09
4,96
9)P=–
P=51,
380,
260
P=51,
380,
260
See
Not
e 17
of t
he C
onso
lidat
ed F
inan
cial
Sta
tem
ents
.

VIS
TA
LA
ND
& L
IFE
SCA
PES,
INC
. AN
D S
UB
SID
IAR
IES
SCH
ED
UL
E E
: LO
NG
TE
RM
DE
BT
DE
CE
MB
ER
31,
201
6
Title
of i
ssue
and
type
of
oblig
atio
n
Am
ount
auth
oriz
ed b
yin
dent
ure
Am
ount
show
nun
der
capt
ion
"Cur
rent
port
ion
of lo
ng-
term
deb
t" in
rela
ted
bala
nce
shee
t
Am
ount
show
n un
der
capt
ion
"Lon
g-te
rmde
bt"
in r
elat
edba
lanc
e sh
eet
Inte
rest
rate
sA
mou
ntN
umbe
r of
per
iodi
cin
stal
lmen
tsM
atur
ity d
ate
Not
es p
ayab
leP= 3
,100
,000
,000
–P= 1
,089
,021
,541
7.27
%P=1
,089
,021
,541
Qua
rterly
Inte
rest
paym
ents
; 17
quar
terly
prin
cipa
l pay
men
tsst
artin
g A
pril
2013
Apr
il 25
, 201
7
Not
es p
ayab
le $
100,
000,
000
–P= 2
,809
,639
,312
6.75
%P=2
,809
,639
,312
Sem
i-ann
ual i
nter
est
paym
ents
; bul
let o
npr
inci
pal
Oct
ober
17,
201
8
Not
es p
ayab
le $
225,
000,
000
–P= 8
,126
,223
,850
7.45
%P=8
,126
,223
,850
Sem
i-ann
uali
nter
est
paym
ents
; bul
let o
npr
inci
pal
Apr
il 29
, 201
9
Not
es p
ayab
le $
300,
000,
000
–P= 1
3,48
3,03
2,76
97.
375%
P=13,
483,
032,
769
Sem
i-ann
ual i
nter
est
paym
ents
; bul
let o
npr
inci
pal
June
17,
202
2
Not
es p
ayab
leP= 5
,000
,000
,000
–P= 4
,910
,326
,351
5.65
%5.
94%
P=4,9
10,3
26,3
51
Sem
i-ann
ual i
nter
est
paym
ents
; bul
let o
npr
inci
pal
Apr
il 29
, 201
9
Not
es p
ayab
leP= 5
00,4
00,0
00P=4
,652
,684
P= 6,0
11,1
615.
00%
P=10,
663,
845
Qua
rterly
inte
rest
paym
ents
; bul
let o
npr
inci
pal
Nov
embe
r 19,
201
7P=4
,652
,684
P=30,
424,
254,
984
P=30,
428,
907,
668
See
Not
e 21
of t
he C
onso
lidat
ed F
inan
cial
Sta
tem
ents

VIS
TA
LA
ND
& L
IFE
SCA
PES,
INC
. AN
D S
UB
SID
IAR
IES
SCH
ED
UL
E F
: IN
DE
BT
ED
NE
SS T
O R
EL
AT
ED
PA
RT
IES
DE
CE
MB
ER
31,
201
6
Nam
e of
rel
ated
par
tyB
alan
ce a
t beg
inni
ng o
f per
iod
Bal
ance
at e
nd o
f per
iod
NO
T A
PPL
ICA
BL
E

VIS
TA
LA
ND
& L
IFE
SCA
PES,
INC
. AN
D S
UB
SID
IAR
IES
SCH
ED
UL
E G
: GU
AR
AN
TE
ES
OF
SEC
UR
ITIE
S O
F O
TH
ER
ISSU
ER
SD
EC
EM
BE
R 3
1, 2
016
Nam
e of
issu
ing
entit
y of
secu
ritie
s gua
rant
eed
by th
eco
mpa
ny fo
r w
hich
this
stat
emen
ts is
file
d
Titl
e of
issu
e of
eac
h cl
ass
of se
curi
ties g
uara
ntee
dT
otal
am
ount
gua
rant
eed
and
outs
tand
ing
Am
ount
of o
wne
d by
per
son
for
whi
ch st
atem
ent i
s file
dN
atur
e of
gua
rant
ee
NO
T A
PPL
ICA
BL
E

VIS
TA
LA
ND
& L
IFE
SCA
PES,
INC
. AN
D S
UB
SID
IAR
IES
SCH
ED
UL
E H
: CA
PIT
AL
ST
OC
KD
EC
EM
BE
R 3
1, 2
016
Titl
e of
issu
eN
umbe
r of
shar
esau
thor
ized
Num
ber
of sh
ares
issue
d an
d ou
tsta
ndin
gat
sho
wn
unde
r re
late
dba
lanc
e sh
eet c
aptio
n
Num
ber
of sh
ares
rese
rved
for
optio
ns,
war
rant
s, co
nver
sion
and
othe
r ri
ghts
Num
ber
of sh
ares
hel
d by
Rel
ated
par
ties
Dir
ecto
rs,
offic
ers a
ndem
ploy
ees
Oth
ers
Com
mon
Sto
ck, P
1 pa
r val
ue16
,900
,000
,000
12,5
07,0
24,6
53–
8,18
1,01
3,35
351
7,17
5,16
13,
808,
836,
139
Pref
erre
d St
ock,
P0.
01 p
ar
valu
e10
,000
,000
,000
3,30
0,00
0,00
0–
3,30
0,00
0,00
0–
–
See
Not
e 23
of t
he C
onso
lidat
ed F
inan
cial
Sta
tem
ents

VISTA LAND AND LIFESCAPES, INC. AND SUBSIDIARIESSCHEDULE OF ALL THE EFFECTIVE STANDARDS AND INTERPRETATIONS[which consist of PFRSs, Philippine Accounting Standards (PASs) and Philippine Interpretations]effective as of December 31, 2016:
Below is the list of all effective PFRS, Philippine Accounting Standards (PAS) and Philippine Interpretations ofInternational Financial Reporting Interpretations Committee (IFRIC) as ofDecember 31, 2016:
PHILIPPINE FINANCIAL REPORTING STANDARDS AND INTERPRETATIONSEffective as of December 31, 2016
Adopted NotAdopted
Not Applicable
Framework for the Preparation and Presentation of Financial StatementsConceptual Framework Phase A: Objectives and qualitative characteristics
PFRSs Practice Statement Management Commentary
Philippine Financial Reporting Standards
PFRS 1(Revised)
First-time Adoption of Philippine Financial Reporting Standards
Amendments to PFRS 1 and PAS 27: Cost of an Investment in aSubsidiary, Jointly Controlled Entity or Associate
Amendments to PFRS 1: Additional Exemptions for First-time Adopters
Amendment to PFRS 1: Limited Exemption from Comparative PFRS 7Disclosures for First-time Adopters
Amendments to PFRS 1: Severe Hyperinflation and Removal of FixedDate for First-time Adopters
Amendments to PFRS 1: Government Loans
PFRS 2 Share-based Payment
Amendments to PFRS 2: Vesting Conditions and Cancellations
Amendments to PFRS 2: Group Cash-settled Share-based PaymentTransactions
PFRS 3(Revised) Business Combinations
PFRS 4 Insurance Contracts
Amendments to PAS 39 and PFRS 4: Financial Guarantee Contracts
PFRS 5 Non-current Assets Held for Sale and Discontinued Operations
Amendment to PFRS 5, Changes in Methods of Disposal
PFRS 6 Exploration for and Evaluation of Mineral Resources
PFRS 7 Financial Instruments: Disclosures
Amendments to PAS 39 and PFRS 7: Reclassification of Financial Assets
Amendments to PAS 39 and PFRS 7: Reclassification of Financial Assets- Effective Date and Transition
Amendments to PFRS 7: Improving Disclosures about FinancialInstruments
Amendments to PFRS 7: Disclosures - Transfers of Financial Assets
Amendments to PFRS 7: Disclosures - Offsetting Financial Assets andFinancial Liabilities
Amendments to PFRS 7: Mandatory Effective Date of PFRS 9 andTransition Disclosures
Amendment to PFRS 7, Servicing Contracts
Amendment to PFRS 7, Applicability of the Amendments to PFRS 7 toCondensed Interim Financial Statements

- 2 -
PHILIPPINE FINANCIAL REPORTING STANDARDS AND INTERPRETATIONSEffective as of December 31, 2016
Adopted NotAdopted
Not Applicable
PFRS 8 Operating Segments
PFRS 9 Financial Instruments*
Amendments to PFRS 9: Mandatory Effective Date of PFRS 9 andTransition Disclosures*
PFRS 10 Consolidated Financial Statements
Amendments to PFRS 10, PFRS 12 and PAS 28, Investment Entities:Applying the Consolidation Exception
PFRS 11 Joint Arrangements
Amendments to PFRS 11, Accounting for Acquisitions of Interests inJoint Operations
PFRS 12 Disclosure of Interests in Other Entities
Amendments to PFRS 10, PFRS 12 and PAS 28, Investment Entities:Applying the Consolidation Exception
PFRS 13 Fair Value Measurement
PFRS 14 Regulatory Deferral Accounts
Philippine Accounting Standards
PAS 1(Revised)
Presentation of Financial Statements
Amendment to PAS 1: Capital Disclosures
Amendments to PAS 32 and PAS 1: Puttable Financial Instruments andObligations Arising on Liquidation
Amendments to PAS 1: Presentation of Items of Other ComprehensiveIncome
Amendments to PAS 1, Disclosure Initiative
PAS 2 Inventories
PAS 7 Statement of Cash Flows
PAS 8 Accounting Policies, Changes in Accounting Estimates and Errors
PAS 10 Events after the Reporting Period
PAS 11 Construction Contracts
PAS 12 Income Taxes
Amendment to PAS 12 - Deferred Tax: Recovery of Underlying Assets
PAS 16 Property, Plant and Equipment
Amendments to PAS 16 and PAS 38, Clarification of Acceptable Methodsof Depreciation and Amortization
Amendments to PAS 16 and PAS 41, Agriculture: Bearer Plants
PAS 17 Leases
PAS 18 Revenue
PAS 19 Employee Benefits
Amendments to PAS 19: Actuarial Gains and Losses, Group Plans andDisclosures
Amendments to PAS 19: Discount Rate: Regional Market Issue

- 3 -
PHILIPPINE FINANCIAL REPORTING STANDARDS AND INTERPRETATIONSEffective as of December 31, 2016
Adopted NotAdopted
Not Applicable
PAS 19(Amended)
Employee Benefits
PAS 20 Accounting for Government Grants and Disclosure of GovernmentAssistance
PAS 21 The Effects of Changes in Foreign Exchange Rates
Amendment: Net Investment in a Foreign Operation
PAS 23(Revised)
Borrowing Costs
PAS 24(Revised)
Related Party Disclosures
PAS 26 Accounting and Reporting by Retirement Benefit Plans
PAS 27 Consolidated and Separate Financial Statements
PAS 27(Amended)
Separate Financial Statements
Amendments to PAS 27, Equity Method in Separate Financial Statements
PAS 28 Investments in Associates
Amendments to PFRS 10, PFRS 12 and PAS 28, Investment Entities:Applying the Consolidation Exception
PAS 28(Amended)
Investments in Associates and Joint Ventures*
PAS 29 Financial Reporting in Hyperinflationary Economies
PAS 31 Interests in Joint Ventures
PAS 32 Financial Instruments: Disclosure and Presentation
Amendments to PAS 32 and PAS 1: Puttable Financial Instruments andObligations Arising on Liquidation
Amendment to PAS 32: Classification of Rights Issues
Amendments to PAS 32: Offsetting Financial Assets and FinancialLiabilities*
PAS 33 Earnings per Share
PAS 34 Interim Financial Reporting
Amendment to PAS 34, Disclosure of Information ‘Elsewhere in theInterim Financial Report’
PAS 36 Impairment of Assets
PAS 37 Provisions, Contingent Liabilities and Contingent Assets
PAS 38 Intangible Assets
Amendments to PAS 16 and PAS 38, Clarification of Acceptable Methodsof Depreciation and Amortization
PAS 39 Financial Instruments: Recognition and Measurement
Amendments to PAS 39: Transition and Initial Recognition of FinancialAssets and Financial Liabilities
Amendments to PAS 39: Cash Flow Hedge Accounting of ForecastIntragroup Transactions
Amendments to PAS 39: The Fair Value Option
Amendments to PAS 39 and PFRS 4: Financial Guarantee Contracts
Amendments to PAS 39 and PFRS 7: Reclassification of Financial Assets

- 4 -
PHILIPPINE FINANCIAL REPORTING STANDARDS AND INTERPRETATIONSEffective as of December 31, 2016
Adopted NotAdopted
Not Applicable
Amendments to PAS 39 and PFRS 7: Reclassification of Financial Assets- Effective Date and Transition
Amendments to Philippine Interpretation IFRIC-9 and PAS 39:Embedded Derivatives
Amendment to PAS 39: Eligible Hedged Items
PAS 40 Investment Property
PAS 41 Agriculture
Amendments to PAS 16 and PAS 41, Agriculture: Bearer Plants
Philippine Interpretations
IFRIC 1 Changes in Existing Decommissioning, Restoration and SimilarLiabilities
IFRIC 2 Members Share in Co-operative Entities and Similar Instruments
IFRIC 4 Determining Whether an Arrangement Contains a Lease
IFRIC 5 Rights to Interests arising from Decommissioning, Restoration andEnvironmental Rehabilitation Funds
IFRIC 6 Liabilities arising from Participating in a Specific Market - WasteElectrical and Electronic Equipment
IFRIC 7 Applying the Restatement Approach under PAS 29 Financial Reporting inHyperinflationary Economies
IFRIC 8 Scope of PFRS 2
IFRIC 9 Reassessment of Embedded Derivatives
Amendments to Philippine Interpretation IFRIC-9 and PAS 39:Embedded Derivatives
IFRIC 10 Interim Financial Reporting and Impairment
IFRIC 11 PFRS 2 - Group and Treasury Share Transactions
IFRIC 12 Service Concession Arrangements
IFRIC 13 Customer Loyalty Programmes
IFRIC 14 The Limit on a Defined Benefit Asset, Minimum Funding Requirementsand their Interaction
Amendments to Philippine Interpretations IFRIC - 14, Prepayments of aMinimum Funding Requirement
IFRIC 16 Hedges of a Net Investment in a Foreign Operation
IFRIC 17 Distributions of Non-cash Assets to Owners
IFRIC 18 Transfers of Assets from Customers
IFRIC 19 Extinguishing Financial Liabilities with Equity Instruments
IFRIC 20 Stripping Costs in the Production Phase of a Surface Mine*
SIC-7 Introduction of the Euro
SIC-10 Government Assistance - No Specific Relation to Operating Activities
SIC-12 Consolidation - Special Purpose Entities
Amendment to SIC - 12: Scope of SIC 12
SIC-13 Jointly Controlled Entities - Non-Monetary Contributions by Venturers
SIC-15 Operating Leases - Incentives

- 5 -
PHILIPPINE FINANCIAL REPORTING STANDARDS AND INTERPRETATIONSEffective as of December 31, 2016
Adopted NotAdopted
Not Applicable
SIC-25 Income Taxes - Changes in the Tax Status of an Entity or its Shareholders
SIC-27 Evaluating the Substance of Transactions Involving the Legal Form of aLease
SIC-29 Service Concession Arrangements: Disclosures
SIC-31 Revenue - Barter Transactions Involving Advertising Services
SIC-32 Intangible Assets - Web Site Costs
Standards tagged as “Not applicable” have been adopted by the Group but have no significant coveredtransactions for the year ended December 31, 2016.
Standards tagged as “Not adopted” are standards issued but not yet effective as of December 31, 2016. TheGroup will adopt the Standards and Interpretations when these become effective.

*SGVFS021624*
VISTA LAND & LIFESCAPES, INC. AND SUBSIDIARIESSUPPLEMENTARY SCHEDULE OF RETAINED EARNINGSAVAILABLE FOR DIVIDEND DECLARATIONDECEMBER 31, 2016
Unappropriated retained earnings, beginning P=2,982,517,612
Add: Net income during the year closed to retained earnings 2,237,056,746Net income actually earned/realized during the period 5,219,574,358Less: Dividend declarations during the year (1,437,138,638) Treasury Shares (1,538,726,219)
TOTAL RETAINED EARNINGS, END AVAILABLE FOR DIVIDEND DECLARATION P=2,243,709,501

Group Structure
Below is the map showing the relationship between and among group and its Ultimate parent company,and its subsidiaries as of December 31, 2016.
51.94%
100%100% 100% 100% 100% 100% 88.34%

*Not early adopted.
VISTA LAND & LIFESCAPES, INC. AND SUBSIDIARIESSCHEDULE OF FINANCIAL RATIOSDECEMBER 31, 2016
Below are the financial ratios that are relevant to the Group for the years ended December 31, 2016,2015 and 2014.
2016 2015 2014
Current ratio Current assets3.28 3.42 2.94Current liabilities
Long-term debt-to-equity ratio Long-term debt¹ 0.94 0.87 0.58Equity
Debt ratio Interest bearing debt² 0.43 0.40 0.34Total assets
Debt to equity ratio Interest bearing debt² 0.99 0.87 0.66Total equity
Net debt to equity ratio Net debt³ 0.49 0.46 0.23Total equity
Asset to equity ratio Total assets 2.28 2.19 1.95Total equity
Interest service coverage ratio EBITDA 2.68 2.70 3.28Total interest paid
Asset to liability ratio Total Assets 1.78 1.84 2.06Total Liabilities
¹ Pertains to long term portion of the Bank loans, Loans payable and Notes payable² Includes Bank loans, and Notes payable³ Interest bearing debt less Cash and cash equivalents, Short-term and Long-Term cash investments, AFS (quoted debtsecurities) and HTM

HOMEBUILDER BONDS Schedule and Use of Proceeds As of December 31, 2016
PER
PROSPECTUS ACTUAL COLLECTED
as of
December 31, 2016
Estimated proceeds from the sale of the Bonds Php 500,400,000.00 Php 370,787,500.00 Php 8,332,500.00 Less: Estimated expenses SEC Registration SEC Registration Fee 1,187,500.00 1,199,425.00 SEC Legal Research Fee 11,875.00 - Underwriting and Other Professional Fees Financial Advisory, Issue Management and Underwriting Fee 12,510,000.00 11,749,005.37 Legal Fee - Underwriter 1,275,000.00 1,380,938.00 Legal Fee - Issuer 2,000,000.00 1,325,962.20 Marketing/Printing/Photocopying 750,000.00 422,735.94 Costs and out-of-pocket expenses Trustee and Custodian Fees 720,000.00 720,000.00 Registry and Calculating Agency Fees 4,920,000.00 4,920,000.00 Collecting and Paying Agent Fees 1,500,000.00 1,500,000.00 Technology Fee 400,000.00 400,000.00 Documentary Stamp Tax 2,502,000.00 2,502,000.00 Audit Fee 3,696,000.00 5,082,000.00 - 2,700.00 31,472,375.00 31,204,766.51 - Net proceeds to Vista Land & Lifescapes, Inc. Php 468,927,625.00 Php 339,582,733.49 Php 8,332,500.00
Balance of proceeds as of December 31, 2016 Php 8,332,500.00 Vista Land sold P500.4 million of the Bonds on its initial offering. Six months prior to maturity, bondholders have the following options for their accumulated investments: (1) Apply as downpayment to Vista property; (2) Payout; and (3) Extend for another 2 years. On December 1, 2015, the Bonds matured and 398 bondholders were paid in cash for a total of P363.51 million and 20 bondholders extended for another 2 years. After issue-related expenses and payout, actual net collection amounted to P8.33 million as of December 31, 2016. The net collection were deposited in the bank and is part of the Cash and cash equivalents balance in the balance sheet as of December 31, 2016.

P5B RETAIL BONDS Schedule and Use of Proceeds As of December 31, 2016
PER PROSPECTUS ACTUAL
Estimated proceeds from the sale of the Bonds
5,000,000,000.00
5,000,000,000.00
Less: Estimated expenses
Arranger's Fee
53,763,441.00
53,763,441.00
Documentary Stamp Tax
25,000,000.00
25,000,000.00
SEC Registration Fee
1,812,500.00
1,830,625.00
SEC Legal Research Fee
18,125.00
18,125.00
Publication Fee
150,000.00
150,000.00
Rating Agency Fee
3,360,000.00
3,000,000.00
Legal Fees (excluding OPE)
3,000,000.00
3,075,867.29
Trustee's Opening Fee
20,000.00
20,000.00
Listing Fee
150,000.00
150,000.00
Marketing and Signing Ceremony Expenses
800,000.00
1,255,214.84 Bond-related Expenses 261,670.76
88,074,066.00 88,524,943.89
Net proceeds to Vista Land & Lifescapes, Inc.
4,911,925,934.00 4,911,475,056.11
Amortization of Bond Issue Cost 22,751,308.15 Balance as of December 31, 2016 4,934,226,364.26
Vista Land sold P5 billion of the Bonds. After issue-related expenses, actual net collection amounted to P4.934 billion.