may '10 stats
DESCRIPTION
NEFAR May '10 housing statsTRANSCRIPT

New Listings 2Pending Sales 3Closed Sales 4
May 2010May provided our first month of data after the expiration of the federal home buyer's tax credit. Northeast Florida home buyers kept the momentum going, resulting in a continuing trend of year-over-year increases in both pending and closed sales.
Monthly IndicatorsA free research tool from the Northeast Florida Association of REALTORS®
brought to you by the unique data-sharing traditions of the REALTOR® community
Closed Sales 4Days On Market Until Sale 5Median Sales Price 6Average Sales Price 7Percent of Original List Price Received at Sale 8Housing Affordability Index 9Housing Supply Outlook All Residential Properties 10 Up to $149,999 and $150,000 to $199,999 11 $200,000 to $299,999 and $300,000 to $499,999 12 $500,000 to $999,999 and $1,000,000 and above 13Market Overview 14Annual Review 15Area breakouts of 29 submarkets begin after page 15.
y
Pending Sales increased 14.2 percent compared to last May to 1,543 purchase agreements signed. Keep in mind that Closed Sales will remain strong through the end of June as buyers wrap up before the June 30 closing date deadline.
New Listings posted a smaller increase, with 2,680 new properties being added to available market inventory, representing a 3.4 percent year-over-year increase. This sort of market activity has brought inventory down 8.8 percent to 15,070 Active Listings. As expected, Median Sales Price did post a 15.7 percent decrease over the same period last year. We anticipate prices remaining relatively soft due to the prevalence of lender-mediated foreclosures and short sales.
All data from the Northeast Florida Multiple Listing Service. Reports are created and maintained by 10K Research and Marketing. 1

New Listings A Monthly Indicator from the Northeast Florida Association of REALTORS®
1/1/2009
3,327
2,591 2,680
2008 2009 2010
May
17,664
14,26715,854
2008 2009 2010
Year to Date
One Year Change:
Two Year Change:
One Year Change:
Two Year Change:
+ 3.4%
-19.4%
+ 11.1%
-10.2%
3,327
2,591 2,680
2008 2009 2010
May
17,664
14,26715,854
2008 2009 2010
Year to Date
500
1,000
1,500
2,000
2,500
3,000
3,500
4,000
4,500
5,000
Jan-03 Jan-04 Jan-05 Jan-06 Jan-07 Jan-08 Jan-09 Jan-10
Historical Market ActivityNew Listings
Pending Sales
Closed Sales
One Year Change:
Two Year Change:
One Year Change:
Two Year Change:
+ 3.4%
-19.4%
+ 11.1%
-10.2%
All data from the Northeast Florida Multiple Listing Service. Reports are created and maintained by 10K Research and Marketing. 2

Pending Sales A Monthly Indicator from the Northeast Florida Association of REALTORS®
1/1/2009
1,2751,351
1,543
2008 2009 2010
April
5,539 5,838
8,142
2008 2009 2010
January through April
1,2751,351
1,543
May
5,5395,838
8,142
2008 2009 2010
Year to Date
One Year Change:
+ 14.2%Two Year Change:
+ 21.0%
One Year Change:
+ 39.5%Two Year Change:
+ 47.0%
1,2751,351
1,543
2008 2009 2010
April
5,539 5,838
8,142
2008 2009 2010
January through April
1,2751,351
1,543
2008 2009 2010
May
5,5395,838
8,142
2008 2009 2010
Year to Date
One Year Change:
+ 14.2%Two Year Change:
+ 21.0%
One Year Change:
+ 39.5%Two Year Change:
+ 47.0%
500
1,000
1,500
2,000
2,500
3,000
3,500
4,000
4,500
5,000
Jan-03 Jan-04 Jan-05 Jan-06 Jan-07 Jan-08 Jan-09 Jan-10
Historical Market ActivityNew Listings
Pending Sales
Closed Sales
All data from the Northeast Florida Multiple Listing Service. Reports are created and maintained by 10K Research and Marketing. 3

Closed Sales A Monthly Indicator from the Northeast Florida Association of REALTORS®
1/1/2009
1,248 1,276
1,432
2008 2009 2010
April
5,026 5,007
6,441
2008 2009 2010
January through April
1,248 1,276
1,432
2008 2009 2010
May
5,026 5,007
6,441
2008 2009 2010
Year to Date
+ 12.2%
One Year Change:
+ 28.6%Two Year Change:
+ 28.2%
One Year Change:
Two Year Change:
+ 14.7%
1,248 1,276
1,432
2008 2009 2010
April
5,026 5,007
6,441
2008 2009 2010
January through April
1,248 1,276
1,432
2008 2009 2010
May
5,026 5,007
6,441
2008 2009 2010
Year to Date
+ 12.2%
One Year Change:
+ 28.6%Two Year Change:
+ 28.2%
500
1,000
1,500
2,000
2,500
3,000
3,500
4,000
4,500
5,000
Jan-03 Jan-04 Jan-05 Jan-06 Jan-07 Jan-08 Jan-09 Jan-10
Historical Market ActivityNew Listings
Pending Sales
Closed Sales
One Year Change:
Two Year Change:
+ 14.7%
All data from the Northeast Florida Multiple Listing Service. Reports are created and maintained by 10K Research and Marketing. 4

Days on Market Until Sale A Monthly Indicator from the Northeast Florida Association of REALTORS®
1/1/2009
109 112
100
2008 2009 2010
April
109 111102
2008 2009 2010
January through April
109 112
100
2008 2009 2010
May
109 111102
2008 2009 2010
Year to Date
- 10.6%
One Year Change:
- 8.1%Two Year Change:
- 5.7%
One Year Change:
Two Year Change:
- 7.9%
109 112
100
2008 2009 2010
April
109 111102
2008 2009 2010
January through April
109 112
100
2008 2009 2010
May
109 111102
2008 2009 2010
Year to Date
- 10.6%
One Year Change:
- 8.1%Two Year Change:
- 5.7%
40
50
60
70
80
90
100
110
120
Jan-03 Jan-04 Jan-05 Jan-06 Jan-07 Jan-08 Jan-09 Jan-10
Historical Days on Market Until Sale
One Year Change:
Two Year Change:
- 7.9%
All data from the Northeast Florida Multiple Listing Service. Reports are created and maintained by 10K Research and Marketing. 5

Median Sales Price A Monthly Indicator from the Northeast Florida Association of REALTORS®
1/1/2009
$186,400
$165,995
$139,900
2008 2009 2010
April
$182,988
$159,000
$135,500
2008 2009 2010
January through April
$186,400
$165,995
$139,900
2008 2009 2010
May
$182,988
$159,000
$135,500
2008 2009 2010
Year to Date
One Year Change:
- 15.7%Two Year Change:
- 24.9%
One Year Change:
- 14.8%Two Year Change:
- 26.0%
Figures do not take into account seller concessions.$186,400
$165,995
$139,900
2008 2009 2010
April
$182,988
$159,000
$135,500
2008 2009 2010
January through April
$186,400
$165,995
$139,900
2008 2009 2010
May
$182,988
$159,000
$135,500
2008 2009 2010
Year to Date
One Year Change:
- 15.7%Two Year Change:
- 24.9%
One Year Change:
- 14.8%Two Year Change:
- 26.0%
$120,000
$140,000
$160,000
$180,000
$200,000
$220,000
Jan-03 Jan-04 Jan-05 Jan-06 Jan-07 Jan-08 Jan-09 Jan-10
Historical Median Prices
Figures do not take into account seller concessions.
All data from the Northeast Florida Multiple Listing Service. Reports are created and maintained by 10K Research and Marketing. 6

Average Sales Price A Monthly Indicator from the Northeast Florida Association of REALTORS®
1/1/2009
$236,056
$192,216$175,785
2008 2009 2010
April
$228,072
$186,211$168,524
2008 2009 2010
January through April
$236,056
$192,216$175,785
2008 2009 2010
May$228,072
$186,211$168,524
2008 2009 2010
Year to Date
One Year Change:
- 8.5%Two Year Change:
- 25.5%
One Year Change:
- 9.5%Two Year Change:
- 26.1%
Figures do not take into account seller concessions.$236,056
$192,216$175,785
2008 2009 2010
April
$228,072
$186,211$168,524
2008 2009 2010
January through April
$236,056
$192,216$175,785
2008 2009 2010
May$228,072
$186,211$168,524
2008 2009 2010
Year to Date
One Year Change:
- 8.5%Two Year Change:
- 25.5%
One Year Change:
- 9.5%Two Year Change:
- 26.1%
$140,000
$160,000
$180,000
$200,000
$220,000
$240,000
$260,000
$280,000
Jan-03 Jan-04 Jan-05 Jan-06 Jan-07 Jan-08 Jan-09 Jan-10
Historical Average Prices
Figures do not take into account seller concessions.
All data from the Northeast Florida Multiple Listing Service. Reports are created and maintained by 10K Research and Marketing. 7

Percent of Original List Price Received at Sale A Monthly Indicator from the Northeast Florida Association of REALTORS®
1/1/2009
89.5%
86.9%
89.7%
70.0%
75.0%
80.0%
85.0%
90.0%
95.0%
100.0%
2008 2009 2010
May
89.4%
86.5%
89.3%
70.0%
75.0%
80.0%
85.0%
90.0%
95.0%
100.0%
2008 2009 2010
Year to Date
One Year Change:
+ 3.3%Two Year Change:
- 0.1%
The Percent of Original List Price Received at Sale is calculated by comparing the final sales prices of closed sales to their original list prices. This does not account for list prices from any previous listing contracts. The sales price does not account for seller concessions.
One Year Change:
Two Year Change:
+ 3.2%
+ 0.2%
89.5%
86.9%
89.7%
70.0%
75.0%
80.0%
85.0%
90.0%
95.0%
100.0%
2008 2009 2010
May
89.4%
86.5%
89.3%
70.0%
75.0%
80.0%
85.0%
90.0%
95.0%
100.0%
2008 2009 2010
Year to Date
One Year Change:
+ 3.3%Two Year Change:
- 0.1%
80.0%
85.0%
90.0%
95.0%
100.0%
Jan-03 Jan-04 Jan-05 Jan-06 Jan-07 Jan-08 Jan-09 Jan-10
Historical Percent of Original List Price Received at Sale
The Percent of Original List Price Received at Sale is calculated by comparing the final sales prices of closed sales to their original list prices. This does not account for list prices from any previous listing contracts. The sales price does not account for seller concessions.
One Year Change:
Two Year Change:
+ 3.2%
+ 0.2%
All data from the Northeast Florida Multiple Listing Service. Reports are created and maintained by 10K Research and Marketing. 8

Housing Affordability Index A Monthly Indicator from the Northeast Florida Association of REALTORS®
1/1/2009
127
151
183
2008 2009 2010
April
$131
$159
$184
2008 2009 2010
January through April
127
151
183
May
131
159
184
Year to Date
One Year Change:
+ 21.1%Two Year Change:
+ 43.9%
One Year Change:
+ 15.6%Two Year Change:
+ 40.1%
The HAI formula measures housing affordability for the Northeast Florida Housing Market. An HAI of 120 means the median family income is 120% of the necessary income to qualify for the
median priced home using a 20% down, 30-year fixed rate mortgage.
127
151
183
2008 2009 2010
April
$131
$159
$184
2008 2009 2010
January through April
127
151
183
2008 2009 2010
May
131
159
184
2008 2009 2010
Year to Date
One Year Change:
+ 21.1%Two Year Change:
+ 43.9%
One Year Change:
+ 15.6%Two Year Change:
+ 40.1%
100
110
120
130
140
150
160
170
180
190
200
Jan-03 Jan-04 Jan-05 Jan-06 Jan-07 Jan-08 Jan-09 Jan-10
Historical Housing Affordability Index
The HAI formula measures housing affordability for the Northeast Florida Housing Market. An HAI of 120 means the median family income is 120% of the necessary income to qualify for the
median priced home using a 20% down, 30-year fixed rate mortgage.
All data from the Northeast Florida Multiple Listing Service. Reports are created and maintained by 10K Research and Marketing. 9

Housing Supply Outlook A Monthly Indicator from the Northeast Florida Association of REALTORS®
Inventory of Active Listings
39814.0
5,446
2,267 2,220
1,560
1,055
511
1,197
198 202 198 154 62
Up to $149,999 $150,000 - $199,999 $200,000 - $299,999 $300,000 - $499,999 $500,000 - $999,999 $1,000,000+
Single-Family
Condo-Townhouse12,012
1,8151,047
196
Single-Family Condo-Townhouse
Previously Owned
New Construction
Months Supply of Inventory
A market is considered balanced between buyers and sellers when there is roughly a 5 to 6-month supply of homes available for purchase
11.2 11.0
12.3
6.0 5.8
8.0
10.4 10.3
11.7
All Single-Family Condo-Townhouse
Previously OwnedNew ConstructionAll
5,446
2,267 2,220
1,560
1,055
511
1,197
198 202 198 154 62
Up to $149,999 $150,000 - $199,999 $200,000 - $299,999 $300,000 - $499,999 $500,000 - $999,999 $1,000,000+
Single-Family
Condo-Townhouse12,012
1,8151,047
196
Single-Family Condo-Townhouse
Previously Owned
New Construction
8.6 8.7 9.713.9
31.0
59.0
9.013.5
18.022.2
40.2
57.2
8.7 9.0 10.114.6
32.0
58.8
Up to $149,999 $150,000 - $199,999 $200,000 - $299,999 $300,000 - $499,999 $500,000 - $999,999 $1,000,000+
Single-Family
Condo-Townhouse
All
All data from the Northeast Florida Multiple Listing Service. Reports are created and maintained by 10K Research and Marketing. 10

Housing Supply Outlook A Monthly Indicator from the Northeast Florida Association of REALTORS®
Up to $149,999Inventory Months Supply
1/1/2009
6,337
5,216
1,121
306 230 76
All Single-Family Condo-Townhouse
Previously Owned
New Construction
9.0 8.9
9.6
5.4 5.64.9
All Single-Family Condo-Townhouse
Previously Owned
New Construction
$150,000 to $199,999Inventory Months Supply
6,337
5,216
1,121
306 230 76
All Single-Family Condo-Townhouse
Previously Owned
New Construction
9.0 8.9
9.6
5.4 5.64.9
All Single-Family Condo-Townhouse
Previously Owned
New Construction
2,1792,003
176286 264
22
All Single-Family Condo-Townhouse
Previously Owned
New Construction
10.1 9.7
17.5
4.9 4.9 4.8
All Single-Family Condo-Townhouse
Previously Owned
New Construction
All data from the Northeast Florida Multiple Listing Service. Reports are created and maintained by 10K Research and Marketing. 11

Housing Supply Outlook A Monthly Indicator from the Northeast Florida Association of REALTORS®
$200,000 to $299,999Inventory Months Supply
1/1/2009
2,1081,924
184314 296
18
All Single-Family Condo-Townhouse
Previously Owned
New Construction
11.7 11.2
19.0
5.4 5.2
11.4
All Single-Family Condo-Townhouse
Previously Owned
New Construction
$300,000 to $499,999Inventory Months Supply
2,1081,924
184314 296
18
All Single-Family Condo-Townhouse
Previously Owned
New Construction
11.7 11.2
19.0
5.4 5.2
11.4
All Single-Family Condo-Townhouse
Previously Owned
New Construction
1,598
1,429
169160 13129
All Single-Family Condo-Townhouse
Previously Owned
New Construction
17.0 16.4
24.1
6.0 5.3
15.1
All Single-Family Condo-Townhouse
Previously Owned
New Construction
All data from the Northeast Florida Multiple Listing Service. Reports are created and maintained by 10K Research and Marketing. 12
Housing Supply Outlook A Monthly Indicator from the Northeast Florida Association of REALTORS®
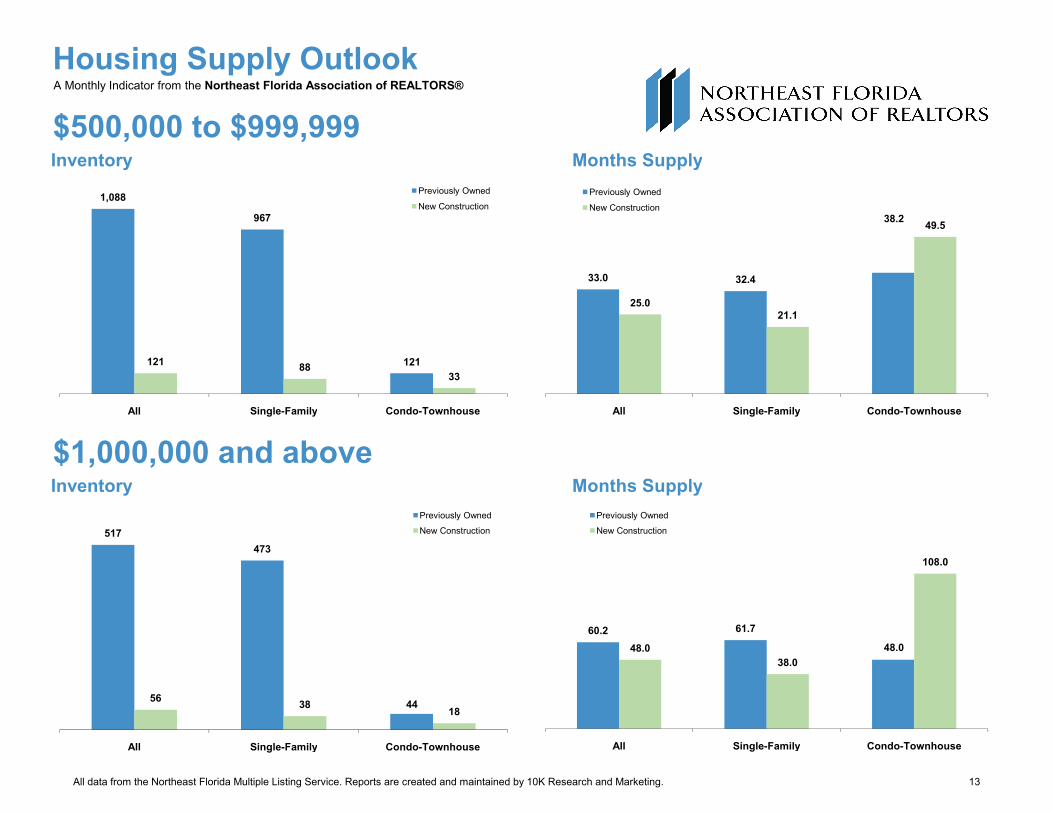
$500,000 to $999,999Inventory Months Supply
1/1/2009
1,088
967
121121 8833
All Single-Family Condo-Townhouse
Previously Owned
New Construction
33.0 32.4
38.2
25.021.1
49.5
All Single-Family Condo-Townhouse
Previously Owned
New Construction
$1,000,000 and aboveInventory Months Supply
1,088
967
121121 8833
All Single-Family Condo-Townhouse
Previously Owned
New Construction
33.0 32.4
38.2
25.021.1
49.5
All Single-Family Condo-Townhouse
Previously Owned
New Construction
517473
4456 38 18
All Single-Family Condo-Townhouse
Previously Owned
New Construction
60.2 61.7
48.048.038.0
108.0
All Single-Family Condo-Townhouse
Previously Owned
New Construction
All data from the Northeast Florida Multiple Listing Service. Reports are created and maintained by 10K Research and Marketing. 13

Market Overview A Monthly Indicator from the Northeast Florida Association of REALTORS®
This Year Previous Year
PercentChange
5-Year Average
This YearYear-to-
Date
Previous Year
Year-to-Date
Percent Change
5-Year Year-to-
Date Average
Mar 3,660 3,045 + 20.2% 3,891 9,665 8,903 + 8.6% 11,030Apr 3,509 2,773 + 26.5% 3,695 13,174 11,676 + 12.8% 14,725May 2,680 2,591 + 3.4% 3,511 15,854 14,267 + 11.1% 18,236
Pending Sales Mar 1,920 1,207 + 59.1% 1,597 4,498 3,162 + 42.3% 4,264Apr 2,101 1,325 + 58.6% 1,666 6,599 4,487 + 47.1% 5,930May 1,543 1,351 + 14.2% 1,591 8,142 5,838 + 39.5% 7,521
Closed Sales Mar 1,534 1,082 + 41.8% 1,551 3,469 2,656 + 30.6% 3,742Apr 1,540 1,075 + 43.3% 1,447 5,009 3,731 + 34.3% 5,188May 1,432 1,276 + 12.2% 1,585 6,441 5,007 + 28.6% 6,773
Days on Market Until Sale Mar 104 115 - 9.0% 95 103 112 - 8.1% 93Apr 103 109 - 5.5% 92 103 111 - 7.4% 93M 100 112 10 6% 92 102 111 8 1% 93
May 2010New Listings
May 100 112 - 10.6% 92 102 111 - 8.1% 93Median Sales Price Mar $137,500 $157,000 - 12.4% $174,700 $135,000 $157,000 - 14.0% $171,688
Apr $135,810 $150,000 - 9.5% $174,163 $135,000 $155,000 - 12.9% $172,200May $139,900 $165,995 - 15.7% $178,439 $135,500 $159,000 - 14.8% $174,298
Average Sales Price Mar $169,049 $186,692 - 9.5% $219,823 $166,771 $187,084 - 10.9% $215,379Apr $165,720 $176,925 - 6.3% $218,788 $166,448 $184,157 - 9.6% $216,300May $175,785 $192,216 - 8.5% $224,447 $168,524 $186,211 - 9.5% $218,239
Total Active Listings Available Mar 15,208 16,650 - 8.7%Apr 15,249 16,731 - 8.9% -- -- -- -- --May 15,070 16,524 - 8.8%Mar 89.0% 86.0% + 3.4% 91.1% 91.1% 86.1% + 5.8% 89.0%Apr 89.9% 87.0% + 3.2% 91.4% 91.4% 86.4% + 5.8% 89.2%May 89.7% 86.9% + 3.2% 91.3% 91.3% 86.5% + 5.6% 89.3%
Housing Affordability Index Mar 182 163 + 12.1% 141 185 160 + 15.8%Apr 185 169 + 9.0% 141 185 162 + 13.8% --May 183 151 + 21.1% 137 184 159 + 15.6%
Months Supply of Inventory Mar 11.5 15.8 - 27.0%Apr 11.0 15.6 - 29.4% -- -- -- -- --May 10.4 15.4 - 32.5%
Percent of Original List Price Received At Sale
All data from the Northeast Florida Multiple Listing Service. Reports are created and maintained by 10K Research and Marketing. 14

Annual Review A Monthly Indicator from the Northeast Florida Association of REALTORS®
1/1/2009
24,36722,366
16,775
97.9% 95.9% 92.9%
April
$184,790$199,900 $195,000
97.9% 95.9% 92.9%
January through April
24,36722,366
16,775
12,60414,521
2005 2006 2007 2008 2009
Closed Sales
52
63
88
107 107
2005 2006 2007 2008 2009
Days on Market Until Sale
- 8.2% - 25.0% - 24.9% + 22.0% + 39.4% + 21.5%+ 15.2% + 0.6%
24,36722,366
16,775
97.9% 95.9% 92.9%
April
$184,790$199,900 $195,000
97.9% 95.9% 92.9%
January through April
24,36722,366
16,775
12,60414,521
2005 2006 2007 2008 2009
Closed Sales
52
63
88
107 107
2005 2006 2007 2008 2009
Days on Market Until Sale
$184,790$199,900 $195,000
$179,900
$152,000
2005 2006 2007 2008 2009
Median Sales Price
97.9%95.9%
92.9%88.8% 88.1%
2005 2006 2007 2008 2009
Percent of Original List Price Received at Sale
- 8.2% - 25.0% - 24.9% + 22.0% + 39.4% + 21.5%
+ 8.2% - 2.5% - 7.7%- 2.0% - 3.1% - 4.4%
+ 15.2% + 0.6%
- 15.5%- 0.8%
All data from the Northeast Florida Multiple Listing Service. Reports are created and maintained by 10K Research and Marketing. 15

Single-Fam 1,305Townhouse 1,105
Local Market UpdatesA free research tool from the Northeast Florida Association of REALTORS®
Region 01
Duval County, FL 2009 2010 Change 2009 2010 Change
New Listings 223 235 + 5.4% 1,244 1,505 + 21.0%Closed Sales 119 145 + 21.8% 448 613 + 36.8%Median Sales Price* $182,500 $146,125 - 19.9% $180,000 $150,000 - 16.7%Percent of Original List Price Received at Sale * 88.1% 90.8% + 3.1% 88.5% 90.5% + 2.2%Average Days on Market Until Sale 118 108 - 8.6% 115 109 - 5.1%Single-Family Detached Inventory 1,063 1,105 + 4.0% -- -- --Townhouse-Condo Inventory 312 200 - 35.9% -- -- --
Southside/Mandarin/Bartram
*Does not account for seller concessions
May Year to Date
223
119
235
145
Activity—Most Recent Month
20092010 1,244
448
1,505
613
Activity—Year to Date
20092010
All data from the Northeast Florida Multiple Listing Service. Reports are created and maintained by the Minneapolis Area Association of REALTORS®.
New Listings Closed Sales
223
119
235
145
Activity—Most Recent Month
20092010
S f th fi f d i thi t f l th th f ti it A h th ti l k t d t th ll l i i l d
+ 5.4% + 21.8%
New Listings Closed Sales
1,244
448
1,505
613
Activity—Year to Date
20092010
May Year to Date
$182,500 $180,000
$146,125 $150,000
Median Sales Price
20092010
May Year to Date
88.1% 88.5%90.8% 90.5%
Percent of Original List Price Received at Sale
20092010
May Year to Date
118 115108 109
Days on Market Until Sale
20092010
Single-Family Detached Townhouse-Condo Attached
1,063
312
1,105
200
Activity—Most Recent Month
20092010
+ 21.0% + 36.8%
- 19.9% - 16.7% + 3.1% + 2.2%
- 8.6% - 5.1% + 4.0% - 35.9%
All data from the Northeast Florida Multiple Listing Service. Reports are created and maintained by the Minneapolis Area Association of REALTORS®.

Single-Fam 1,706Townhouse 1,176
Local Market UpdatesA free research tool from the Northeast Florida Association of REALTORS®
Region 02
Duval County, FL 2009 2010 Change 2009 2010 Change
New Listings 312 340 + 9.0% 1,753 2,057 + 17.3%Closed Sales 172 201 + 16.9% 646 915 + 41.6%Median Sales Price* $165,000 $115,000 - 30.3% $156,550 $130,000 - 17.0%Percent of Original List Price Received at Sale * 87.6% 90.7% + 3.5% 87.6% 90.4% + 3.2%Average Days on Market Until Sale 97 82 - 15.3% 103 95 - 8.0%Single-Family Detached Inventory 1,251 1,176 - 6.0% -- -- --Townhouse-Condo Inventory 544 530 - 2.6% -- -- --
Southside
*Does not account for seller concessions
May Year to Date
312
172
340
201
Activity—Most Recent Month
20092010
1,753
646
2,057
915
Activity—Year to Date
20092010
All data from the Northeast Florida Multiple Listing Service. Reports are created and maintained by the Minneapolis Area Association of REALTORS®.
New Listings Closed Sales
312
172
340
201
Activity—Most Recent Month
20092010
S f th fi f d i thi t f l th th f ti it A h th ti l k t d t th ll l i i l d
+ 9.0% + 16.9%
New Listings Closed Sales
1,753
646
2,057
915
Activity—Year to Date
20092010
May Year to Date
$165,000 $156,550
$115,000$130,000
Median Sales Price
20092010
May Year to Date
87.6% 87.6%90.7% 90.4%
Percent of Original List Price Received at Sale
20092010
May Year to Date
97 103
8295
Days on Market Until Sale
20092010
Single-Family Detached Townhouse-Condo Attached
1,251
544
1,176
530
Activity—Most Recent Month
20092010
+ 17.3% + 41.6%
- 30.3% - 17.0% + 3.5% + 3.2%
- 15.3% - 8.0% - 6.0% - 2.6%
All data from the Northeast Florida Multiple Listing Service. Reports are created and maintained by the Minneapolis Area Association of REALTORS®.

Single-Fam 374Townhouse 312
Local Market UpdatesA free research tool from the Northeast Florida Association of REALTORS®
Region 03
Duval County, FL 2009 2010 Change 2009 2010 Change
New Listings 74 58 - 21.6% 342 347 + 1.5%Closed Sales 9 30 + 233.3% 75 110 + 46.7%Median Sales Price* $180,000 $192,500 + 6.9% $180,000 $197,250 + 9.6%Percent of Original List Price Received at Sale * 85.7% 84.2% - 1.8% 84.2% 87.1% + 3.4%Average Days on Market Until Sale 104 130 + 24.8% 124 131 + 5.3%Single-Family Detached Inventory 319 312 - 2.2% -- -- --Townhouse-Condo Inventory 76 62 - 18.4% -- -- --
Riverside/Avondale/Ortega
*Does not account for seller concessions
May Year to Date
74
9
58
30
Activity—Most Recent Month
20092010
342
75
347
110
Activity—Year to Date
20092010
All data from the Northeast Florida Multiple Listing Service. Reports are created and maintained by the Minneapolis Area Association of REALTORS®.
New Listings Closed Sales
74
9
58
30
Activity—Most Recent Month
20092010
S f th fi f d i thi t f l th th f ti it A h th ti l k t d t th ll l i i l d
- 21.6% + 233.3%
New Listings Closed Sales
342
75
347
110
Activity—Year to Date
20092010
May Year to Date
$180,000 $180,000$192,500 $197,250
Median Sales Price
20092010
May Year to Date
85.7% 84.2%84.2% 87.1%
Percent of Original List Price Received at Sale
20092010
May Year to Date
104124130 131
Days on Market Until Sale
20092010
Single-Family Detached Townhouse-Condo Attached
319
76
312
62
Activity—Most Recent Month
20092010
+ 1.5% + 46.7%
+ 6.9% + 9.6% - 1.8% + 3.4%
+ 24.8% + 5.3% - 2.2% - 18.4%
All data from the Northeast Florida Multiple Listing Service. Reports are created and maintained by the Minneapolis Area Association of REALTORS®.

Single-Fam 998Townhouse 909
Local Market UpdatesA free research tool from the Northeast Florida Association of REALTORS®
Region 04
Duval County, FL 2009 2010 Change 2009 2010 Change
New Listings 176 233 + 32.4% 946 1,210 + 27.9%Closed Sales 86 95 + 10.5% 374 503 + 34.5%Median Sales Price* $137,500 $115,000 - 16.4% $140,000 $121,000 - 13.6%Percent of Original List Price Received at Sale * 87.7% 89.7% + 2.3% 85.9% 91.0% + 5.9%Average Days on Market Until Sale 106 79 - 25.7% 111 84 - 24.5%Single-Family Detached Inventory 940 909 - 3.3% -- -- --Townhouse-Condo Inventory 111 89 - 19.8% -- -- --
Arlington/Fort Caroline
*Does not account for seller concessions
May Year to Date
176
86
233
95
Activity—Most Recent Month
20092010
946
374
1,210
503
Activity—Year to Date
20092010
All data from the Northeast Florida Multiple Listing Service. Reports are created and maintained by the Minneapolis Area Association of REALTORS®.
New Listings Closed Sales
176
86
233
95
Activity—Most Recent Month
20092010
S f th fi f d i thi t f l th th f ti it A h th ti l k t d t th ll l i i l d
+ 32.4% + 10.5%
New Listings Closed Sales
946
374
1,210
503
Activity—Year to Date
20092010
May Year to Date
$137,500 $140,000$115,000 $121,000
Median Sales Price
20092010
May Year to Date
87.7% 85.9%89.7% 91.0%
Percent of Original List Price Received at Sale
20092010
May Year to Date
106 111
79 84
Days on Market Until Sale
20092010
Single-Family Detached Townhouse-Condo Attached
940
111
909
89
Activity—Most Recent Month
20092010
+ 27.9% + 34.5%
- 16.4% - 13.6% + 2.3% + 5.9%
- 25.7% - 24.5% - 3.3% - 19.8%
All data from the Northeast Florida Multiple Listing Service. Reports are created and maintained by the Minneapolis Area Association of REALTORS®.

Single-Fam 581Townhouse 549
Local Market UpdatesA free research tool from the Northeast Florida Association of REALTORS®
Region 05
Duval County, FL 2009 2010 Change 2009 2010 Change
New Listings 104 138 + 32.7% 660 720 + 9.1%Closed Sales 50 69 + 38.0% 197 292 + 48.2%Median Sales Price* $59,000 $80,000 + 35.6% $67,000 $72,000 + 7.5%Percent of Original List Price Received at Sale * 84.6% 87.6% + 3.5% 82.8% 88.5% + 6.9%Average Days on Market Until Sale 81 86 + 6.3% 83 83 - 0.9%Single-Family Detached Inventory 646 549 - 15.0% -- -- --Townhouse-Condo Inventory 56 32 - 42.9% -- -- --
Hyde Grove/Murray Hill/Lakeshore/Wesconnett
*Does not account for seller concessions
May Year to Date
104
50
138
69
Activity—Most Recent Month
20092010 660
197
720
292
Activity—Year to Date
20092010
All data from the Northeast Florida Multiple Listing Service. Reports are created and maintained by the Minneapolis Area Association of REALTORS®.
New Listings Closed Sales
104
50
138
69
Activity—Most Recent Month
20092010
S f th fi f d i thi t f l th th f ti it A h th ti l k t d t th ll l i i l d
+ 32.7% + 38.0%
New Listings Closed Sales
660
197
720
292
Activity—Year to Date
20092010
May Year to Date
$59,000$67,000
$80,000$72,000
Median Sales Price
20092010
May Year to Date
84.6% 82.8%87.6% 88.5%
Percent of Original List Price Received at Sale
20092010
May Year to Date
81 8386 83
Days on Market Until Sale
20092010
Single-Family Detached Townhouse-Condo Attached
646
56
549
32
Activity—Most Recent Month
20092010
+ 9.1% + 48.2%
+ 35.6% + 7.5% + 3.5% + 6.9%
+ 6.3% - 0.9% - 15.0% - 42.9%
All data from the Northeast Florida Multiple Listing Service. Reports are created and maintained by the Minneapolis Area Association of REALTORS®.

Single-Fam 876Townhouse 836
Local Market UpdatesA free research tool from the Northeast Florida Association of REALTORS®
Region 06
Duval County, FL 2009 2010 Change 2009 2010 Change
New Listings 155 197 + 27.1% 860 1,133 + 31.7%Closed Sales 84 106 + 26.2% 353 478 + 35.4%Median Sales Price* $130,000 $105,000 - 19.2% $130,000 $109,700 - 15.6%Percent of Original List Price Received at Sale * 86.5% 93.1% + 7.6% 86.8% 92.1% + 6.1%Average Days on Market Until Sale 115 82 - 29.0% 112 84 - 25.1%Single-Family Detached Inventory 881 836 - 5.1% -- -- --Townhouse-Condo Inventory 33 40 + 21.2% -- -- --
West Jacksonville
*Does not account for seller concessions
May Year to Date
155
84
197
106
Activity—Most Recent Month
20092010
860
353
1,133
478
Activity—Year to Date
20092010
All data from the Northeast Florida Multiple Listing Service. Reports are created and maintained by the Minneapolis Area Association of REALTORS®.
New Listings Closed Sales
155
84
197
106
Activity—Most Recent Month
20092010
S f th fi f d i thi t f l th th f ti it A h th ti l k t d t th ll l i i l d
+ 27.1% + 26.2%
New Listings Closed Sales
860
353
1,133
478
Activity—Year to Date
20092010
May Year to Date
$130,000 $130,000
$105,000 $109,700
Median Sales Price
20092010
May Year to Date
86.5% 86.8%93.1% 92.1%
Percent of Original List Price Received at Sale
20092010
May Year to Date
115 112
82 84
Days on Market Until Sale
20092010
Single-Family Detached Townhouse-Condo Attached
881
33
836
40
Activity—Most Recent Month
20092010
+ 31.7% + 35.4%
- 19.2% - 15.6% + 7.6% + 6.1%
- 29.0% - 25.1% - 5.1% + 21.2%
All data from the Northeast Florida Multiple Listing Service. Reports are created and maintained by the Minneapolis Area Association of REALTORS®.

Single-Fam 889Townhouse 846
Local Market UpdatesA free research tool from the Northeast Florida Association of REALTORS®
Region 07
Duval County, FL 2009 2010 Change 2009 2010 Change
New Listings 200 194 - 3.0% 1,173 1,015 - 13.5%Closed Sales 100 64 - 36.0% 448 410 - 8.5%Median Sales Price* $26,000 $20,000 - 23.1% $23,000 $20,000 - 13.0%Percent of Original List Price Received at Sale * 82.2% 88.4% + 7.6% 80.3% 87.9% + 9.4%Average Days on Market Until Sale 90 73 - 19.2% 95 67 - 30.1%Single-Family Detached Inventory 1,075 846 - 21.3% -- -- --Townhouse-Condo Inventory 157 43 - 72.6% -- -- --
Springfield/Downtown/Paxon/Trout River South
*Does not account for seller concessions
May Year to Date
200
100
194
64
Activity—Most Recent Month
20092010
1,173
448
1,015
410
Activity—Year to Date
20092010
All data from the Northeast Florida Multiple Listing Service. Reports are created and maintained by the Minneapolis Area Association of REALTORS®.
New Listings Closed Sales
200
100
194
64
Activity—Most Recent Month
20092010
S f th fi f d i thi t f l th th f ti it A h th ti l k t d t th ll l i i l d
- 3.0% - 36.0%
New Listings Closed Sales
1,173
448
1,015
410
Activity—Year to Date
20092010
May Year to Date
$26,000$23,000
$20,000 $20,000
Median Sales Price
20092010
May Year to Date
82.2% 80.3%88.4% 87.9%
Percent of Original List Price Received at Sale
20092010
May Year to Date
90 95
73 67
Days on Market Until Sale
20092010
Single-Family Detached Townhouse-Condo Attached
1,075
157
846
43
Activity—Most Recent Month
20092010
- 13.5% - 8.5%
- 23.1% - 13.0% + 7.6% + 9.4%
- 19.2% - 30.1% - 21.3% - 72.6%
All data from the Northeast Florida Multiple Listing Service. Reports are created and maintained by the Minneapolis Area Association of REALTORS®.

Single-Fam 157Townhouse 157
Local Market UpdatesA free research tool from the Northeast Florida Association of REALTORS®
Region 08
Duval County, FL 2009 2010 Change 2009 2010 Change
New Listings 24 36 + 50.0% 140 176 + 25.7%Closed Sales 17 12 - 29.4% 65 66 + 1.5%Median Sales Price* $145,000 $100,500 - 30.7% $146,278 $135,000 - 7.7%Percent of Original List Price Received at Sale * 82.9% 89.1% + 7.5% 86.1% 88.7% + 3.0%Average Days on Market Until Sale 146 107 - 26.6% 123 88 - 28.7%Single-Family Detached Inventory 150 157 + 4.7% -- -- --Townhouse-Condo Inventory 0 0 NA -- -- --
Marietta/Whitehouse/Baldwin/Garden St/Dinsmore
*Does not account for seller concessions
May Year to Date
24
17
36
12
Activity—Most Recent Month
20092010
140
65
176
66
Activity—Year to Date
20092010
All data from the Northeast Florida Multiple Listing Service. Reports are created and maintained by the Minneapolis Area Association of REALTORS®.
New Listings Closed Sales
24
17
36
12
Activity—Most Recent Month
20092010
S f th fi f d i thi t f l th th f ti it A h th ti l k t d t th ll l i i l d
+ 50.0% - 29.4%
New Listings Closed Sales
140
65
176
66
Activity—Year to Date
20092010
May Year to Date
$145,000 $146,278
$100,500
$135,000
Median Sales Price
20092010
May Year to Date
82.9% 86.1%89.1% 88.7%
Percent of Original List Price Received at Sale
20092010
May Year to Date
146123
10788
Days on Market Until Sale
20092010
Single-Family Detached Townhouse-Condo Attached
150
0
157
0
Activity—Most Recent Month
20092010
+ 25.7% + 1.5%
- 30.7% - 7.7% + 7.5% + 3.0%
- 26.6% - 28.7% + 4.7% NA
All data from the Northeast Florida Multiple Listing Service. Reports are created and maintained by the Minneapolis Area Association of REALTORS®.

Single-Fam 689Townhouse 689
Local Market UpdatesA free research tool from the Northeast Florida Association of REALTORS®
Region 09
Duval County, FL 2009 2010 Change 2009 2010 Change
New Listings 133 139 + 4.5% 722 821 + 13.7%Closed Sales 87 97 + 11.5% 302 347 + 14.9%Median Sales Price* $160,000 $150,000 - 6.3% $160,000 $147,000 - 8.1%Percent of Original List Price Received at Sale * 89.7% 90.5% + 0.8% 87.8% 90.1% + 2.6%Average Days on Market Until Sale 104 109 + 4.8% 107 109 + 2.2%Single-Family Detached Inventory 773 689 - 10.9% -- -- --Townhouse-Condo Inventory 0 0 NA -- -- --
Jacksonville – North
*Does not account for seller concessions
May Year to Date
133
87
139
97
Activity—Most Recent Month
20092010 722
302
821
347
Activity—Year to Date
20092010
All data from the Northeast Florida Multiple Listing Service. Reports are created and maintained by the Minneapolis Area Association of REALTORS®.
New Listings Closed Sales
133
87
139
97
Activity—Most Recent Month
20092010
S f th fi f d i thi t f l th th f ti it A h th ti l k t d t th ll l i i l d
+ 4.5% + 11.5%
New Listings Closed Sales
722
302
821
347
Activity—Year to Date
20092010
May Year to Date
$160,000 $160,000$150,000 $147,000
Median Sales Price
20092010
May Year to Date
89.7% 87.8%90.5% 90.1%
Percent of Original List Price Received at Sale
20092010
May Year to Date
104 107109 109Days on Market Until Sale
20092010
Single-Family Detached Townhouse-Condo Attached
773
0
689
0
Activity—Most Recent Month
20092010
+ 13.7% + 14.9%
- 6.3% - 8.1% + 0.8% + 2.6%
+ 4.8% + 2.2% - 10.9% NA
All data from the Northeast Florida Multiple Listing Service. Reports are created and maintained by the Minneapolis Area Association of REALTORS®.

Single-Fam 351Townhouse 322
Local Market UpdatesA free research tool from the Northeast Florida Association of REALTORS®
Region 12
Clay County, FL 2009 2010 Change 2009 2010 Change
New Listings 73 72 - 1.4% 353 418 + 18.4%Closed Sales 27 36 + 33.3% 95 138 + 45.3%Median Sales Price* $224,900 $210,000 - 6.6% $219,000 $213,800 - 2.4%Percent of Original List Price Received at Sale * 90.0% 89.5% - 0.6% 90.1% 90.0% - 0.1%Average Days on Market Until Sale 87 111 + 26.8% 108 109 + 1.1%Single-Family Detached Inventory 342 322 - 5.8% -- -- --Townhouse-Condo Inventory 23 29 + 26.1% -- -- --
Fleming Island Area
*Does not account for seller concessions
May Year to Date
73
27
72
36
Activity—Most Recent Month
20092010 353
95
418
138
Activity—Year to Date
20092010
All data from the Northeast Florida Multiple Listing Service. Reports are created and maintained by the Minneapolis Area Association of REALTORS®.
New Listings Closed Sales
73
27
72
36
Activity—Most Recent Month
20092010
S f th fi f d i thi t f l th th f ti it A h th ti l k t d t th ll l i i l d
- 1.4% + 33.3%
New Listings Closed Sales
353
95
418
138
Activity—Year to Date
20092010
May Year to Date
$224,900 $219,000$210,000 $213,800
Median Sales Price
20092010
May Year to Date
90.0% 90.1%89.5% 90.0%
Percent of Original List Price Received at Sale
20092010
May Year to Date
87
108111 109Days on Market Until Sale
20092010
Single-Family Detached Townhouse-Condo Attached
342
23
322
29
Activity—Most Recent Month
20092010
+ 18.4% + 45.3%
- 6.6% - 2.4% - 0.6% - 0.1%
+ 26.8% + 1.1% - 5.8% + 26.1%
All data from the Northeast Florida Multiple Listing Service. Reports are created and maintained by the Minneapolis Area Association of REALTORS®.

Single-Fam 761Townhouse 714
Local Market UpdatesA free research tool from the Northeast Florida Association of REALTORS®
Region 13
Clay County, FL 2009 2010 Change 2009 2010 Change
New Listings 155 143 - 7.7% 845 909 + 7.6%Closed Sales 97 93 - 4.1% 327 436 + 33.3%Median Sales Price* $170,000 $141,000 - 17.1% $160,000 $135,500 - 15.3%Percent of Original List Price Received at Sale * 89.3% 90.0% + 0.7% 88.1% 89.4% + 1.4%Average Days on Market Until Sale 99 97 - 2.2% 107 96 - 10.3%Single-Family Detached Inventory 819 714 - 12.8% -- -- --Townhouse-Condo Inventory 70 47 - 32.9% -- -- --
Orange Park
*Does not account for seller concessions
May Year to Date
155
97
143
93
Activity—Most Recent Month
20092010
845
327
909
436
Activity—Year to Date
20092010
All data from the Northeast Florida Multiple Listing Service. Reports are created and maintained by the Minneapolis Area Association of REALTORS®.
New Listings Closed Sales
155
97
143
93
Activity—Most Recent Month
20092010
S f th fi f d i thi t f l th th f ti it A h th ti l k t d t th ll l i i l d
- 7.7% - 4.1%
New Listings Closed Sales
845
327
909
436
Activity—Year to Date
20092010
May Year to Date
$170,000 $160,000$141,000 $135,500
Median Sales Price
20092010
May Year to Date
89.3% 88.1%90.0% 89.4%
Percent of Original List Price Received at Sale
20092010
May Year to Date
99107
97 96
Days on Market Until Sale
20092010
Single-Family Detached Townhouse-Condo Attached
819
70
714
47
Activity—Most Recent Month
20092010
+ 7.6% + 33.3%
- 17.1% - 15.3% + 0.7% + 1.4%
- 2.2% - 10.3% - 12.8% - 32.9%
All data from the Northeast Florida Multiple Listing Service. Reports are created and maintained by the Minneapolis Area Association of REALTORS®.

Single-Fam 451Townhouse 443
Local Market UpdatesA free research tool from the Northeast Florida Association of REALTORS®
Region 14
Clay County, FL 2009 2010 Change 2009 2010 Change
New Listings 84 79 - 6.0% 465 564 + 21.3%Closed Sales 49 53 + 8.2% 186 255 + 37.1%Median Sales Price* $164,500 $143,000 - 13.1% $160,000 $135,000 - 15.6%Percent of Original List Price Received at Sale * 89.5% 92.3% + 3.1% 88.7% 90.8% + 2.4%Average Days on Market Until Sale 102 84 - 17.1% 111 93 - 16.6%Single-Family Detached Inventory 460 443 - 3.7% -- -- --Townhouse-Condo Inventory 11 8 - 27.3% -- -- --
Middleburg Vicinity
*Does not account for seller concessions
May Year to Date
84
49
79
53
Activity—Most Recent Month
20092010 465
186
564
255
Activity—Year to Date
20092010
All data from the Northeast Florida Multiple Listing Service. Reports are created and maintained by the Minneapolis Area Association of REALTORS®.
New Listings Closed Sales
84
49
79
53
Activity—Most Recent Month
20092010
S f th fi f d i thi t f l th th f ti it A h th ti l k t d t th ll l i i l d
- 6.0% + 8.2%
New Listings Closed Sales
465
186
564
255
Activity—Year to Date
20092010
May Year to Date
$164,500 $160,000$143,000 $135,000
Median Sales Price
20092010
May Year to Date
89.5% 88.7%92.3% 90.8%
Percent of Original List Price Received at Sale
20092010
May Year to Date
102111
8493
Days on Market Until Sale
20092010
Single-Family Detached Townhouse-Condo Attached
460
11
443
8
Activity—Most Recent Month
20092010
+ 21.3% + 37.1%
- 13.1% - 15.6% + 3.1% + 2.4%
- 17.1% - 16.6% - 3.7% - 27.3%
All data from the Northeast Florida Multiple Listing Service. Reports are created and maintained by the Minneapolis Area Association of REALTORS®.

Single-Fam 189Townhouse 189
Local Market UpdatesA free research tool from the Northeast Florida Association of REALTORS®
Region 15
Clay County, FL 2009 2010 Change 2009 2010 Change
New Listings 24 25 + 4.2% 126 126 - 0.0%Closed Sales 8 12 + 50.0% 30 38 + 26.7%Median Sales Price* $95,000 $111,250 + 17.1% $110,000 $85,450 - 22.3%Percent of Original List Price Received at Sale * 90.3% 84.5% - 6.4% 87.6% 83.2% - 5.0%Average Days on Market Until Sale 94 259 + 174.4% 114 172 + 50.7%Single-Family Detached Inventory 190 189 - 0.5% -- -- --Townhouse-Condo Inventory 0 0 NA -- -- --
Keystone Heights Vicinity
*Does not account for seller concessions
May Year to Date
24
8
25
12
Activity—Most Recent Month
20092010
126
30
126
38
Activity—Year to Date
20092010
All data from the Northeast Florida Multiple Listing Service. Reports are created and maintained by the Minneapolis Area Association of REALTORS®.
New Listings Closed Sales
24
8
25
12
Activity—Most Recent Month
20092010
S f th fi f d i thi t f l th th f ti it A h th ti l k t d t th ll l i i l d
+ 4.2% + 50.0%
New Listings Closed Sales
126
30
126
38
Activity—Year to Date
20092010
May Year to Date
$95,000$110,000$111,250
$85,450
Median Sales Price
20092010
May Year to Date
90.3% 87.6%84.5% 83.2%
Percent of Original List Price Received at Sale
20092010
May Year to Date
94114
259
172
Days on Market Until Sale
20092010
Single-Family Detached Townhouse-Condo Attached
190
0
189
0
Activity—Most Recent Month
20092010
- 0.0% + 26.7%
+ 17.1% - 22.3% - 6.4% - 5.0%
+ 174.4% + 50.7% - 0.5% NA
All data from the Northeast Florida Multiple Listing Service. Reports are created and maintained by the Minneapolis Area Association of REALTORS®.

Single-Fam 144Townhouse 136
Local Market UpdatesA free research tool from the Northeast Florida Association of REALTORS®
Region 16
Clay County, FL 2009 2010 Change 2009 2010 Change
New Listings 25 18 - 28.0% 140 120 - 14.3%Closed Sales 12 9 - 25.0% 53 45 - 15.1%Median Sales Price* $190,745 $159,990 - 16.1% $205,733 $159,495 - 22.5%Percent of Original List Price Received at Sale * 89.2% 87.8% - 1.6% 89.8% 86.6% - 3.6%Average Days on Market Until Sale 163 163 + 0.3% 134 130 - 3.1%Single-Family Detached Inventory 172 136 - 20.9% -- -- --Townhouse-Condo Inventory 8 8 - 0.0% -- -- --
Green Cove Springs
*Does not account for seller concessions
May Year to Date
25
12
18
9
Activity—Most Recent Month
20092010
140
53
120
45
Activity—Year to Date
20092010
All data from the Northeast Florida Multiple Listing Service. Reports are created and maintained by the Minneapolis Area Association of REALTORS®.
New Listings Closed Sales
25
12
18
9
Activity—Most Recent Month
20092010
S f th fi f d i thi t f l th th f ti it A h th ti l k t d t th ll l i i l d
- 28.0% - 25.0%
New Listings Closed Sales
140
53
120
45
Activity—Year to Date
20092010
May Year to Date
$190,745 $205,733
$159,990 $159,495
Median Sales Price
20092010
May Year to Date
89.2% 89.8%87.8% 86.6%
Percent of Original List Price Received at Sale
20092010
May Year to Date
163
134
163
130
Days on Market Until Sale
20092010
Single-Family Detached Townhouse-Condo Attached
172
8
136
8
Activity—Most Recent Month
20092010
- 14.3% - 15.1%
- 16.1% - 22.5% - 1.6% - 3.6%
+ 0.3% - 3.1% - 20.9% - 0.0%
All data from the Northeast Florida Multiple Listing Service. Reports are created and maintained by the Minneapolis Area Association of REALTORS®.

Single-Fam 370Townhouse 165
Local Market UpdatesA free research tool from the Northeast Florida Association of REALTORS®
Region 21
Duval County, FL 2009 2010 Change 2009 2010 Change
New Listings 55 53 - 3.6% 348 327 - 6.0%Closed Sales 19 28 + 47.4% 90 128 + 42.2%Median Sales Price* $226,700 $216,500 - 4.5% $260,000 $215,000 - 17.3%Percent of Original List Price Received at Sale * 79.6% 90.2% + 13.4% 86.0% 88.2% + 2.6%Average Days on Market Until Sale 161 112 - 30.4% 112 112 + 0.1%Single-Family Detached Inventory 251 165 - 34.3% -- -- --Townhouse-Condo Inventory 264 205 - 22.3% -- -- --
Jacksonville Bch
*Does not account for seller concessions
May Year to Date
55
19
53
28
Activity—Most Recent Month
20092010
348
90
327
128
Activity—Year to Date
20092010
All data from the Northeast Florida Multiple Listing Service. Reports are created and maintained by the Minneapolis Area Association of REALTORS®.
New Listings Closed Sales
55
19
53
28
Activity—Most Recent Month
20092010
S f th fi f d i thi t f l th th f ti it A h th ti l k t d t th ll l i i l d
- 3.6% + 47.4%
New Listings Closed Sales
348
90
327
128
Activity—Year to Date
20092010
May Year to Date
$226,700$260,000
$216,500 $215,000
Median Sales Price
20092010
May Year to Date
79.6% 86.0%90.2% 88.2%
Percent of Original List Price Received at Sale
20092010
May Year to Date
161
112112 112
Days on Market Until Sale
20092010
Single-Family Detached Townhouse-Condo Attached
251 264
165205
Activity—Most Recent Month
20092010
- 6.0% + 42.2%
- 4.5% - 17.3% + 13.4% + 2.6%
- 30.4% + 0.1% - 34.3% - 22.3%
All data from the Northeast Florida Multiple Listing Service. Reports are created and maintained by the Minneapolis Area Association of REALTORS®.

Single-Fam 79Townhouse 78
Local Market UpdatesA free research tool from the Northeast Florida Association of REALTORS®
Region 22
Duval County, FL 2009 2010 Change 2009 2010 Change
New Listings 11 12 + 9.1% 66 68 + 3.0%Closed Sales 4 4 - 0.0% 17 25 + 47.1%Median Sales Price* $392,500 $241,500 - 38.5% $385,000 $233,000 - 39.5%Percent of Original List Price Received at Sale * 85.6% 94.2% + 10.1% 85.9% 87.5% + 2.0%Average Days on Market Until Sale 99 57 - 42.4% 111 65 - 41.1%Single-Family Detached Inventory 72 78 + 8.3% -- -- --Townhouse-Condo Inventory 1 1 - 0.0% -- -- --
Neptune Bch
*Does not account for seller concessions
May Year to Date
11
4
12
4
Activity—Most Recent Month
20092010 66
17
68
25
Activity—Year to Date
20092010
All data from the Northeast Florida Multiple Listing Service. Reports are created and maintained by the Minneapolis Area Association of REALTORS®.
New Listings Closed Sales
11
4
12
4
Activity—Most Recent Month
20092010
S f th fi f d i thi t f l th th f ti it A h th ti l k t d t th ll l i i l d
+ 9.1% - 0.0%
New Listings Closed Sales
66
17
68
25
Activity—Year to Date
20092010
May Year to Date
$392,500 $385,000
$241,500 $233,000
Median Sales Price
20092010
May Year to Date
85.6% 85.9%94.2% 87.5%
Percent of Original List Price Received at Sale
20092010
May Year to Date
99111
5765
Days on Market Until Sale
20092010
Single-Family Detached Townhouse-Condo Attached
72
1
78
1
Activity—Most Recent Month
20092010
+ 3.0% + 47.1%
- 38.5% - 39.5% + 10.1% + 2.0%
- 42.4% - 41.1% + 8.3% - 0.0%
All data from the Northeast Florida Multiple Listing Service. Reports are created and maintained by the Minneapolis Area Association of REALTORS®.

Single-Fam 197Townhouse 176
Local Market UpdatesA free research tool from the Northeast Florida Association of REALTORS®
Region 23
Duval County, FL 2009 2010 Change 2009 2010 Change
New Listings 27 20 - 25.9% 191 199 + 4.2%Closed Sales 18 17 - 5.6% 69 87 + 26.1%Median Sales Price* $297,500 $162,000 - 45.5% $190,000 $168,000 - 11.6%Percent of Original List Price Received at Sale * 80.7% 87.3% + 8.3% 84.1% 86.0% + 2.3%Average Days on Market Until Sale 119 114 - 3.7% 107 146 + 36.9%Single-Family Detached Inventory 196 176 - 10.2% -- -- --Townhouse-Condo Inventory 28 21 - 25.0% -- -- --
Atlantic Bch
*Does not account for seller concessions
May Year to Date
27
1820
17
Activity—Most Recent Month
20092010 191
69
199
87
Activity—Year to Date
20092010
All data from the Northeast Florida Multiple Listing Service. Reports are created and maintained by the Minneapolis Area Association of REALTORS®.
New Listings Closed Sales
27
1820
17
Activity—Most Recent Month
20092010
S f th fi f d i thi t f l th th f ti it A h th ti l k t d t th ll l i i l d
- 25.9% - 5.6%
New Listings Closed Sales
191
69
199
87
Activity—Year to Date
20092010
May Year to Date
$297,500
$190,000$162,000 $168,000
Median Sales Price
20092010
May Year to Date
80.7% 84.1%87.3% 86.0%
Percent of Original List Price Received at Sale
20092010
May Year to Date
119107114
146Days on Market Until Sale
20092010
Single-Family Detached Townhouse-Condo Attached
196
28
176
21
Activity—Most Recent Month
20092010
+ 4.2% + 26.1%
- 45.5% - 11.6% + 8.3% + 2.3%
- 3.7% + 36.9% - 10.2% - 25.0%
All data from the Northeast Florida Multiple Listing Service. Reports are created and maintained by the Minneapolis Area Association of REALTORS®.
Single-Fam 175Townhouse 143
Local Market UpdatesA free research tool from the Northeast Florida Association of REALTORS®
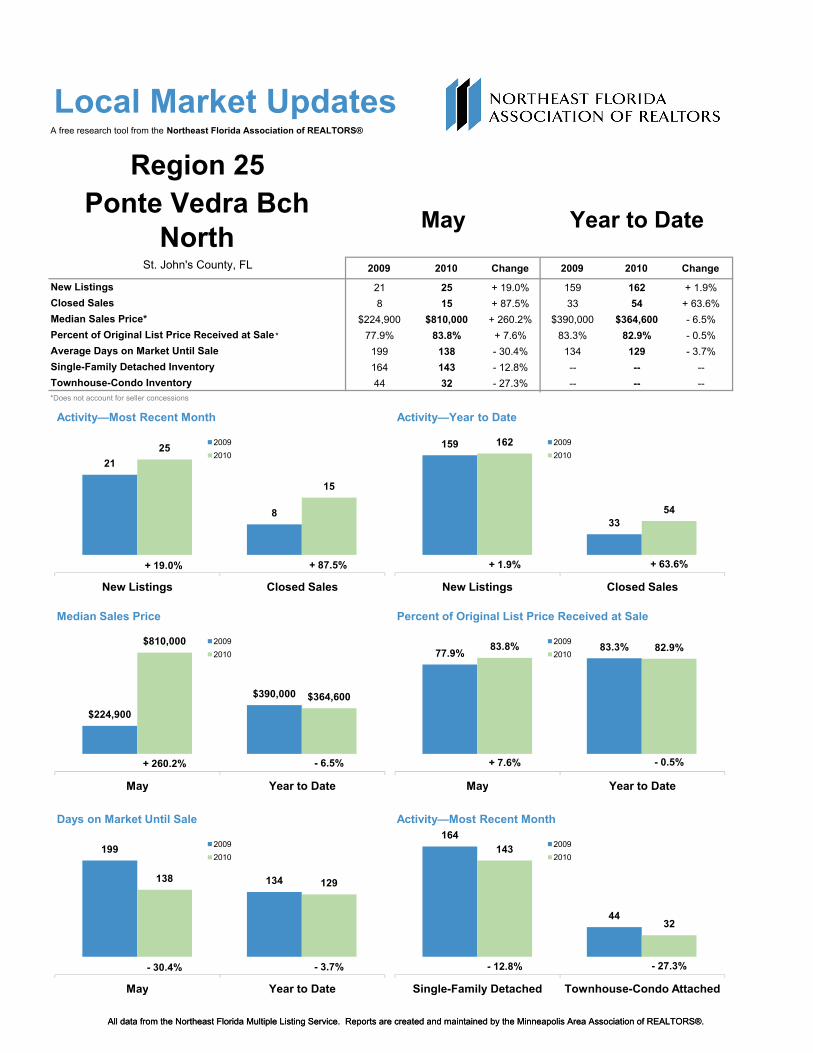
Region 25
St. John's County, FL 2009 2010 Change 2009 2010 Change
New Listings 21 25 + 19.0% 159 162 + 1.9%Closed Sales 8 15 + 87.5% 33 54 + 63.6%Median Sales Price* $224,900 $810,000 + 260.2% $390,000 $364,600 - 6.5%Percent of Original List Price Received at Sale * 77.9% 83.8% + 7.6% 83.3% 82.9% - 0.5%Average Days on Market Until Sale 199 138 - 30.4% 134 129 - 3.7%Single-Family Detached Inventory 164 143 - 12.8% -- -- --Townhouse-Condo Inventory 44 32 - 27.3% -- -- --
Ponte Vedra Bch North
*Does not account for seller concessions
May Year to Date
21
8
25
15
Activity—Most Recent Month
20092010
159
33
162
54
Activity—Year to Date
20092010
All data from the Northeast Florida Multiple Listing Service. Reports are created and maintained by the Minneapolis Area Association of REALTORS®.
New Listings Closed Sales
21
8
25
15
Activity—Most Recent Month
20092010
S f th fi f d i thi t f l th th f ti it A h th ti l k t d t th ll l i i l d
+ 19.0% + 87.5%
New Listings Closed Sales
159
33
162
54
Activity—Year to Date
20092010
May Year to Date
$224,900
$390,000
$810,000
$364,600
Median Sales Price
20092010
May Year to Date
77.9% 83.3%83.8% 82.9%
Percent of Original List Price Received at Sale
20092010
May Year to Date
199
134138 129
Days on Market Until Sale
20092010
Single-Family Detached Townhouse-Condo Attached
164
44
143
32
Activity—Most Recent Month
20092010
+ 1.9% + 63.6%
+ 260.2% - 6.5% + 7.6% - 0.5%
- 30.4% - 3.7% - 12.8% - 27.3%
All data from the Northeast Florida Multiple Listing Service. Reports are created and maintained by the Minneapolis Area Association of REALTORS®.

Single-Fam 761Townhouse 566
Local Market UpdatesA free research tool from the Northeast Florida Association of REALTORS®
Region 26
St. John's County, FL 2009 2010 Change 2009 2010 Change
New Listings 104 103 - 1.0% 614 639 + 4.1%Closed Sales 45 56 + 24.4% 155 211 + 36.1%Median Sales Price* $307,000 $315,000 + 2.6% $320,000 $310,000 - 3.1%Percent of Original List Price Received at Sale * 88.5% 87.3% - 1.4% 85.2% 87.7% + 2.9%Average Days on Market Until Sale 107 142 + 32.6% 124 146 + 17.7%Single-Family Detached Inventory 540 566 + 4.8% -- -- --Townhouse-Condo Inventory 260 195 - 25.0% -- -- --
Ponte Vedra Bch/S Ponte Vedra Beach/Vilano Bch/Palm Valley/Ponte
Vedra/Nocatee
*Does not account for seller concessions
May Year to Date
104
45
103
56
Activity—Most Recent Month
20092010
614
155
639
211
Activity—Year to Date
20092010
All data from the Northeast Florida Multiple Listing Service. Reports are created and maintained by the Minneapolis Area Association of REALTORS®.
New Listings Closed Sales
104
45
103
56
Activity—Most Recent Month
20092010
S f th fi f d i thi t f l th th f ti it A h th ti l k t d t th ll l i i l d
- 1.0% + 24.4%
New Listings Closed Sales
614
155
639
211
Activity—Year to Date
20092010
May Year to Date
$307,000 $320,000$315,000 $310,000
Median Sales Price
20092010
May Year to Date
88.5% 85.2%87.3% 87.7%
Percent of Original List Price Received at Sale
20092010
May Year to Date
107124
142 146Days on Market Until Sale
20092010
Single-Family Detached Townhouse-Condo Attached
540
260
566
195
Activity—Most Recent Month
20092010
+ 4.1% + 36.1%
+ 2.6% - 3.1% - 1.4% + 2.9%
+ 32.6% + 17.7% + 4.8% - 25.0%
All data from the Northeast Florida Multiple Listing Service. Reports are created and maintained by the Minneapolis Area Association of REALTORS®.
Single-Fam 942Townhouse 868
Local Market UpdatesA free research tool from the Northeast Florida Association of REALTORS®
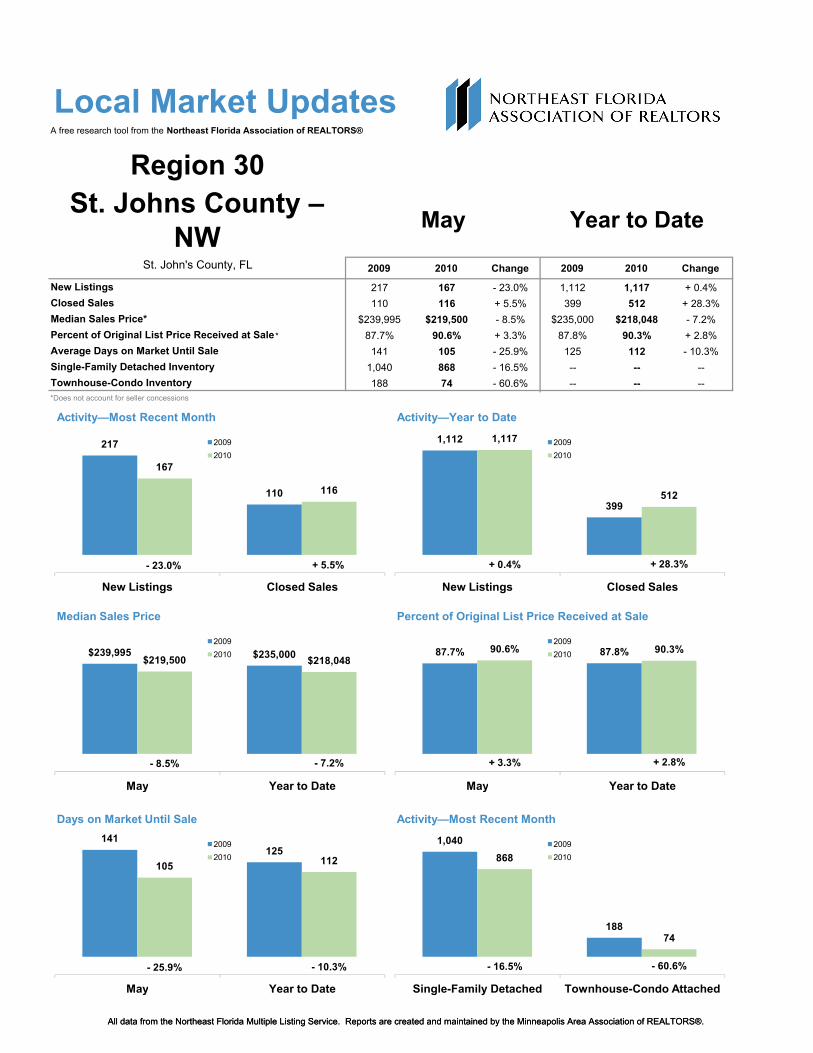
Region 30
St. John's County, FL 2009 2010 Change 2009 2010 Change
New Listings 217 167 - 23.0% 1,112 1,117 + 0.4%Closed Sales 110 116 + 5.5% 399 512 + 28.3%Median Sales Price* $239,995 $219,500 - 8.5% $235,000 $218,048 - 7.2%Percent of Original List Price Received at Sale * 87.7% 90.6% + 3.3% 87.8% 90.3% + 2.8%Average Days on Market Until Sale 141 105 - 25.9% 125 112 - 10.3%Single-Family Detached Inventory 1,040 868 - 16.5% -- -- --Townhouse-Condo Inventory 188 74 - 60.6% -- -- --
St. Johns County – NW
*Does not account for seller concessions
May Year to Date
217
110
167
116
Activity—Most Recent Month
20092010
1,112
399
1,117
512
Activity—Year to Date
20092010
All data from the Northeast Florida Multiple Listing Service. Reports are created and maintained by the Minneapolis Area Association of REALTORS®.
New Listings Closed Sales
217
110
167
116
Activity—Most Recent Month
20092010
S f th fi f d i thi t f l th th f ti it A h th ti l k t d t th ll l i i l d
- 23.0% + 5.5%
New Listings Closed Sales
1,112
399
1,117
512
Activity—Year to Date
20092010
May Year to Date
$239,995 $235,000$219,500 $218,048
Median Sales Price
20092010
May Year to Date
87.7% 87.8%90.6% 90.3%
Percent of Original List Price Received at Sale
20092010
May Year to Date
141125
105 112
Days on Market Until Sale
20092010
Single-Family Detached Townhouse-Condo Attached
1,040
188
868
74
Activity—Most Recent Month
20092010
+ 0.4% + 28.3%
- 8.5% - 7.2% + 3.3% + 2.8%
- 25.9% - 10.3% - 16.5% - 60.6%
All data from the Northeast Florida Multiple Listing Service. Reports are created and maintained by the Minneapolis Area Association of REALTORS®.

Single-Fam 140Townhouse 124
Local Market UpdatesA free research tool from the Northeast Florida Association of REALTORS®
Region 31
St. John's County, FL 2009 2010 Change 2009 2010 Change
New Listings 24 19 - 20.8% 148 150 + 1.4%Closed Sales 19 13 - 31.6% 40 57 + 42.5%Median Sales Price* $203,000 $295,055 + 45.3% $212,450 $255,000 + 20.0%Percent of Original List Price Received at Sale * 80.7% 93.1% + 15.4% 83.7% 88.4% + 5.7%Average Days on Market Until Sale 124 110 - 11.4% 136 128 - 6.5%Single-Family Detached Inventory 161 124 - 23.0% -- -- --Townhouse-Condo Inventory 41 16 - 61.0% -- -- --
St. Johns County – NE (West of Intracoastal
Waterway)
*Does not account for seller concessions
May Year to Date
24
1919
13
Activity—Most Recent Month
20092010
148
40
150
57
Activity—Year to Date
20092010
All data from the Northeast Florida Multiple Listing Service. Reports are created and maintained by the Minneapolis Area Association of REALTORS®.
New Listings Closed Sales
24
1919
13
Activity—Most Recent Month
20092010
S f th fi f d i thi t f l th th f ti it A h th ti l k t d t th ll l i i l d
- 20.8% - 31.6%
New Listings Closed Sales
148
40
150
57
Activity—Year to Date
20092010
May Year to Date
$203,000 $212,450
$295,055$255,000
Median Sales Price
20092010
May Year to Date
80.7% 83.7%93.1% 88.4%
Percent of Original List Price Received at Sale
20092010
May Year to Date
124136
110128
Days on Market Until Sale
20092010
Single-Family Detached Townhouse-Condo Attached
161
41
124
16
Activity—Most Recent Month
20092010
+ 1.4% + 42.5%
+ 45.3% + 20.0% + 15.4% + 5.7%
- 11.4% - 6.5% - 23.0% - 61.0%
All data from the Northeast Florida Multiple Listing Service. Reports are created and maintained by the Minneapolis Area Association of REALTORS®.

Single-Fam 99Townhouse 66
Local Market UpdatesA free research tool from the Northeast Florida Association of REALTORS®
Region 32
St. John's County, FL 2009 2010 Change 2009 2010 Change
New Listings 15 9 - 40.0% 66 70 + 6.1%Closed Sales 5 5 - 0.0% 30 29 - 3.3%Median Sales Price* $175,000 $155,000 - 11.4% $152,975 $189,000 + 23.5%Percent of Original List Price Received at Sale * 86.2% 87.3% + 1.2% 85.5% 85.1% - 0.4%Average Days on Market Until Sale 170 135 - 20.7% 166 137 - 17.2%Single-Family Detached Inventory 71 66 - 7.0% -- -- --Townhouse-Condo Inventory 37 33 - 10.8% -- -- --
St. John's County —St. Augustine Area
(East of US 1)
*Does not account for seller concessions
May Year to Date
15
5
9
5
Activity—Most Recent Month
20092010 66
30
70
29
Activity—Year to Date
20092010
All data from the Northeast Florida Multiple Listing Service. Reports are created and maintained by the Minneapolis Area Association of REALTORS®.
New Listings Closed Sales
15
5
9
5
Activity—Most Recent Month
20092010
S f th fi f d i thi t f l th th f ti it A h th ti l k t d t th ll l i i l d
- 40.0% - 0.0%
New Listings Closed Sales
66
30
70
29
Activity—Year to Date
20092010
May Year to Date
$175,000$152,975$155,000
$189,000
Median Sales Price
20092010
May Year to Date
86.2% 85.5%87.3% 85.1%
Percent of Original List Price Received at Sale
20092010
May Year to Date
170 166
135 137
Days on Market Until Sale
20092010
Single-Family Detached Townhouse-Condo Attached
71
37
66
33
Activity—Most Recent Month
20092010
+ 6.1% - 3.3%
- 11.4% + 23.5% + 1.2% - 0.4%
- 20.7% - 17.2% - 7.0% - 10.8%
All data from the Northeast Florida Multiple Listing Service. Reports are created and maintained by the Minneapolis Area Association of REALTORS®.
Single-Fam 474Townhouse 350
Local Market UpdatesA free research tool from the Northeast Florida Association of REALTORS®
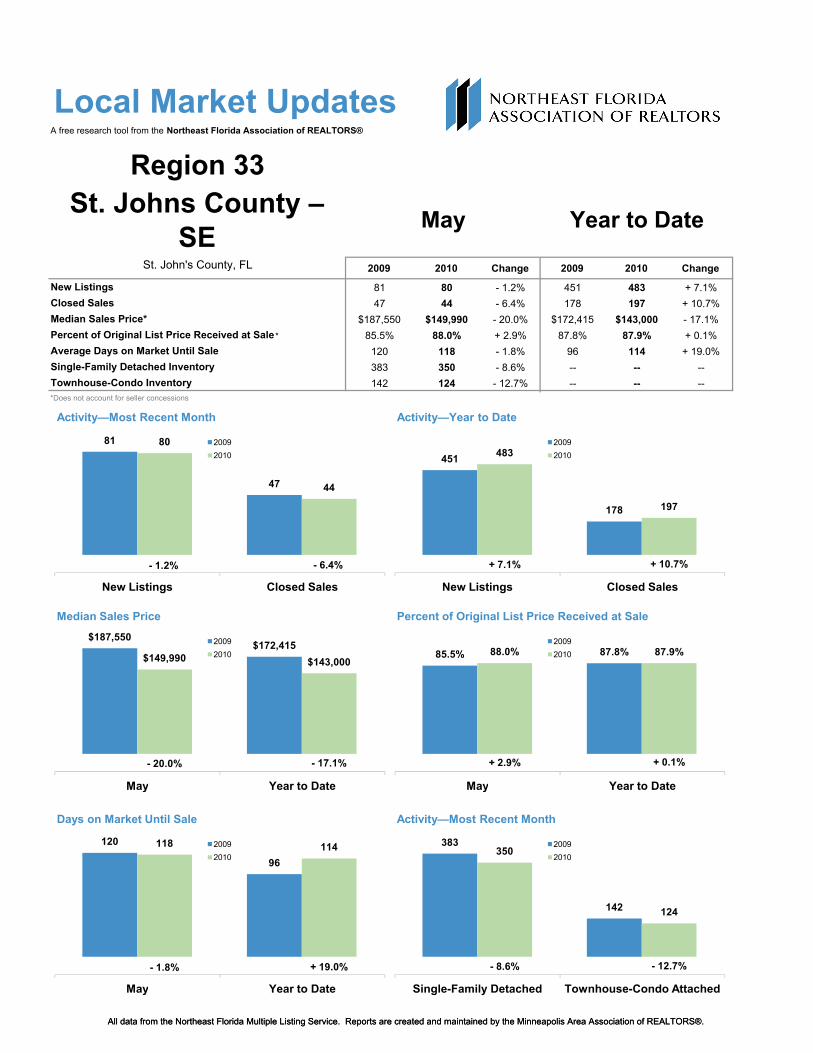
Region 33
St. John's County, FL 2009 2010 Change 2009 2010 Change
New Listings 81 80 - 1.2% 451 483 + 7.1%Closed Sales 47 44 - 6.4% 178 197 + 10.7%Median Sales Price* $187,550 $149,990 - 20.0% $172,415 $143,000 - 17.1%Percent of Original List Price Received at Sale * 85.5% 88.0% + 2.9% 87.8% 87.9% + 0.1%Average Days on Market Until Sale 120 118 - 1.8% 96 114 + 19.0%Single-Family Detached Inventory 383 350 - 8.6% -- -- --Townhouse-Condo Inventory 142 124 - 12.7% -- -- --
St. Johns County – SE
*Does not account for seller concessions
May Year to Date
81
47
80
44
Activity—Most Recent Month
20092010 451
178
483
197
Activity—Year to Date
20092010
All data from the Northeast Florida Multiple Listing Service. Reports are created and maintained by the Minneapolis Area Association of REALTORS®.
New Listings Closed Sales
81
47
80
44
Activity—Most Recent Month
20092010
S f th fi f d i thi t f l th th f ti it A h th ti l k t d t th ll l i i l d
- 1.2% - 6.4%
New Listings Closed Sales
451
178
483
197
Activity—Year to Date
20092010
May Year to Date
$187,550$172,415
$149,990 $143,000
Median Sales Price
20092010
May Year to Date
85.5% 87.8%88.0% 87.9%
Percent of Original List Price Received at Sale
20092010
May Year to Date
120
96
118 114
Days on Market Until Sale
20092010
Single-Family Detached Townhouse-Condo Attached
383
142
350
124
Activity—Most Recent Month
20092010
+ 7.1% + 10.7%
- 20.0% - 17.1% + 2.9% + 0.1%
- 1.8% + 19.0% - 8.6% - 12.7%
All data from the Northeast Florida Multiple Listing Service. Reports are created and maintained by the Minneapolis Area Association of REALTORS®.
Single-Fam 93Townhouse 93
Local Market UpdatesA free research tool from the Northeast Florida Association of REALTORS®
Region 34
St. John's County, FL 2009 2010 Change 2009 2010 Change
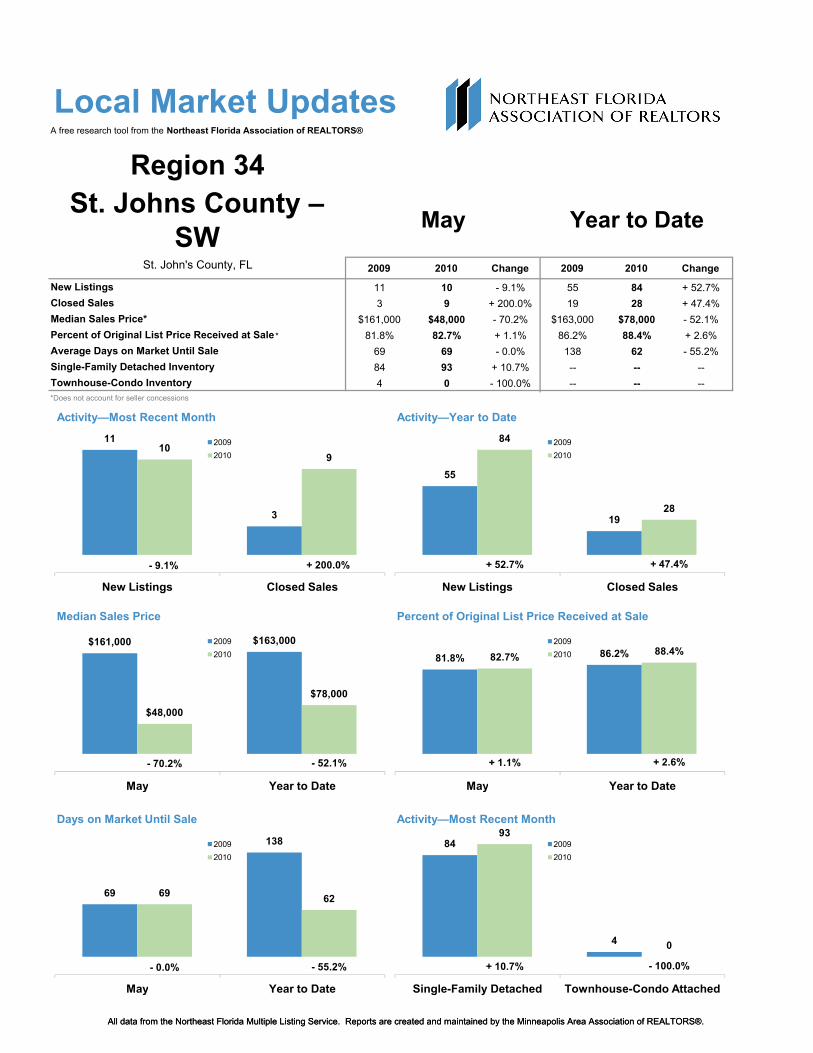
New Listings 11 10 - 9.1% 55 84 + 52.7%Closed Sales 3 9 + 200.0% 19 28 + 47.4%Median Sales Price* $161,000 $48,000 - 70.2% $163,000 $78,000 - 52.1%Percent of Original List Price Received at Sale * 81.8% 82.7% + 1.1% 86.2% 88.4% + 2.6%Average Days on Market Until Sale 69 69 - 0.0% 138 62 - 55.2%Single-Family Detached Inventory 84 93 + 10.7% -- -- --Townhouse-Condo Inventory 4 0 - 100.0% -- -- --
St. Johns County – SW
*Does not account for seller concessions
May Year to Date
11
3
109
Activity—Most Recent Month
20092010
55
19
84
28
Activity—Year to Date
20092010
All data from the Northeast Florida Multiple Listing Service. Reports are created and maintained by the Minneapolis Area Association of REALTORS®.
New Listings Closed Sales
11
3
109
Activity—Most Recent Month
20092010
S f th fi f d i thi t f l th th f ti it A h th ti l k t d t th ll l i i l d
- 9.1% + 200.0%
New Listings Closed Sales
55
19
84
28
Activity—Year to Date
20092010
May Year to Date
$161,000 $163,000
$48,000
$78,000
Median Sales Price
20092010
May Year to Date
81.8% 86.2%82.7% 88.4%
Percent of Original List Price Received at Sale
20092010
May Year to Date
69
138
69 62
Days on Market Until Sale
20092010
Single-Family Detached Townhouse-Condo Attached
84
4
93
0
Activity—Most Recent Month
20092010
+ 52.7% + 47.4%
- 70.2% - 52.1% + 1.1% + 2.6%
- 0.0% - 55.2% + 10.7% - 100.0%
All data from the Northeast Florida Multiple Listing Service. Reports are created and maintained by the Minneapolis Area Association of REALTORS®.

Single-Fam 365Townhouse 329
Local Market UpdatesA free research tool from the Northeast Florida Association of REALTORS®
Region 40
Nassau County, FL 2009 2010 Change 2009 2010 Change
New Listings 57 70 + 22.8% 332 376 + 13.3%Closed Sales 34 37 + 8.8% 126 169 + 34.1%Median Sales Price* $212,000 $149,990 - 29.3% $183,900 $149,900 - 18.5%Percent of Original List Price Received at Sale * 90.5% 88.4% - 2.3% 86.7% 86.3% - 0.5%Average Days on Market Until Sale 128 87 - 31.9% 112 119 + 6.2%Single-Family Detached Inventory 349 329 - 5.7% -- -- --Townhouse-Condo Inventory 44 36 - 18.2% -- -- --
Nassau County
*Does not account for seller concessions
May Year to Date
57
34
70
37
Activity—Most Recent Month
20092010 332
126
376
169
Activity—Year to Date
20092010
All data from the Northeast Florida Multiple Listing Service. Reports are created and maintained by the Minneapolis Area Association of REALTORS®.
New Listings Closed Sales
57
34
70
37
Activity—Most Recent Month
20092010
S f th fi f d i thi t f l th th f ti it A h th ti l k t d t th ll l i i l d
+ 22.8% + 8.8%
New Listings Closed Sales
332
126
376
169
Activity—Year to Date
20092010
May Year to Date
$212,000$183,900
$149,990 $149,900
Median Sales Price
20092010
May Year to Date
90.5% 86.7%88.4% 86.3%
Percent of Original List Price Received at Sale
20092010
May Year to Date
128112
87
119
Days on Market Until Sale
20092010
Single-Family Detached Townhouse-Condo Attached
349
44
329
36
Activity—Most Recent Month
20092010
+ 13.3% + 34.1%
- 29.3% - 18.5% - 2.3% - 0.5%
- 31.9% + 6.2% - 5.7% - 18.2%
All data from the Northeast Florida Multiple Listing Service. Reports are created and maintained by the Minneapolis Area Association of REALTORS®.

Single-Fam 152Townhouse 152
Local Market UpdatesA free research tool from the Northeast Florida Association of REALTORS®
Region 50
Baker County, FL 2009 2010 Change 2009 2010 Change
New Listings 22 33 + 50.0% 111 139 + 25.2%Closed Sales 6 8 + 33.3% 38 44 + 15.8%Median Sales Price* $200,000 $143,178 - 28.4% $151,000 $132,000 - 12.6%Percent of Original List Price Received at Sale * 86.7% 92.9% + 7.2% 87.1% 89.9% + 3.3%Average Days on Market Until Sale 123 172 + 40.4% 147 156 + 6.1%Single-Family Detached Inventory 123 152 + 23.6% -- -- --Townhouse-Condo Inventory 0 0 NA -- -- --
Baker County
*Does not account for seller concessions
May Year to Date
22
6
33
8
Activity—Most Recent Month
20092010
111
38
139
44
Activity—Year to Date
20092010
All data from the Northeast Florida Multiple Listing Service. Reports are created and maintained by the Minneapolis Area Association of REALTORS®.
New Listings Closed Sales
22
6
33
8
Activity—Most Recent Month
20092010
S f th fi f d i thi t f l th th f ti it A h th ti l k t d t th ll l i i l d
+ 50.0% + 33.3%
New Listings Closed Sales
111
38
139
44
Activity—Year to Date
20092010
May Year to Date
$200,000
$151,000$143,178 $132,000
Median Sales Price
20092010
May Year to Date
86.7% 87.1%92.9% 89.9%
Percent of Original List Price Received at Sale
20092010
May Year to Date
123147
172156
Days on Market Until Sale
20092010
Single-Family Detached Townhouse-Condo Attached
123
0
152
0
Activity—Most Recent Month
20092010
+ 25.2% + 15.8%
- 28.4% - 12.6% + 7.2% + 3.3%
+ 40.4% + 6.1% + 23.6% NA
All data from the Northeast Florida Multiple Listing Service. Reports are created and maintained by the Minneapolis Area Association of REALTORS®.

Single-Fam 374Townhouse 370
Local Market UpdatesA free research tool from the Northeast Florida Association of REALTORS®
Region 56
Putnam County, FL 2009 2010 Change 2009 2010 Change
New Listings 35 55 + 57.1% 195 254 + 30.3%Closed Sales 9 20 + 122.2% 48 79 + 64.6%Median Sales Price* $126,950 $72,450 - 42.9% $90,000 $74,900 - 16.8%Percent of Original List Price Received at Sale * 73.9% 78.5% + 6.2% 80.3% 82.8% + 3.0%Average Days on Market Until Sale 149 116 - 22.2% 149 133 - 10.9%Single-Family Detached Inventory 354 370 + 4.5% -- -- --Townhouse-Condo Inventory 6 4 - 33.3% -- -- --
Putnam County NE
*Does not account for seller concessions
May Year to Date
35
9
55
20
Activity—Most Recent Month
20092010
195
48
254
79
Activity—Year to Date
20092010
All data from the Northeast Florida Multiple Listing Service. Reports are created and maintained by the Minneapolis Area Association of REALTORS®.
New Listings Closed Sales
35
9
55
20
Activity—Most Recent Month
20092010
S f th fi f d i thi t f l th th f ti it A h th ti l k t d t th ll l i i l d
+ 57.1% + 122.2%
New Listings Closed Sales
195
48
254
79
Activity—Year to Date
20092010
May Year to Date
$126,950
$90,000$72,450 $74,900
Median Sales Price
20092010
May Year to Date
73.9%80.3%78.5% 82.8%
Percent of Original List Price Received at Sale
20092010
May Year to Date
149 149
116133
Days on Market Until Sale
20092010
Single-Family Detached Townhouse-Condo Attached
354
6
370
4
Activity—Most Recent Month
20092010
+ 30.3% + 64.6%
- 42.9% - 16.8% + 6.2% + 3.0%
- 22.2% - 10.9% + 4.5% - 33.3%
All data from the Northeast Florida Multiple Listing Service. Reports are created and maintained by the Minneapolis Area Association of REALTORS®.

Single-Fam 212Townhouse 212
Local Market UpdatesA free research tool from the Northeast Florida Association of REALTORS®
Region 57
Putnam County, FL 2009 2010 Change 2009 2010 Change
New Listings 41 24 - 41.5% 151 139 - 7.9%Closed Sales 12 9 - 25.0% 31 32 + 3.2%Median Sales Price* $35,900 $51,000 + 42.1% $39,500 $51,000 + 29.1%Percent of Original List Price Received at Sale * 71.1% 79.0% + 11.1% 76.7% 81.8% + 6.8%Average Days on Market Until Sale 132 216 + 63.6% 164 174 + 5.9%Single-Family Detached Inventory 252 212 - 15.9% -- -- --Townhouse-Condo Inventory 0 0 NA -- -- --
Putnam County – West
*Does not account for seller concessions
May Year to Date
41
12
24
9
Activity—Most Recent Month
20092010
151
31
139
32
Activity—Year to Date
20092010
All data from the Northeast Florida Multiple Listing Service. Reports are created and maintained by the Minneapolis Area Association of REALTORS®.
New Listings Closed Sales
41
12
24
9
Activity—Most Recent Month
20092010
S f th fi f d i thi t f l th th f ti it A h th ti l k t d t th ll l i i l d
- 41.5% - 25.0%
New Listings Closed Sales
151
31
139
32
Activity—Year to Date
20092010
May Year to Date
$35,900 $39,500
$51,000 $51,000
Median Sales Price
20092010
May Year to Date
71.1% 76.7%79.0% 81.8%
Percent of Original List Price Received at Sale
20092010
May Year to Date
132164
216
174
Days on Market Until Sale
20092010
Single-Family Detached Townhouse-Condo Attached
252
0
212
0
Activity—Most Recent Month
20092010
- 7.9% + 3.2%
+ 42.1% + 29.1% + 11.1% + 6.8%
+ 63.6% + 5.9% - 15.9% NA
All data from the Northeast Florida Multiple Listing Service. Reports are created and maintained by the Minneapolis Area Association of REALTORS®.

Single-Fam 311Townhouse 304
Local Market UpdatesA free research tool from the Northeast Florida Association of REALTORS®
Region 58
Putnam County, FL 2009 2010 Change 2009 2010 Change
New Listings 23 33 + 43.5% 177 200 + 13.0%Closed Sales 7 8 + 14.3% 60 56 - 6.7%Median Sales Price* $55,000 $54,000 - 1.8% $70,000 $50,000 - 28.6%Percent of Original List Price Received at Sale * 85.3% 79.9% - 6.4% 83.0% 80.5% - 3.0%Average Days on Market Until Sale 172 136 - 21.2% 151 190 + 26.0%Single-Family Detached Inventory 313 304 - 2.9% -- -- --Townhouse-Condo Inventory 6 7 + 16.7% -- -- --
Putnam County - South
*Does not account for seller concessions
May Year to Date
23
7
33
8
Activity—Most Recent Month
20092010
177
60
200
56
Activity—Year to Date
20092010
All data from the Northeast Florida Multiple Listing Service. Reports are created and maintained by the Minneapolis Area Association of REALTORS®.
New Listings Closed Sales
23
7
33
8
Activity—Most Recent Month
20092010
S f th fi f d i thi t f l th th f ti it A h th ti l k t d t th ll l i i l d
+ 43.5% + 14.3%
New Listings Closed Sales
177
60
200
56
Activity—Year to Date
20092010
May Year to Date
$55,000
$70,000
$54,000 $50,000
Median Sales Price
20092010
May Year to Date
85.3% 83.0%79.9% 80.5%
Percent of Original List Price Received at Sale
20092010
May Year to Date
172151
136
190Days on Market Until Sale
20092010
Single-Family Detached Townhouse-Condo Attached
313
6
304
7
Activity—Most Recent Month
20092010
+ 13.0% - 6.7%
- 1.8% - 28.6% - 6.4% - 3.0%
- 21.2% + 26.0% - 2.9% + 16.7%
All data from the Northeast Florida Multiple Listing Service. Reports are created and maintained by the Minneapolis Area Association of REALTORS®.