may 1, 2016.docx with charts
TRANSCRIPT
Option Queen Letter By the Option Royals
Jeanette Young, CFP®, CMT, CFTe, M.S.
4305 Pointe Gate Drive
Livingston, New Jersey 07039
www.OptnQueen.com
May 1, 2016
What does a weaker US Dollar mean for you and multinationals? Just as we advised almost a
year ago, that a strong US Dollar was deflationary and would hurt US multinationals, we are now
suggesting that a weaker US Dollar will be good for multinational earnings. The fly in this result
would occur if the global competition fights for their newly acquired market share by cutting
prices. As the US Dollar weakens, we gain market share and our products become more
competitive. Another result of a weaker US Dollar is its effect on the price of commodities
traded in US Dollars and that, has been on the rise. Is it time to diversify into commodities?
Perhaps it is. Remember the FOMC wants a little inflation in the pipeline, which will be
achieved by a weaker US Dollar. The problem is in controlling inflation, which, eventually will
become a problem. Inflation does lead to more spending and also an expansion of the economy.
The FOMC will be concerned with inflation but likely will allow it to bloom in an effort to
fertilize the slow growing economy.
What is the effect of negative interest rates? “”Go to the mattress” a phrase used in mob-family
wars now is applicable to where cash, say in Japan, goes when banks charge for warehousing
money. Would you pay a bank to hold your money or find a tin can in which to hide your cash
or perhaps the mattress on which you sleep. This kind of behavior can also lead to stashing your
savings in gold coins or bars. Cash in the tin can is a cheaper way to save insomuch as you may
not have to pay the spread between the actual value of the gold and the seller’s price demand.
We continue to suggest that the spread trade between platinum and gold will likely reward the
investor who buys platinum and sells gold. As a footnote, we have no positions in either at the
moment.
Dear politicians, Democracy is not the Republican or the Democratic Party but rather the voice
of the people. Want to know why we are so angry….we lost our voice and now, refuse to be
herded into either party’s plan. Isn’t it about time that we the people regained our collective
voices? If we vote for a representative to vote our wishes, they should do so on all ballots not
just one. How dare they not fill their fiduciary responsibilities! If convention delegate can’t vote
the people’s wishes, they should step down altogether. Why else would they have been sent
there? On the other hand, perhaps the vote count of the public should rule in electing a candidate

to represent the Party in an election. Corruption, payoffs, and back-room dealings have made the
typical American voters, both millennium as well as boomers, disgusted with this process!
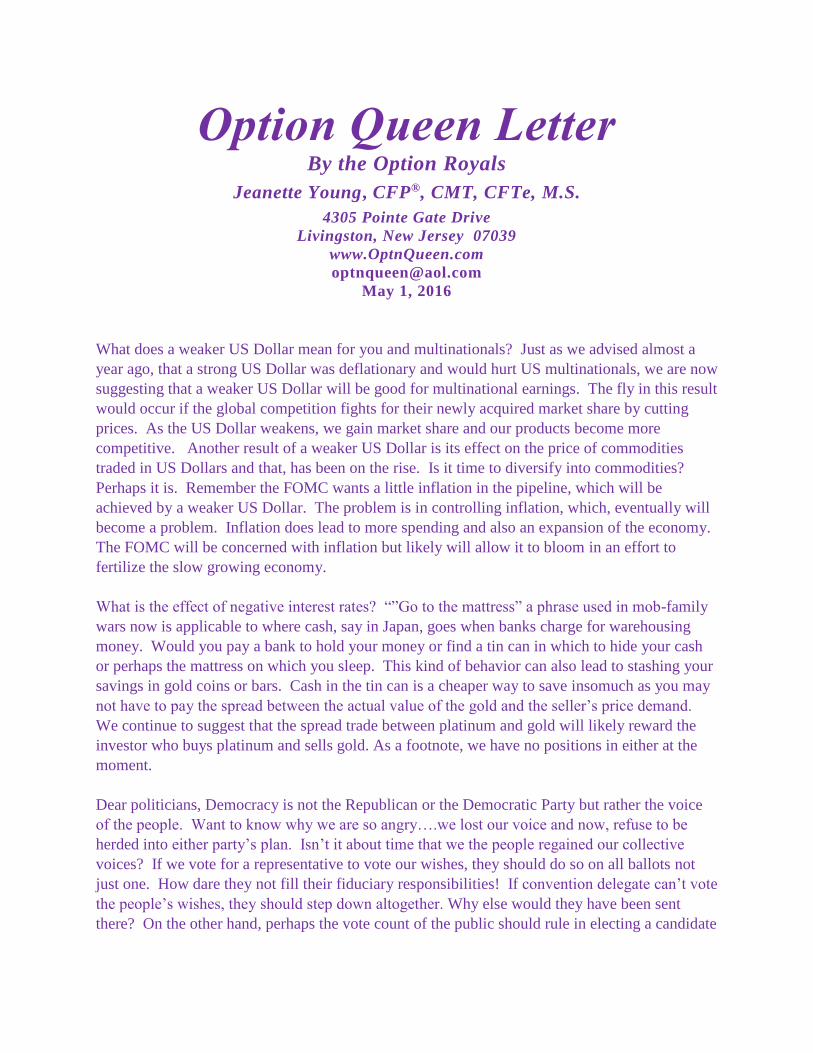
The S&P 500 retreated 12.25 handles (points) in the Friday last day of the month trading session.
All the indicators that we follow herein continue to point lower with room to the downside. The
Bollinger Bands are steady and are neither wide nor are they narrow. We should see support at
2034.25 and then at 2024.50. The next level down and a Fibonacci number is 1989. The
downward trending channel lines are 2092 and 2040. There is an uptrend line at 2046.17. There
are too many “sell in May and go away” chants to make us happy. Remember Farrell’s rule
number nine; “When all the experts and forecasts agree - something else is going to happen.”
The most frequently traded price was 2071. The weekly chart is beginning to roll over to the
downside. Remember that generally, money flows into the market in the beginning of the
month. All time-frames of the S&P 500 are worrisome, but time will tell if this is more than a
pull-back.

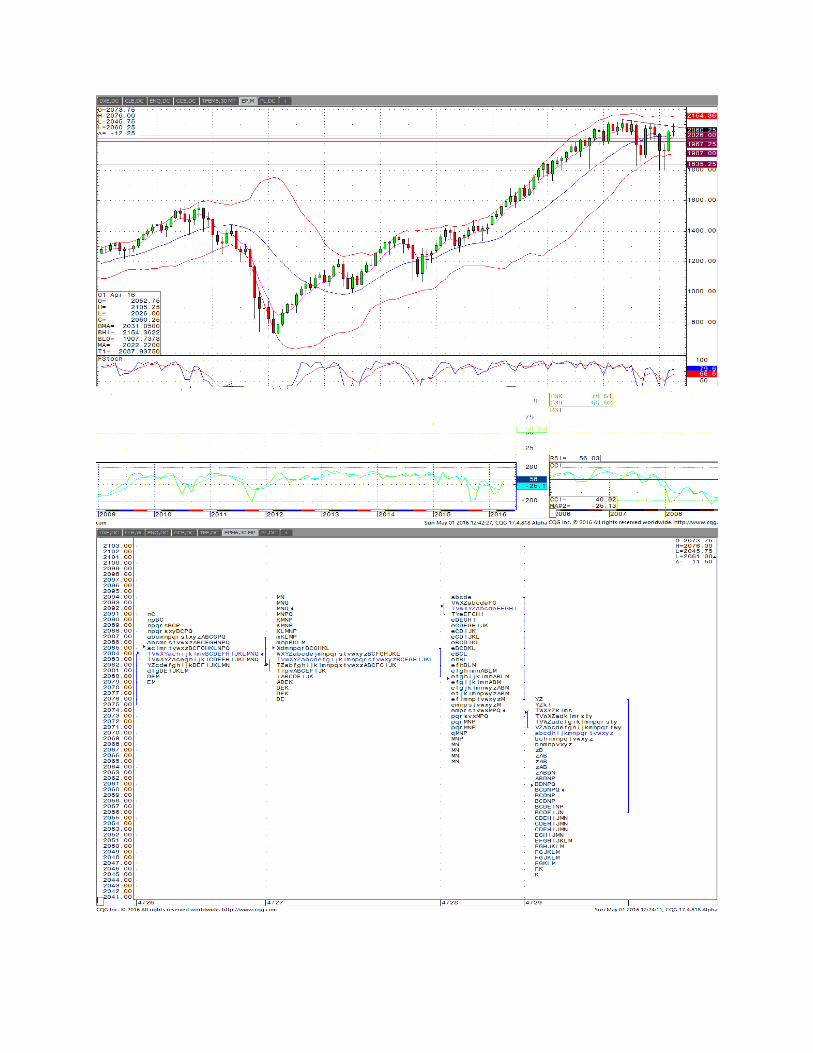

The NASDAQ 100 retreated 46.25 handles (points) in the Friday session forming a very well
organized retreat with a sustainable slope. The downward trending channel lines are 4443.39
and 4296.58. All the indicators that we follow herein are pointing lower, but there is some loss
of downside momentum insomuch as although we are printing lower lows the indicators, save
for the RSI, are printing higher lows. The volume accelerated in the Friday session. This could
be taken as a flush-out or action of trend following trades. The volume should be higher than it
was for a flush-out type of behavior. During the Friday session the 038% Fibonacci line was
briefly pierced and did offer this index support. The 50% line is 4219.87 and should offer better
support. The most frequently traded price was 4381. It is interesting to note that the lightly
traded area in the Thursday session fell between the top of one of the bimodal curves seen in the
Friday session. We continue to have a lightly traded area between 4361.50 and 4336.50.
Caution is warranted although we do expect to see a bounce in the near future.
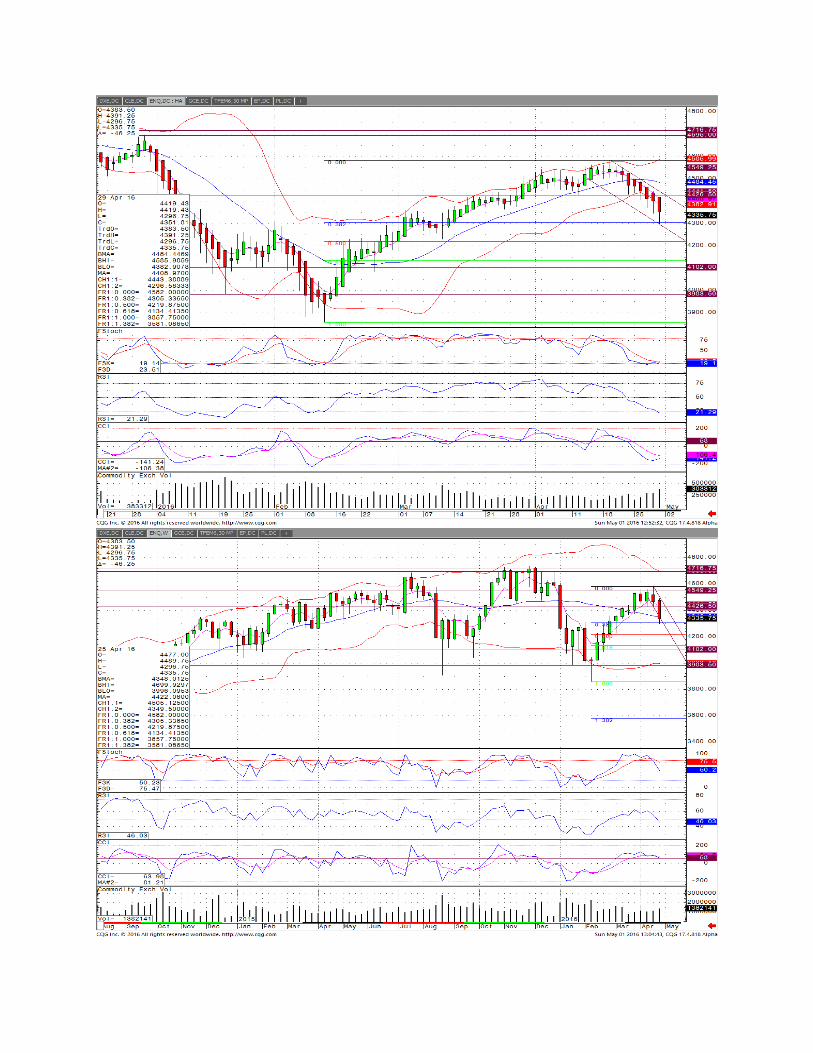


The Russell 2000 continued to outperform both the S&P 500 and the NASDAQ 100 in the
Friday session. This index lost 10.30 handles (points) in the session but did print a higher high
and a higher low. We have clearly broken above the long-term downtrend line and now are in an
upward trending channel with the top at 1162.03 and the bottom at 1115.42. All the indicators
that we follow are pointing lower with plenty of room to the downside. The volume picked up
slightly in the Friday session. The most frequently traded price was 1138.60 in the overnight
session. The most frequently traded price in the day session was 1129.50. The highest volume
was seen at 128.00 where 10.5% of the day’s volume traded. The Bollinger Bands are
contracting on the point and figure chart.


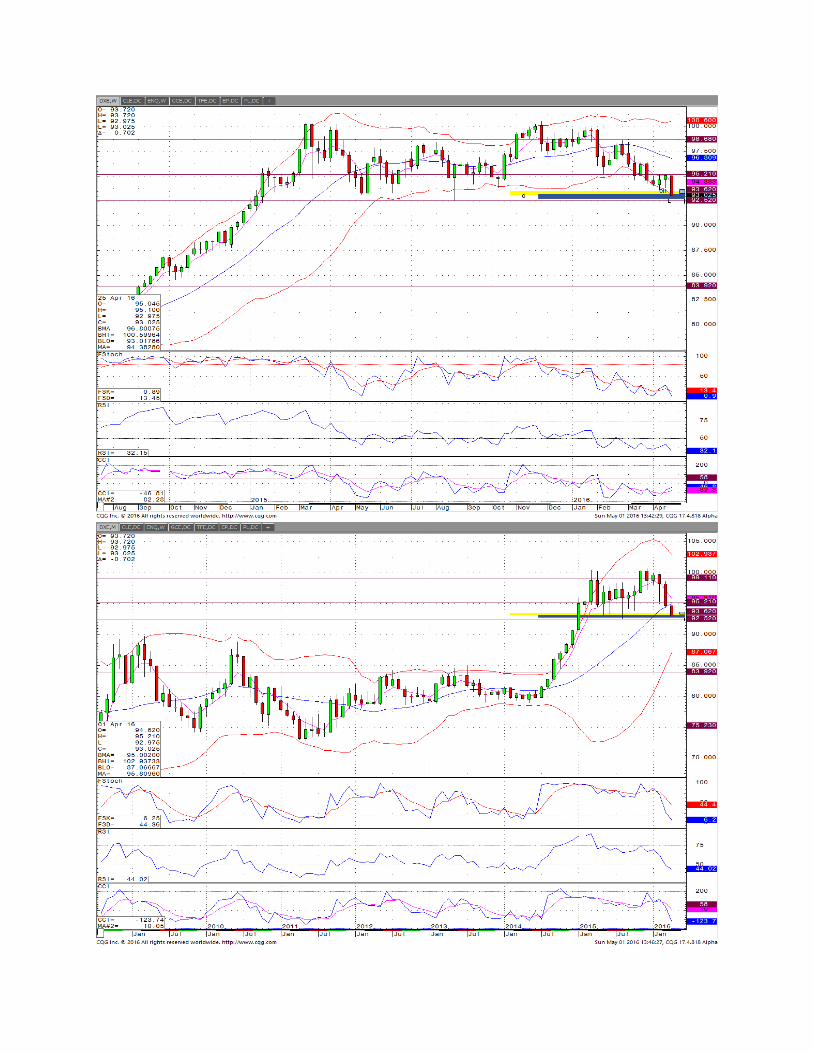
The US Dollar Index had a bad week but has not moved out of its trading range. The DXE
traded down 0.702 in the Friday session. On the weekly chart both the RSI and the stochastic
indicator are pointing lower; however, our own indicator is pointing higher. The Bollinger
Bands are beginning to expand on the weekly chart. This market needs to stay above 92.52 or
risk a quick trip to 89.39. This past week’s five-day retreat in the US Dollar Index has been, to
say the least, dramatic. All the indicators are pointing lower and are oversold. The volume isn’t
enough to call the week’s trade a flush-out to the downside so, there just might be a little further
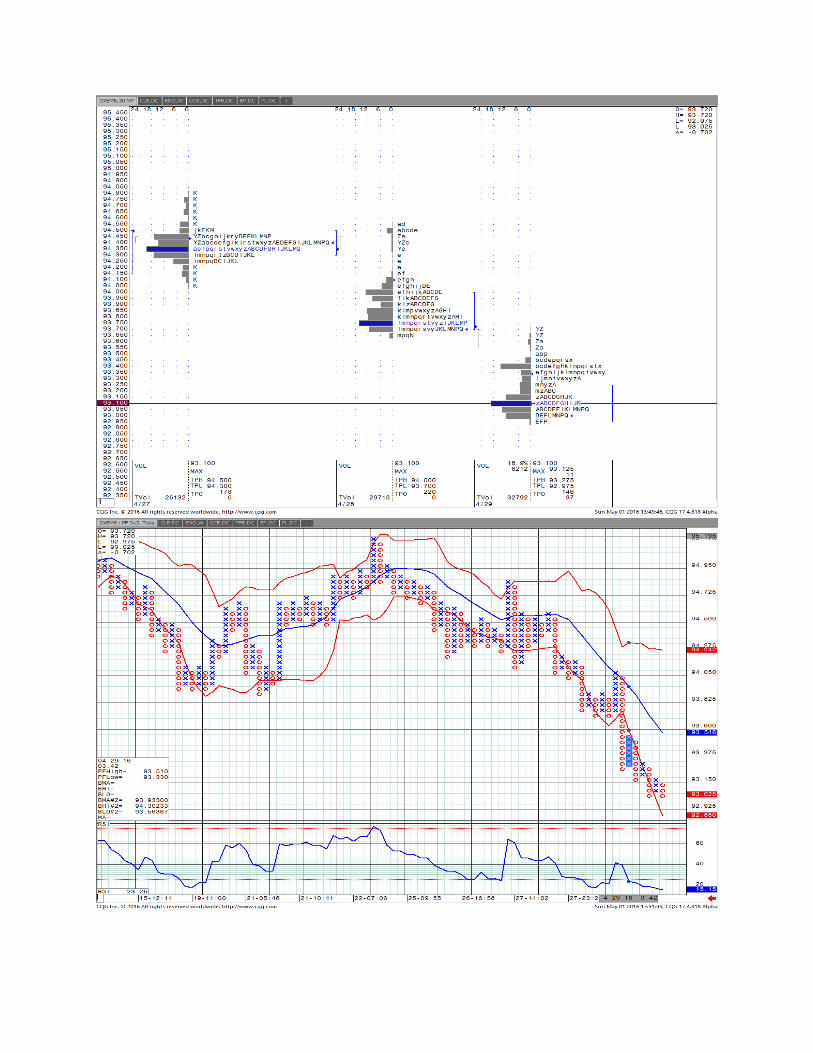
to go before buyers appear. The most frequently traded price was 93.35 which occurred in the
overnight session. The most frequently traded price in the day session was 93.01 and the greatest
volume was seen at 93.10 where 18.9% of the day’s volume traded. We have to watch this one
carefully to see if the horizontal support line holds the market, if not, we have a plunge in our
future which, would be good for our multinational earnings but bad for the consumer as prices
increase.
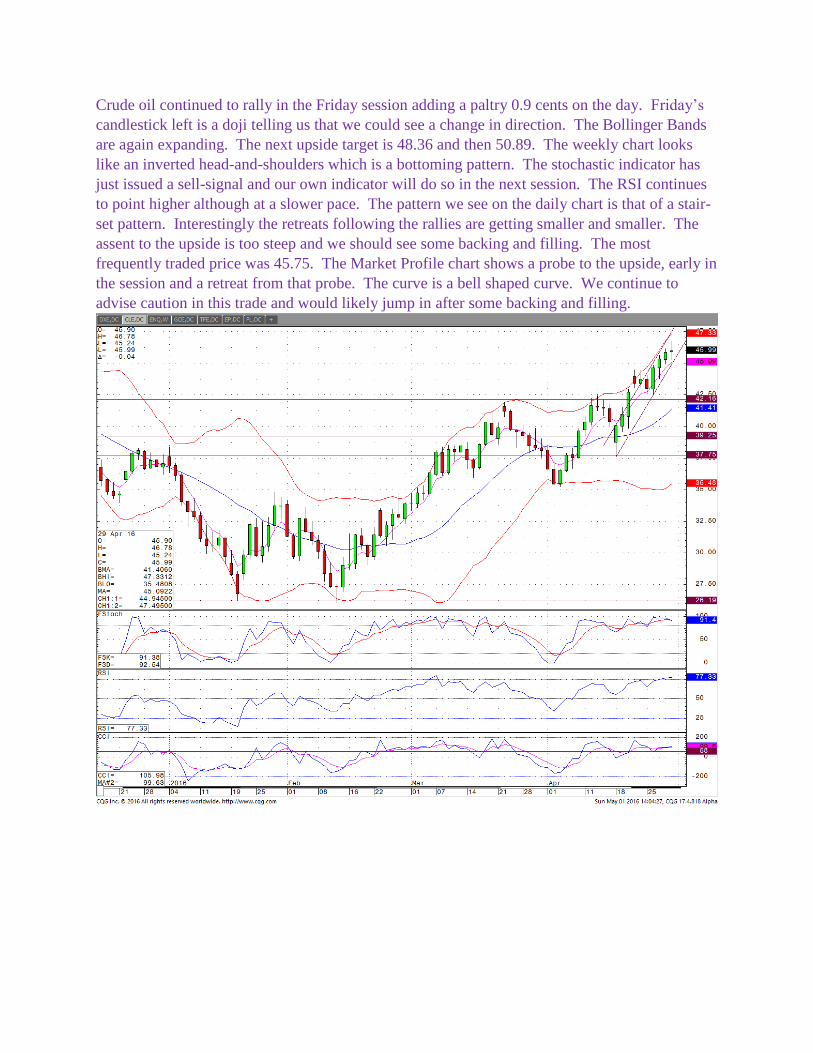
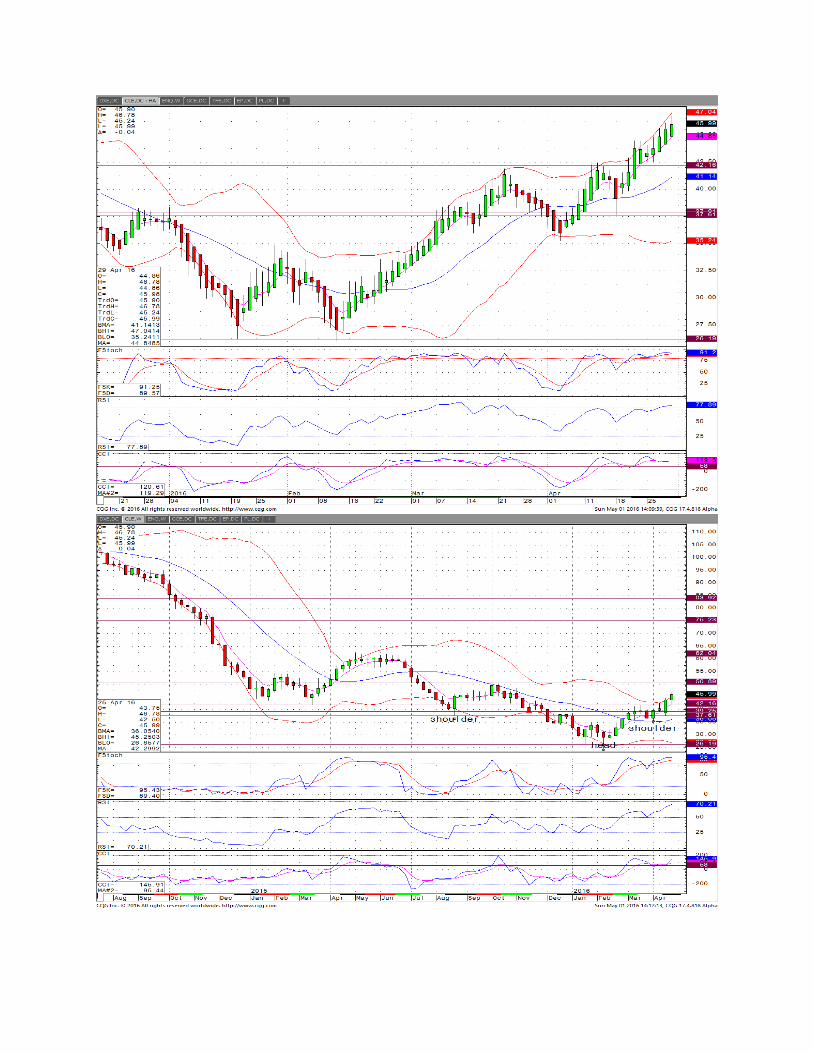
Crude oil continued to rally in the Friday session adding a paltry 0.9 cents on the day. Friday’s
candlestick left is a doji telling us that we could see a change in direction. The Bollinger Bands
are again expanding. The next upside target is 48.36 and then 50.89. The weekly chart looks
like an inverted head-and-shoulders which is a bottoming pattern. The stochastic indicator has
just issued a sell-signal and our own indicator will do so in the next session. The RSI continues
to point higher although at a slower pace. The pattern we see on the daily chart is that of a stair-
set pattern. Interestingly the retreats following the rallies are getting smaller and smaller. The
assent to the upside is too steep and we should see some backing and filling. The most
frequently traded price was 45.75. The Market Profile chart shows a probe to the upside, early in
the session and a retreat from that probe. The curve is a bell shaped curve. We continue to
advise caution in this trade and would likely jump in after some backing and filling.


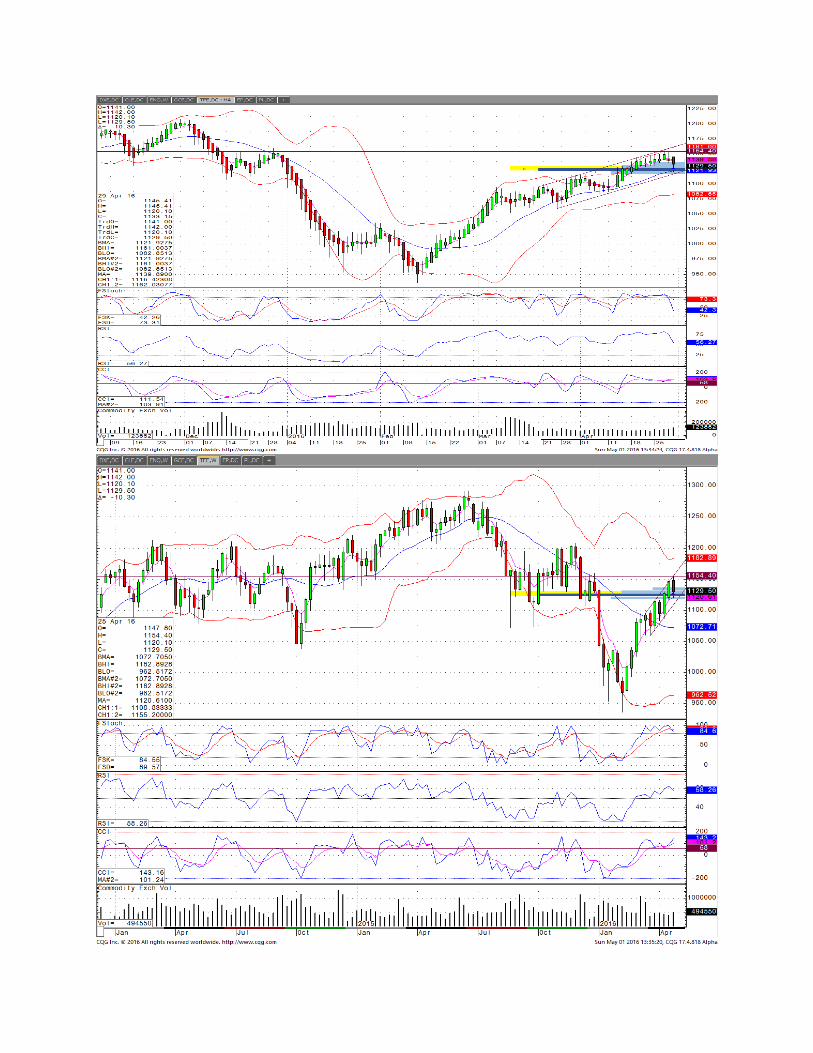
Gold rallied 28.50 handles (points) in the Friday session and finally broke out of its trading range
on somewhat increased volume. All the indicators that we follow herein are pointing higher
albeit at overbought levels. We need to see follow-through on this breech of the horizontal
resistance line. The next horizontal resistance level is 1307.80. This market traded higher in
each of the days this past week. Those who missed this rally seem to be dog-piling into the
trade. Gold closed above the upper Bollinger Band and it seems likely that it will retreat back
inside the band. The most frequently traded price was 1277.5 seen in the overnight session. The
most frequently traded price for the day session was 1292.5. Gold is overbought and needs to
back and fill, that said, the trend followers will continue to pile in until a retreat is seen. Trade
carefully, the market is fickle and changes its mind frequently.


Risk
Trading futures, options on futures and retail off-exchange foreign currency transactions involves
substantial risk of loss and is not suitable for all investors.
Past performance is not necessarily indicative of future results.
Copywrite 2016 The Option Royals