maximum solubility of cholesterol in phosphatidylcholine...
TRANSCRIPT

Maximum solubility of cholesterol in phosphatidylcholine andphosphatidylethanolamine bilayers
Juyang Huang, Je¡rey T. Buboltz, Gerald W. Feigenson *Section of Biochemistry, Molecular and Cell Biology, Cornell University, 201 Biotechnology Building, Ithaca, NY 14853, USA
Received 9 October 1998; received in revised form 21 December 1998; accepted 21 December 1998
Abstract
In any lipid bilayer membrane, there is an upper limit on the cholesterol concentration that can be accommodated withinthe bilayer structure; excess cholesterol will precipitate as crystals of pure cholesterol monohydrate. This cholesterolsolubility limit is a well-defined quantity. It is a first-order phase boundary in the phospholipid/cholesterol phase diagram.There are many different solubility limits in the literature, but no clear picture has emerged that can unify the disparateresults. We have studied the effects that different sample preparation methods can have on the apparent experimentalsolubility limit. We find that artifactual demixing of cholesterol can occur during conventional sample preparation and thatthis demixed cholesterol may produce artifactual cholesterol crystals. Therefore, phospholipid/cholesterol suspensions whichare prepared by conventional methods may manifest variable, falsely low cholesterol solubility limits. We have developed twonovel preparative methods which are specifically designed to prevent demixing during sample preparation. For detection ofthe cholesterol crystals, X-ray diffraction has proven to be quantitative and highly sensitive. Experiments based on thesemethods yield reproducible and precise cholesterol solubility limits: 66 mol% for phosphatidylcholine (PC) bilayers and51 mol% for phosphatidylethanolamine (PE) bilayers. We present evidence that these are true, equilibrium values. In contrastto the dramatic headgroup effect (PC vs. PE), acyl chain variations had no effect on the cholesterol solubility limit in fourdifferent PC/cholesterol mixtures. ß 1999 Elsevier Science B.V. All rights reserved.
Keywords: Liposome preparation; Cholesterol monohydrate; Cholesterol crystal; Demixing; X-ray di¡raction
1. Introduction
Most eukaryotic cells contain membrane sterolsand all vertebrates synthesize cholesterol [1]. Inmammalian cells, as much as 90% of all cholesterolcan be found in the plasma membrane [2]. Estimatesof the cholesterol content in animal cell plasma mem-
branes have ranged between 25 mol% and 50 mol%[1], implying that the interactions between cholesteroland other membrane components (including othercholesterols) might play a central role in establishingthe properties of the membrane.
Because pure cholesterol cannot form a bilayer,there must be an upper limit on the cholesterol con-centration that can be accommodated within anyphospholipid bilayer. Any excess cholesterol willtend to precipitate from the membrane as crystalsof pure cholesterol monohydrate. This cholesterolsolubility limit is a well-de¢ned quantity: a ¢rst-order phase boundary in the phospholipid/cholester-
0005-2736 / 99 / $ ^ see front matter ß 1999 Elsevier Science B.V. All rights reserved.PII: S 0 0 0 5 - 2 7 3 6 ( 9 8 ) 0 0 2 6 0 - 0
* Corresponding author. Fax: +1-607-255-2428;E-mail : [email protected]
BBAMEM 77560 1-2-99
Biochimica et Biophysica Acta 1417 (1999) 89^100
ol thermodynamic phase diagram. Determining thislimit for a systematic series of phospholipid/choles-terol mixtures would inform studies on the nature ofphospholipid^cholesterol interactions. Many re-searchers have sought to measure this solubility limitin a number of model systems [3^12] and thoughthere is no shortage of published work on the sub-ject, no clear picture has emerged which can unifythe disparate observations.
In principle, this solubility limit should be straight-forward to determine: bilayer suspensions of increas-ing cholesterol content are prepared and each sampleexamined to determine the critical mole fraction ofcholesterol at which crystals begin to form. In theinitial stages of this study, we found that severalmethods (e.g., 90³ light scattering, X-ray di¡raction,ultra¢ltration) could be used e¡ectively to determinethe point at which cholesterol crystals appear in dif-ferent phospholipid mixtures. But regardless ofwhich detection method we used, it became clearthat the reproducibility of these `straightforward' sol-ubility limits was surprisingly poor. We were gradu-ally forced to conclude that the source of this varia-bility was heterogeneity in the samples themselves,caused by demixing between components duringsample preparation. Indeed, Davis has reported dif-¢culty in preparing homogeneous suspensions ofphospholipid/cholesterol mixtures [13], and it haslong been suggested that artifacts arising from sam-ple preparation could explain the confusion whichsurrounds cholesterol solubility limits in bilayers[6,7].
In this study, we report the determination of sol-ubility limits for four di¡erent phosphatidylcholine(PC)/cholesterol mixtures and one phosphatidyletha-nolamine (PE)/cholesterol mixture. For all of the PC/cholesterol mixtures, these solubility limits are essen-tially indistinguishable, falling near 66 mol% choles-terol. In stark contrast, the cholesterol solubility lim-it in a phosphatidylethanolamine bilayer is onlyabout 51 mol%. We will present evidence that theseare the true, equilibrium solubility limits for choles-terol in each of these bilayers. Phospholipid/choles-terol demixing artifacts, which can obscure the truesolubility limit in conventionally prepared samples,will be discussed as will two independent preparativemethods which we have developed to avoid theseartifacts.
2. Materials and methods
Phospholipids were purchased from Avanti PolarLipids (Alabaster, AL), cholesterol from Nu ChekPrep (Elysian, MN). Purity (s 99%) was con¢rmedby thin layer chromatography on washed, activat-ed silica gel plates (Alltech Associates, Deer¢eld,IL), developing with chloroform/methanol/water =65:25:4 for phospholipid analysis or with petroleumether/ethyl ether/chloroform = 7:3:3 for cholesterolanalysis. All solvents used were of HPLC grade.TLC plates were quantitated by charring and densi-tometry. Phospholipid stock solutions were quanti-tated by phosphate assay [14]. Aqueous bu¡er (pH7.0, 5 mM PIPES, 200 mM KCl) was prepared frompuri¢ed water (Milli-Q system, Millipore) and ¢l-tered through a 0.1 Wm ¢lter before use. FEP Te£onOak Ridge centrifuge tubes were purchased fromNalge Company. One-mm, special glass X-ray capil-laries were purchased from Charles Supper (Natick,MA).
2.1. Liposome preparations
2.1.1. Film depositionComponents were codissolved in CHCl3 and bulk
solvent removed under a gentle stream of nitrogengas, depositing a lipid ¢lm on the surface of a testtube. Any remaining solvent residue was removed byvacuum incubation for V10 h at a measured pres-sure of V30 mTorr. Deposited ¢lms were hydratedin aqueous bu¡er at room temperature and dispersedby vortexing for 1 min. Samples containing di16:0-PC were hydrated and vortexed at 50³C, before beingcooled slowly to room temperature. All samples weresealed under argon after hydration.
2.1.2. LyophilizationComponents were codissolved in cyclohexane/
methanol, 99:1, and this solution was frozen in liquidnitrogen. The sample was placed in a vacuum desic-cator on water ice and bulk solvent was removed bysublimation under vacuum. After bulk solvent hadbeen removed, the desiccator was warmed to roomtemperature and the vacuum incubation was contin-ued for V10 h at V30 mTorr. The voluminous lipidpowders were hydrated, vortexed and sealed underargon in the same manner as the ¢lms.
BBAMEM 77560 1-2-99
J. Huang et al. / Biochimica et Biophysica Acta 1417 (1999) 89^10090

2.1.3. Rapid solvent exchange (RSE)This method has recently been described in detail
elsewhere [15]. Brie£y, lipids were codissolved in 10^100 Wl of dichloromethane (0.1% MeOH, 0.05%H2O) and then sprayed into vortexing bu¡er at re-duced pressure, rapidly vaporizing the solvent andprecipitating the lipid mixture in an aqueous environ-ment. For sample preparation of mixtures containingdi16:0-PC, the bu¡er was maintained at 50³Cthroughout the RSE procedure, before cooling toroom temperature. All samples were sealed underargon immediately following RSE.
2.1.4. Low-temperature trapping (LTT)This method will soon be described in detail else-
where (Huang and Feigenson, in preparation). Lipidswere dissolved in CHCl3 and the solvent removedunder vacuum at V30 mTorr for V10 h. Lipidswere re-dissolved in dry chloroform containing 1%methanol, then frozen in liquid nitrogen. Sampleswere lyophilized at low temperature, carefully con-trolling the temperature so that the chloroform re-mains solid. After bulk solvent had been removed,the lipid powders were kept cool (320³C) duringcontinued vacuum incubation (V12 h) to removeresidual solvent. Just before hydration, the samplewas warmed to room temperature in a stirring waterbath for 1 min, then bu¡er added to the dry powder.The suspension was immediately vortexed for 1 min.Samples containing di16:0-PC were hydrated andvortexed at 50³C. All samples were sealed under ar-gon following hydration.
2.2. Cholesterol crystal detection
The measurements described below were all madeat room temperature (23^25³C).
2.2.1. Optical microscopyOptical microscopy was used to detect cholesterol
crystals in lipid dispersions. A Zeiss IM35 micro-scope was used in either phase-contrast, bright¢eld,or polarized mode. A Nikon Fluor 100U and a 40Uoil immersion objective were used. Typically, 10 Wl ofa 3-mM lipid dispersion was viewed on a thin cover-glass. Images were captured and enhanced by a DageMTI CCD-72 camera (Dage MTI, IN) and viewedon a video monitor.
2.2.2. Light scatteringNinety-degree light scattering was measured using
a Hitachi £uorescence spectrophotometer (model F-3010) interfaced to a Macintosh computer. Sampleswere illuminated at 500 nm (1.5-mm slit ; 500-nminterference ¢lter) with detection at 500 nm (1.5-mm slit). About 1.5 ml of a 100 WM suspensionwas added to a cuvette with a masked stirbar. Scat-tered light intensity was averaged over 1 min.
2.2.3. X-Ray di¡ractionHydrated liposome dispersions made by ¢lm dep-
osition, lyophilization, or LTT were ¢rst pelleted at1000Ug for 10^25 min; dispersions made by RSEwere pelleted at 20 000Ug for 15 min. The lipid sedi-ment was loaded into thin-walled 1.0 mm glass X-raycapillaries and further centrifuged in a buoyant sup-port apparatus [15] at 20 000Ug for 15 min to pro-duce a uniformly dense pellet. Typically, white lipidsediment ¢lled the bottom 4^8 mm of the capillary,with clear bu¡er above. Capillaries were sealed bypara¤n wax under argon gas. A typical sample con-tained about 1.5 mg of lipid.
X-Ray di¡raction experiments were carried out atthe A-1 and F-1 beamlines at the MacromolecularDi¡raction Facility at the Cornell High Energy Syn-chrotron Source (MacCHESS). Samples were illumi-nated by an intense synchrotron X-ray beam, with awavelength of 0.908 Aî , passing through a 0.2-mmcollimator. Di¡raction images were collected with aPrinceton 2K CCD detector containing 2048U204841-Wm pixels [16,17]. At the sample-to-detector dis-tance of 280 mm, the wide dynamic range (16 bits)and the resolution of the CCD detector allowed cap-ture of both the low-angle and wide-angle di¡ractionpatterns (from 3.8 Aî to 110 Aî ) simultaneously on thesame image. Depending on beam intensity and sam-ple density, the exposure time for hydrated samplesvaried from 10 to 80 s; for dry samples, 0.5 to 3.0 s.
Capillaries were mounted in a sample holdercoupled to a computer-controlled stepping-motorstage which could move vertically or horizontally,perpendicular to the beam. Samples were scanned2^3 mm along the capillary axis during exposure,using the stepping motor. This procedure reducesradiation damage to the lipid and achieves more rep-resentative sampling.
Image ¢les were corrected for geometric distor-
BBAMEM 77560 1-2-99
J. Huang et al. / Biochimica et Biophysica Acta 1417 (1999) 89^100 91

tions introduced by the CCD camera. To transformthe powder patterns into radial pro¢les of di¡ractionintensity, each image was circularly integrated (usingthe IMP program [18] provided by CHESS). Thecenter of the beam and the tilt angle of the detectorsurface were precisely determined to prevent linebroadening. Di¡raction peaks in Bragg spacingwere calibrated using the Ca(PS)2 line at 49.1 Aî asa standard [19].
3. Results
3.1. Detection methods
We use the term M�chol to refer to the critical bilayermole fraction of cholesterol above which excess cho-lesterol precipitates as the monohydrate crystal. Avariety of methods were used to determine this sol-ubility limit; three of these are discussed below.
3.1.1. Light microscopyThe advantage of light microscopy is that choles-
terol crystals and lipid vesicles can be identi¢ed bydirect, visual observation. Each sample in a series issearched for crystals of cholesterol monohydrate, try-ing to determine the mole fraction of cholesterolabove which cholesterol crystals are present. As amethod for the determination of M�chol, light micro-
scopy was imperfect for three reasons. First, opticalmicroscopy does not resolve crystals on a scale muchsmaller than 1 Wm. Second, the quantity of crystalscannot be reliably estimated, due to variations incrystal size and thickness. Third, the nature of sucha visual search makes it possible that cholesterolcrystals will be missed in samples near M�chol, even ifmultiple sample aliquots are examined. Therefore,light microscopy serves best as a supporting techni-que.
Cholesterol crystals were identi¢ed mainly by theirshape using bright¢eld microscopy. Although choles-terol crystals have strong birefringence, polarizedlight microscopy was not very useful for our pur-pose. In samples of cholesterol content just aboveM�chol, the number and sizes of crystals are usuallysmall. Rotation of polarized light by crystals wasvery weak in these samples, whereas birefringencefrom the plentiful lipid vesicles overwhelmed the ¢eldof view.
3.1.2. 90³ Light scatteringDetermination of M�chol by 90³ light scattering ex-
ploits the di¡erences in size, structure and refractiveindex between cholesterol crystals and bilayervesicles. For many phospholipid/cholesterol mix-tures, a sudden increase in signal intensity correlateswith the appearance of cholesterol crystals by X-raydi¡raction (data not shown). However, this method
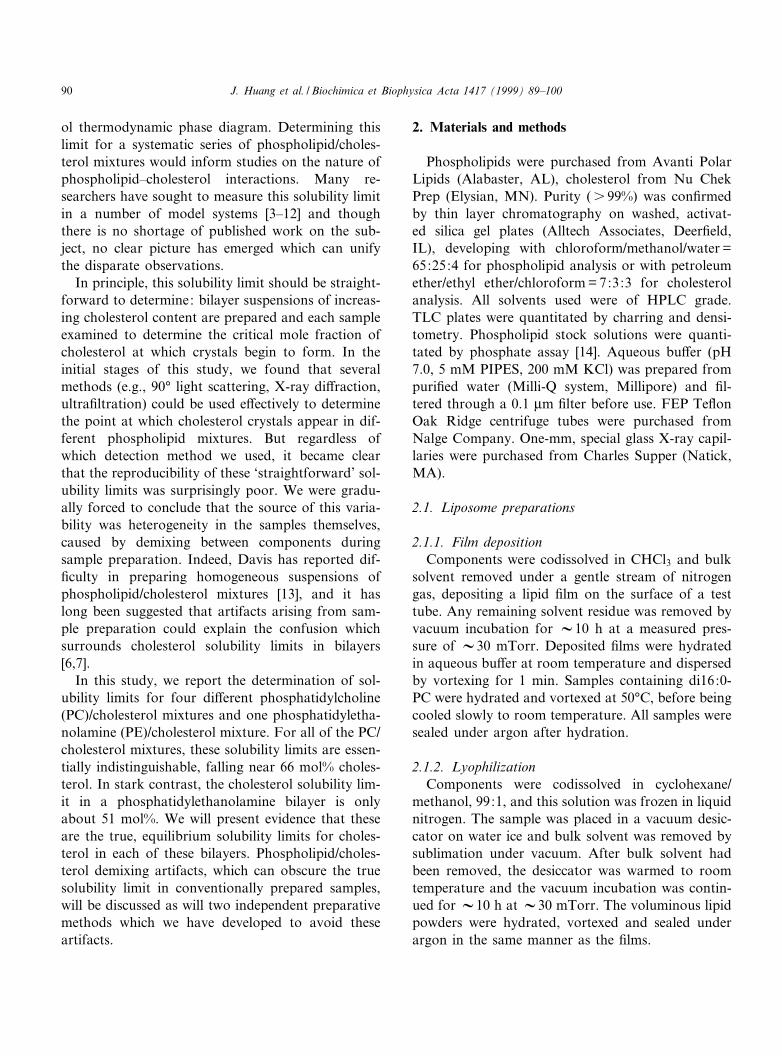
Fig. 1. X-Ray di¡raction powder patterns for two di12:0-PC/cholesterol mixtures prepared by LTT: (a) with Mchol = 0.60, only lipid la-mellar di¡raction is detected; (b) with Mchol = 0.73, di¡raction from lipid lamellae as well as from cholesterol monohydrate crystals isdetected.
BBAMEM 77560 1-2-99
J. Huang et al. / Biochimica et Biophysica Acta 1417 (1999) 89^10092

does not work well with all preparations. We foundthat light scattering did not reveal M�chol in mixturesof cholesterol with 16:0,18:1-PE.
3.1.3. X-Ray di¡ractionFig. 1a shows an X-ray di¡raction powder pattern
for a di12:0-PC/cholesterol mixture with Mchol = 0.60.The two, low-angle concentric rings are the ¢rst- andthe second-order lamellar repeats. The radial pro¢leof di¡raction intensity is shown in Fig. 2a; the peaksat 58.6 Aî and 29.3 Aî correspond to the ¢rst- andsecond-order lamellar repeats, respectively. Thewide-angle data reveal a broad, di¡use peak centeredat 4.85 Aî , as shown in Fig. 2b.
Fig. 1b shows the powder pattern obtained for adi12:0-PC/cholesterol mixture with Mchol = 0.73. Thecholesterol composition in this sample exceeds themaximum solubility of cholesterol in a di12:0-PCbilayer (see below). Therefore, in addition to lamellarphase lipid, this sample also shows the di¡ractionpattern characteristic of cholesterol monohydrate
crystals [20,21]. The radial pro¢le of di¡raction in-tensity is shown in Fig. 2c. Peaks correspond to themain cholesterol monohydrate repeat at 33.94Aî
(¢rst-order) and 16.97 Aî (second-order). Hereafter,we will refer to these as the 34 Aî and 17 Aî peaks.In the wide-angle region (Fig. 2d), a number of sharppeaks are evident which are characteristic of choles-terol monohydrate, at spacings between 4 and 6 Aî . Abroad 4.85 Aî peak, caused by lateral order within thebilayer (Fig. 2b), gradually weakens and disappearswith increasing cholesterol crystal content. Thiswould seem to indicate that accumulation of choles-terol crystals can somehow disrupt lateral packingwithin the bilayer.
An advantage of the X-ray di¡raction detectionmethod is that it yields separate, characteristic sig-nals for lamellar phase lipid and cholesterol mono-hydrate. This also allows a quantitative measure ofthe amount of crystalline cholesterol in a sample,once a radial pro¢le of di¡raction intensity hasbeen produced from the powder pattern. As Fig. 2c
Fig. 2. Radial pro¢les of di¡raction intensity for the mixtures shown in Fig. 1. (a,b) Low-angle and wide-angle di¡raction for thesample shown in Fig. 1a; (c,d) low-angle and wide-angle di¡raction for the sample shown in Fig. 1b.
BBAMEM 77560 1-2-99
J. Huang et al. / Biochimica et Biophysica Acta 1417 (1999) 89^100 93

shows, the quantity of cholesterol crystals can beassessed through integration of either the 34 Aî , the17 Aî , or the wide-angle peaks between 4 and 6 Aî .Although the 34 Aî peak is the strongest, it oftenoverlaps with the second-order lamellar-repeatpeak. Therefore, we generally use the 17 Aî peak asthe quantitative indicator. This peak is sharp and thelocal background is relatively smooth and £at. Wede¢ne the cholesterol crystal di¡raction intensity Ic
as
I c � �Ia�16:5 �A; 17:5 �A�3Ibaseline�=Ibeam �1�
where Ia(A,B) is the average di¡raction intensitybetween A and B in Bragg spacing, Ibaseline is thebackground intensity near the 17 Aî peak
Ibaseline � �Ia�16:0 �A; 16:5 �A� � Ia�17:5 �A; 18 �A��=2
�2�and Ibeam is an exposure factor
Ibeam � Ia�90 �A; 100 �A� �3�The major sources of noise in Ic were from nonrep-resentative sampling and inconsistent sample density.The signal-to-noise ratio was signi¢cantly improvedby scanning the samples during exposure, and bypelleting samples in the capillaries with high speedcentrifugation.
3.2. Sample preparation and equilibrium
3.2.1. Variable results by two conventionalpreparation methods
In sets of samples prepared by either ¢lm deposi-tion or lyophilization, each individual experimentyielded an apparent M�chol value. Unfortunately, thereproducibility between experiments was surprisinglypoor (Table 1), and this variability far exceeded theuncertainty in the experimental measurements. Forexample, 26 separate experiments were performedon 16:0,18:1-PC/cholesterol mixtures prepared by
lyophilization, and the apparent M�chol values rangedfrom 51^65 mol% cholesterol.
3.2.2. Artifactual cholesterol demixingFig. 3 shows the radial pro¢le of di¡raction inten-
sity of a 16:0,18:1-PC/cholesterol deposited ¢lm, atMchol = 0.60, on a semi-logarithmic scale. This patternshows a set of lamellar repeats together with a set ofpeaks which correspond to anhydrous cholesterolcrystals [22]. This con¢rms that some cholesterolhas demixed from the phospholipid, forming crystalsof pure cholesterol. Fig. 4 shows the 17 Aî di¡ractionintensity due to anhydrous cholesterol crystals as afunction of cholesterol content for a set of 16:0,18:1-PC/cholesterol deposited ¢lms. In this set of samples,anhydrous cholesterol crystals are present in everysample for which Mchol s 0.45.
Fig. 5 (squares) shows cholesterol crystal di¡rac-tion intensity (Ic in Eq. 1), from cholesterol mono-hydrate vs. Mchol for a set of 16:0,18:1-PC/cholesterolmixtures which were hydrated from deposited ¢lms.After hydration, each sample was vortexed for 2 min.The dispersions were incubated at room temperaturefor 7 days, with 2 min of vortexing each day, beforebeing transferred to capillaries and subjected to
Fig. 3. Radial pro¢le of X-ray di¡raction intensity of a16:0,18:1-PC/cholesterol deposited ¢lm, at Mchol = 0.60. Peakscorrespond to dry lipid lamellae, as well as to anhydrous cho-lesterol crystals.
Table 1Variable, apparent cholesterol solubility limits observed in PC bilayers prepared by conventional preparation methods
Bilayer type Range of apparent solubility limits by ¢lm deposition Range of apparent solubility limits by lyophilization
16:0,18:1-PC 0.55^0.63 0.51^0.65di16:0-PC 0.45^0.57 0.50^0.56
BBAMEM 77560 1-2-99
J. Huang et al. / Biochimica et Biophysica Acta 1417 (1999) 89^10094

X-ray di¡raction. Although the true, equilibriumM�chol value is 0.66 (see Section 4), cholesterol crystalswere detected in samples with Mchol as low as 0.51.The same samples were examined again after incu-bating them at room temperature for 10 weeks fur-ther. As shown in Fig. 5 (crosses), cholesterol crystallevels were slightly reduced, indicating that somecholesterol from the crystals had remixed with thelamellar phase lipid. Therefore, we sought to deter-mine whether mechanical stirring or heating mightaccelerate remixing. Two identical sets of 16:0,18:1-PC/cholesterol dispersions were prepared by lyophi-lization and examined by light microscopy. Initially,the apparent M�chol value was 0.52 for each set. Thesample sets were then incubated under argon, at ei-ther 24³C or 45³C, with each sample constantly agi-tated by a small stirbar. Samples were £ushed withargon and resealed every 3 days. After 1 month ofincubation, the sample sets were re-examined by lightmicroscopy. The apparent M�chol values had increased
to about 0.57 or 0.60 for the sample sets incubated at24³C and 45³C, respectively. The lipid was extractedand examined by TLC, and no signi¢cant breakdownwas found.
Although the majority of anhydrous cholesterolcrystals were converted to monohydrate crystals afterhydration, traces of anhydrous crystals were found inmany of the mixtures prepared by ¢lm deposition orlyophilization, days after hydration. It has been dem-
Fig. 6. Evidence of trace anhydrous cholesterol crystals in fullyhydrated samples prepared by ¢lm deposition. (a) Di¡ractionintensity pro¢le of anhydrous cholesterol crystals ; (b) di¡rac-tion intensity of a 16:0,18:1-PC/cholesterol mixture withMchol = 0.70, prepared by ¢lm deposition, 5 days after hydration;(c) 16:0,18:1-PC/cholesterol with Mchol = 0.70, prepared by LTT,3 days after hydration.
Fig. 5. Cholesterol monohydrate crystal di¡raction intensity vs.cholesterol mole fraction for fully hydrated 16:0,18:1-PC/cho-lesterol mixtures. E, A set of samples prepared by ¢lm deposi-tion method, 7 days after hydration; U, the same sample setafter 10 weeks of incubation at room temperature; b, a set ofsamples prepared by LTT, 3 days after hydration.
Table 2Maximum solubility of cholesterol (M�chol) in PC and PE bi-layers, as determined in samples prepared by either RSE orLTT
Bilayer type Solubility limit byRSE
Solubility limit byLTT
16:0,18:1-PC 0.66 ( þ 0.01) 0.66 ( þ 0.01)16:0,18:1-PE 0.51 ( þ 0.01) 0.51 ( þ 0.01)di22:1-PC 0.66 ( þ 0.01) 0.66 ( þ 0.01)di12:0-PC 0.66 ( þ 0.01) 0.66 ( þ 0.01)di16:0-PC 0.66 ( þ 0.01) 0.66 ( þ 0.01)
Fig. 4. Anhydrous crystal X-ray di¡raction intensity vs. choles-terol mole fraction for a set of 16:0,18:1-PC/cholesterol depos-ited ¢lms.
BBAMEM 77560 1-2-99
J. Huang et al. / Biochimica et Biophysica Acta 1417 (1999) 89^100 95

onstrated that conversion from anhydrous cholester-ol to the monohydrate is a slow process [20]. Fig. 6,trace b shows the radial pro¢le of di¡raction inten-sity for a 16:0,18:1-PC/cholesterol mixture, atMchol = 0.70, hydrated from a deposited ¢lm. Thewide-angle region between 7 and 11 Aî in Bragg spac-
ing is a good region to search for evidence of anhy-drous cholesterol. In this region, there are no visibledi¡raction lines from either lipid lamellae or choles-terol monohydrate, but anhydrous cholesterol crys-tals show a series of sharp di¡raction lines (Fig. 6,trace a). This sample has been hydrated ¢ve days, yet
Fig. 7. Cholesterol monohydrate di¡raction intensity (Ic in Eq. 1) vs. cholesterol mole fraction for several bilayer mixtures. Arrows in-dicate the average M�chol value from at least three replicate experiments. (a) 16:0,18:1-PC/cholesterol mixtures prepared by LTT.a, 3 days after hydration; U, same sample set after 10 weeks incubation at room temperature. (b) 16:0,18:1-PE/cholesterol mixturesprepared by RSE. (c) di22:1-PC/cholesterol mixtures prepared by LTT. (d) di12:0-PC/cholesterol mixtures prepared by RSE.(e) di16:0-PC/cholesterol mixtures prepared by LTT.
BBAMEM 77560 1-2-99
J. Huang et al. / Biochimica et Biophysica Acta 1417 (1999) 89^10096

the di¡raction pattern clearly shows a set of peakswhich correspond to anhydrous cholesterol. On theother hand, a sample prepared in parallel, from thesame stock solution, by LTT shows no trace of an-hydrous cholesterol (Fig. 6, trace c).
3.2.3. Reproducible solubility limits by novelpreparative methods
Table 2 summarizes the results obtained in experi-ments based on the RSE and LTT methods of sam-ple preparation. Each M�chol value listed in this table isthe result of at least three replicate experiments byeach preparative method. In contrast to the resultsobtained by either ¢lm deposition or lyophilization,experiments based on RSE or LTT yield reproduci-ble values of M�chol which are, in every case, higherthan the apparent M�chol values in conventional prep-arations (Table 1 cf. Table 2). For every phospholip-id/cholesterol mixture which we have examined sofar, the same M�chol value is obtained by both RSEand LTT. Sample sets prepared by RSE and LTTshowed no change in the apparent solubility limiteven over V10 weeks of incubation (Fig. 7a).
3.3. M�chol Values for PC or PE bilayers
Simply exchanging the PC headgroup for a PEheadgroup has a dramatic e¡ect on the solubilitylimit, as shown in Fig. 7b. Cholesterol precipitatesfrom bilayers of 16:0,18:1-PE at a cholesterol con-centration 15 mol% lower than in bilayers of the PCanalog. For the 16:0,18:1-PE bilayer, M�chol = 0.51( þ 0.01).
In contrast to the dramatic headgroup depend-ence, the cholesterol solubility limit in a PC bilayerseems to be insensitive to either increases or de-creases in bilayer thickness, as revealed by cholester-ol mixtures with di22:1-PC (Fig. 7c) or di12:0-PC(Fig. 7d). For each of these two bilayers,M�chol = 0.66 ( þ 0.01). The quantitative plots of crystaldi¡raction intensity were always more noisy fordi22:1-PC/cholesterol mixtures than for other mix-tures (Fig. 7c cf. Fig. 7a,b,d,e). This may be due tophysical separation between lamellae and crystalsduring centrifugation, caused by the considerabledensity di¡erence between cholesterol monohydrateand di22:1-PC vesicles. However, in every experi-ment on di22:1-PC/cholesterol, cholesterol mono-
hydrate was only present in samples withM�chol s 0.66.
Unlike the three other PCs discussed so far,di16:0-PC forms gel-phase lamellae at room temper-ature. Nonetheless, at 24³C (Fig. 7e), the solubilitylimit of cholesterol in a di16:0-PC bilayer is indistin-guishable from those observed in the other three PCmixtures: Mchol = 0.66 ( þ 0.01).
4. Discussion
The method of sample preparation is critical to thesuccessful determination of true, equilibrium choles-terol solubility limits in phospholipid/cholesterol sus-pensions. Experiments based on either of two con-ventional preparative methods, ¢lm deposition orlyophilization, can produce apparent solubility limitswhich are not reproducible (Table 1). Both ¢lm dep-osition and lyophilization pass the phospholipid/cho-lesterol mixture through an intermediary solid state,either ¢lm or powder. Freeman and Finean reportedthat cholesterol crystals tend to precipitate from de-posited ¢lms of egg PC and cholesterol [6]. Otherworkers have also observed the formation of purecholesterol crystals in anhydrous lipid mixtures[23,24]. We have observed this phenomenon in sev-eral phospholipid mixtures, both in deposited ¢lms(Figs. 3 and 4) and lyophilized powders (data notshown). X-Ray di¡raction identi¢es these cholesterolprecipitates as crystals of anhydrous cholesterol,based on the characteristic di¡raction lines, e.g., inthe 7^11 Aî region. Buboltz has proposed that thee¡ects of solid-state demixing could persist in hy-drated samples [15]. Indeed, after hydration, thisdemixed cholesterol is very slow to remix (Fig. 5)and transforms slowly to crystals of cholesterolmonohydrate. Neither mechanical agitation nor heat-ing, over several weeks' time, can bring about com-plete remixing of these artifactual crystals. The factthat the cholesterol crystals have some tendency toremix with the lamellar phase (Fig. 5) demonstratesthat these samples are not at equilibrium, and thatthe true equilibrium value of M�chol is higher than theapparent M�chol. Overall, solid-state demixing of cho-lesterol during conventional sample preparation hasthe e¡ect of producing variable, falsely low estimatesof the cholesterol solubility limit. This may help to
BBAMEM 77560 1-2-99
J. Huang et al. / Biochimica et Biophysica Acta 1417 (1999) 89^100 97

explain the disparate M�chol results that have been pub-lished in the literature [3^12].
The evidence we have presented demonstrates thatphospholipid/cholesterol samples may not be at equi-librium when they are prepared by either ¢lm depo-sition or lyophilization. We have shown that non-equilibrium cholesterol crystals (both monohydrateand anhydrous) can be present in samples well belowM�chol. These particles of pure cholesterol have dem-ixed from the lamellar phase lipid, which means thatthe actual cholesterol concentration in the bilayermust be lower than the nominal composition. Theactual bilayer composition is unknown, and changescontinuously as the nonequilibrium cholesterol crys-tals slowly remix with the lamellar phase.
Our attention has been focused on the true, max-imum solubility limit of cholesterol in hydrated phos-pholipid lamellae. Our observations are limited tothe regime of high cholesterol content (s 35mol%). We have been concerned with the formationof artifactual crystals of pure cholesterol, which rep-resent an extreme of demixing. We have not exam-ined phospholipid/cholesterol mixtures of lower cho-lesterol content and we have not sought any evidenceof demixing which does not produce pure cholesterolcrystals. In our opinion, it remains an unansweredquestion, whether less extreme forms of artifactualdemixing can occur in phospholipid/cholesterol mix-tures at lower cholesterol contents, or whether anysuch demixing would be reversible. For a discussionof the principles which may drive the demixing ofcomponents during conventional sample preparation,see Buboltz and Feigenson [15].
Cholesterol solubility limit experiments based ontwo novel preparative methods, RSE and LTT,seem to be free of demixing artifacts. These methodswere designed to prevent demixing of lipids duringsample preparation. Rapid solvent exchange does notpass the lipid mixture through an intermediary solidstate, and so avoids any demixing that could becaused by complex solid-state phase behavior. Incontrast, the strategy of low temperature trappingis to slow the kinetics of demixing. Mixtures aretrapped in a well-mixed state by lyophilizing at lowtemperature. The following four points summarizeour evidence that equilibrium results are obtainedin experiments based on RSE or LTT. First, wecould obtain reproducible M�chol values by these prep-
arative methods, but not by ¢lm deposition or lyo-philization (Table 1 cf. Table 2). Second, these twonew methods are very dissimilar, employing com-pletely di¡erent strategies to prevent demixing, yetwe obtain the same M�chol values by either RSE orLTT (Table 2). Third, in every case, these solubilitylimits are higher than indicated by conventionalpreparations (Table 1 cf. Table 2), consistent withthe elimination of a demixing artifact. Lastly, highcholesterol content bilayers prepared by RSE or LTTare stable. Even in samples which approach M�chol,lamellar phase cholesterol remains in the bilayerand does not precipitate as crystals, even over pro-longed incubation up to 10 weeks (Fig. 7). Based onthese four observations, we conclude that M�chol valuesobtained by both RSE and LTT are the true, equili-brium values. It may well be that other methods ofsample preparation, not examined in this work, canlikewise yield reproducible, equilibrium values ofM�chol.
It is notable that the true M�chol values for PC or PEbilayers present a fairly simple picture. The head-group e¡ect is pronounced: exchanging a cholinemoiety for ethanolamine decreases the cholesterolsolubility limit by about 15 mol%. In stark contrast,no acyl chain e¡ect could be observed in four di¡er-ent PC/cholesterol mixtures. A di22:1-PC bilayer isnearly 40% thicker than a di12:0-PC bilayer [25], yetthe M�chol values are essentially identical in these twomembranes. Nor is M�chol di¡erent in di16:0-PC bi-layers. Thus, at room temperature, the interactionswhich determine M�chol do not depend on whether thePC would form a gel or £uid bilayer in its pure state.
Previously published cholesterol solubility limitshave ranged between V0.33 and V0.66 for PC bi-layers [5,7,26] and between 0.35 and 0.40 for PEbilayers [11]. These studies have generally employed¢lm deposition. In each of the studies which havereported a maximum incorporation of 66 mol% cho-lesterol, the samples have been sonicated[5,6,8,27,28], whereas unsonicated preparations havegenerally produced lower apparent solubility limitsof around 50 mol% cholesterol [3,4,6,8^10,29].Some have concluded that the 66 mol% limit canonly be achieved through sonication and is mostlikely a metastable state [6^8]. Our results clearlydemonstrate that cholesterol may be stably incorpo-rated up to 66 mol% in multilamellar PC bilayers
BBAMEM 77560 1-2-99
J. Huang et al. / Biochimica et Biophysica Acta 1417 (1999) 89^10098

without sonication. Cholesterol does not precipitatefrom these cholesterol-rich multilamellar bilayers,even over 10 weeks of incubation at room temper-ature (Fig. 7a). The di¡erence in apparent M�chol val-ues between unsonicated and sonicated (convention-al) preparations may imply that sonication can remixdemixed cholesterol with the lamellar phase, possiblyby disrupting or destabilizing cholesterol crystals.However, we have not studied this issue and canonly speculate.
It should be stressed that true, equilibrium valuesof M�chol carry a clear and important thermodynamicmeaning: at M�chol, the chemical potential of choles-terol in the bilayer is equal to that of the monohy-drate crystal, Wbilayer
chol =Wcrystalchol . This is because the
chemical potential of cholesterol in crystals of purecholesterol monohydrate is a constant, Wcrystal
chol . On theother hand, the chemical potential of cholesterol in alipid bilayer, Wbilayer
chol (Mchol), is a function of its bilayerconcentration. When Mchol v M�chol, cholesterol-satu-rated lamellar phase coexists with cholesterol mono-hydrate. Therefore, M�chol is the cholesterol mole frac-tion at which the chemical potential of lamellarphase cholesterol becomes equal to that of the mono-hydrate crystal, i.e., Wbilayer
chol =W�chol.Such true, equilibrium values of M�chol serve to com-
pare the thermodynamics of mixing between choles-terol and other lipids in bilayers of di¡erent compo-sition. In a Monte Carlo simulation study [30], wepresent a simple, microscopic interaction model ofcholesterol^phospholipid mixing, containing a cho-lesterol multibody interaction term, which showsthat the M�chol values are most likely to occur nearthe discrete values of cholesterol concentration,0.50, 0.57, and 0.67, corresponding to phospholipidto cholesterol ratios of 1/1, 3/4 and 1/2, respectively.At these solubility limits, where the chemical poten-tial of cholesterol jumps steeply, cholesterol mole-cules form highly symmetrical regular distributionsin bilayers. The physical origin of the multibody in-teraction might be related to the exposure of non-polar cholesterol to water at high cholesterol concen-tration, i.e., the hydrophobic e¡ect [30].
Acknowledgements
The authors would like to thank Dr. D. Thiel, Mr.
B. Miller, Mr. C. Heaton and Dr. M. Szebenyi forhelp at CHESS. This work was supported by Na-tional Science Foundation Grant MCB-9722818.J.H. was supported, in part, by the W.M. KeckFoundation, and J.T.B., in part, by National Insti-tutes of Health Research Service Award I-T32-GM08267. This work is based upon research con-ducted at the Cornell High Energy SynchrotronSource (CHESS), which is supported by the NationalScience Foundation under award DMR-9311772, us-ing the Macromolecular Di¡raction at CHESS(MacCHESS) facility, which is supported by awardRR-01646 from the National Institutes of Health.
References
[1] K. Bloch, Cholesterol : evolution of structure and function,in: D.E. Vance, J.E. Vance (Eds.), Biochemistry of Lipids,Lipoproteins and Membranes, Elsevier, Amsterdam, 1991,pp. 363^381.
[2] Y. Lange, B.V. Ramos, Analysis of the distribution of cho-lesterol in the intact cell, J. Biol. Chem. 258 (1983) 15130^15134.
[3] M. Bourges, D.M. Small, D.G. Dervichian, Biophysics oflipidic associations. II. The ternary systems cholesterol^lec-ithin^water, Biochim. Biophys. Acta 137 (1967) 157^167.
[4] H. Lecuyer, D.G. Dervichian, Structure of aqueous mixturesof lecithin and cholesterol, J. Mol. Biol. 45 (1969) 39^57.
[5] C. Horowitz, L. Krut, L. Kaminsky, Cholesterol uptake byegg-yolk phosphatidylcholine, Biochim. Biophys. Acta 239(1971) 329^336.
[6] R. Freeman, J.B. Finean, Cholesterol:lecithin association atmolecular ratios of up to 2:1, Chem. Phys. Lipids 14 (1975)313^320.
[7] N.L. Gershfeld, Equilibrium studies of lecithin^cholesterolinteractions. I. Stoichiometry of lecithin^cholesterol com-plexes in bulk systems, Biophys. J. 22 (1978) 469^488.
[8] J.J. Collins, M.C. Phillips, The stability and structure ofcholesterol-rich codispersions of cholesterol and phosphati-dylcholine, J. Lipid Res. 23 (1982) 291^298.
[9] W. Knoll, G. Schmidt, K. Ibel, E. Sackmann, Small-angleneutron scattering study of lateral phase separation in di-myristoylphosphatidylcholine^cholesterol mixed membranes,Biochemistry 24 (1985) 5240^5246.
[10] N. Borochov, E.J. Wachtel, D. Bach, Phase behavior ofmixtures of cholesterol and saturated phosphatidylglycerols,Chem. Phys. Lipids 76 (1995) 85^92.
[11] J.J. Cheetham, E. Wachtel, D. Bach, R.M. Epand, Role ofthe stereochemistry of the hydroxyl group of cholesterol andthe formation of nonbilayer structures in phosphatidyletha-nolamines, Biochemistry 28 (1989) 8928^8934.
[12] D. Bach, N. Borochov, E. Wachtel, Phase separation of
BBAMEM 77560 1-2-99
J. Huang et al. / Biochimica et Biophysica Acta 1417 (1999) 89^100 99

cholesterol in dimyristoyl phosphatidylserine cholesterolmixtures, Chem. Phys. Lipids 92 (1998) 71^77.
[13] J.H. Davis, in: L. Finegold (Ed.), Cholesterol in MembraneModels, CRC Press, Boca Raton, FL, 1993, pp. 67^135.
[14] P.B. Kingsley, G.W. Feigenson, The synthesis of a perdeu-terated phospholipid: 1,2-dimyristoyl-sn-glycero-3-phospho-choline-d72, Chem. Phys. Lipids 24 (1979) 135^147.
[15] J.T. Buboltz, G.W. Feigenson, A novel strategy for the prep-aration of liposomes: rapid solvent exchange, Biochim. Bio-phys. Acta (in press).
[16] M.W. Tate, E.F. Eikenberry, S.L. Barna, M.E. Wall, J.L.Lowrance, S.M. Gruner, A large-format high-resolution areaX-ray detector based on a ¢ber-optically bonded charge-coupled device (CCD), J. Appl. Cryst. 28 (1995) 196^205.
[17] D.J. Thiel, S.E. Ealick, M.W. Tate, S.M. Gruner, E.F. Ei-kenberry, Macromolecular crystallographic results obtainedusing a 2048U2048 CCD detector at CHESS, Rev. Sci. Ins-trum. 67 (1996) 1^4.
[18] K. Brister, IMP Powder Pattern Circular Integration Pro-gram, CHESS, Cornell University, Ithaca, NY, 1997.
[19] G.W. Feigenson, Calcium ion binding between lipid bi-layers: The four-component system of phosphatidylserine,phosphatidylcholine, calcium chloride, and water, Biochem-istry 28 (1989) 1270^1278.
[20] C.R. Loomis, G.G. Shipley, D.M. Small, The phase behav-ior of hydrated cholesterol, J. Lipid Res. 20 (1979) 525^535.
[21] B.M. Carven, Crystal structure of cholesterol monohydrate,Nature 260 (1976) 727^729.
[22] H.S. Shieh, L.G. Hoard, C.E. Nordman, Crystal structure ofanhydrous cholesterol, Nature 267 (1977) 287^289.
[23] R.S. Bear, K.J. Palmer, F.O. Schmitt, X-ray di¡raction stud-ies of nerve lipids, J. Cell Comp. Physiol. 17 (1941) 355^367.
[24] A. Fischer, Elektronenmikroskopie an monomolecularenLipischichten: Neue Techniken zur Untersuchung der mi-kroskopischen und molekularen Struktur von reinen undkoexistierenden Phasenzustaende, Doctoral Thesis, Techni-sche Universitaet Muenchen, 1984.
[25] M. Ca¡rey, G.W. Feigenson, Fluorescence quenching inmodel membranes. 3. Relationship between calcium adeno-sinetriphosphatase enzyme activity and the a¤nity of theprotein for phosphatidylcholines with di¡erent acyl chaincharacteristics, Biochemistry 20 (1981) 1949^1961.
[26] J.B. Finean, Interaction between cholesterol and phospholi-pid in hydrated bilayers, Chem. Phys. Lipids 54 (1990) 147^156.
[27] J.R. Green, C. Green, The enrichment of erythrocyte mem-branes and phosphatidylcholine dispersions with cholesterol,Biochem. Soc. Trans. 1 (1973) 365^368.
[28] J.A. Virtannen, M. Ruonala, M. Vauhkonen, P. Somerharju,Lateral organization of liquid-crystalline cholesterol^dimyr-istoylphosphatidylcholine bilayers. Evidence for domainswith hexagonal and centered rectangular cholesterol super-lattices, Biochemistry 34 (1995) 11568^11581.
[29] B.D. Ladbrooke, R.M. Williams, D. Chapman, Studies onlecithin^cholesterol^water interactions by di¡erential scan-ning calorimetry and X-ray di¡raction, Biochim. Biophys.Acta 150 (1968) 333^340.
[30] J. Huang, G.W. Feigenson, A Microscopic interaction modelof maximum solubility of cholesterol in lipid bilayers, Bio-phys. J. (in press).
BBAMEM 77560 1-2-99
J. Huang et al. / Biochimica et Biophysica Acta 1417 (1999) 89^100100