matthew m. weissman law department general …...2017/07/27 · matthew m. weissman law department...
TRANSCRIPT

Matthew M. Weissman Law Department General Regulatory Counsel - Rates PSEG Services Corporation 80 Park Plaza – T5, Newark, New Jersey 07102-4194 tel : 973-430-7052 fax: 973-430-5983 email: [email protected]
July 27, 2017
In the Matter of the Petition of Public Service Electric and Gas Company
for Approval of the Next Phase of the Gas System Modernization Program and
Associated Cost Recovery Mechanism (“GSMP II”)
BPU Docket No. __________________
VIA E-FILING & OVERNIGHT MAIL Irene K. Asbury, Secretary Board of Public Utilities 44 South Clinton Avenue, 9th Floor Post Office Box 350 Trenton, New Jersey 08625-0350 Dear Secretary Asbury: Enclosed please find an original and two copies of Public Service Electric and Gas Company’s (PSE&G, the Company) filing in the above-referenced matter. Please be advised that workpapers are being provided via electronic version only. Very truly yours,
C Attached service list (via e-mail)
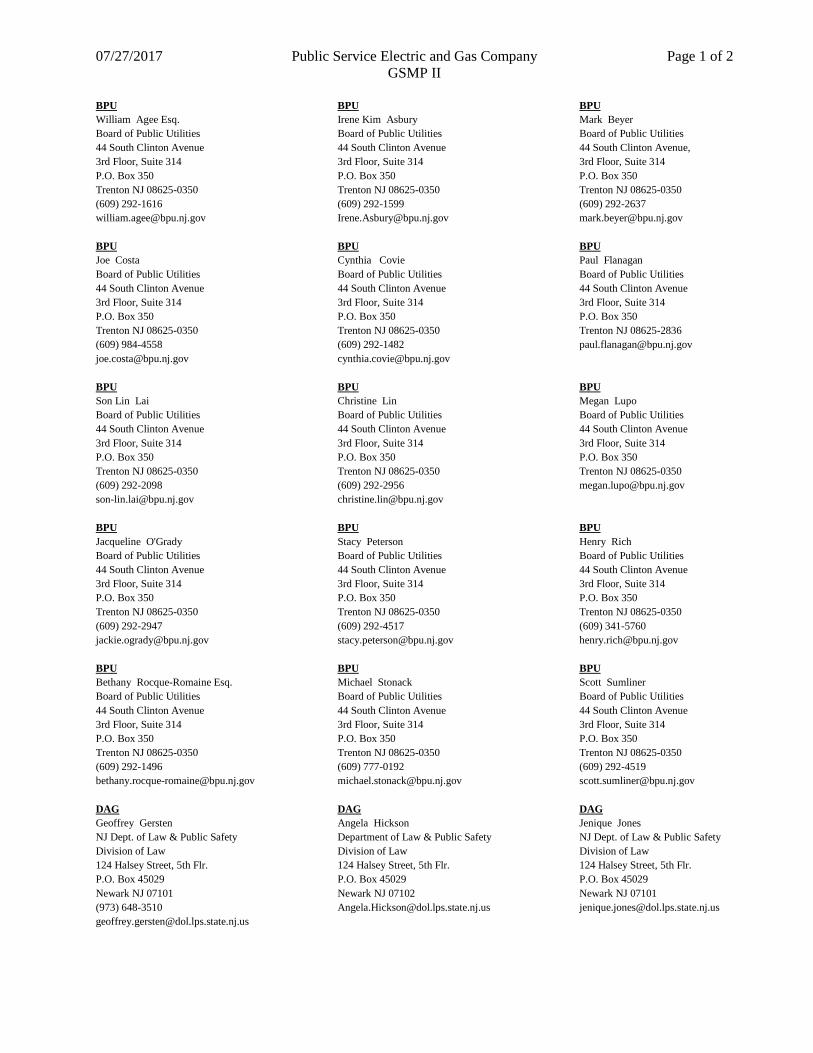
07/27/2017 Public Service Electric and Gas Company Page 1 of 2 GSMP II BPU William Agee Esq. Board of Public Utilities 44 South Clinton Avenue 3rd Floor, Suite 314 P.O. Box 350 Trenton NJ 08625-0350 (609) 292-1616 [email protected]
BPU Irene Kim Asbury Board of Public Utilities 44 South Clinton Avenue 3rd Floor, Suite 314 P.O. Box 350 Trenton NJ 08625-0350 (609) 292-1599 [email protected]
BPU Mark Beyer Board of Public Utilities 44 South Clinton Avenue, 3rd Floor, Suite 314 P.O. Box 350 Trenton NJ 08625-0350 (609) 292-2637 [email protected]
BPU Joe Costa Board of Public Utilities 44 South Clinton Avenue 3rd Floor, Suite 314 P.O. Box 350 Trenton NJ 08625-0350 (609) 984-4558 [email protected]
BPU Cynthia Covie Board of Public Utilities 44 South Clinton Avenue 3rd Floor, Suite 314 P.O. Box 350 Trenton NJ 08625-0350 (609) 292-1482 [email protected]
BPU Paul Flanagan Board of Public Utilities 44 South Clinton Avenue 3rd Floor, Suite 314 P.O. Box 350 Trenton NJ 08625-2836 [email protected]
BPU Son Lin Lai Board of Public Utilities 44 South Clinton Avenue 3rd Floor, Suite 314 P.O. Box 350 Trenton NJ 08625-0350 (609) 292-2098 [email protected]
BPU Christine Lin Board of Public Utilities 44 South Clinton Avenue 3rd Floor, Suite 314 P.O. Box 350 Trenton NJ 08625-0350 (609) 292-2956 [email protected]
BPU Megan Lupo Board of Public Utilities 44 South Clinton Avenue 3rd Floor, Suite 314 P.O. Box 350 Trenton NJ 08625-0350 [email protected]
BPU Jacqueline O'Grady Board of Public Utilities 44 South Clinton Avenue 3rd Floor, Suite 314 P.O. Box 350 Trenton NJ 08625-0350 (609) 292-2947 [email protected]
BPU Stacy Peterson Board of Public Utilities 44 South Clinton Avenue 3rd Floor, Suite 314 P.O. Box 350 Trenton NJ 08625-0350 (609) 292-4517 [email protected]
BPU Henry Rich Board of Public Utilities 44 South Clinton Avenue 3rd Floor, Suite 314 P.O. Box 350 Trenton NJ 08625-0350 (609) 341-5760 [email protected]
BPU Bethany Rocque-Romaine Esq. Board of Public Utilities 44 South Clinton Avenue 3rd Floor, Suite 314 P.O. Box 350 Trenton NJ 08625-0350 (609) 292-1496 [email protected]
BPU Michael Stonack Board of Public Utilities 44 South Clinton Avenue 3rd Floor, Suite 314 P.O. Box 350 Trenton NJ 08625-0350 (609) 777-0192 [email protected]
BPU Scott Sumliner Board of Public Utilities 44 South Clinton Avenue 3rd Floor, Suite 314 P.O. Box 350 Trenton NJ 08625-0350 (609) 292-4519 [email protected]
DAG Geoffrey Gersten NJ Dept. of Law & Public Safety Division of Law 124 Halsey Street, 5th Flr. P.O. Box 45029 Newark NJ 07101 (973) 648-3510 [email protected]
DAG Angela Hickson Department of Law & Public Safety Division of Law 124 Halsey Street, 5th Flr. P.O. Box 45029 Newark NJ 07102 [email protected]
DAG Jenique Jones NJ Dept. of Law & Public Safety Division of Law 124 Halsey Street, 5th Flr. P.O. Box 45029 Newark NJ 07101 [email protected]

07/27/2017 Public Service Electric and Gas Company Page 2 of 2 GSMP II DAG Alex Moreau DAG NJ Dept. of Law & Public Safety Division of Law 124 Halsey Street, 5th Flr. P.O. Box 45029 Newark NJ 07101 (973) 648-3762 [email protected]
DAG Caroline Vachier DAG NJ Dept. of Law & Public Safety Division of Law 124 Halsey Street, 5th Flr. P.O. Box 45029 Newark NJ 07101 (973) 648-3709 [email protected]
PSE&G Joseph F. Accardo, Jr. PSEG Services Corporation 80 Park Plaza, T5G P.O. Box 570 Newark NJ 07102 (973) 430-5811 [email protected]
PSE&G Michele Falcao PSEG Services Corporation 80 Park Plaza, T5 P.O. Box 570 Newark NJ 07102 (973) 430-6119 [email protected]
PSE&G Bernard Smalls PSEG Services Corporation 80 Park Plaza-T5 Newark NJ 07102-4194 (973) 430-5930 [email protected]
PSE&G Matthew M. Weissman Esq. PSEG Services Corporation 80 Park Plaza, T5 P.O. Box 570 Newark NJ 07102 (973) 430-7052 [email protected]
PSE&G Caitlyn White PSEG Services Corporation 80 Park Plaza, T-5 P.O. Box 570 Newark NJ 07102 (973)-430-5659 [email protected]
Rate Counsel Stefanie A. Brand Division of Rate Counsel 140 East Front Street, 4th Flr. P.O. Box 003 Trenton NJ 08625 (609) 984-1460 [email protected]
Rate Counsel Maura Caroselli Esq. Division of Rate Counsel 140 East Front Street 4th Floor Trenton NJ 08625 [email protected]
Rate Counsel James Glassen Division of Rate Counsel 140 East Front Street, 4th Flr. P.O. Box 003 Trenton NJ 08625 (609) 984-1460 [email protected]
Rate Counsel Kurt Lewandowski Esq. Division of Rate Counsel 140 East Front Street, 4th Flr. P.O. Box 003 Trenton NJ 08625 (609) 984-1460 [email protected]
Rate Counsel Brian O. Lipman Division of Rate Counsel 140 East Front Street, 4th Flr. P.O. Box 003 Trenton NJ 08625 (609) 984-1460 [email protected]
Rate Counsel Shelly Massey Division of Rate Counsel 140 East Front Street, 4th Flr. P.O. Box 003 Trenton NJ 08625 (609) 984-1460 [email protected]
Rate Counsel Henry M. Ogden Esq. Division of Rate Counsel 140 East Front Street, 4th Flr. P.O. Box 003 Trenton NJ 08625 (609) 984-1460 [email protected]
Rate Counsel Sarah Steindel Division of Rate Counsel 140 East Front Street, 4th Flr. P.O. Box 003 Trenton NJ 08625 (609) 984-1460 [email protected]
Rate Counsel Felicia Thomas-Friel Division of Rate Counsel 140 East Front Street, 4th Flr. P.O. Box 003 Trenton NJ 08625 (609) 984-1460 [email protected]
Rate Counsel Consultant Robert Henkes Henkes Consulting 7 Sunset Road Old Greenwich CT 06870 (203) 698-1989 [email protected]

STATE OF NEW JERSEY BOARD OF PUBLIC UTILITIES
In the Matter of the Petition of Public Service Electric and Gas Company for Approval of the Next Phase of the Gas System Modernization Program and Associated Cost Recovery Mechanism (“GSMP II”)
BPU DOCKET NO. __________________
VERIFIED PETITION
Public Service Electric and Gas Company (PSE&G, the Company, Petitioner), a
corporation of the State of New Jersey, having its principal offices at 80 Park Plaza, Newark, New
Jersey, respectfully petitions the New Jersey Board of Public Utilities (Board or BPU) pursuant to
N.J.S.A. 48: 2-21, or any other statute the Board deems applicable, as follows:
INTRODUCTION AND OVERVIEW OF THE FILING
1. Petitioner is a public utility engaged in the distribution of electricity and the
provision of electric Basic Generation Service (BGS), and distribution of gas and the provision of
Basic Gas Supply Service (BGSS), for residential, commercial and industrial purposes within the
State of New Jersey. PSE&G provides service to approximately 2.2 million electric and 1.8 million
gas customers in an area having a population in excess of 6.2 million persons and which extends
from the Hudson River opposite New York City, southwest to the Delaware River at Trenton and
south to Camden, New Jersey.
2. Petitioner is subject to regulation by the Board for the purposes of setting its retail
distribution rates and to assure safe, adequate and reliable electric distribution and natural gas
distribution service pursuant to N.J.S.A. 48:2-21 et seq.

- 2 -
3. PSE&G is filing this Petition seeking Board approval of the next phase of its Gas
System Modernization Program and associated cost recovery mechanism (GSMP II or Program)
for a five-year period. The Program is an extension of PSE&G’s current Gas System
Modernization Program (GSMP), which was approved by the Board pursuant to an Order dated
November 16, 2015. PSE&G anticipates that GSMP II will be conducted over the five-year period
2019 through 2023, as further described herein, and will commence on January 1, 2019, following
Board approval.
4. The GSMP II program is comprised of gas utility projects designed to replace cast
iron (CI) mains and unprotected steel (US) mains and services; address the abandonment of district
regulators associated with this cast iron and unprotected steel plant; rehabilitate large diameter
elevated pressure cast iron; upgrade utilization pressure (UP) portions of the system to elevated
pressure (EP); replace limited amounts of protected steel and plastic mains; and relocate inside
meter sets.1
5. The proposed Program would result in the replacement of approximately 250 miles
of main per year, with estimated investment of approximately $2.68 billion for the full five years,
or approximately $536 million per year.2 At this time, the Company anticipates these
expenditures will result in the replacement of approximately 870 miles of UPCI main (of
PSE&G’s current inventory of 3,294 miles), 130 miles of EPCI main, 200 miles of
unprotected/bare steel main, 50 miles of UP cathodically protected steel and plastic main, and
reinforcement of approximately 4,000 EPCI bell joints. This main replacement will result in 1 For purposes of this petition, “unprotected steel” is steel that is not cathodically protected and includes both bare
steel and coated steel. 2 Work required to complete the Program will continue into the first six months of a sixth year of this Program,
i.e., through June 30, 2024. The $2.68 billion cost of this Program includes this work.

- 3 -
approximately 266 abandoned district regulators, replacement of approximately 99,200
unprotected steel services, and the relocation of approximately 70,900 inside meter sets to the
outside. Where appropriate, services will have excess flow valves installed for improved safety.
6. PSE&G is in the second year of a program that would take 30 years to address all
cast iron main and unprotected steel in the distribution system. The Company has demonstrated
that it has the capacity to increase the mileage replaced safely and cost-effectively. With this
GSMP II filing, PSE&G proposes to accelerate the pace of replacement to 20 years. As
discussed in the accompanying testimony, this is the optimal time to accelerate this work given
low gas prices, the availability of labor and the corresponding economic stimulus of a continued
and expanded program, and the more rapid reduction of greenhouse gas emissions by
eliminating leak-prone materials from the system.
7. GSMP II targets all UPCI main diameters, and work prioritization will be based
on grid hazard index calculations. UPCI systems will be replaced with EP systems that have
improved reliability. EPCI mains will be prioritized by break or leak history, condition,
diameter, pressure, and vintage, as well as consideration of EPCI main replacement associated
with UPCI and unprotected steel projects. Unprotected steel mains will be prioritized by age,
diameter, pressure, and leak history. EPCI joint reinforcement will target large diameter cast
iron mains that are not prone to breaks and are not currently planned for replacement but are
prone to joint leaks. The reinforcements will reduce the possibility of future joint leaks and
reduce potential methane emissions.
8. GSMP II is designed to run for five years, as further described herein, and focuses
on modernization of the gas distribution system. These investments will enable the Company to

- 4 -
focus on enhancing the reliability and safety of its gas distribution system in a cost effective manner,
and to continue to provide economic stimulus currently being provided by the GSMP program.
Although not part of the request in this Petition, the Company anticipates that additional gas
distribution system modernization will need to be undertaken beyond this five year Program. The
Company anticipates returning to the BPU prior to the expiration of this Program to address
continued action of this nature.
9. PSE&G currently performs well with regard to addressing leaks in its system. When
compared to companies that operate over 1,000 miles of cast iron, PSE&G is the best in terms of
having the least number of main leaks per mile. (PHMSA report data: 2016 F7100.1-1). PSE&G
responds to over 80,000 gas emergency calls on an annual basis at a rate of 99.9% within one hour.
This ranks within the top decile of peer companies. Since 2014, PSE&G has reduced methane
emissions 2.9% annually or a total of 65,000 metric tons of CO2 equivalent (calculated using EPA
Greenhouse Gas Reporting Program: Subpart W – Petroleum and Natural Gas Systems
methodology (EPA Subpart W)).
10. Replacement of cast iron and unprotected steel as proposed in this Program builds
upon the NJBPU’s longstanding proactive approach to addressing aging infrastructure for PSE&G
and other utilities. Systematic, long-term replacement allows for greater economies of scale, less
municipal disruption, and more efficient execution. Methane emission reduction from this
Program is estimated at approximately 199,000 metric tons of CO2 equivalent per year as of the
completion of the Program (calculated using EPA Subpart W), which would be equivalent to
removing approximately 42,000 vehicles from the road.
- 5 -
11. The Program includes upgrading of low pressure systems to elevated pressure,
which enables the installation of smaller size material, the installation of excess flow valve safety
devices, and the use of high efficiency and other appliances by customers. The efficiencies of cost
effective construction to replace cast iron mains, unprotected steel mains, and services in this
proposed Program and the increased long-term reliability and safety that will result will benefit
PSE&G ratepayers and the State for several decades. Proceeding with this Program will also
continue PSE&G’s support of economic development and enhanced employment opportunities in
New Jersey.
12. It is reasonable and prudent to provide for the modernization of the PSE&G gas
distribution system to advance the long-term reliability and safety of that system through the
Program proposed herein. Accordingly, PSE&G requests that the Board approve this Program, to
provide an investment of up to $2.68 billion.
BACKGROUND – ESTABLISHMENT, IMPLEMENTATION AND STATUS OF GAS CAPITAL INFRASTRUCTURE PROGRAMS (CIP I AND CIP II), THE GAS INFRASTRUCTURE PORTION OF ENERGY STRONG, AND GSMP
13. A Capital Infrastructure Program (CIP I) for PSE&G was established in April 2009,
with the cooperation and assistance of the Board Staff, the New Jersey Division of Rate Counsel
(Rate Counsel), and the Board. The program helped mitigate the negative impacts of poor
economic conditions and stimulate the State’s economy through investment in additional capital
projects, creating new employment opportunities in the state while enhancing service and
reliability throughout PSE&G’s electric and gas service territories.
14. In CIP I PSE&G proposed to undertake, and the BPU subsequently approved, a
program to spend $694 million in capital infrastructure investments, of which $273 million was for

- 6 -
gas infrastructure to be invested over a 24 month period. The results of the accelerated investment
in CIP I resulted in the replacement of 200 miles of cast iron and unprotected steel mains and
achieved the Board’s and PSE&G’s job creation and economic growth goals.
15. In July 2011 the Board approved PSE&G’s request for an extension of CIP I, to
enable the Company to continue that construction program and enhance the reliability of its gas
distribution system under a program generally referred to as CIP II. A similar request to extend
the electric portion of CIP I was reviewed in parallel with the gas extension. CIP II resulted in
the replacement of 47 miles of cast iron and unprotected steel mains.
16. In February 2013, Public Service petitioned the Board for approval of a program
(Energy Strong) and for the recovery of costs to harden its electric and gas infrastructure to
make them less susceptible to damage from wind, flying debris and water damage in
anticipation of future Major Storm Events, and to increase the resiliency of PSE&G’s electric
delivery system. In an Order issued in May 2014, the Board approved a Stipulation to authorize
the Energy Strong Program, which includes an investment level of up to $400 million of
investment in gas infrastructure designed to harden gas infrastructure to protect it from future
storms. The Energy Strong Program also includes $820 million of electric infrastructure
investment.
17. Up to $350 million of the gas portion of the Energy Strong program is for a sub-
program for PSE&G to replace an estimated 250 miles of utilization pressure cast iron main and
associated services with a higher operating pressure system utilizing plastic or cathodically
protected steel mains and services in specified areas. The investment in this gas Utilization
Pressure Cast Iron subprogram of Energy Strong was completed in July 2016.

- 7 -
18. In November 2015 the Board approved GSMP, which provided for $650 million in
total spend, plus $85 million per year in stipulated base investment that would not be recovered
through the GSMP cost recovery mechanism. Up to 400 miles of main were to be installed to
replace UPCI and unprotected steel mains. The stipulated base investment would include the
replacement of cast iron (UP and EP) and unprotected steel mains and associated services, as well
as the costs required to uprate the UPCI systems if applicable (including the uprating of associated
protected steel and plastic mains and services) to higher pressures and the elimination, where
applicable, of district regulators, the installation of excess flow valves associated with the
stipulated base investment, and the additional costs associated with the relocation of inside meter
sets that is associated with the stipulated base as well as the program main replacements. During
the three years 2016 – 2018, the Company would install no less than 110 miles of main to replace
cast iron and unprotected steel mains and associated services under the stipulated base.
19. Under GSMP, as of June 2017 YTD, the Company has replaced approximately
157 miles of main and replaced approximately 11,820 services, or an average of 75 services per
mile of main replaced. The Company has also abandoned 16 district regulators associated with
the replacement areas. Cost to date is approximately $266 million, or approximately $1.7
million per mile.
20. The cost recovery mechanism and rate of return proposed by PSE&G in this
GSMP II Petition and supporting materials are aligned with the Board’s recently issued
Infrastructure Investment Program regulations described below, and otherwise consistent with
the 2015 GSMP order.

- 8 -
FEDERAL AND STATE POLICY SUPPORTING THIS GAS MODERNIZATION INVESTMENT
21. In 2011, the Secretary of the Department of Transportation (DOT), and the
Pipeline and Hazardous Materials Safety Administration (PHMSA) issued a “Call to Action,”
which seeks more aggressive actions on the part of pipeline operators to repair and replace
infrastructure that is considered high risk. The PHMSA specifically characterizes cast iron and
unprotected steel pipe as categories of pipeline infrastructure that require repair, rehabilitation
and replacement. The “Call to Action” was followed by an advisory bulletin issued by PHMSA
on March 23, 2012, to owners and operators of natural gas cast iron distribution pipelines and
state pipeline safety representatives. The bulletin urges operators of natural gas distribution
systems to accelerate replacement of aging infrastructure in order to enhance safety and requests
state agencies to consider enhancements to cast iron replacement plans and programs.
PSE&G’s proposed Program, with a focus on gas projects designed to replace cast iron mains,
unprotected steel mains and services, and regulators associated with this cast iron and
unprotected steel plant, will provide substantial progress in addressing the goals of the “Call to
Action”, as described in the attached testimony of Wade E. Miller.
22. The most recent update to the State’s Energy Master Plan (EMP)3 emphasizes
continued and increased reliance on natural gas and thus investment in natural gas infrastructure
overall as a means of lowering energy costs, decreasing carbon emissions, and enhancing energy
security. Specifically, the report states that New Jersey has benefitted from the enhancement and
expansion of its natural gas distribution system, which “will help further lower the cost of energy to
3 See http://nj.gov/emp/docs/pdf/New_Jersey_Energy_Master_Plan_Update.pdf

- 9 -
New Jersey’s homeowners and businesses and reduce emissions.” The EMP continues to
encourage increased use of natural gas for residential and commercial applications, “including the
use of high-efficiency natural gas appliances such as replacing distillate oil appliances with natural
gas furnaces and hot water heaters.” The most recent EMP update specifically notes that “[the]
BPU has approved almost $1 billion for natural gas utility infrastructure upgrades and mitigation
projects,” and that “[a]n additional $280 million in proposed projects is pending.” Finally, the
report states that New Jersey “will continue to develop policies that remove barriers and expand
the use of the entire array of alternative fuel vehicles,” including vehicles powered by Compressed
Natural Gas (CNG). PSE&G’s proposed investment in gas infrastructure modernization is
consistent with these EMP policies.
23. On June 30, 2017, the Board announced a proposed set of regulations (Infrastructure
Investment and Recovery (Proposed New Subchapter: N.J.A.C. 14:3-2A, BPU Docket Number:
AX17050469), encouraging utilities to implement Infrastructure Investment Programs (IIPs).
Specifically, this regulation has been proposed by the BPU to “allow a utility to construct, install,
or remediate utility plant and facilities related to reliability, resiliency, and/or safety to provide safe
and adequate service. The IIP is a regulatory initiative intended to create a financial incentive for
utilities to accelerate the level of investment needed to promote the timely rehabilitation and
replacement of certain non-revenue producing components that enhance reliability, resiliency,
and/or safety.” This filing has been designed to be consistent with the Board’s proposed
regulations. Appendix 1 attached to this Petition sets forth the location in this filing of all
requirements per the Board’s proposed regulations.
- 10 -
BENEFITS TO CUSTOMERS AND THE NEW JERSEY ECONOMY
24. This proposed Program, like the prior PSE&G Capital Infrastructure Programs and
Energy Strong and the current GSMP, will produce many benefits for customers, for PSE&G’s gas
distribution system, and for the environment. Customers will benefit from a safer, more modern
system that accommodates newer technologies and appliances. The replacement of mains and
services will enhance the safety and reliability of the system through the use of more modern
materials and construction. An additional benefit of GSMP II is an accelerated reduction of
greenhouse gas emissions from legacy facilities. The long term 20 year elimination strategy is
equivalent to removing approximately 127,000 vehicles from the road.
25. Providing for this Program over multiple years will enable PSE&G to plan to
construct these facilities in a cost effective manner, and allow PSE&G to coordinate with
municipalities in planning construction.
26. Proceeding with this Program will also continue PSE&G’s support of economic
development and enhanced employment opportunities in New Jersey. This Program will support
additional skilled jobs. Proceeding on a multi-year basis will provide stability and permanence in
the jobs the Program creates and supports.
COST RECOVERY
27. PSE&G is proposing a cost recovery mechanism for GSMP II that is consistent with
the recently proposed BPU Infrastructure Investment and Recovery (IIR) regulations (Proposed
New Subchapter: N.J.A.C. 14:3-2A, BPU Docket Number: AX17050469) and the existing Gas
System Modernization Program (GSMP I) where applicable. As detailed in the attached Direct
Testimony of Stephen Swetz, the cost recovery method will involve semi-annual base rate roll-in
- 11 -
filings, consistent with the proposed IIP regulations and the same approach used for PSE&G’s
Energy Strong program (for electric investments).
28. Consistent with the IIP proposal, PSE&G proposes to limit each base rate roll-in to a
minimum investment level of 10 percent of the total program investment. Therefore, based on the
proposed capital expenditure forecast, the first base rate roll-in filing will not occur until December
31, 2019, for rates effective June 1, 2020. Following that initial filing in December 2019, filings
will be made at the end of June and December of each year, for rate changes related to plant in-
service August 31 of the same year and February 28 (or 29) of the subsequent year, respectively.
Those filings would be updated through a second filing that would be due September 15 and March
15, respectively, and that would provide actual data through August 31 and February 28 (or 29),
respectively. Under this proposal, the rate adjustment following the June filing would be
implemented on the first of December, and the rate adjustment following the December filing
would be implemented on the first of June.
29. The main replacement work for GSMP II is scheduled to be complete December
31, 2023. However, close out work such as final paving must wait 3 to 6 months following
main installation to allow ground to settle. In addition, trailing charges from contractors may
lag into 2024. Without a firm date for completion of this close out work, the Company is
proposing a rate filing no later than July 15, 2024 with all actual data for rates effective October
1, 2024.
30. Consistent with the Energy Strong program and GSMP, PSE&G proposes that the
costs to be included in rates will include: depreciation/amortization expense providing for the
recovery of the invested capital over its useful book life; return on the net investment, where net

- 12 -
investment is the capital expenditures less accumulated depreciation/amortization, less associated
accumulated deferred income taxes; and the impact of any tax adjustments applicable to the
Program. The return on net investment will be based upon a weighted average cost of capital
(WACC). The Company’s initial WACC for the Program will be based on the ROE, long-term
debt rate and capital structure approved in PSE&G’s Solar 4 All Extension II filing in Docket
No. EO16050412, which was the latest new program approved for the Company by the Board
on November 30, 2016. Any change in the WACC authorized by the Board in a subsequent
base rate case will be reflected in the subsequent monthly revenue requirement calculations.
31. BPU Staff and Rate Counsel will have an opportunity to review each roll-in filing
to ensure that the revenue requirements and proposed rates are being calculated in accordance
with the BPU Order approving the Program. The changes to base rates made through these roll-
in filings would be subject to refund based solely upon a Board finding that PSE&G
imprudently incurred capital expenditures. The actual prudence of the Company’s expenditures
in GSMP II will be reviewed as part of PSE&G’s subsequent base rate case(s) following the
roll-ins. Again, this is identical to the approach under the Energy Strong program and GSMP.
Following the base rate case to be filed no later than November 1, 2017, the Company proposes
that it will file its next base rate case no later than five years after the commencement of work
for GSMP II, anticipated to be December 31, 2023.
32. In addition to limiting the base rate roll-ins to a minimum investment level of 10
percent of the total program investment, PSE&G is also proposing to limit the amount of
investment to be included in the rate base roll-ins by an earnings test. Consistent with the IIP, if
the Company exceeds the allowed ROE from the utility’s last base rate case by fifty (50) basis

- 13 -
points or more for the most recent twelve (12) moth period, the pending base rate roll-in shall
not be allowed for the applicable filing period. Details regarding application of the earnings test
are set forth in the direct testimony of Stephen Swetz, submitted herewith.
33. This Petition does not propose any rate increase and, for that reason, no public
comment hearings are required. Nevertheless, PSE&G proposes public comment hearings similar
to those that are held when rate increases are proposed. Thus, a proposed form of public notice of
filing and public hearings, including the proposed rates and bill impacts attributable to the proposed
implementation of the Program, is attached to the testimony of Stephen Swetz as Schedule SS-
GSMPII-7. PSE&G proposes that this Form of Notice will be placed in newspapers having a
circulation within the Company’s gas service territory upon receipt, scheduling and publication of
public hearing dates. As with petitions that propose rate increases, PSE&G proposes that public
hearings will be held in each geographic area within the Company’s service territory, i.e., Northern,
Central, and Southern. A Notice will be served on the County Executives and Clerks of all
municipalities within the Company’s gas service territories upon receipt, scheduling and
publication of public hearing dates.
ATTACHED DIRECT TESTIMONY AND PROPOSED PROCEDURAL SCHEDULE
34. The attached Direct Testimonies of Wade E. Miller and Stephen Swetz provide
support for the forgoing and the requests herein.
35. Given the expiration of the Energy Strong main replacement program in July 2016,
the anticipated expiration of the GSMP main replacement work in 2018, and the importance of
maintaining the support for jobs through PSE&G infrastructure programs and continuity in those
programs, it is important for PSE&G to receive Board approval in the first quarter of 2018 to begin
- 14 -
planning for, designing and making the capital investments described herein. Therefore, the
Company respectfully requests that the Board retain this matter and utilize a schedule similar to the
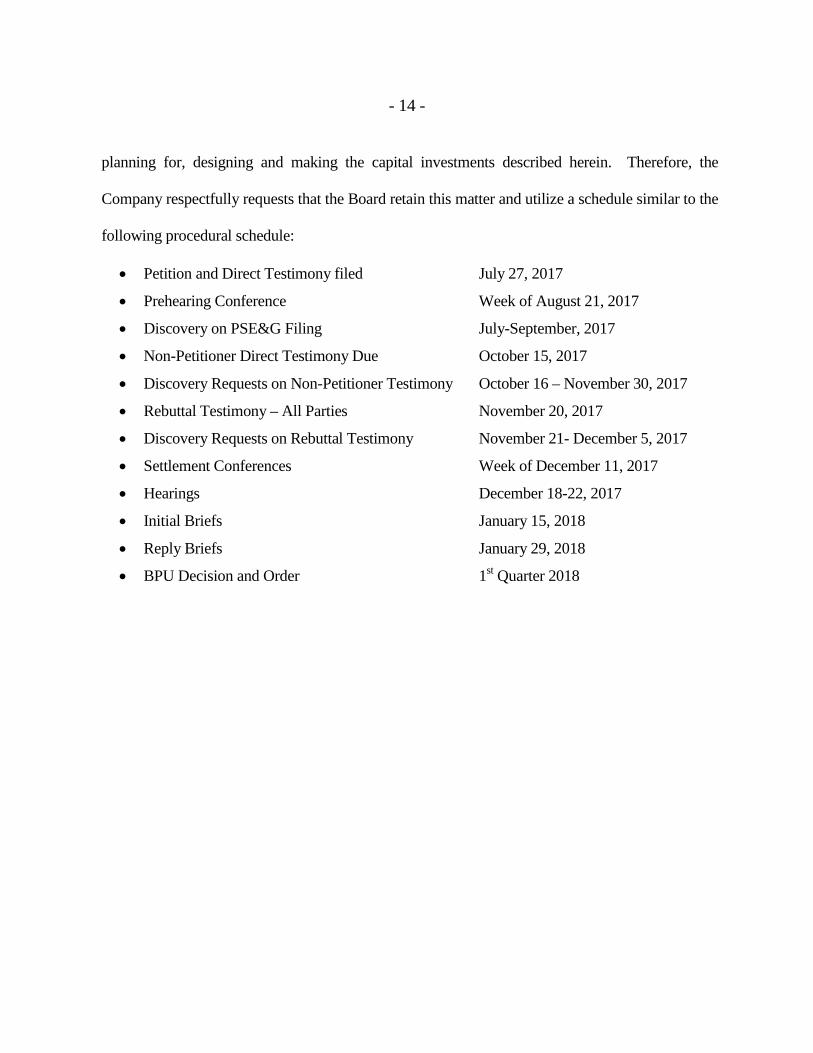
following procedural schedule:
• Petition and Direct Testimony filed July 27, 2017
• Prehearing Conference Week of August 21, 2017
• Discovery on PSE&G Filing July-September, 2017
• Non-Petitioner Direct Testimony Due October 15, 2017
• Discovery Requests on Non-Petitioner Testimony October 16 – November 30, 2017
• Rebuttal Testimony – All Parties November 20, 2017
• Discovery Requests on Rebuttal Testimony November 21- December 5, 2017
• Settlement Conferences Week of December 11, 2017
• Hearings December 18-22, 2017
• Initial Briefs January 15, 2018
• Reply Briefs January 29, 2018
• BPU Decision and Order 1st Quarter 2018
- 15 -
COMMUNICATIONS
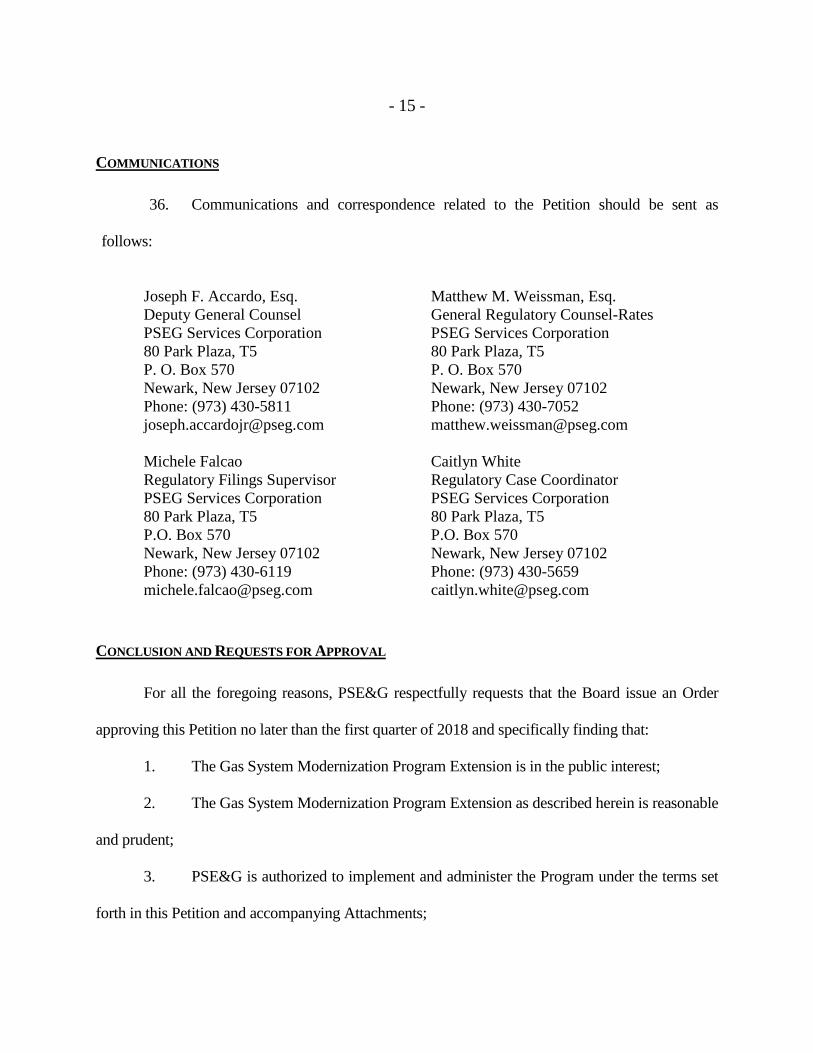
36. Communications and correspondence related to the Petition should be sent as
follows:
Joseph F. Accardo, Esq. Matthew M. Weissman, Esq. Deputy General Counsel General Regulatory Counsel-Rates PSEG Services Corporation PSEG Services Corporation 80 Park Plaza, T5 80 Park Plaza, T5 P. O. Box 570 P. O. Box 570 Newark, New Jersey 07102 Newark, New Jersey 07102 Phone: (973) 430-5811 Phone: (973) 430-7052 [email protected] [email protected] Michele Falcao Caitlyn White Regulatory Filings Supervisor Regulatory Case Coordinator PSEG Services Corporation PSEG Services Corporation 80 Park Plaza, T5 80 Park Plaza, T5 P.O. Box 570 P.O. Box 570 Newark, New Jersey 07102 Newark, New Jersey 07102 Phone: (973) 430-6119 Phone: (973) 430-5659 [email protected] [email protected]
CONCLUSION AND REQUESTS FOR APPROVAL
For all the foregoing reasons, PSE&G respectfully requests that the Board issue an Order
approving this Petition no later than the first quarter of 2018 and specifically finding that:
1. The Gas System Modernization Program Extension is in the public interest;
2. The Gas System Modernization Program Extension as described herein is reasonable
and prudent;
3. PSE&G is authorized to implement and administer the Program under the terms set
forth in this Petition and accompanying Attachments;

- 16 -
4. The cost recovery proposal and mechanism set forth in this Petition will provide for
implementation of just and reasonable rates and is approved; and
5. PSE&G may recover all prudently-incurred Program costs, on a full and timely
basis, under the cost recovery mechanism set forth herein.
Respectfully submitted, PUBLIC SERVICE ELECTRIC AND GAS COMPANY
___________________________________
Matthew M. Weissman, Esq. General Regulatory Counsel - Rates Public Service Electric and Gas Company 80 Park Plaza, T-5 P. O. Box 570 Newark, New Jersey 07101 Phone (973) 430-7052 Fax (973) 430-5983 DATED: July 27, 2017
- 17 -
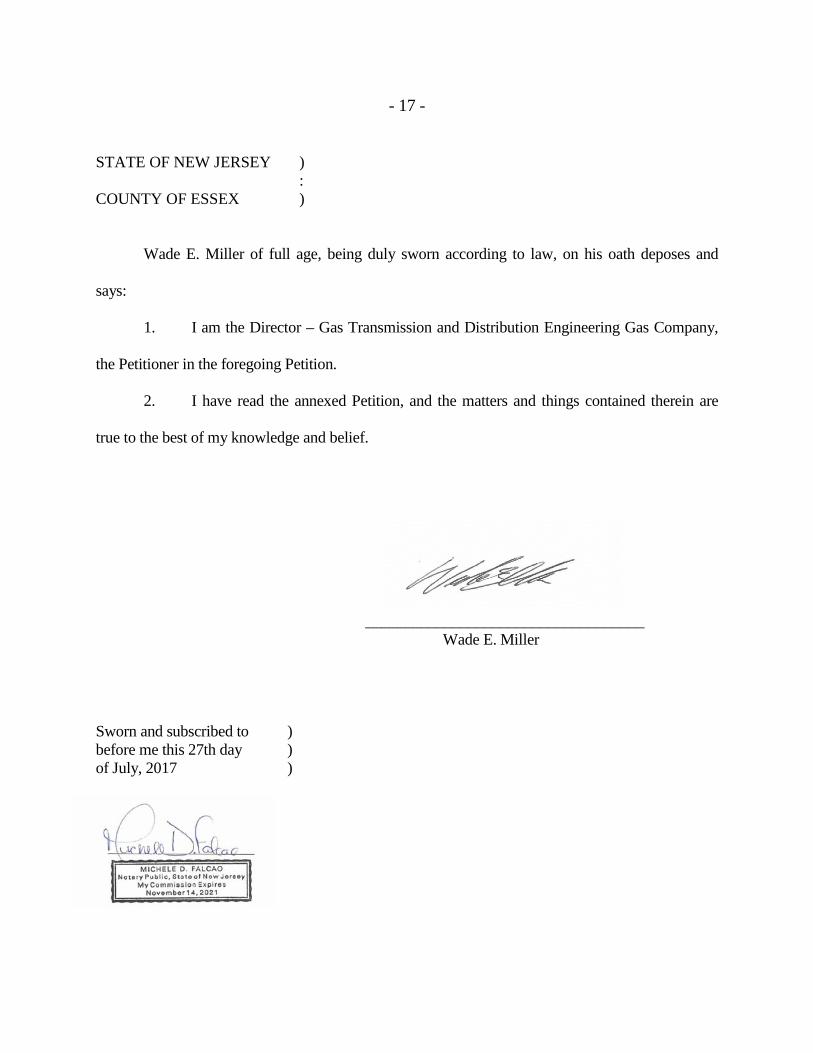
STATE OF NEW JERSEY ) : COUNTY OF ESSEX ) Wade E. Miller of full age, being duly sworn according to law, on his oath deposes and
says:
1. I am the Director – Gas Transmission and Distribution Engineering Gas Company,
the Petitioner in the foregoing Petition.
2. I have read the annexed Petition, and the matters and things contained therein are
true to the best of my knowledge and belief.
___________________________________
Wade E. Miller Sworn and subscribed to ) before me this 27th day ) of July, 2017 )

Appendix 1
PUBLIC SERVICE ELECTRIC AND GAS Minimum Filing Requirements – Gas System Modernization Program II
Minimum Filing Requirement Location in Filing
14:3-2A.2 Project eligibility a) Eligible projects within an Infrastructure Investment
Program shall be: 1. Related to safety, reliability, and/or resiliency; 2. Non-revenue producing; 3. Specifically identified by the utility within its petition
in support of an Infrastructure Investment Program; and
4. Approved by the Board for inclusion in an Infrastructure Investment Program, in response to the utility’s petition.
See Attachment 1, Direct Testimony of Wade E. Miller
b) Projects within an Infrastructure Investment Program may include: 5. The replacement of gas Utilization Pressure Cast Iron
mains with elevated pressure mains and associated services;
6. The replacement of mains and services that are identified as high risk in a gas utility’s Distribution Integrity Management Plan;
7. The installation of gas Excess Flow Valves where existing gas service line replacements require them, excluding Excess Flow Valves installed upon customer request pursuant to 49 CFR 192.383;
8. Electric distribution automation investments, including, but not limited to, Supervisory Control and Data Acquisition equipment, cybersecurity investments, relays, reclosers, Voltage and Reactive Power Control, communications networks, and Distribution Management System Integration;
9. The installation of break-predictive water sensors and wastewater sensors to curtail combined sewer overflows; and
10. Other projects deemed appropriate by the Board
See Attachment 1, Direct Testimony of Wade E. Miller
c) A utility shall maintain its capital expenditures on projects similar to those proposed within the utility’s Infrastructure Investment Program. These capital expenditures shall amount to at least ten (10) percent of any approved Infrastructure Investment Program. These capital expenditures shall be made in the normal course of business and recovered in a base rate proceeding, and shall not be subject to the recovery mechanism set forth in N.J.A.C. 14:3-2A.6.
See Attachment 1, Schedule WEM-GSMPII-2, of the Direct Testimony of Wade E. Miller

Appendix 1
14:3-2A.3 Annual baseline spending levels
a) A utility seeking to establish an Infrastructure Investment Program shall, within its petition, propose annual baseline spending levels to be maintained by the utility throughout the length of the proposed Infrastructure Investment Program. These expenditures shall be recovered by the utility in the normal course within the utility’s next base rate case.
See Attachment 1, Schedule WEM-GSMPII-2, of the Direct Testimony of Wade E. Miller
b) In proposing annual baseline spending levels, the utility shall provide appropriate data to justify the proposed annual baseline spending levels, which may include historical capital expenditure budgets, projected capital expenditure budgets, depreciation expenses, and/or any other data relevant to the utility’s proposed baseline spending level
See Attachment 1, Schedule WEM-GSMPII-2, of the Direct Testimony of Wade E. Miller
14:3-2A.4 Infrastructure Investment Program length and limitations a) Allowance for Funds Used During Construction (AFUDC) shall
be permitted under an Infrastructure Investment Program, but a utility shall not utilize AFUDC once Infrastructure Investment Program facilities are placed in service.
See Attachment 2, Direct Testimony of Stephen Swetz
14:3-2A.5 Infrastructure Investment Program minimum filing and reporting requirements
1) Projected annual capital expenditure budgets for a five (5) year period, identified by major categories of expenditures
See Attachment 1, Schedule WEM-GSMPII-3, of the Direct Testimony of Wade E. Miller
2) Actual annual capital expenditures for the previous five (5) years, identified by major categories of expenditures
See Attachment 1, Schedule WEM-GSMPII-3, of the Direct Testimony of Wade E. Miller
3) An engineering evaluation and report identifying the specific projects to be included in the proposed Infrastructure Investment Program, with descriptions of project objectives, detailed cost estimates, in-service dates, and any applicable cost-benefit analysis for each project
See Attachment 1, Direct Testimony of Wade E. Miller
4) An Infrastructure Investment Program budget setting forth annual budget expenditures
See Attachment 1, Schedule WEM-GSMPII-4, of the Direct Testimony of Wade E. Miller
5) A proposal addressing when the utility intends to file its next base rate case, consistent with N.J.A.C. 14:3-2A.6(f)
See Attachment 2, Direct Testimony of Stephen Swetz
6) Proposed annual baseline spending levels, consistent with N.J.A.C. 14:3-2A.3(a) and (b)
See Attachment 1, Schedule WEM-GSMPII-
Appendix 1
2, of the Direct Testimony of Wade E. Miller
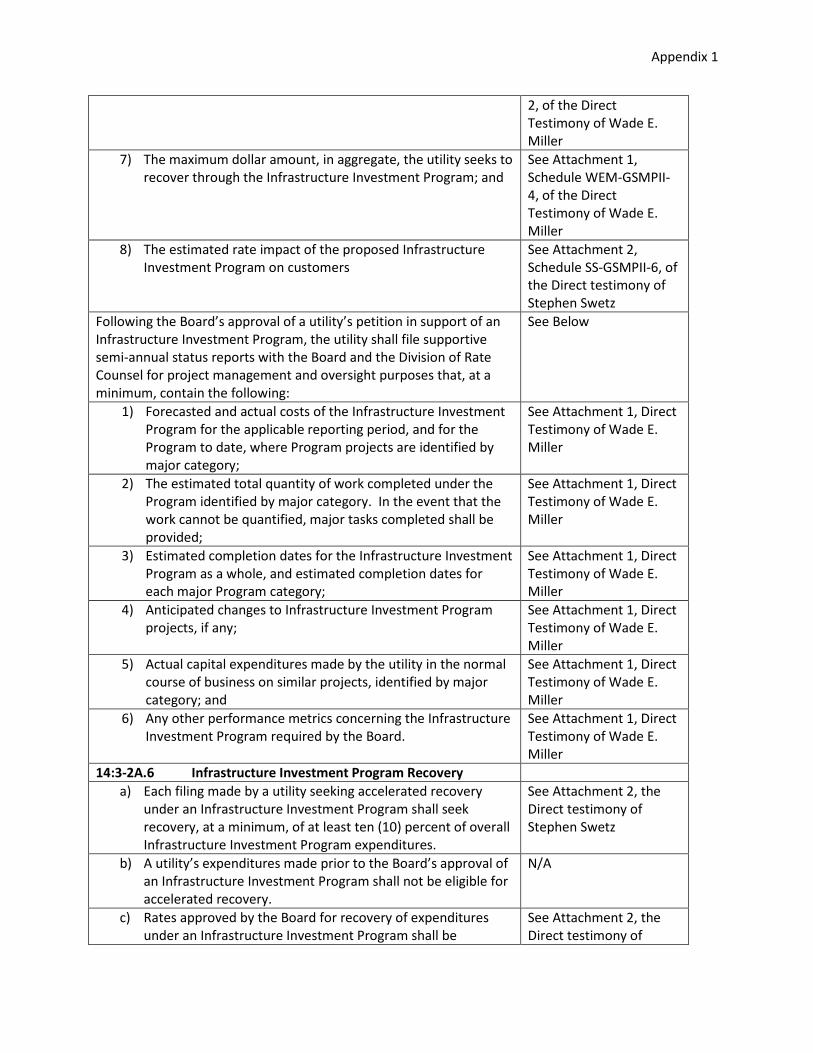
7) The maximum dollar amount, in aggregate, the utility seeks to recover through the Infrastructure Investment Program; and
See Attachment 1, Schedule WEM-GSMPII-4, of the Direct Testimony of Wade E. Miller
8) The estimated rate impact of the proposed Infrastructure Investment Program on customers
See Attachment 2, Schedule SS-GSMPII-6, of the Direct testimony of Stephen Swetz
Following the Board’s approval of a utility’s petition in support of an Infrastructure Investment Program, the utility shall file supportive semi-annual status reports with the Board and the Division of Rate Counsel for project management and oversight purposes that, at a minimum, contain the following:
See Below
1) Forecasted and actual costs of the Infrastructure Investment Program for the applicable reporting period, and for the Program to date, where Program projects are identified by major category;
See Attachment 1, Direct Testimony of Wade E. Miller
2) The estimated total quantity of work completed under the Program identified by major category. In the event that the work cannot be quantified, major tasks completed shall be provided;
See Attachment 1, Direct Testimony of Wade E. Miller
3) Estimated completion dates for the Infrastructure Investment Program as a whole, and estimated completion dates for each major Program category;
See Attachment 1, Direct Testimony of Wade E. Miller
4) Anticipated changes to Infrastructure Investment Program projects, if any;
See Attachment 1, Direct Testimony of Wade E. Miller
5) Actual capital expenditures made by the utility in the normal course of business on similar projects, identified by major category; and
See Attachment 1, Direct Testimony of Wade E. Miller
6) Any other performance metrics concerning the Infrastructure Investment Program required by the Board.
See Attachment 1, Direct Testimony of Wade E. Miller
14:3-2A.6 Infrastructure Investment Program Recovery a) Each filing made by a utility seeking accelerated recovery
under an Infrastructure Investment Program shall seek recovery, at a minimum, of at least ten (10) percent of overall Infrastructure Investment Program expenditures.
See Attachment 2, the Direct testimony of Stephen Swetz
b) A utility’s expenditures made prior to the Board’s approval of an Infrastructure Investment Program shall not be eligible for accelerated recovery.
N/A
c) Rates approved by the Board for recovery of expenditures under an Infrastructure Investment Program shall be
See Attachment 2, the Direct testimony of

Appendix 1
accelerated, and recovered through a separate clause of the utility’s Board-approved tariff.
Stephen Swetz
d) Rates approved by the Board for recovery of expenditures under an Infrastructure Investment Program shall be provisional, subject to refund and interest. Prudence of Infrastructure Investment Program expenditures shall be determined in the utility’s next base rate case.
See Attachment 2, the Direct testimony of Stephen Swetz
e) A utility shall file its next base rate case not later than five (5) years after the Board’s approval of the Infrastructure Investment Program, although the Board, in its discretion, may require a utility to file its next base rate case within a shorter period
See Attachment 2, the Direct testimony of Stephen Swetz
f) An earnings test shall be required, where Return on Equity (ROE) shall be determined based on the actual net income of the utility for the most recent twelve (12) month period divided by the average of the beginning and ending common equity balances for the corresponding period.
See Attachment 2, the Direct testimony of Stephen Swetz
g) For any Infrastructure Investment Program approved by the Board, if the calculated ROE exceeds the allowed ROE from the utility’s last base rate case by fifty (50) basis points or more, accelerated recovery shall not be allowed for the applicable filing period.
See Attachment 2, the Direct testimony of Stephen Swetz

ATTACHMENT 1
STATE OF NEW JERSEY
BOARD OF PUBLIC UTILITIES
IN THE MATTER OF THE PETITION OF
PUBLIC SERVICE ELECTRIC AND GAS COMPANY FOR APPROVAL OF THE NEXT PHASE OF
THE GAS SYSTEM MODERNIZATION PROGRAM AND ASSOCIATED COST RECOVERY MECHANISM
(“GSMP II”)
BPU Docket No. __________
PUBLIC SERVICE ELECTRIC AND GAS COMPANY DIRECT TESTIMONY
OF WADE E. MILLER
DIRECTOR – GAS TRANSMISSION AND DISTRIBUTION ENGINEERING
July 27, 2017
- 2 -
INTRODUCTION 1
Q. Please state your name, affiliation and business address. 2
A. My name is Wade E. Miller, and I am Director, Gas Transmission and Distribution 3
(T&D) Engineering of Public Service Electric and Gas Company (PSE&G, or the 4
Company), the Petitioner in this matter. 5
Q. Please describe your responsibilities as Director of Gas Transmission and 6 Distribution Engineering. 7
A. As the Director of Gas T&D Engineering, I have the responsibility and accountability 8
for three core functions of PSE&G’s gas business. The first core function is delivering the 9
natural gas. This includes gas control and system reliability to over 1.8 million customers. 10
This also includes the operation and maintenance of 48 city gate stations, one Liquefied 11
Natural Gas (LNG) plant, three Liquid Propane Air (LPA) plants, and one Liquid Propane 12
(LP) storage facility. The second core function is gas asset management. This includes the 13
safe and efficient engineering and design of PSE&G’s gas transmission and distribution 14
assets, capacity planning, corrosion control, replacement facility identification and 15
prioritization, transmission pipeline maintenance, and the management of the Transmission 16
and Distribution Integrity Management Programs. The third core function is business 17
support and technical services. This includes the development of operating standards and 18
procedures, material evaluation and specification, operator qualification and our research & 19
development programs. 20
Q. Please describe your educational and professional background and 21 qualifications. 22
A. This information is provided in Schedule WEM-GSMPII-I, which is attached hereto. 23
- 3 -
Q. What is the purpose of your testimony in this proceeding? 1
A. My testimony discusses the prudence and timeliness of PSE&G’s proposed Gas 2
System Modernization Program extension (GSMP II, or Program). I describe the Program 3
and its focus solely on gas projects designed to replace cast iron mains, unprotected steel mains 4
and services, abandonment of district regulators associated with this cast iron and 5
unprotected steel plant, reinforcement of large diameter elevated pressure cast iron, and 6
relocation of inside meter sets. I also describe the underlying reasons for the Program, 7
including the need for a forward-looking, efficient, long-term replacement plan for aging gas 8
infrastructure. Further, I describe the time-frame for the Program and the estimated costs of 9
the Program. 10
Q. How is the remainder of your testimony organized? 11
A. My testimony is organized into several sections following this introduction: 12
INTRODUCTION - 2 - 13
EXECUTIVE SUMMARY - 5 - 14
Reasons for the Filing - 7 - 15 “Call to Action” - 8 - 16
Infrastructure Investment Program Proposal - 11 - 17
PSE&G Inventory and System Profile - 13 - 18
Proposed Program - 31 - 19 Work to be Done - 31 - 20
Cast Iron and Unprotected Steel Main Replacement - 32 - 21
EPCI Replacement - 32 - 22
Elevating Pressure - 33 - 23
EPCI Joint Reinforcement - 34 - 24
Moving Inside Meter Sets - 36 - 25

- 4 -
Selection Criteria - 37 - 1
DIMP - 37 - 2
Main Selection Methodology - 46 - 3
Changes from GSMP I - 50 - 4
Duration – Proposal for 5 year program - 52 - 5
Cost - 53 - 6
Ability to Do Work - 60 - 7
Experience with Programs - 60 - 8
Details on Workforce - 62 - 9
Communicating with Customers - 65 - 10
Program Benefits and Savings - 66 - 11 Benefits of Modernized System - 67 - 12
Benefits to Customers - 70 - 13
Environmental Benefits - 72 - 14
Cost Efficiency - 73 - 15
Benefits of Longer Duration - 74 - 16
GSMP I Status Update - 75 - 17
GSMP I Lessons Learned - 77 - 18
Program Reporting - 80 - 19
Conclusion - 82 - 20 21
22
- 5 -
EXECUTIVE SUMMARY 1
Q. Please provide a brief summary of the GSMP. 2
A. PSE&G’s Gas System Modernization Program (GSMP) is an accelerated replacement 3
program for low/utilization pressure cast iron mains (UPCI), elevated pressure cast iron 4
(EPCI), and unprotected steel mains and services. GSMP II has been filed with the New 5
Jersey Board of Public Utilities (BPU or the Board) as a 5 year program extension as part of 6
a long-term 20 year elimination strategy. GSMP started when the BPU approved GSMP I, 7
and GSMP II continues this effort. GSMP II targets the replacement of legacy systems on a 8
“map grid” basis, compared to the segment by segment approach of typical annual base plan 9
main replacement. This allows for a systematic replacement strategy that still focuses on risk, 10
while maximizing construction efficiency and cost-effectiveness. The program continues to 11
support a regulatory focus on replacing the highest risk, most leak prone facilities, as 12
identified in the Company’s Distribution Integrity Management Plan. 13
The proposed program would be for 5 years at 250 miles per year, with estimated 14
investment of approximately $536 million per year, or $2.68 billion for the full five years. 15
The Company’s experience executing GSMP I and ability to go beyond its requirements 16
demonstrates that the Company can execute a larger scale and longer program. In addition, 17
the work completed under GSMP I was performed with an excellent safety record while 18
maintaining high customer satisfaction. As noted, a longer term program will prove to be 19
more cost effective. The proposed Program will accelerate O&M savings and emissions 20
reductions, and the timing is right given the relatively low cost of gas commodity for 21
residential customers. 22

- 6 -
Q. Please describe the proposed program extension. 1
A. The proposed GSMP II would replace 870 miles of UPCI (of PSE&G’s current 2
inventory of 3,294 miles), 130 miles of EPCI, 200 miles of unprotected/bare steel mains, 50 3
miles of cathodically-protected steel and plastic main, and reinforcement of approximately 4
4,000 EPCI, large diameter bell joints. Main replacement will result in approximately 266 5
abandoned district regulators, replacement of approximately 99,200 unprotected steel 6
services, and the relocation of approximately 70,900 inside meter sets to the outside. Where 7
appropriate, services will have excess flow valves installed for improved safety. GSMP II 8
targets all UPCI main diameters, and work prioritization will be based on grid hazard index 9
calculations. UPCI systems will be replaced with EP systems that have improved reliability. 10
EPCI mains will be prioritized by break history, as well as consideration of EPCI main 11
replacement associated with UPCI and unprotected steel jobs. Unprotected steel mains will 12
be prioritized by age, diameter, pressure, and leak history. EPCI joint reinforcement will 13
target large diameter cast iron mains that are not prone to breaks and are not due for 14
replacement but are prone to joint leaks. The reinforcements will reduce the possibility of 15
future joint leaks and reduce potential methane emissions. 16
Q. Please describe the Program’s benefits. 17
A. The Program will produce many benefits for customers, for PSE&G’s gas distribution 18
system, and for the environment. Customers will benefit from a safer, more modern system 19
that accommodates newer technologies and appliances. The replacement of mains and 20
services will enhance the safety and reliability of the system through the use of more modern 21
materials and construction. An additional benefit from GSMP is an accelerated reduction of 22

- 7 -
greenhouse gas emissions from legacy facilities. The long term 20 year elimination strategy 1
is equivalent to removing approximately 127,000 vehicles from the road every year. 2
Reasons for the Filing 3
Q. Please summarize your reason for filing. 4
A. Aging cast iron and unprotected steel pipe serving PSE&G customers exhibits 5
significantly greater leak rates than newer plastic and cathodically protected steel pipe and 6
will eventually require replacement or rehabilitation. The proposed GSMP II and associated 7
cost recovery mechanism represent a prudent response to PSE&G’s long- term system 8
needs and the Department Of Transportation’s “Call to Action” to facilitate the 9
replacement of aging gas infrastructure. The GSMP II Program is also consistent with the 10
Board’s proposed new regulations (New Subchapter N.J.A.C. 14:3-2A), regarding 11
Infrastructure Investment Programs (“IIPs”). The safety-related, customer, economic and 12
other benefits attributable to the five-year Program extension, as presented in my testimony, 13
are compelling. 14
Q. Is it appropriate for PSE&G to move forward with a long-term approach to gas 15 infrastructure replacement? 16
A. Yes. PSE&G’s prior replacement levels supported safe and adequate service but the 17
current GSMP program and this proposed extension will expedite the replacement, making 18
the system safer, more reliable, and less leak prone. This will result in O&M savings and 19
emissions reductions, all at “the right time”, while construction labor is available and 20
customers’ gas rates remain low. While there is no immediate risk posed by PSE&G’s 21
current system and operating practices, the distribution system is aging; and while 22

- 8 -
PSE&G manages the risks posed by its legacy system, all cast iron and unprotected steel 1
will eventually require replacement or rehabilitation. Moreover, the costs associated with 2
the ongoing management of the legacy systems will increase as the system continues to 3
age. 4
If significant failures occur, a potential response may be to develop a reactive 5
accelerated replacement program. Such a reactive approach could present costly and 6
difficult management issues, as opposed to the more orderly and proactive planned 7
approach through the GSMP Program. 8
“Call to Action” 9
Q. Please describe the “Call to Action” in greater detail. 10
A. In 2011, under the direction of the then Department of Transportation (DOT) 11
Secretary Ray LaHood, the DOT and Pipeline and Hazardous Materials Safety 12
Administration (PHMSA) called for readdressing the fitness for service of the nation’s 13
natural gas system, including the replacement of aging facilities. This is the DOT’s “Call to 14
Action”, which seeks more aggressive actions on the part of pipeline operators to repair 15
and replace infrastructure that is considered high risk. PHMSA specifically includes cast 16
iron and unprotected steel pipe as categories of pipeline infrastructure that require repair, 17
rehabilitation and replacement. The “Call to Action” was followed by an advisory bulletin 18
issued by PHMSA on March 23, 2012 to owners and operators of natural gas cast iron 19
distribution pipelines and state pipeline safety representatives. The bulletin urges operators of 20
natural gas distribution systems to accelerate replacement of aging infrastructure in order 21
to enhance safety, and requests state agencies to consider enhancements to cast iron 22
- 9 -
replacement plans and programs. The focused attention on cast iron pipelines was based 1
upon the agency’s assessment of circumstances that may have contributed to recent deadly 2
explosions in Pennsylvania. Secretary LaHood called for an evaluation of the fitness for 3
service of the aging aspects of natural gas infrastructure and for actions to be taken to 4
address safety risks. The plan seeks to involve operators such as Local Distribution 5
Companies (LDCs), utility regulators, safety regulators and other interested stakeholders 6
in the development of a strategy for addressing aging natural gas infrastructure. The “Call 7
to Action” proposes that pipeline owners and operators, such as PSE&G, take an 8
aggressive approach to repairing and replacing pipeline facilities that are more hazardous. 9
The “Call to Action” specifically identifies the benefits of investing in infrastructure to 10
enhance public safety and to provide for the future integrity of the pipeline system through 11
the use of Smart Modernization. 12
Q. Can you define what Smart Modernization is? 13
A. The concept of Smart Modernization arises from the “Call to Action” issued by 14
Secretary LaHood, following incidents on the United States natural gas delivery system. 15
The intention behind Smart Modernization is to balance customer needs with risk and is 16
not an overly aggressive approach to system risk management. In essence it is part of the 17
implementation of the Company’s Distribution Integrity Management Plan (“DIMP”) 18
program and recognizes that the risks inherent in the system cannot be eliminated 19
without due consideration of cost and impact on customers and the community. Smart 20
Modernization includes the replacement and upgrading of existing mains, services, and 21
equipment by following a methodological approach that considers: 22
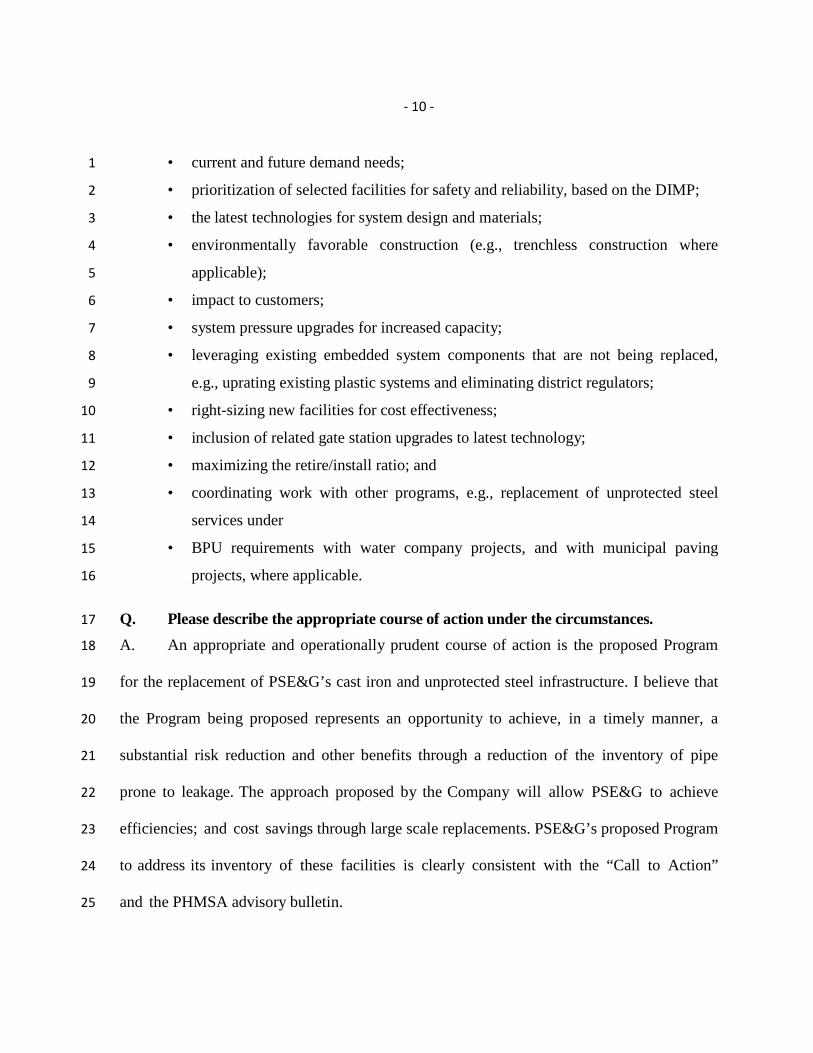
- 10 -
• current and future demand needs; 1
• prioritization of selected facilities for safety and reliability, based on the DIMP; 2
• the latest technologies for system design and materials; 3
• environmentally favorable construction (e.g., trenchless construction where 4
applicable); 5
• impact to customers; 6
• system pressure upgrades for increased capacity; 7
• leveraging existing embedded system components that are not being replaced, 8
e.g., uprating existing plastic systems and eliminating district regulators; 9
• right-sizing new facilities for cost effectiveness; 10
• inclusion of related gate station upgrades to latest technology; 11
• maximizing the retire/install ratio; and 12
• coordinating work with other programs, e.g., replacement of unprotected steel 13
services under 14
• BPU requirements with water company projects, and with municipal paving 15
projects, where applicable. 16
Q. Please describe the appropriate course of action under the circumstances. 17
A. An appropriate and operationally prudent course of action is the proposed Program 18
for the replacement of PSE&G’s cast iron and unprotected steel infrastructure. I believe that 19
the Program being proposed represents an opportunity to achieve, in a timely manner, a 20
substantial risk reduction and other benefits through a reduction of the inventory of pipe 21
prone to leakage. The approach proposed by the Company will allow PSE&G to achieve 22
efficiencies; and cost savings through large scale replacements. PSE&G’s proposed Program 23
to address its inventory of these facilities is clearly consistent with the “Call to Action” 24
and the PHMSA advisory bulletin. 25
- 11 -
Infrastructure Investment Program Proposal 1
Q. What is the Infrastructure Investment Program proposal? 2
A. It is a regulation proposed by the BPU “to allow a utility to construct, install, or 3
remediate utility plant and facilities related to reliability, resiliency, and/or safety to provide 4
safe and adequate service. The IIP is a regulatory initiative intended to create a financial 5
incentive for utilities to accelerate the level of investment needed to promote the timely 6
rehabilitation and replacement of certain non-revenue producing components that enhance 7
reliability, resiliency, and/or safety.” 8
Q. Are the projects in the GSMP II Program eligible under the IIP proposal? 9
A. Yes. The IIP proposal covers projects that are related to safety, reliability and/or 10
resiliency and that are non-revenue producing. The GSMP II projects are consistent with this 11
requirement. Further, the IIP proposal even specifies replacement of utilization pressure cast 12
iron main with elevated pressure, the removal of high risk mains according to a Company’s 13
Distribution Integrity Management Plan, and the installation of excess flow valves as 14
examples of projects eligible for the IIP. 15
Q. Are there requirements to seek accelerated recovery of infrastructure 16 investments under the IIP proposal? 17
A. Yes. The location of all requirements under the IIP proposal in the GSMP II filing is 18
provided in Appendix 1 to the Petition. I will address the requirements related to program 19
eligibility, capital expenditures, selection criteria, and reporting. Mr. Swetz will address 20
requirements associated with cost recovery. 21
- 12 -
Q. Is the Company proposing to maintain base capital expenditures on similar 1 projects as proposed for the GSMP II Program? 2
A. Yes. The Company commits to spending at least 10 percent above the capital 3
expenditures proposed for the GSMP II Program to be recovered in a base rate proceeding. 4
See Schedule WEM-GSMPII-2 for the annual breakdown. 5
Q. Is the Company proposing annual baseline spending levels over the life of the 6 Program? 7
A. Yes. Please see Schedule WEM-GSMPII-2 for the annual baseline spending levels over 8
the GSMP II period. 9
Q. What is the justification for the annual baseline budget spending levels? 10
A. The annual baseline spending levels proposed in Schedule WEM-GSMPII-2 are the 11
Company’s projected capital budget, which is based on projected annual depreciation expenses. 12
Further, within the baseline spending limit, the Company commits to maintaining 10 percent of 13
the Program capital expenditures specific to projects similar to GSMP II. 14
Q. Is the Company proposing any limit to variations in annual spending? 15
A. Yes. Consistent with the proposed IIP regulations, the Company proposes that it be 16
allowed annual variations in its capital expenditures up to 10 percent so long as the expenditures 17
do not exceed the overall approved budget for the Program. The Company will seek Board 18
approval for any year-to-year variances that are expected to be greater than 10 percent. 19
- 13 -
Q. Have you included the Company’s actual capital expenditures over the past five 1 years and projected capital expenditures over the next five years by major 2 category? 3
A. Yes. Please see Schedule WEM-GSMPII-3 for the actual and projected capital 4
expenditures by major category from 2012 through 2021. 5
Q. Has an engineering evaluation been done to determine the projects, in-service 6 dates, costs and benefits of the proposed Program? 7
A. Yes. My testimony below details the projects proposed for the Program, how and why 8
they were selected, the monthly forecasted capital expenditures, the cost estimate, including 9
how those cost estimates were developed, and the benefits of the Program. 10
Q. Have you developed an annual budget for the GSMP II Program? 11
A. Yes. Please see Schedule WEM-GSMPII-4 for the monthly and annual capital 12
expenditures for the Program. As shown in Schedule WEM-GSMPII-4, the maximum capital 13
expenditure dollar amount the Company seeks to recover through the Program is $2.7 billion. 14
Q. Is the Company proposing any reporting requirements associated with GSMP II? 15
A. Yes. Consistent with the IIP, the Company is proposing semi-annual status reports on 16
the Program. The reporting requirements are detailed later in my testimony. 17
PSE&G Inventory and System Profile 18
Q. Describe the development of PSE&G’s gas distribution system. 19
A. PSE&G was formed in 1903 by amalgamating more than 400 gas, electric and 20
transportation companies in New Jersey. PSE&G’s oldest predecessor, the Paterson Gas 21
Light Company, began actual operations in 1847. The pioneering history of a manufactured 22
- 14 -
gas system, creating gas from coal and supplying it predominantly for lighting, has resulted 1
in PSE&G’s remaining legacy low-pressure gas distribution system. Some of the older cast-2
iron pipes in the Company’s system date back to the late 1800s. 3
The Company’s distribution system mains and services reflect the material types that 4
were considered state-of-the-art over the years as the system grew to serve new customers. 5
The system design has large diameter trunk mains supplied from a source (initially a 6
manufactured gas plant; subsequently a city gate station) transporting gas to a connected 7
network of smaller diameter mains that ultimately supply gas to customers through single 8
service lines. In the first half of the 20th century the primary material used for distribution 9
main pipe was cast iron, and the primary material used for services was unprotected steel 10
pipe. In the 1950s, there was a transition to steel materials for mains. Cathodic protection 11
of steel pipe became widespread in the 1960s. From the 1970s to the present, plastic 12
materials for new mains and services were installed in lieu of steel except for certain large 13
diameter installations. As a result of the foregoing, the Company’s current distribution 14
system includes a mix of cast iron, steel, and plastic mains, steel and plastic services, and 15
a very small percentage of copper services. 16
Q. Please describe the current distribution system infrastructure that PSE&G 17 maintains and operates, and the physical characteristics and materials that make 18 up PSE&G’s current distribution system. 19
A. PSE&G serves approximately 1.8 million gas customers in a service area of almost 20
2400 square miles. PSE&G operates a gas distribution system network of approximately 21
35,000 miles of mains and services in pipe sizes ranging from ½” to 42” in diameter and 22
composed of plastic, steel, and cast iron materials. PSE&G receives odorized gas from 48 23

- 15 -
city gate stations, where gas volumes are measured and the pressure is reduced to 1
distribution pressure. PSE&G operates an integrated gas distribution network comprised 2
of four pressure systems: utilization pressure (UP) and elevated pressures (EP) (15 psig, 60 3
psig, and 120 psig and above). Exhibit 1.1 illustrates the major components of PSE&G’s 4
distribution network. 5
Exhibit 1.1 6
Illustrations of Distribution System Pressure Components 7
8
As summarized in Exhibit 1.2 the 4,332 mile, 0.25 psig utilization pressure system is 9
approximately 24 percent of the distribution network; the 4,606 mile 15 psig system is 10
approximately 26 percent; the 8,783 mile 60 psig system is approximately 49 percent; and 11
the 130 mile 120 psig and above system is approximately 1 percent. 12
- 16 -
Exhibit 1.2 1
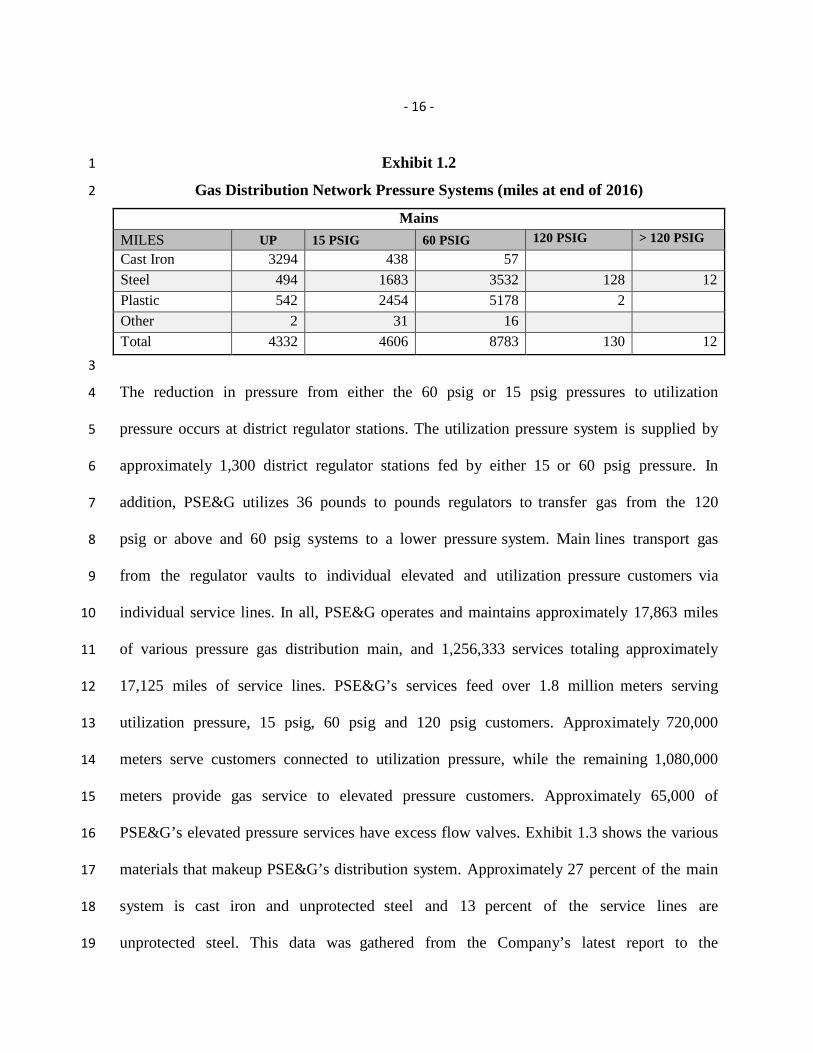
Gas Distribution Network Pressure Systems (miles at end of 2016) 2
Mains MILES UP 15 PSIG 60 PSIG 120 PSIG > 120 PSIG Cast Iron 3294 438 57
Steel 494 1683 3532 128 12 Plastic 542 2454 5178 2 Other 2 31 16
Total 4332 4606 8783 130 12 3
The reduction in pressure from either the 60 psig or 15 psig pressures to utilization 4
pressure occurs at district regulator stations. The utilization pressure system is supplied by 5
approximately 1,300 district regulator stations fed by either 15 or 60 psig pressure. In 6
addition, PSE&G utilizes 36 pounds to pounds regulators to transfer gas from the 120 7
psig or above and 60 psig systems to a lower pressure system. Main lines transport gas 8
from the regulator vaults to individual elevated and utilization pressure customers via 9
individual service lines. In all, PSE&G operates and maintains approximately 17,863 miles 10
of various pressure gas distribution main, and 1,256,333 services totaling approximately 11
17,125 miles of service lines. PSE&G’s services feed over 1.8 million meters serving 12
utilization pressure, 15 psig, 60 psig and 120 psig customers. Approximately 720,000 13
meters serve customers connected to utilization pressure, while the remaining 1,080,000 14
meters provide gas service to elevated pressure customers. Approximately 65,000 of 15
PSE&G’s elevated pressure services have excess flow valves. Exhibit 1.3 shows the various 16
materials that makeup PSE&G’s distribution system. Approximately 27 percent of the main 17
system is cast iron and unprotected steel and 13 percent of the service lines are 18
unprotected steel. This data was gathered from the Company’s latest report to the 19

- 17 -
PHMSA, which contains system data for year-ending 2016. 1
Exhibit 1.3 2
Material Makeup of PSE&G Distribution System 3
STEEL
UNPROTECTED
CATHODICALLY
PROTECTED PLASTIC
CAST/
WROUGHT
IRON
DUCTILE
IRON COPPER OTHER TOTAL
BARE COATED
MILES OF
MAIN
995 4,854 8,218 3,789 0 1 6 17,863
NO. OF
SERVICES
166,459 238,019 819,489 0 0 32,367 0 1,256,3
33
STEEL
UNPROTECTED
CATHODICALLY
PROTECTED PLASTIC
CAST/
WROUGHT
IRON
DUCTILE
IRON COPPER OTHER TOTAL
BARE COATED
% OF MAIN 5.57% 27.17% 46.01% 21.21% 0.00% 0.00% 0.03% 100%
%
OFSERVICE
S
13.25% 18.95% 65.23% 0.00% 0.00% 2.58% 0.00% 100%
2016 Form PHMSA F7100.1-1 4
Q. Are the materials that make up PSE&G’s distribution system the types of 5 materials you would anticipate in a system with its legacy and vintage? 6
A. Yes. A large portion of PSE&G’s system was put in place in the first half of the 20th 7
century when the primary material used for distribution main pipe was cast iron, and the 8
primary material used for services was unprotected steel. There was a transition to 9
unprotected steel materials for main in the 1950’s. Cathodic protection of steel mains 10
became widespread in the 1960’s. In the 1970’s there was a transition from steel to plastic 11
materials for mains and services except for large diameter and elevated pressure 12
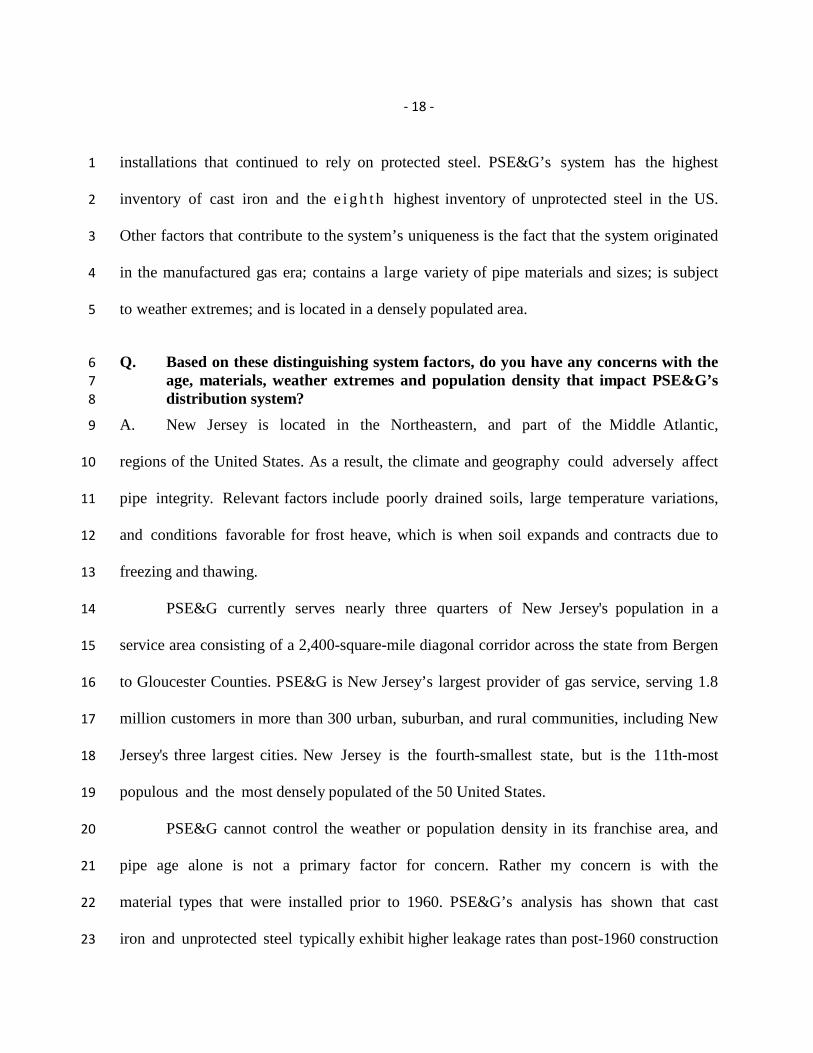
- 18 -
installations that continued to rely on protected steel. PSE&G’s system has the highest 1
inventory of cast iron and the e i gh th highest inventory of unprotected steel in the US. 2
Other factors that contribute to the system’s uniqueness is the fact that the system originated 3
in the manufactured gas era; contains a large variety of pipe materials and sizes; is subject 4
to weather extremes; and is located in a densely populated area. 5
Q. Based on these distinguishing system factors, do you have any concerns with the 6 age, materials, weather extremes and population density that impact PSE&G’s 7 distribution system? 8
A. New Jersey is located in the Northeastern, and part of the Middle Atlantic, 9
regions of the United States. As a result, the climate and geography could adversely affect 10
pipe integrity. Relevant factors include poorly drained soils, large temperature variations, 11
and conditions favorable for frost heave, which is when soil expands and contracts due to 12
freezing and thawing. 13
PSE&G currently serves nearly three quarters of New Jersey's population in a 14
service area consisting of a 2,400-square-mile diagonal corridor across the state from Bergen 15
to Gloucester Counties. PSE&G is New Jersey’s largest provider of gas service, serving 1.8 16
million customers in more than 300 urban, suburban, and rural communities, including New 17
Jersey's three largest cities. New Jersey is the fourth-smallest state, but is the 11th-most 18
populous and the most densely populated of the 50 United States. 19
PSE&G cannot control the weather or population density in its franchise area, and 20
pipe age alone is not a primary factor for concern. Rather my concern is with the 21
material types that were installed prior to 1960. PSE&G’s analysis has shown that cast 22
iron and unprotected steel typically exhibit higher leakage rates than post-1960 construction 23

- 19 -
materials. I note that PSE&G has managed pipe replacement through various means, 1
including targeted replacement, under the Capital Infrastructure Investment Programs( CIP I 2
and CIP II), Energy Strong, and GSMP I, which has resulted in removal of approximately 3
41% of the cast iron and unprotected steel main in PSE&G’s system. 4
Q. Can you comment on the age of facilities that are presently in service? 5
A. Yes. Exhibit 1.4 provides a profile of the age of PSE&G’s distribution mains and 6
services as of December 31, 2016. 7
Exhibit 1.4 8
Age Profile of PSE&G Gas Mains and Services
MAINS SERVICES
VINTAGE MILES PERCENT COUNT PERCENT
PRE-1940 2,523 14% 141,775 11%
1940-1949 314 2% 20,071 2%
1950- 1959 1,651 9% 88,662 7%
1960- 1969 3,030 17% 194,676 15%
1970- 1979 1,570 9% 120,248 10%
1980- 1989 3,113 17% 206,227 16%
1990- 1999 2,835 16% 189,355 15%
2000- 2009 1,947 11% 158,887 13%
2010- 2019 881 5% 136,433 11%
TOTAL 17,863 100% 1,256,333 100%
Source: 2016 Form PHMSA F7100.1-1 9
Q. Are there any concerns with a gas system distribution inventory with this age 10 profile? 11
A. Yes. As discussed in my testimony, generally, the greatest concerns are associated 12
with facilities installed prior to 1960. Pre-1960 materials constitute 25% of PSE&G’s mains 13

- 20 -
and 20% of its services, yet account for approximately 65% of the distribution system 1
leaks, excluding leaks caused by third-party damage. 2
PSE&G operates 3,789 miles of cast iron main, almost 1,000 miles of unprotected 3
steel main, and approximately 167,000 unprotected steel services. Continued corrosion is 4
likely to increase the leak rates for older materials due to the time function of the corrosion 5
process. The primary problems presented by cast iron and unprotected steel are summarized 6
below. 7
Cast Iron Pipe – There are two primary problems with cast iron systems. 8
First, cast iron pipe has little inherent flexibility and is susceptible to breakage due 9
to ground movement, which is most frequently caused by frost heave. Ground movement 10
creates an excessive bending stress in the pipe which may cause it to fail in a 11
circumferential break and lead to a relatively large gas leak at the point of failure. Cast iron 12
pipe sizes 12 inches and below are particularly susceptible to unpredictable breaks. 13
Second, when originally installed in rigid 12 or 18 foot lengths, sections were joined 14
either with bell and spigot type connections or mechanical joints. The annular space in bell 15
and spigot connections was packed with jute fiber followed by lead or cement to form a gas 16
tight joint, while mechanical joints resulted in a bolted connection with a gasket seal. Time, 17
ground movement and/or drying action of the gas can cause a joint to leak. Remedial action 18
in the form of external clamps or internal seals then becomes necessary. The occurrence of 19
cast iron joint leaks is 4 to 5 times greater than cast-iron breaks. Larger size cast-iron pipes 20
are more susceptible to joint leaks than breaks. 21
Unprotected Steel Pipe - The primary problem encountered with unprotected steel 22

- 21 -
pipe is corrosion that will develop leaks over time. Specifically, steel pipe deteriorates due 1
to contact with moisture present in the soil. The rate of corrosion varies depending on a 2
number of characteristics of the soil, including moisture and pH. Uncontrolled corrosion 3
will ultimately result in numerous, relatively small gas leaks. 4
Initially, a leak from an unprotected steel pipe starts as a pinhole leak. Over- time 5
metal loss will increase in size and location, allowing more gas to escape; and eventually 6
resulting in numerous relatively small gas leaks. Eventually, these small leaks multiply and 7
can grow to the point where they threaten the integrity of the pipe. In general the 8
deterioration of unprotected steel accelerates as it ages. 9
Q. How does PSE&G’s inventory of cast iron and unprotected steel compare to 10 other gas distribution systems in the United States? 11
A. PSE&G’s distribution system contains a large inventory of cast iron and unprotected 12
steel. Exhibit 1.5 shows that the Company has 3,789 miles of cast iron pipe comprising 13
21% of its main system at year end 2016. When compared to other distribution companies 14
that have significant amounts of cast iron in their distribution pipe inventory, PSE&G has 15
the distinction of being ranked number one based on total miles of cast iron main. 16
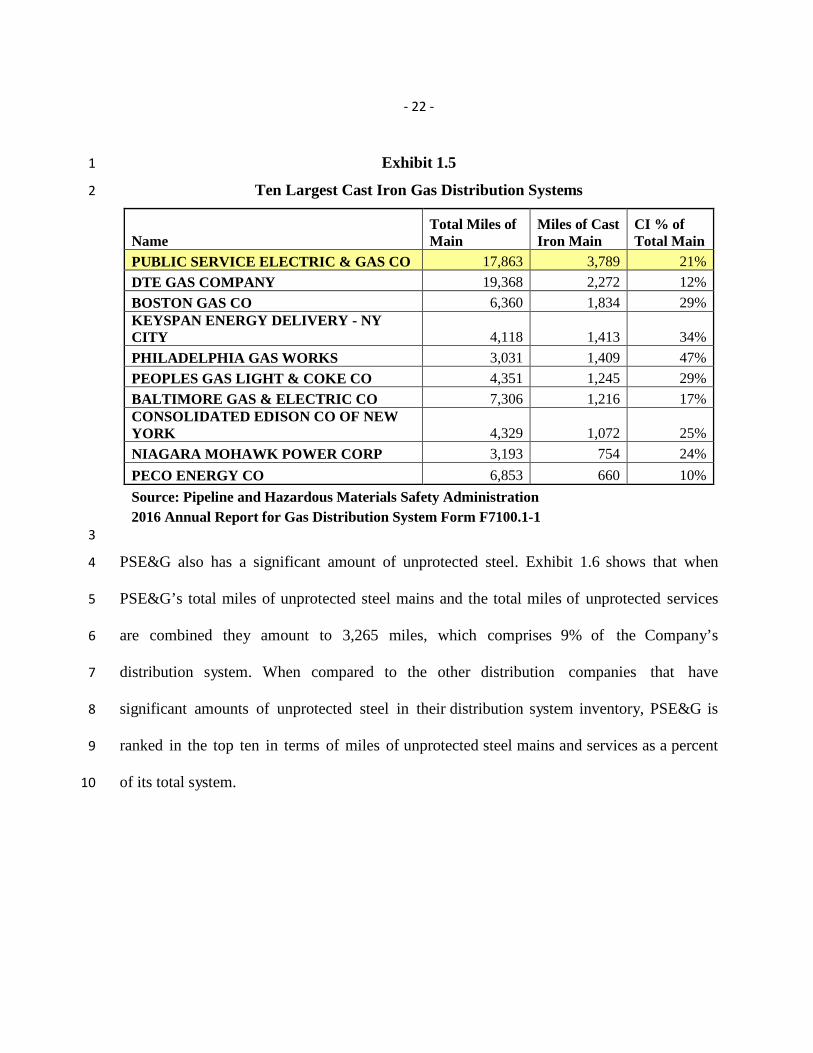
- 22 -
Exhibit 1.5 1
Ten Largest Cast Iron Gas Distribution Systems 2
Name Total Miles of Main
Miles of Cast Iron Main
CI % of Total Main
PUBLIC SERVICE ELECTRIC & GAS CO 17,863 3,789 21% DTE GAS COMPANY 19,368 2,272 12% BOSTON GAS CO 6,360 1,834 29% KEYSPAN ENERGY DELIVERY - NY CITY 4,118 1,413 34% PHILADELPHIA GAS WORKS 3,031 1,409 47% PEOPLES GAS LIGHT & COKE CO 4,351 1,245 29% BALTIMORE GAS & ELECTRIC CO 7,306 1,216 17% CONSOLIDATED EDISON CO OF NEW YORK 4,329 1,072 25% NIAGARA MOHAWK POWER CORP 3,193 754 24% PECO ENERGY CO 6,853 660 10% Source: Pipeline and Hazardous Materials Safety Administration 2016 Annual Report for Gas Distribution System Form F7100.1-1
3
PSE&G also has a significant amount of unprotected steel. Exhibit 1.6 shows that when 4
PSE&G’s total miles of unprotected steel mains and the total miles of unprotected services 5
are combined they amount to 3,265 miles, which comprises 9% of the Company’s 6
distribution system. When compared to the other distribution companies that have 7
significant amounts of unprotected steel in their distribution system inventory, PSE&G is 8
ranked in the top ten in terms of miles of unprotected steel mains and services as a percent 9
of its total system. 10
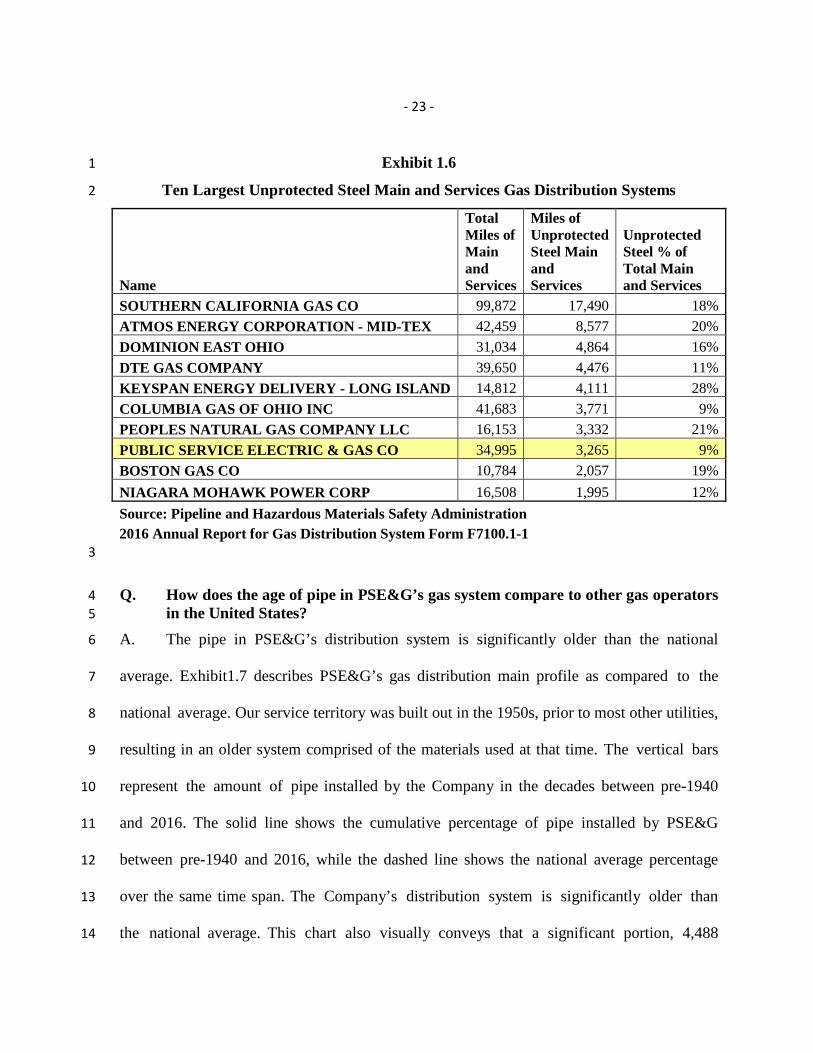
- 23 -
Exhibit 1.6 1
Ten Largest Unprotected Steel Main and Services Gas Distribution Systems 2
Name
Total Miles of Main and Services
Miles of Unprotected Steel Main and Services
Unprotected Steel % of Total Main and Services
SOUTHERN CALIFORNIA GAS CO 99,872 17,490 18% ATMOS ENERGY CORPORATION - MID-TEX 42,459 8,577 20% DOMINION EAST OHIO 31,034 4,864 16% DTE GAS COMPANY 39,650 4,476 11% KEYSPAN ENERGY DELIVERY - LONG ISLAND 14,812 4,111 28% COLUMBIA GAS OF OHIO INC 41,683 3,771 9% PEOPLES NATURAL GAS COMPANY LLC 16,153 3,332 21% PUBLIC SERVICE ELECTRIC & GAS CO 34,995 3,265 9% BOSTON GAS CO 10,784 2,057 19% NIAGARA MOHAWK POWER CORP 16,508 1,995 12% Source: Pipeline and Hazardous Materials Safety Administration 2016 Annual Report for Gas Distribution System Form F7100.1-1 3
Q. How does the age of pipe in PSE&G’s gas system compare to other gas operators 4 in the United States? 5
A. The pipe in PSE&G’s distribution system is significantly older than the national 6
average. Exhibit1.7 describes PSE&G’s gas distribution main profile as compared to the 7
national average. Our service territory was built out in the 1950s, prior to most other utilities, 8
resulting in an older system comprised of the materials used at that time. The vertical bars 9
represent the amount of pipe installed by the Company in the decades between pre-1940 10
and 2016. The solid line shows the cumulative percentage of pipe installed by PSE&G 11
between pre-1940 and 2016, while the dashed line shows the national average percentage 12
over the same time span. The Company’s distribution system is significantly older than 13
the national average. This chart also visually conveys that a significant portion, 4,488 14

- 24 -
miles or 25.1 percent of PSE&G’s distribution system, was installed prior to 1960, when 1
cast iron and unprotected steel were considered state-of-the art construction materials. 2
Exhibit 1.73
4
5
Source: Pipeline and Hazardous Materials Safety Administration 2016 Annual Report for Gas Distribution System Form F7100.1-1
Q. Based on comparison with the other United States and New Jersey gas utilities; 6 do you have any concerns about the amount of cast-iron and unprotected 7 steel that make up PSE&G’s distribution system? 8
A. Yes. The sheer magnitude of the cast iron and unprotected steel in the Company’s 9
network is a concern. PSE&G has more cast-iron in its system than any other utility in the 10
United States; and is ranked eighth nationally for the amount of unprotected steel in its 11
0%
10%
20%
30%
40%
50%
60%
70%
80%
90%
100%
0
500
1000
1500
2000
2500
3000
3500
Pre-1940 1940-1949
1950-1959
1960-1969
1970-1979
1980-1989
1990-1999
2000-2009
2010-2016
Cum
ulat
ive
Perc
enta
ge o
f Exi
stin
g M
ain
PSE&
G E
xist
ing
Mai
n, m
iles
Decade Installed
PSE&G Gas Distribution System Main Profile
CI
STEEL
PLASTIC
National Avg
PSE&G

- 25 -
distribution system inventory. When compared to the other New Jersey utilities, the amount 1
of cast-iron and unprotected steel is even more striking. To illustrate, using end of 2016 2
PHMSA data, if the total main systems of the other three New Jersey gas utilities were 3
combined, they would almost equal the size of PSE&G’s system (16,911 miles versus 4
17,863 miles). However, if the amount of cast-iron in the other three Jersey utility 5
networks was combined, the magnitude of cast iron pipe in PSE&G’s distribution system 6
would be more than six times greater (3,789 miles versus 580 miles). The same analogy 7
could be made for the total amount of unprotected steel. If the total main and service 8
systems of the other three gas utilities were combined they too would almost equal the size 9
of PSE&G’s system (33,115 miles versus 34,995 miles); however the amount of unprotected 10
steel in PSE&G’s distribution network would be over 2 times greater (3,265 miles versus 11
1,251 miles). 12
Q. How does the performance of PSE&G’s cast iron system compare to other gas 13 companies? 14
A. Exhibit 1.8 compares PSE&G’s cast iron performance to six other gas companies for 15
the 10 year period 2006-15 (these are the companies that consistently reported cast iron 16
system data over the 10 year period to PSE&G’s Peer Panel). Miles of cast iron main are 17
plotted against the average annual break per mile rate and the average annual number of 18
breaks. PSE&G has the second lowest average annual break rate at 0.116 breaks per mile. It 19
can be seen that the key benefit of inventory reduction is not necessarily a reduction in the 20
break rate but a reduction in the total number of breaks. There is an inherent risk of a cast 21
iron main break and the large volume of escaping gas leading to a catastrophic incident. 22
- 26 -
Reducing this risk exposure requires a sustained, significant replacement program. 1
Exhibit 1.8 2
3
Q. Are other natural gas utilities faced with similar infrastructure challenges? 4
A. Yes. Natural gas utilities across the United States that have cast iron and unprotected 5
steel infrastructure face many of the same challenges as PSE&G, even though the 6
situation for each gas distribution company is specific and unique to its system. The 7
presence of aging cast iron and unprotected steel pipe in the natural gas infrastructure has 8
received considerable national attention due to environmental concerns over greenhouse gas 9
(GHG) emissions and safety concerns associated with aging infrastructure. While utilities 10
have long focused on managing the integrity of these elements of their infrastructure, recent 11
4044
2364
1278
714581
279380
0.1160.103
0.160
0.133 0.1270.151
0.212
488
258
213
10897
10591
0.000
0.050
0.100
0.150
0.200
0.250
0.300
0.350
0.400
0.450
0.500
0
500
1000
1500
2000
2500
3000
3500
4000
4500
5000
PSE&G DTE Energy BG&E PECO AGLResources
UGI Utilities NSTAR
AVG
. BR
EAK
S/M
ILE
MIL
ES
CAST IRON SYSTEM PEER COMPANY COMPARISON 2006-2015
MILES BREAKS/MILE CI BREAKS

- 27 -
incidents have greatly heightened the emphasis that industry members, safety regulators and 1
other stakeholders are placing on addressing potential risks associated with aging 2
infrastructure. 3
Q. Does PSE&G currently operate and manage a system that can be deemed safe by 4
industry standards? 5
A. Yes. In my opinion PSE&G’s operation and management of its distribution system 6
currently provides a level of safety and of leak management that compares well to 7
industry standards, including other utilities with large amounts of Cast Iron/Unprotected 8
Steel ( CI/US) in their systems. This leak comparison is presented in Exhibit 1.9. 9
Exhibit 1.9 10
Comparison of PSE&G’s Leak Rates to National Average 11
12
National Average
PSE&G
0.00
0.10
0.20
0.30
0.40
0.50
0.60
0.70
0.80
0.90
1.00
0.00 0.20 0.40 0.60 0.80 1.00
Serv
ice
Leak
s pe
r 100
Ser
vice
s
Main Leaks per Mile of Main
Gas Distribution System Repaired/Eliminated Services and Main Leaks in 2016
Source: PHMSA Office of Pipeline Safety - 2016

- 28 -
As shown in Exhibit 1.9, PSE&G’s leak rate for services is 0.45 leaks per 100 1
services, which is below (i.e., better than) the national average of 0 .60 leaks per 100 2
services. PSE&G’s leak rate for mains of 0 .25 leaks per mile is higher (i.e., worse than) 3
the national average of 0 .10 main leaks per mile. In fact the Company’s main leak rate is 4
more than double the national average. The explanation for the lower national average 5
leak rate reflects the reliability of the newer materials that make up the national network. 6
To see how PSE&G compares to distribution networks that have large amounts of cast iron 7
and unprotected steel, please refer to Exhibit 1.10, a table showing leak rates among 8
utilities with the most cast iron and unprotected steel. The data is displayed by Main Leaks 9
per Mile of Main rate from lowest to highest. There is significant variation between main 10
leak rates and service leak rates. In general, companies with higher percentages of cast iron 11
main have higher main leak rates and companies with higher percentage of unprotected steel 12
main and service have higher service leak rates. PSE&G results are better than the average of 13
all companies in both main leak rates and service leak rates. 14
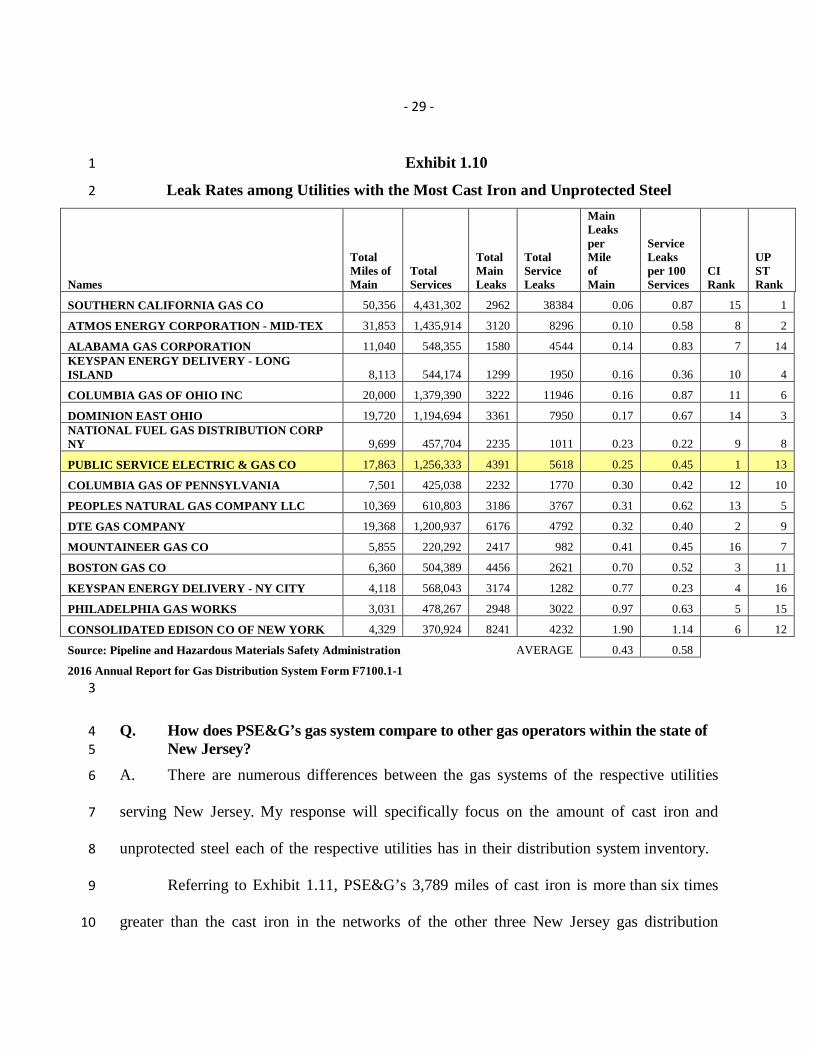
- 29 -
Exhibit 1.10 1
Leak Rates among Utilities with the Most Cast Iron and Unprotected Steel 2
Names
Total Miles of Main
Total Services
Total Main Leaks
Total Service Leaks
Main Leaks per Mile of Main
Service Leaks per 100 Services
CI Rank
UP ST Rank
SOUTHERN CALIFORNIA GAS CO 50,356 4,431,302 2962 38384 0.06 0.87 15 1
ATMOS ENERGY CORPORATION - MID-TEX 31,853 1,435,914 3120 8296 0.10 0.58 8 2
ALABAMA GAS CORPORATION 11,040 548,355 1580 4544 0.14 0.83 7 14 KEYSPAN ENERGY DELIVERY - LONG ISLAND 8,113 544,174 1299 1950 0.16 0.36 10 4
COLUMBIA GAS OF OHIO INC 20,000 1,379,390 3222 11946 0.16 0.87 11 6
DOMINION EAST OHIO 19,720 1,194,694 3361 7950 0.17 0.67 14 3 NATIONAL FUEL GAS DISTRIBUTION CORP NY 9,699 457,704 2235 1011 0.23 0.22 9 8
PUBLIC SERVICE ELECTRIC & GAS CO 17,863 1,256,333 4391 5618 0.25 0.45 1 13
COLUMBIA GAS OF PENNSYLVANIA 7,501 425,038 2232 1770 0.30 0.42 12 10
PEOPLES NATURAL GAS COMPANY LLC 10,369 610,803 3186 3767 0.31 0.62 13 5
DTE GAS COMPANY 19,368 1,200,937 6176 4792 0.32 0.40 2 9
MOUNTAINEER GAS CO 5,855 220,292 2417 982 0.41 0.45 16 7
BOSTON GAS CO 6,360 504,389 4456 2621 0.70 0.52 3 11
KEYSPAN ENERGY DELIVERY - NY CITY 4,118 568,043 3174 1282 0.77 0.23 4 16
PHILADELPHIA GAS WORKS 3,031 478,267 2948 3022 0.97 0.63 5 15
CONSOLIDATED EDISON CO OF NEW YORK 4,329 370,924 8241 4232 1.90 1.14 6 12
Source: Pipeline and Hazardous Materials Safety Administration AVERAGE 0.43 0.58 2016 Annual Report for Gas Distribution System Form F7100.1-1
3
Q. How does PSE&G’s gas system compare to other gas operators within the state of 4 New Jersey? 5
A. There are numerous differences between the gas systems of the respective utilities 6
serving New Jersey. My response will specifically focus on the amount of cast iron and 7
unprotected steel each of the respective utilities has in their distribution system inventory. 8
Referring to Exhibit 1.11, PSE&G’s 3,789 miles of cast iron is more than six times 9
greater than the cast iron in the networks of the other three New Jersey gas distribution 10

- 30 -
companies combined. In addition, cast iron constitutes 21 percent of PSE&G’s 17,863 mile 1
main system, while the next largest cast iron system in a New Jersey utility is 16 percent of 2
a much smaller 3,190 mile main system. The other two gas utilities have between them 76 3
miles of cast iron in their distribution network. 4
Exhibit 1.11 5
New Jersey Utilities Cast Iron Gas Distribution Systems 6
Name Total Miles of Main
Miles of Cast Iron Main
CI % of Total Main
PUBLIC SERVICE ELECTRIC & GAS CO 17,863 3,789 21% ELIZABETHTOWN GAS CO 3,190 504 16% SOUTH JERSEY GAS CO 6,592 76 1% NEW JERSEY NATURAL GAS CO 7,129 - 0% Source: Pipeline and Hazardous Materials Safety Administration 2016 Annual Report for Gas Distribution System Form F7100.1-1
7
Referring to Exhibit 1.12, PSE&G’s 3,265 miles of unprotected steel is over 4 times 8
greater than the amount of unprotected steel in the system of the next highest ranking New 9
Jersey gas distribution company. 10
Exhibit 1.12 11
New Jersey Utilities Unprotected Steel Main and 12
Services Gas Distribution Systems 13
Name
Total Miles of Mains and Services
Miles of Unprotected Steel Main and Services
Unprotected Steel % of Total Main and Services
PUBLIC SERVICE ELECTRIC & GAS CO 34,995 3,265 9% ELIZABETHTOWN GAS CO 12,830 710 6% NEW JERSEY NATURAL GAS CO 14,874 477 3% SOUTH JERSEY GAS CO 5,411 64 1% Source: Pipeline and Hazardous Materials Safety Administration 2016 Annual Report for Gas Distribution System Form F7100.1-1
14

- 31 -
Proposed Program 1
Work to be Done 2
Q. Please describe the proposed Program. 3
A. The Program is a systematic cast iron and unprotected steel pipe replacement and 4
rehabilitation program that will increase public safety, operational efficiencies, and 5
environmental protection. It is a five-year program and approximately 250 miles of mains 6
will be replaced each year. The foundation and summary of the Program is illustrated in 7
Exhibit 1.13. 8
Exhibit 1.13 9
Program Scope Summary1 10
5 YEAR PROGRAM Total 2019 2020 2021 2022 2023 Description
EP Cast Iron Main (Miles) 130
25
28
26
26
26
UP Cast Iron Main (Miles)
870
165
187
174
172
172
Unprotected Steel Main (Miles)
200
38
43
40
40
40 Cathodically Protected Steel and
Plastic Main (Miles)
50
10
11
10
10
10
EPCI Joint Reinforcements
4,000
760
858
800
792
791
District Regulators Abandoned
266
51
57
53
53
53
Unprotected Steel Services
99,200
17,877
22,764
19,809
19,414
19,344
Relocate Inside Meter Set
70,900
13,471
15,201
14,180
14,038
14,013
Total Miles
1,250
238
268
250
248
247 11
1 Annual amounts may not tie to total due to annual scaling factor.

- 32 -
Cast Iron and Unprotected Steel Main Replacement 1
Q. Under the proposed replacement program, what materials would PSE&G use to 2 replace the cast iron and unprotected steel in its distribution system, and what are 3 the strengths of these materials? 4
A. Polyethylene pipe material and coated, cathodically protected steel, which currently 5
represent state-of-the-art gas main and service materials, will be used. Polyethylene (PE) 6
pipe is the current state-of-the-art material for natural gas distribution systems due to its 7
non-corrosive properties. When additional capacity is sought, or design conditions require, 8
companies use coated and cathodically protected steel pipe. 9
Plastic systems have fewer joint connections susceptible to leakage, can withstand 10
ground movement caused by frost and will not corrode. PE pipe also enables companies 11
to more readily isolate and shutoff smaller areas because it can be “squeezed off,” which is 12
a technique that uses a tool that compresses the pipe to stop escaping gas, thus minimizing 13
the impact on customers. 14
On large diameter replacements PSE&G designs call for construction using coated, 15
cathodically protected steel. Cathodically protected steel is highly resistant to the effects of 16
corrosion due to the two levels of protection provided by both the coating and the cathodic 17
protection system. The pipe is significantly more resistant to the effects of ground stresses 18
due to its ductile nature and is more resistant to outside damage due to the strength of the 19
steel. 20
EPCI Replacement 21
Q. Explain the proposed EPCI replacement in more detail. 22
A. The Company would target EPCI that is at a higher risk of failure relative to other 23

- 33 -
EPCI segments. EPCI mains would be prioritized by hazard index, size –(from smaller to 1
larger diameter), pressure (from higher to lower pressure), pipe condition (if known), vintage 2
(post 1946 pipe would receive a higher priority), and logistics. The program would eliminate 3
approximately 96% of all 12” and smaller EPCI, 19% of 16” EPCI, and 7% of 20” and larger 4
EPCI. 5
Elevating Pressure 6
Q. Besides the replacement of legacy materials, what other improvements will be 7 made to the system? 8
A. The utilization pressure portions of the system will be upgraded to higher pressure 9
mains and services. The new elevated pressure will vary depending upon its location. An 10
elevated pressure system has many benefits that will be discussed further in the testimony. 11
Q. Will the new system involve any foregone functionality? 12
A. Eliminating the utilization pressure system and high-risk pipe will not result in any 13
foregone system functionality. Replacing the UPCI and unprotected steel with PE pipe can 14
reduce operating and maintenance cost. PSE&G delivers and has delivered natural gas to 15
over 60% of its customers at elevated pressure for many years. 16
Cathodically Protected Steel and Plastic Main Replacement 17
Q. Will any protected steel or plastic main be replaced in this program? 18
A. Yes. Our experiences in GSMP I have shown that certain segments of cathodically 19
protected steel and PE main that are in the UP system are required to be replaced as part of a 20
large grid based system conversion for economic and logistical reasons. This is 21

- 34 -
approximately 6% of the overall program. 1
EPCI Joint Reinforcement 2
Q. Why is EPCI joint reinforcement being including in the proposed program? 3
A. PSE&G tracks and reports to the BPU annually the leak rate per mile of elevated 4
pressure cast iron main versus an upper performance limit of 0.866 leaks per mile. PSE&G 5
has a regulatory commitment to meet this upper performance standard and if it is exceeded 6
for two consecutive years, must submit a justification and a corrective action plan to comply 7
with the standard within one year. 8
PSE&G’s inventory of elevated pressure cast iron main at the end of 2016 was 494 miles. 9
Although these mains, particularly the larger diameters (larger than 24”) rarely experience 10
a break due to their heavy wall thickness and high beam strength, they are nevertheless 11
impacted by the ground stresses and earth movement associated with severe frost 12
conditions that can lead to a joint leak. In the severe winter of 2014, the elevated cast iron 13
system was subjected to significant stresses and the leak rate for the year exceeded the 14
target (0.960). Leaks associated with joints account for approximately 80% of elevated 15
pressure cast iron main leaks. 16
PSE&G proposes a rehabilitation program to proactively reinforce bell joints on large 17
diameter elevated pressure cast iron mains in an effort to control the annual leak rate below 18
the upper performance standard and avoid the extremely aggressive one year compliance 19
requirement. The program would target 800 joints per year for reinforcement. Reinforcing 20
a cast iron joint imparts rigidity to the joint that results in the expansion/contraction loads 21
- 35 -
being transferred to the nearby unreinforced joints since the reinforced joints have 1
effectively “locked” in movement. A transfer of stress along the pipe can ultimately lead to 2
leakage of adjacent joints. For this reason, PSE&G would prioritize mains that have had 3
recent joint leak reinforcements and main sizes and pressures that have shown higher leak 4
rates, and would select sections of pipe between natural transition points (changes in pipe 5
type, size, or direction) for these projects. 6
Q. Explain in more detail the issue with EP CI joint leaks. 7
A. The elevated pressure cast iron system has approximately 175,000 joints (avg. 15 foot 8
segments). At PSE&G’s current inventory of 494 miles, the upper performance target of 9
0.866 equates to 428 leaks per year. Approximately 342 (80%) of these leaks can be 10
expected to be joint related or one leak for every 512 joints. The joint leak rate is expected to 11
slowly escalate over time due to conditional factors associated with the age of the pipe such 12
as drying out of a caulked joint, gaskets on the Innertite and mechanical joints that dry out, 13
corrosion of the steel bolts/set screws on Innertite joints, mechanical joints and thrust 14
restraint devices. When combined with the additional ground stress induced by severe frost 15
conditions, the overall leak rate can exceed the upper performance standard. It will be 16
extremely challenging to complete enough work within one year to ensure the elevated 17
pressure cast iron leak rate remains below the upper performance standard. 18
As an illustration of this, if PSE&G’s elevated pressure cast iron leak rate was 0.900 19
for two consecutive years, the target would be exceeded by 0.034 leaks per mile each year or 20
17 leaks per year. If main replacement was the chosen means of lowering the leak rate, the 21
data indicates that 19 miles of mains were associated with 17 leaks (17/0.900). If joint 22

- 36 -
reinforcement was chosen, again the data indicates that 8700 joints were associated with 17 1
leaks (17 x 512). However, since the leaks can occur at any time of year, more than the 2
calculated total of replacement main or joint reinforcements would need to be completed to 3
have confidence that 17 leaks would be prevented and ensure the target was achieved. 4
Assuming an average in-service period of 6 months would require approximately 38 miles of 5
main replacement or 17,400 joint reinforcements would need to be completed in the year at a 6
cost of approximately $275 - $300 million (38 miles x $7.9 M/Mile or 17,400 joints x 7
$16,000/joint) to have confidence that 17 leaks would be prevented and the target achieved. 8
Even completing this amount of work still does not guarantee that the leak rate would be 9
below the upper performance standard for the year. EPCI replacement and rehabilitation 10
work is a critical component of the Program. 11
Moving Inside Meter Sets 12
Q. Explain in more detail the benefits of moving inside meter sets to the outside. 13
A. Outside meter sets have numerous benefits. Having meters outside provides easy 14
access for shut off in the event of an emergency, for both Company and emergency 15
response personnel. Moving meter sets to the outside also improve access for meter 16
inspection and leak surveys, as well as meter readers. It reduces the potential for gas leaks 17
within buildings. It also reduces the potential theft of gas due to visibility of the meter 18
location. 19
- 37 -
Selection Criteria 1
DIMP 2
Q. Please describe what the term DIMP means in relation to the operation of Local 3 Distribution Company (LDC) facilities. 4
A. Distribution integrity management is a formal systematic process of identifying, 5
evaluating and addressing direct or potential threats to the safe operation of a gas 6
distribution system. On December 4, 2009, the PHMSA amended Federal Pipeline Safety 7
Regulations requiring gas distribution operators to develop and implement integrity 8
management programs by August 2, 2011. The regulations set forth an overall approach 9
by an operator to ensure the integrity of its distribution system, including a DIMP. A DIMP 10
is a written explanation of the mechanisms the operator uses to implement its integrity 11
management program. The purpose of the program is to enhance safety by identifying and 12
reducing pipeline risks. 13
Q. Please explain the essential requirements of a DIMP and its relationship to the 14 GSMP II Program. 15
A. The purpose of the DIMP is to enhance safety by identifying and reducing system 16
risks. At a minimum, each distribution pipeline operator must have a written integrity 17
management plan that contains procedures for developing and implementing seven major 18
elements defined by PHMSA 49 CFR Part 192 Subpart P. These elements are: 19
1) Knowledge: Knowledge entails the documentation of information to demonstrate an 20 understanding of the gas distribution system developed from reasonably available 21 data. PSE&G’s DIMP references data pertaining to system design, materials, 22 operating characteristics, and environmental factors contained in the Company’s 23 geographic information system, main and service records, and leak management and 24 corrosion control records. 25
- 38 -
2) Identify threats: Threat identification requires consideration of broad issues that may 1 affect the safe operation of the distribution system. PHMSA identifies potential 2 threats according to the following eight categories: corrosion, natural forces, 3 excavation, other outside force damage, material or welds, equipment, operations, and 4 other. 5
3) Evaluate and rank risks: Through the process of evaluating and ranking risks, the 6 company determines the relative importance of all identified risks. The Company 7 takes into consideration both the likelihood of occurrence and the consequences of 8 occurrence. PSE&G relies primarily on analysis of leak repair data and internal 9 subject matter experts (SMEs) to evaluate and rank risks. 10
4) Identify and implement measures to address risks: This element of DIMP 11 documents actions the company takes to reduce risk of failure. Programs at PSE&G 12 that address risks include the leak management, damage prevention, corrosion 13 control, public awareness and operator qualification programs. Specific actions 14 include prevention, detection, mitigation and/or replacement and upgrade. 15
5) Measure performance, monitor results, and evaluate effectiveness: PSE&G uses 16 monitoring and measurement to evaluate the effectiveness of actions implemented in 17 order to address risks. PSE&G measures performance from a variety of information 18 based on completed work, including the collection of data on leak causes, leak 19 classification, and leaks repaired or eliminated. The data is reported and 20 communicated within PSE&G for evaluation and analysis and to provide input for 21 future planning. 22
6) Periodic evaluation and improvement: Periodic evaluation establishes a definitive 23 feedback loop for the overall integrity management process. The DIMP is 24 evaluated on a periodic basis through a number of act ions that take 25 place on an es tabl ished schedule. Additionally, as knowledge concerning 26 the distribution system or potential threats is gained, the elements of the DIMP or 27 required actions may be revised to take into account the impact of the new 28 information. 29
7) Report results: Reporting on integrity management actions and results provides 30 information to PSE&G’s internal management and satisfies federal and state 31 mandated reporting requirements. Annually, PSE&G reports data to regulators 32 concerning the facilities in service by vintage and material, as well as leaks and 33 associated causes. PSE&G’s DIMP comprehensively documents the Company’s risk-34 based approach to distribution integrity management according to the required 35 elements. PSE&G’s risk-based selection process and criteria, employed to 36 manage cast-iron risk, are incorporated into the DIMP. PSE&G’s proposed GSMP II 37 aims to fulfill the purpose of integrity management by directing resources at reducing 38 system risks in a comprehensive and conscientious manner, at the most hazardous 39
- 39 -
assets that the DIMP itself outlines. It is also aimed at preventing or mitigating 1 threats to the integrity of these distribution system assets, while managing discrete 2 cast-iron and unprotected steel risk as it has in the past. 3
Q. What performance metrics are associated with PSE&G’s distribution integrity 4 management activities? 5
A. PSE&G utilizes various performance metrics to verify the effectiveness of its DIMP. 6
These include but are not limited to: EPCI leaks per mile, UPCI leaks per mile, UPCI breaks 7
per mile, unprotected steel main leaks per mile, number of leak repairs on steel services, and 8
number of leaks by cause. Performance metric analysis allows the Company to evaluate 9
system condition and the effectiveness of leak mitigation methods that are relevant to the 10
characteristics of the Company’s infrastructure. 11
Q. Please describe PSE&G’s operational goals and objectives pertaining to the 12 management of its gas infrastructure system. 13
A. The safe and reliable operation of PSE&G’s gas distribution system is the Company’s 14
primary operational goal. Such operation is essential to the health and well-being of the 15
customers, residents and businesses in the communities the Company serves, and of the 16
employees who are responsible for operating the system. Moreover, the Company seeks to 17
achieve the safe and reliable operation of its system in a cost- effective and efficient 18
manner. There are a variety of operational requirements associated with achieving this goal, 19
including the ongoing repair and maintenance of existing facilities, the engineering, 20
planning and construction of new facilities to provide for growth and increased operating 21
flexibility, and the need to rehabilitate or replace existing facilities to meet enhanced 22
safety mandates or to address aging infrastructure concerns. In all aspects of PSE&G’s 23
operations, the Company’s objective is to continuously improve and maintain top decile 24
- 40 -
performance in the industry on a national basis for leak response rate and top quartile 1
performance in system leak reports per mile for similar gas systems. 2
Q. Could you please comment on the resources required by the Company to carry out 3
its distribution integrity management functions? 4
A. PSE&G requires considerable capital and staffing resources to manage the integrity 5
of its distribution system, reflecting both the importance of and challenges associated with 6
its commitment to safety. In terms of staffing, the Gas Delivery business unit includes 7
more than 2,200 PSE&G employees who perform all the operational activities and a majority 8
of the planned construction activities throughout PSE&G’s New Jersey service territory. Gas 9
Delivery employees are supported by field offices located throughout the service territory, 10
as well as the Company’s investment in vehicles and equipment necessary to address 11
all needs and operating circumstances. Additionally, a portion of the Asset Management 12
and Centralized Services staff is directly responsible for the DIMP and provides important 13
management, engineering, construction, and financial oversight for the business unit. 14
Q. What is entailed in operating and maintaining a distribution system like 15 PSE&G’s? 16
A. Although the federal and state pipeline safety regulations establish minimum safety 17
standards, operating and maintaining the integrity of assets such as cast iron and 18
unprotected steel pipe necessitates the effective implementation of a robust operating and 19
maintenance (O&M) plan of policies, processes and procedures. The breadth and depth of 20
PSE&G’s plan is expansive because of the diversity of pipe materials (cast iron, bare steel, 21
coated unprotected steel, protected steel, polyethylene and copper) and operating pressures 22
(utilization, 15 psig, 60 psig and 120 psig and above). The prevention and mitigation 23

- 41 -
activities in the plan include, but are not limited to: 1
• Instrument surveys for leaks and corrosion; 2
• Patrolling for excavation activities; 3
• Inspection of exposed pipe and other facilities; 4
• Preventative maintenance; 5
• Repair, rehabilitation or replacement; 6
• Inside safety inspections; 7
• Public awareness programs; 8
• Damage prevention programs; and 9
• Emergency response. 10
The frequency of PSE&G’s scheduled surveys, inspections, patrols and maintenance 11
range from daily to once every 10 years. Exhibit 1.14 describes the various inspections and 12
their frequency. 13
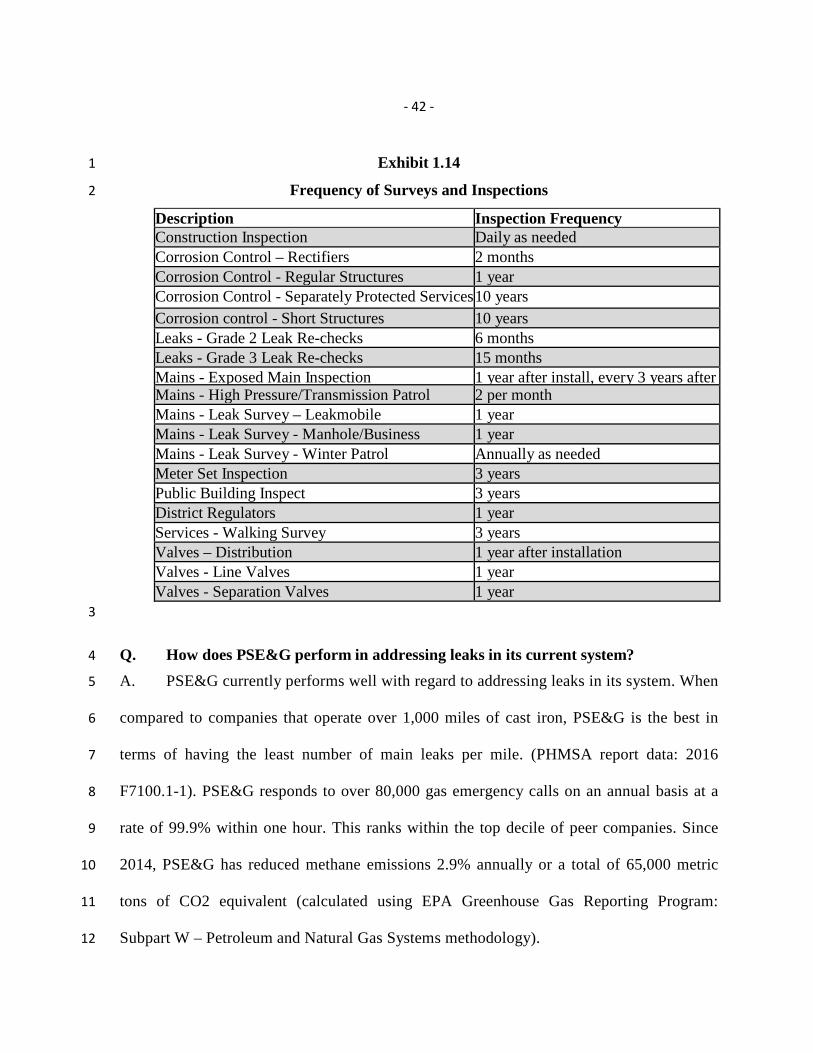
- 42 -
Exhibit 1.14 1
Frequency of Surveys and Inspections 2
Description Inspection Frequency Construction Inspection Daily as needed Corrosion Control – Rectifiers 2 months Corrosion Control - Regular Structures 1 year Corrosion Control - Separately Protected Services 10 years Corrosion control - Short Structures 10 years Leaks - Grade 2 Leak Re-checks 6 months Leaks - Grade 3 Leak Re-checks 15 months Mains - Exposed Main Inspection 1 year after install, every 3 years after Mains - High Pressure/Transmission Patrol 2 per month Mains - Leak Survey – Leakmobile 1 year Mains - Leak Survey - Manhole/Business 1 year Mains - Leak Survey - Winter Patrol Annually as needed Meter Set Inspection 3 years Public Building Inspect 3 years District Regulators 1 year Services - Walking Survey 3 years Valves – Distribution 1 year after installation Valves - Line Valves 1 year Valves - Separation Valves 1 year
3
Q. How does PSE&G perform in addressing leaks in its current system? 4
A. PSE&G currently performs well with regard to addressing leaks in its system. When 5
compared to companies that operate over 1,000 miles of cast iron, PSE&G is the best in 6
terms of having the least number of main leaks per mile. (PHMSA report data: 2016 7
F7100.1-1). PSE&G responds to over 80,000 gas emergency calls on an annual basis at a 8
rate of 99.9% within one hour. This ranks within the top decile of peer companies. Since 9
2014, PSE&G has reduced methane emissions 2.9% annually or a total of 65,000 metric 10
tons of CO2 equivalent (calculated using EPA Greenhouse Gas Reporting Program: 11
Subpart W – Petroleum and Natural Gas Systems methodology). 12

- 43 -
Q. Please describe PSE&G’s current approach to gas distribution pipe 1 replacement. 2
A. The overall approach of PSE&G’s distribution replacement is to minimize risk to the 3
public and employees by effectively understanding the condition of the assets and their 4
rates of failure. This enables the Company to manage replacement of assets to avoid sudden 5
widespread failure within any asset class. Replacement of significant asset classes is as 6
follows: 7
• Elevated Pressure Cast Iron, Utilization Pressure Cast Iron, and Unprotected 8
Steel are replaced or rehabilitated at a rate consistent with managing the 9
leak/mile rate for each respective asset class to stay within the established upper 10
performance limit for each material; and 11
• Coated and Protected Steel Main is subjected to ongoing monitoring and 12
remedial action under the requirements of 49 CFR Part 192 Subpart I. There is 13
no significant leakage of PSE&G’s coated cathodically protected steel main 14
system relative to unprotected steel main, and to date there is no replacement 15
program for this asset class. 16
Similarly, there is no significant leakage of PSE&G’s plastic main system; therefore 17
there is no current replacement plan for this asset class. 18
Q. Please describe the work prioritization process you are proposing for GSMP II. 19
A. For elevated pressure cast iron, Utilization Pressure Cast Iron, and Unprotected 20
Steel, individual main segments are identified for replacement through a PSE&G 21
prioritization ranking methodology for main segments referred to as the Hazard Index. The 22
Hazard Index is based on a predictive model that integrates leak history with a variety of 23
- 44 -
characteristics referred to as “environmental conditions”, while also taking into account 1
asset information (e.g., pipe diameter and operating pressure). 2
Q. Has PSE&G been considering the prioritization of replacement work for some 3 time? 4
A. Yes. Over the years various internal studies have been conducted to determine if 5
specific approaches needed to be developed to target the replacement of PSE&G’s 6
riskiest gas assets. Specifically, programs were designed to replace the following assets: 7
• 8” and smaller - 15 psig and 60 psig cast iron mains; 8
• 10” and 12” - 60 psig cast iron mains; and 9
• 3” UP cast iron 10
PSE&G will replace unprotected steel services when any of the following conditions 11
are met: after they reach their point of failure by exhibiting a leak; if more than 20% of the 12
unprotected services in a defined area have ever leaked, then all of the services in the 13
defined area are replaced (as required by the New Jersey Administrative Code Section 14
14:7-1.20); in conjunction with the replacement main program; ahead of road reconstruction 15
projects; and other reasons determined by the PSE&G Asset Management Group. 16
Q. Please discuss the approaches that gas distribution operators utilize to manage 17 cast iron and unprotected steel pipe systems. 18
A. One method that gas distribution companies use to manage aging cast iron and 19
unprotected steel pipe is to repair leaks. While this is an effective short-term approach, it is 20
not a long-term solution that provides a proactive, systematic improvement, such as can be 21
achieved by replacing cast iron and unprotected steel pipe with modern pipe materials. 22
The preferred method of managing cast iron and unprotected steel pipe is to 23

- 45 -
replace these materials using a combination of three replacement approaches: targeted 1
replacement, work in conjunction with the replacement of other utilities, and program 2
replacement: 3
Targeted Replacement -The targeted or condition approach for identification and 4
retirement of cast iron and unprotected steel is based on an evaluation of several factors such 5
as: maintenance history, soil conditions, and risks inherent in the pipe segments’ 6
characteristics and locations. 7
Work in Conjunction with Replacement of Other Utilities - This approach entails the 8
removal or replacement of pipes in conjunction with other utility, government or 9
municipal agency work to accommodate work projects such as road improvements and 10
water infrastructure projects. It is beneficial to all parties involved if the removal and 11
replacement of pipes can be done in conjunction with other projects, especially to minimize 12
public inconvenience and to avoid the duplication of efforts and cost. 13
Program Replacement - In terms of planned replacement strategies, several gas distribution 14
operators have approached their state regulators and obtained funding approval to 15
systematically replace all of the cast-iron or unprotected steel and other higher risk materials 16
in their system on an accelerated basis. Program Replacement provides for a long-term, 17
proactive, systematic improvement of a company’s distribution network, continuous removal 18
of risk from unpredictable failure and the reduction of greenhouse gases. 19
Q. Even though PSE&G has managed the integrity of its distribution system over 20 the years, do you believe that there are challenges in the near future? 21
A. Yes. As discussed above, PSE&G’s distribution system contains a large inventory of 22

- 46 -
cast iron and unprotected steel that generates approximately 65% of the number of leaks on 1
an annual basis. Annual replacement of this inventory is one of the primary methods in the 2
leak management process to reduce risk and to control leak rates. However, an increase in 3
pipe deterioration rates may be of a magnitude that requires substantial, additional resources 4
and extended time to address. 5
Main Selection Methodology 6
Q. What method will be used to execute the Program? 7
A. For GSMP II, grid replacement would be the chosen method to replace UPCI mains 8
and convert the UP system to elevated pressure (the majority of the Program); and targeted 9
replacement would be used to replace the elevated pressure cast iron and unprotected steel 10
with plastic and cathodically protected steel (a much smaller part of the Program). This 11
will reduce the risks of CI/US pipe and take advantage of economic efficiencies to reduce 12
construction costs. This approach ensures that high-risk segments will continue to be 13
replaced, while gaining the efficiencies and benefits of larger zone replacements such as 14
economic opportunities in mobilization, material, and labor negotiations. 15
Q. How will the grids be selected to make up the main replacement program? 16
A. A grid ranking process has been developed based on the Company’s Hazard 17
Risk Index Model. The approach is similar to the hazard ranking method used in GSMP I. 18
PSE&G targets the replacement of its riskiest gas assets through the use of a ranking 19
methodology that prioritizes main segments with the highest risk, through the use of the 20
Hazard Index. The Hazard Index is based on a predictive model constructed from leak 21
history “environmental factors” that include: building setback, number of underground 22
- 47 -
utilities, demographic area (urban, suburban, rural), building types (industrial, commercial, or 1
residential), and asset information (pipe diameter, operating pressure). Through the 2
“weighted leak history” factor, past main breaks are considered and weighted based on how 3
recently they occurred. Each map grid is evaluated by adding the hazard indexes for the 4
individual utilization pressure segments within the grid and dividing them by the total 5
miles of utilization pressure cast iron in the grid, arriving at a hazard index per mile for 6
each map grid. Consistent with the hazard index per mile results, grids are ranked by 7
highest to lowest and then placed into A, B, C and D priority grids categories. 8
In GSMP I, PSE&G collaborated with the Environmental Defense Fund to conduct a 9
study on methane emissions in grids that were selected for the first 3 years of the program. 10
PSE&G’s valuable experience with this effort has resulted in a new sub-prioritization that 11
takes into account leak history on joints and services. This sub-prioritization will be used for 12
grids of similar hazard in the GSMP II extension. 13
Q. What does a typical grid look like and how will the replacement main and 14 service work proceed? 15
A. PSE&G’s gas distribution system is mapped into grids and each grid measures about 16
one square mile. There are more than 500 grids that contain between one and 21 miles of 17
cast iron pipe along with other types of pipe. Exhibit 1.15 was prepared to illustrate the types 18
of projects that might present themselves in a grid. This sample is meant to show what might 19
be encountered as projects are created within the grid. This particular grid sample contains: 20
• Utilization pressure cast iron and unprotected steel to be replaced; 21
• Utilization pressure cast iron to be abandoned; 22

- 48 -
• Utilization pressure plastic to be uprated; 1
• District regulators to be abandoned; and 2
• Breaks that have already occurred on cast-iron pipe are designated with an “X”. 3
Exhibit 1.15 4
Sample Projects within a Grid 5
6
7
In order to approach the work in this grid, a series of work activities need to be 8
undertaken. New plastic main is installed in locations where cast iron and unprotected steel 9
- 49 -
mains are identified for replacement. These new mains are pressure tested, connected to the 1
existing 15 psig system, and put into service. Service lines are replaced where identified as 2
unprotected steel, and all service lines get transferred over to the new mains. Once this is 3
complete, the existing mains can be abandoned. In locations where there are uprate 4
activities, existing service lines will be replaced if necessary and a service regulator will be 5
installed. A 15 psig main will be connected to the existing plastic main and pressure will be 6
elevated in stages until complete. Where a cast iron main is identified for straight 7
abandonment, the existing services will be replaced if necessary and transferred to the 8
existing pressure main. At the completion of the main and service work, the district 9
regulators can be abandoned. The execution concept is to completely replace the entire UP 10
CI/US pipe in a grid at one time. Employing this approach will help minimize disruption 11
and improve work efficiency. 12
Q. What technical and non-technical factors need to be considered in determining 13 the quantity and timing of replacement grids? 14
A. There are a number of technical and non-technical factors that need to be considered 15
in determining the quantity and timing of replacement grids, including: 16
• As projects are created based on grids designated as Priority A, situations could 17
develop where multiple Priority A grids are adjacent to each other. Where this 18
occurs the full block of grids will be reviewed to determine the most effective 19
approach for sizing and staging of the installation and abandonment work within 20
the entire area; 21

- 50 -
• Projects will be encountered where UP CI/US mains will not end at the grid line. 1
Consequently, it will be necessary to decide, as the strategy for working a grid is 2
developed, whether the crossover main should be worked with the current Priority 3
A grid or held over until the neighboring grid is worked. This decision would be 4
based on system reliability, effectiveness, and efficiency; 5
• While the majority of gas main replacement work will not lead to new business 6
connections, incidental requests may occur on occasion. When this occurs, 7
facilities will be designed in accordance with PSE&G’s Gas Design Manual and 8
facility costs will be treated consistent with PSE&G’s approved Gas Tariff. 9
• Any unforeseen permitting issues, issues regarding cooperation from 10
municipalities, and coordination with other construction activities will need to be 11
taken into consideration when executing the work. Similarly, unforeseen 12
construction issues (e.g., unanticipated buried utilities, physical obstructions) will 13
also need to be taken into consideration as the work is executed. 14
Changes from GSMP I 15
Q. Have you made any adjustments to your prioritization model based on your 16 GSMP I experience? 17
A. Yes. Additional consideration will be given to historical joint and service leak rates 18
not included in the hazard index. The top 10 Priority A grids will be ranked based strictly on 19
hazard value. The remaining Priority A grids are a similar hazard value and will be 20
prioritized by joint and service leak history. All subsequent grids within a priority level (B, 21
C, and D) will be ranked based on joint and leak history. In other words, all Priority B grids 22
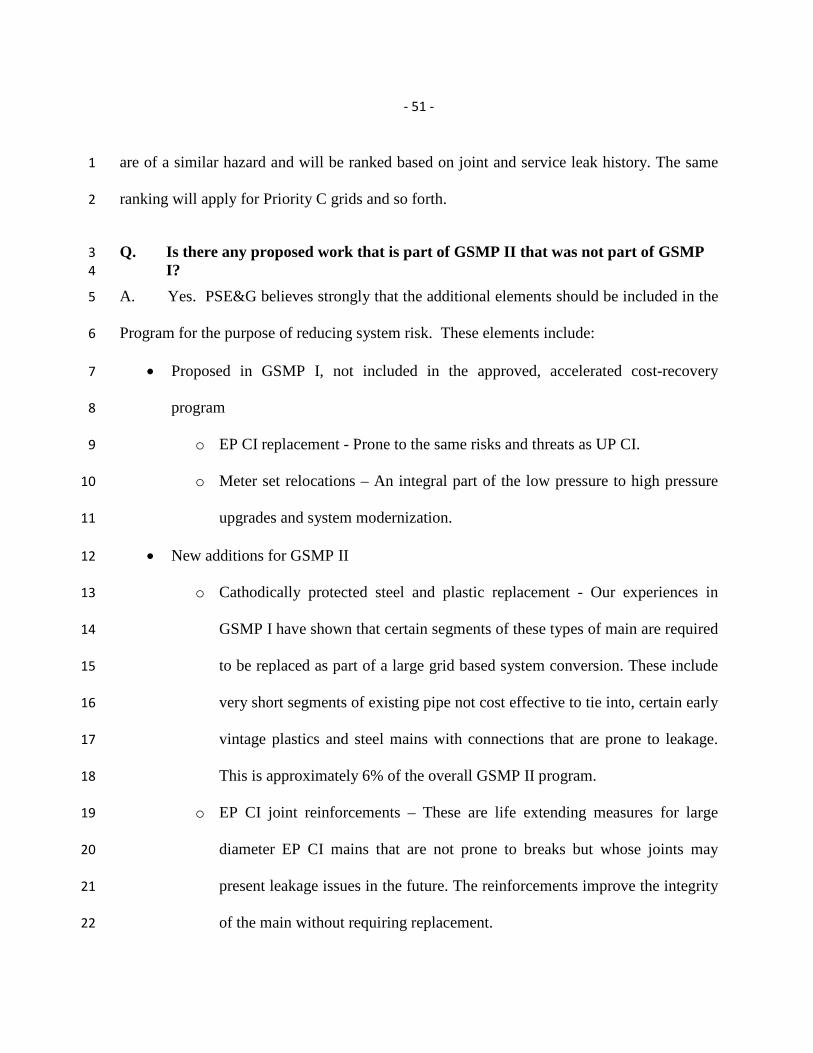
- 51 -
are of a similar hazard and will be ranked based on joint and service leak history. The same 1
ranking will apply for Priority C grids and so forth. 2
Q. Is there any proposed work that is part of GSMP II that was not part of GSMP 3 I? 4
A. Yes. PSE&G believes strongly that the additional elements should be included in the 5
Program for the purpose of reducing system risk. These elements include: 6
• Proposed in GSMP I, not included in the approved, accelerated cost-recovery 7
program 8
o EP CI replacement - Prone to the same risks and threats as UP CI. 9
o Meter set relocations – An integral part of the low pressure to high pressure 10
upgrades and system modernization. 11
• New additions for GSMP II 12
o Cathodically protected steel and plastic replacement - Our experiences in 13
GSMP I have shown that certain segments of these types of main are required 14
to be replaced as part of a large grid based system conversion. These include 15
very short segments of existing pipe not cost effective to tie into, certain early 16
vintage plastics and steel mains with connections that are prone to leakage. 17
This is approximately 6% of the overall GSMP II program. 18
o EP CI joint reinforcements – These are life extending measures for large 19
diameter EP CI mains that are not prone to breaks but whose joints may 20
present leakage issues in the future. The reinforcements improve the integrity 21
of the main without requiring replacement. 22

- 52 -
Duration – Proposal for 5 year program 1
Q. How was the basis for the proposed replacement period determined? 2
A. The initial three year GSMP program established the momentum for the overall long 3
term program. PSEG’s strategic vision to enhance efficiency and effectiveness of its 4
replacement program and to accelerate benefits led to the proposed program extension 5
duration. In addition, the duration helps to maintain the momentum of work in terms of 6
staffing levels, contractor resources, and municipality coordination. 7
Q. You suggested that the Company would like to implement a plan that involves 8 steady, long-term modernization that could last many years. Can you explain 9 then why the proposed Program is only for five years? 10
A. Given the age and make-up of the Company’s gas infrastructure, the continuation of 11
the program to modernize the gas distribution system would take approximately thirty years 12
at the current GSMP rate, and twenty (20) years, assuming a modernization plan consistent 13
with the Program being proposed in my testimony for GSMP II. However, rather than 14
proposing a long-term, 20-year plan, the Company is recommending this five-year GSMP 15
extension. Under the proposed Program, we estimate that the Company’s inventory of high 16
risk infrastructure will be decreased by approximately 37 percent. A five-year program will 17
enable the Board and Company to periodically review and evaluate the Program. Prior to 18
the expiration of the Program, the Company anticipates working with the Board to further 19
develop and refine a plan that would continue to appropriately address the modernization 20
needs based upon program experience to date, and technologies, techniques, and 21
circumstances at that time. In addition, the proposed period is consistent with the 22

- 53 -
infrastructure investment period proposed by the BPU in the regulations issued in May 2017. 1
Q. How would the Company proceed if the Program ended in five years; in other 2 words, without extending the Program for additional years? 3
A. If this Program is not extended beyond the initial five years proposed herein or is not 4
extended on a time-frame that would allow continuation of work, this Program would 5
involve an additional six months of a variety of work to close out the Program. Such work 6
would continue into the first six months of a sixth year, i.e., assuming a January 2019 start, 7
through June 30, 2024. If the Program is continued in a timely manner, we assume this 8
work would become part of the approved Program extension along with additional work, 9
rather than part of the Program proposed in this proceeding. 10
Cost 11
Q. Please provide a description of the estimated cost of the proposed Program. 12
A. PSE&G estimates the infrastructure investment for the Program to be approximately 13
$2.68 billion. The estimated amount is comprised of approximately $1.95 billion for the 14
replacement of mains, $555 million for the replacement of associated unprotected steel 15
services, $9 million for the abandonment of district regulators associated with the main 16
replacements, $101 million for inside meter set relocations, not including the cost of the 17
meters, and $69 million for EPCI Joint Reinforcements. These estimates are based on the 18
Company’s cost experience over the last three or more years, adjusted for inflation and 19
modified to account for the overall average pipe size. Please see Schedule WEM-GSMPII-4 20
for the proposed monthly cash flow for the Program. 21

- 54 -
The Company commits to maintaining base capital expenditures on projects similar to 1
those proposed within the Program. These capital expenditures are provided in Schedule 2
WEM-GSMPII-2 and are at least 10 percent of the overall Program capital expenditures. The 3
spending we are proposing through this Program is incremental to that base capital spending. 4
Q. Why is this an advantageous time economically to extend and accelerate 5 PSE&G’s gas system modernization efforts? 6
A. PSE&G has an important opportunity to extend this Program now. At this unique 7
time there is a plentiful supply of natural gas and commodity prices are low. Since January 8
2009, PSE&G has reduced the annual gas bill for the typical residential gas heat customer 9
by 51%, or $855, based on current rates as of July 10, 2017. In addition, this affords the 10
opportunity for additional job creation and economic stimulus, as well as more rapid 11
reduction of greenhouse gas emissions. As a result, now is the time to invest in this required 12
replacement program. 13
Q. What is the least cost approach? 14
A. The least cost option results from a combination of an effectively run system 15
modernization plan that is initiated and carried out without interruption and accumulates 16
incidental O&M savings as the CI and US pipe is replaced or rehabilitated. If the System 17
Modernization Plan is ramped-up and ramped-down after each program extension, those 18
delays can result in significant, and unnecessary, cost increases in the total system 19
modernization cost. These costs result from the following factors: 20
• Contractors are unable to plan into future with regards to labor and equipment and 21
will reflect this risk with a higher unit price bid; 22

- 55 -
• The Company will be required to recruit, hire and train new employees to 1
accommodate expanded workload, which will result in additional labor costs; 2
• The Company will be required to perform engineering, obtain permits, procure 3
materials, and execute contracts on an expedited basis that may result in 4
inefficiencies and reduced program management effectiveness; 5
• The ability to effectively and efficiently ramp-up may be delayed based on 6
reduced contractor labor and equipment availability due to other utility main and 7
service replacement programs, resulting in scheduling delays; 8
• Contractors are required to provide operator qualified and certified labor 9
resources and have to invest in these resources. Ramp-up and down situations 10
may result in the loss of these resources, resulting in a loss of experience; 11
• Contracts with shorter time horizons reduce the opportunities for overall cost 12
savings; 13
• Conflicts with municipal and other utilities due to scheduling and work 14
moratoriums, causing delays and overall increased costs; and 15
• Incurring higher overall costs to re-staff and train employees 16
Q. Is it correct that PSE&G is proposing a cost recovery mechanism for the 17 Program? 18
A. Yes. Mr. Swetz’s testimony explains the cost recovery mechanism proposed by the 19
Company. The cost recovery mechanism is an essential component of the Program. As 20
explained in Mr. Swetz’s testimony, the cost recovery mechanism facilitates the 21
Company’s investments in this important program by enabling the Company to raise 22
- 56 -
necessary capital in an efficient manner. 1
Q. How were PSE&G’s estimates of capital cost developed? 2
A. The estimates of capital cost were developed by the Company and include the 3
Company’s experience with stimulus-related programs recently completed such as CIP I and 4
CIP II, Energy Strong, and GSMP I. The Company believes that the proposed five year 5
program is within its execution capability, using internal and contract field operation 6
forces. The Company has been involved in these programs continuously since 2009 and 7
has proven its ability to complete the work in a timely fashion. 8
The foundation and summary of the Program is illustrated in Exhibit 1.13. These 9
unit costs were applied to the estimated quantities of main, services and other 10
replacements envisioned in the program. Certain classes of pipe were further disaggregated 11
to compute unit level cost differences. For example, EP CI/US (60 psig) was estimated 12
on the basis of 12”, 16” and 20”+ pipe size along with related services and associated 13
meter set relocates. UPCI was estimated based on a different distribution of pipe sizes for 14
main, associated services, district regulators to be abandoned, uprates, and meter set 15
relocates. Unprotected steel was estimated on the basis of mains, associated services and 16
meter set relocates. The unit costs per mile of main were then computed to include the costs 17
of the associated services, abandoned district regulators and relocated meter sets. These 18
unit costs for main replacement by class were applied to expected lengths of main 19
replacement per year for the program and escalated to 2018 dollars. The costs estimated for 20
the Program are summarized in Exhibit 1.16. 21
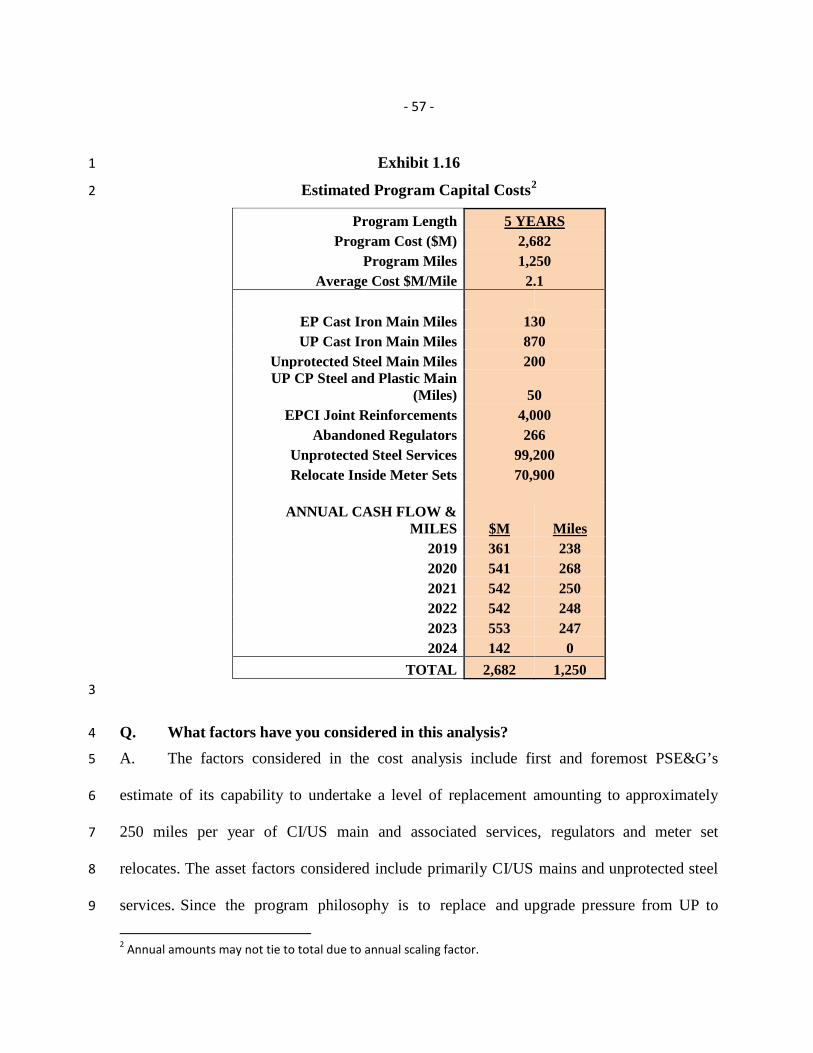
- 57 -
Exhibit 1.16 1
Estimated Program Capital Costs2 2
Program Length 5 YEARS Program Cost ($M) 2,682
Program Miles 1,250 Average Cost $M/Mile 2.1
EP Cast Iron Main Miles 130 UP Cast Iron Main Miles 870
Unprotected Steel Main Miles 200 UP CP Steel and Plastic Main
(Miles) 50 EPCI Joint Reinforcements 4,000
Abandoned Regulators 266 Unprotected Steel Services 99,200 Relocate Inside Meter Sets 70,900
ANNUAL CASH FLOW &
MILES $M Miles 2019 361 238 2020 541 268 2021 542 250 2022 542 248 2023 553 247 2024 142 0
TOTAL 2,682 1,250 3
Q. What factors have you considered in this analysis? 4
A. The factors considered in the cost analysis include first and foremost PSE&G’s 5
estimate of its capability to undertake a level of replacement amounting to approximately 6
250 miles per year of CI/US main and associated services, regulators and meter set 7
relocates. The asset factors considered include primarily CI/US mains and unprotected steel 8
services. Since the program philosophy is to replace and upgrade pressure from UP to 9
2 Annual amounts may not tie to total due to annual scaling factor.
- 58 -
EP, a corresponding number of district regulator assets will no longer be needed and will 1
be abandoned. Finally, inside meter sets will be relocated outside where possible. 2
The cost model is based on a continuous program. The model assumes that 20% of 3
the cash flow each year will spill over into the following year, including the year following 4
the fifth year. The model assumes that a subsequent program will be approved prior to the 5
conclusion of the five year period to permit continuous work efforts to eliminate the 6
maximum amount of CI/US main and US services. 7
Capital cost estimates are PSE&G system-wide and are not based on specifically 8
identified physical assets. The five year program identifies the major capital elements that are 9
part of the Program and develops unit and extended cost information based on the recent 10
experience noted earlier. The estimates are developed in 2018 dollars and the program costs 11
are escalated using an average escalation rate of 2.5%. This escalation factor was developed 12
based on a mix of economic and engineering estimating factors. Capital cost estimates that 13
were developed for recent major programs, including CIP I and CIP II, ES, and GSMP I 14
indicate that PSE&G has developed supportable estimates that reasonably reflect expected 15
program costs. 16
Q. Are these capital costs to be considered a final construction cost? 17
A. No, although we consider the estimate to be typical for purposes of budget, 18
authorization or control. The development of the five year G S M P I I Program has 19
advanced from the conceptual to the feasibility state. PSE&G developed its estimate for 20
each component project cost using a mix of fixed values, such as cost per mile of main 21
replaced, and statistical estimating methods, such as leak rates. Currently, the Program 22

- 59 -
cost is based on gross units of work and unit cost representative of general construction 1
throughout PSE&G’s service area. As previously noted, the Program cost is based on unit-2
cost averages for similar work recently completed in Energy Strong. The estimate is 3
reasonable for this stage of Program development based on PSE&G prior construction cost 4
experience. Exhibit 1.17 below shows the cost per foot and cost per service comparison 5
between GSMP I and II. 6
Exhibit 1.17 7
Cost Per Unit Comparison 8
(2016-2018) (2019-2023) (2017-2021)
GSMP I GSMP II 4-Yr
CAGR* CAGR Explanation
$/Foot (Main) Normalized $ 257 $ 270 1.2% GSMP II work normalized to GSMP I work
$ 30
Increase to total $/foot due to elevated pressure component of GSMP II
$/Foot (Main) Effective $ 257 $ 300 3.9% GSMP II Elevated Pressure Component 10% of total footage) vs. 0% in GSMP I
$/Service Replaced $ 5,100 $ 5,634 2.5% Inflation
*Compound Annual Growth Rate
Q. How will the continuation of a multi-year modernization program affect the 9 deployment of capital? 10
A. The adoption of a multi-year modernization program will allow PSE&G to address 11
larger segments of pipe replacement within individual construction projects, leading to 12
lower average replacement costs per mile as fixed aspects of the planning, engineering, and 13
construction mobilization efforts and tie-ins are spread over a larger project. Additionally, 14
the program will reduce, over time, the occurrence of emergency replacements that have 15
- 60 -
substantially higher costs than planned replacements. Emergent work of this nature can cost 1
50% or greater when compared to planned, systematic modernization that includes elevating 2
pressure and excess flow valve installations. In addition to the replacement activity, costs 3
associated with leak investigation and monitoring also increase the overall costs associated 4
with resolving emergent replacement projects. 5
Ability to Do the Work 6
Experience with Programs 7
Q. Has the Company made investments to upgrade and modernize its system? 8
A. Yes. Over the past 46 years, PSE&G has replaced approximately 41% of its of cast 9
iron and unprotected steel mains and approximately 63% of its unprotected steel 10
services. This is over 3,300 miles of main replacement and 285,000 service replacements. 11
Q. Could you briefly discuss the Company’s experience with implementing 12 infrastructure replacement programs of a size similar to the proposed GSMP? 13
A. The Company has completed extensive amounts of facilities replacement of nearly 14
250 miles through Capital Infrastructure Investment Programs I and II (CIP I and CIP II) from 15
2009 through 2012. Also, the Company has replaced 240 miles of cast iron mains under the 16
Energy Strong Program in the 2014-2016 timeframe. Finally, PSE&G is currently replacing 17
275 miles of cast iron mains and 85 miles of unprotected steel mains under GSMP I and at 18
least 110 miles associated with base investment committed to under the GSMP settlement. 19
In preparation for planning under the gas main replacement component of GSMP 20
I, the Company increased its resources in engineering to appropriately identify and model 21

- 61 -
areas and facilities selected for replacement. This process strengthened the link between the 1
Engineering group and Field Planning group, which is responsible for finalizing the plans for 2
each construction project. Our Engineering and Field Planning groups have been and 3
currently are working together to sequence our GSMP I related installations, uprates and 4
abandonments to ensure continued system reliability through the entire construction process, 5
as well as evaluate the best technology for constructing each project. While this is a 6
substantial undertaking, it is an essential part of successfully implementing a large-scale 7
replacement project and the Company continues to successfully execute the GSMP I 8
Program. 9
Additionally, GSMP I clearly demonstrates the Company’s ability to construct 10
facilities at an increased rate. To address the increase in replacement facilities associated 11
with GSMP I, the PSE&G Gas Construction group hired additional internal resources and 12
also engaged additional New Jersey contractors. To address the high levels of work in our 13
Northern area, we have shifted employees to the area of work through remote reporting and 14
cascading of crews and technicians between districts. Our contractors have also met the 15
challenge in stride by hiring and qualifying their people. They also produced the necessary 16
equipment and expertise to support GSMP I. The Company is well positioned to leverage 17
its GSMP I related efforts and experienced staffing, training and qualifying resources to 18
implement this proposed Program. 19
For 2016, results indicate that 209 miles were replaced under PSE&G’s infrastructure 20
programs including base spending, GSMP I, and Energy Strong. For 2017, the Company 21
forecasts the completion of 240 miles of gas main replacement. With these previous levels in 22
- 62 -
mind, scaling to approximately 250 miles/year in the Program, plus associated gas main work 1
in PSE&G’s base capital program, while maintaining safety, customer satisfaction, and cost 2
effectiveness, is manageable. 3
Details on Workforce 4
Q. Please elaborate on the labor and other resources required to successfully 5 complete this program. 6
A. The Company will need to maintain staffing for engineering, construction, 7
construction management, and records management in order to continue the level of gas 8
infrastructure upgrade and replacement proposed. The amount of staffing required will be 9
based on the approved levels of work in the program. PSE&G anticipates continuing to 10
utilize contractors for a majority of the planned replacement work under the Program. These 11
independent contractors will need to maintain staff and equipment to complete the work to 12
the extent that was needed in GSMP I. Material manufacturers and their suppliers will also 13
need to maintain or increase production to support continuation of the Program. 14
Using the methodology from the Board’s IIP proposal for job creation in New Jersey, 15
the proposed program would create almost 3,000 full time jobs per year for the duration of the 16
program. This is an increase of approximately 1,200 full time jobs per year over GSMP I. 17
Q. Can you give us an indication of your capacity to replace aging infrastructure? 18
A. The following exhibit provides a summary of replacement levels for the past several 19
years for various programs along with base replacement: 20
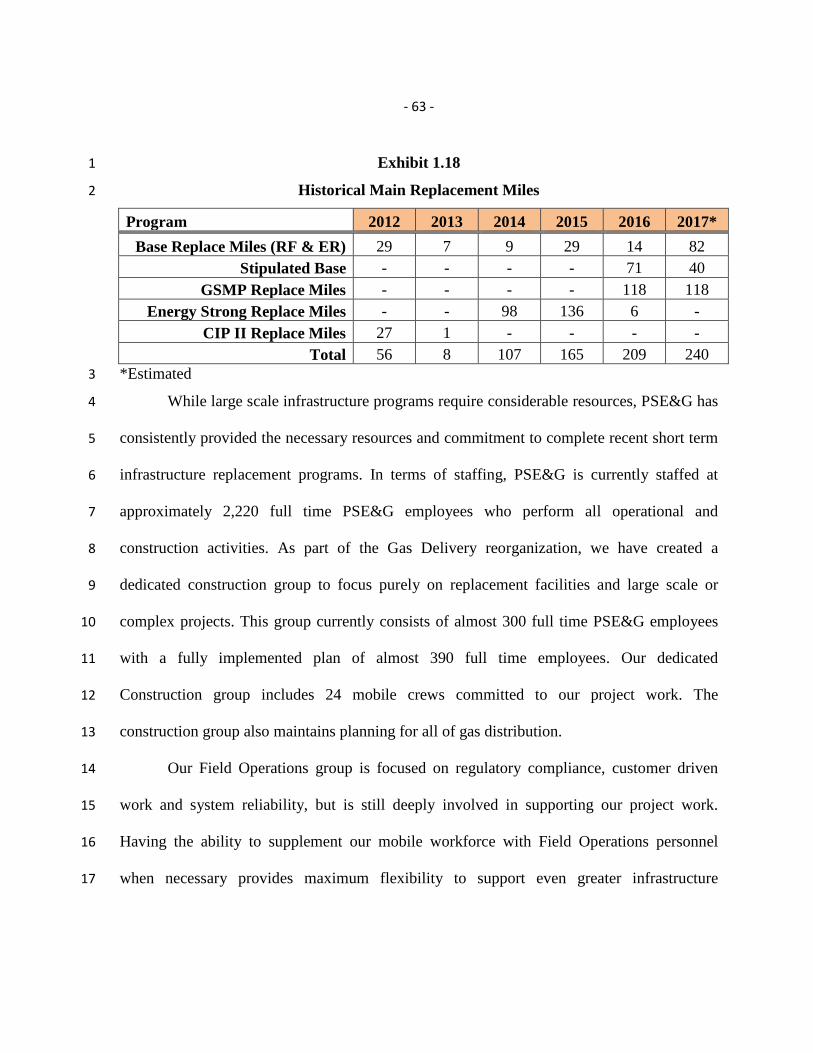
- 63 -
Exhibit 1.18 1
Historical Main Replacement Miles 2
Program 2012 2013 2014 2015 2016 2017* Base Replace Miles (RF & ER) 29 7 9 29 14 82
Stipulated Base - - - - 71 40 GSMP Replace Miles - - - - 118 118
Energy Strong Replace Miles - - 98 136 6 - CIP II Replace Miles 27 1 - - - -
Total 56 8 107 165 209 240 *Estimated 3
While large scale infrastructure programs require considerable resources, PSE&G has 4
consistently provided the necessary resources and commitment to complete recent short term 5
infrastructure replacement programs. In terms of staffing, PSE&G is currently staffed at 6
approximately 2,220 full time PSE&G employees who perform all operational and 7
construction activities. As part of the Gas Delivery reorganization, we have created a 8
dedicated construction group to focus purely on replacement facilities and large scale or 9
complex projects. This group currently consists of almost 300 full time PSE&G employees 10
with a fully implemented plan of almost 390 full time employees. Our dedicated 11
Construction group includes 24 mobile crews committed to our project work. The 12
construction group also maintains planning for all of gas distribution. 13
Our Field Operations group is focused on regulatory compliance, customer driven 14
work and system reliability, but is still deeply involved in supporting our project work. 15
Having the ability to supplement our mobile workforce with Field Operations personnel 16
when necessary provides maximum flexibility to support even greater infrastructure 17

- 64 -
replacement programs. PSE&G plans to keep this flexibility in place through the term of any 1
program to address aging facilities. 2
In addition to our dedicated construction work force and our Field Operations work 3
force, PSE&G Gas Delivery engages outside contractors to assist in our replacement 4
facilities programs in a number of different focus areas. Contractors perform a large portion 5
of our main installation and service replacements with direct PSE&G oversight. We have 6
also increased our use of engineering contractors and consultants to assist with permitting 7
(environmental pre-planning, planning and oversight services) and process management. 8
PSE&G also uses subcontractors to complete the bulk of street, sidewalk and lawn 9
restoration including all of the milling and paving associated with our program work. 10
Q. What is the impact of multi-year program planning and approval on outside 11 contractors? 12
A. The implementation of a multi-year program is important because it allows 13
contractors to make commitments to invest in additional employees and equipment with 14
greater certainty than a program of short duration. Approval of the Company’s five-year 15
proposed Program will allow PSE&G to make a longer commitment to contractor 16
services, enabling contractors to spread the fixed costs of the additional staff and 17
equipment over a longer period, translating into lower costs for PSE&G. 18

- 65 -
Communicating with Customers 1
Q. Can you comment on the communication programs that you have implemented 2 to make customers and public officials aware of GSMP I, which will assist the 3 Company in implementing GSMP II? 4
A. We are using many of our existing processes including face-to-face meetings with 5
municipalities, newspaper ads, and preconstruction/construction signage. The Company 6
also implemented several new processes including, multi-lingual door hangers explaining 7
upcoming work, dedicated GSMP public phone lines, social media communication, and a 8
dedicated GSMP web site that shows where work is planned and its progress throughout 9
construction. 10
The Company has seen the need to expand the use of social media. Customers can 11
visit PSE&G at pseg.com or on Facebook, Twitter, LinkedIn and our blog at PSEG blog 12
Energize, and we proactively send out Facebook messages by zip code where our work is 13
scheduled. With the links to our website and other media, we have developed multiple 14
avenues for customers to “find” PSE&G and understand our work along with our 15
commitment to keeping them informed. 16
PSE&G recently created a video that is available on the Company website to help our 17
customers understand our infrastructure replacement program. The video highlights the 18
program details, the work process, and the ultimate benefits. 19
PSE&G is using radio to promote our programs and provide important information 20
about the necessary work. We also use the Varolii outbound phone call system. Where 21
customers have provided a phone number, we will send outbound calls with a specific 22
message related to projects impacting those specific customers. We have also set up 23

- 66 -
dedicated phone lines to receive customer inquiries concerning our construction work. While 1
other forms of media are growing in use, many of our customers seem more comfortable 2
leaving a message and getting a call back from a PSE&G representative familiar with our 3
work. 4
On the more traditional side, we continue to notify our customers through a 5
preconstruction letter campaign and during construction through the use of door hangers. Our 6
letters are published in multiple languages to assure that our message is received by as many 7
customers as possible. Our door hangers also provide a wealth of information about the 8
construction and restoration process. 9
Where appropriate, we have increased the use of signage on our construction sites. 10
Signs are used prior to starting work and during construction where deemed useful and 11
helpful. The Company has furnished our employees with comprehensive program 12
information and trained our employees on positive customer interaction. 13
Program Benefits and Savings 14
Q. What are the benefits associated with this Program? 15
A. There are a number of well-known benefits associated with the proposed GSMP 16
II: 17
• Improved long term safety and reliability of the system; 18
• Outside access to service shut-off valves at meter sets; 19
• Greater application of service line excess flow valves; 20

- 67 -
• Reduced greenhouse gas emissions; and Increased ability to use higher-efficiency 1
and other appliances. 2
As an integral part of a conversion from utilization pressure to elevated pressure, 3
PSE&G would, where possible, relocate meters from inside to the outside of buildings. The 4
five year Program involves relocation of approximately 70,000 meters. There are 5
approximately 1,000,000 inside meters in PSE&G’s distribution system. Moving meters to 6
the outside of buildings facilitates easy access for shut off in the event of an emergency, 7
potential reduction of gas leaks within buildings, improved access for safety inspections and 8
meter reading, and reduction of potential theft of gas due to visibility of the meter location. 9
Details of the qualitative and quantitative benefits of the Program are described below. 10
Benefits of Modernized System 11
Q. Please summarize some of the benefits that will be realized from the installation 12 of newer materials for mains and services. 13
A. In addition to enhanced public safety and the benefits I discussed above, the 14
Program will reduce the Company’s leak management costs. The Program will also result 15
in the reduction of high cost emergency replacements and repairs as a greater amount of 16
cast iron and unprotected steel pipe is replaced. An additional benefit is the reduction of 17
methane emissions. Additional considerations that will enhance safety include 18
• Improved Records: for new facilities the Program will provide updated main and 19
service records. Utilizing more precise, as-built drawings will result in more 20
accurate mark-outs, and reduced third-party damage. More modern construction 21
standards will ensure: 22

- 68 -
• Tracer Wire: for new installations of PE pipe, which will also facilitate locating 1
the pipe for mark-outs and work; and 2
• Warning Tape: is installed above new facilities; warns an excavator there is a 3
buried pipe below. 4
Proper Bedding: using current backfill techniques and materials will improve the 5
conditions of the pipe environment and reducing chance of future issues 6
Elimination of Service Stubs: Another safety improvement associated with the 7
replacement program is the opportunity to eliminate hard-to-locate service stubs and thus 8
reducing the potential of leakage or damage from future construction activity. 9
Q. Are there any benefits inherent in a utilization pressure gas distribution 10 system such as the one that would be replaced under the proposed program? 11
A. The utilization pressure system is a legacy system from the period when gas was 12
manufactured from coal. When natural gas became available, the existing system was 13
converted to a utilization pressure natural gas distribution system. No new US gas 14
distribution provider would consider constructing a utilization pressure distribution system 15
today. In my opinion, a utilization pressure system is in some sense obsolete and provides 16
no compelling benefits. 17
Q. Are there benefits inherent in an elevated pressure gas distribution system such 18 as the one that would be installed under the proposed program? How do those 19 benefits compare to the existing cast iron and unprotected utilization pressure 20 system? 21
A. An elevated pressure natural gas distribution system has many benefits. A large 22
portion of an elevated pressure system can be constructed from PE pipe. Further, it is less 23
costly to construct because natural gas is compressible and the higher operating pressure 24
- 69 -
allows a smaller diameter replacement pipe to be installed, as opposed to utilization 1
pressure, which requires the same size for the new pipe. This is particularly valuable for 2
service line insertion. This feature allows for less costly construction techniques such as 3
pipe insertion using the existing pipe as a conduit. From an operating and maintenance 4
perspective, the proposed elevated pressure system would have fewer joint leaks because of 5
the installation techniques available for modern materials. Additional considerations 6
underlying the GSMP II Program that will enhance safety include: 7
Excess Flow Valves - Replacing the low-pressure system through GSMP II will 8
enable PSE&G to install excess flow valves on residential, multi residential, and small 9
commercial customer service lines. An excess flow valve is a device installed on the service 10
line at the point where the service line is connected to the main. In the event that the service 11
is cut, the sudden pressure drop and increased flow rate cause the device to be activated, 12
slowing down the escape of gas. Excess flow valves cannot be installed on low-pressure 13
systems because the pressure difference between the pressure in the gas main and 14
atmospheric pressure is insufficient for the devices to function. PSE&G installs EFVs, 15
where operationally permissible, on new services, and when older services are replaced. To 16
date, PSE&G has installed EFVs on over 65,000 services. 17
District Regulators - The elimination of the CI/US low-pressure system will enable 18
PSE&G to simplify its operating and maintenance plan. For example, the need for low 19
pressure district pressure regulators will be significantly reduced. 20
Outage Restoration - Eliminating the CI/US low-pressure system will reduce the 21
number of customers impacted by, and the duration of, unplanned gas outages. Outages 22
- 70 -
caused by water infiltration will be virtually eliminated. The use of polyethylene (PE) main 1
will enable PSE&G crews to isolate gas leaks quickly for repair by either closing an 2
existing valve or squeezing the pipe off upstream and downstream of the leak. An elevated 3
pressure system also generates fewer calls from customers with appliance problems caused 4
by insufficient gas pressure. 5
High Efficiency Appliances – The elevated pressure systems will allow for the 6
expanded use of high efficiency appliances that require inlet pressures higher than the UP 7
system can provide. The increased ability to use these appliances will improve customer 8
satisfaction, reduce customer’s energy bills, and reduce GHG emissions through improved 9
efficiency. 10
Benefits to Customers 11
Q. How will the new infrastructure system synergies and efficiencies translate into 12 benefits for the customers? 13
A. Benefits to the customer of the elevated pressure system would include incidental 14
services made possible by the elevated pressure system’s ability to accommodate 15
technologies and appliances not available to be served by the current low-pressure system, 16
including access to many high-efficiency appliances. The lack of an elevated pressure system 17
would cause customers in New Jersey to forego consumer options or require more expensive 18
special orders. In addition, an elevated pressure system will allow customers to install higher 19
efficiency appliances. The following higher efficiency appliances require inlet pressures that 20
in many cases would require either a customer-installed pressure booster or PSE&G’s 21
provision of an elevated pressure system: 22

- 71 -
• Tankless water heaters; 1
• Fan assisted heaters; 2
• Natural gas whole-house generators; and 3
• Commercial-grade cooking appliances. 4
The benefits for commercial applications would also increase. Current 5
commercial kitchen equipment requires a minimum of approximately 6 inches of water 6
column as do current rooftop heating systems, which are standard for commercial use. 7
Therefore, in many areas customers must install electric-driven gas boosters to raise the gas 8
pressure, and back-up power supplies for the pressure boosters as a safeguard against 9
electrical power outages. There would be additional savings for customers who have backup 10
generators but would no longer need the booster systems. 11
The State of New Jersey Administrative Code (NJAC 8:43G-24.13(l)) 12
requires critical facilities such as hospitals to have alternate emergency power supply 13
such as a backup generator. While the State practice is not to specify the fuel to be used, 14
natural gas-fired generator equipment requires elevated-pressure or additional booster and 15
back-up expenses if connected to the utilization pressure system. 16
In addition to the system safety advantages of replacing the low-pressure system 17
described above, there are other benefits related to natural gas-fired generators. Because 18
natural gas-powered back-up generators require elevated-pressure, the alternative is the less 19
environmentally-friendly gasoline- or diesel-powered versions. The use of gasoline- or 20
diesel-powered emergency generators is less safe than a permanently connected natural gas-21
fueled generator, primarily due to the risks involved in gasoline or diesel fuel storage and 22

- 72 -
transfer, especially in residential applications. Natural gas generators are also more reliable in 1
the case of a gasoline or diesel shortage, as was experienced during Superstorm Sandy. 2
Environmental Benefits 3
Q. Will the upgraded system provide any environmental benefits? 4
A. Yes. There is potential for a significant reduction in greenhouse gas emissions 5
(GHG). We estimated the GHG reduction based on the Title 40 CFR 98 – Mandatory 6
Greenhouse Gas Reporting, Subpart W – Petroleum and Natural Gas System. Our 7
estimate considered the following sources of methane emissions for the gas distribution 8
system using the default emission factors from the Code of Federal Regulations. 9
• Below Ground M&R Stations (operating pressure < 100 psia); 10
• Gas Distribution Mains – Unprotected Steel, Protected Steel, Plastic and Cast 11
Iron; and 12
• Gas Service Lines – Unprotected Steel, Protected Steel, Plastic, and Copper. 13
The emission reduction was estimated using a baseline scenario in which the five 14
year GSMP II Program begins immediately after January 1, 2019. Emission reductions were 15
credited in the year following completion of the work. For the continued five year 16
Program, the emission reduction would amount to approximately 199,000 metric tons of 17
CO2 equivalent emissions. Another way of looking at this reduction is to consider that the 18
average vehicle over a year of driving has tailpipe CO2 emissions of about 4.7 metric tons; 19
removing 199,000 metric tons of CO2 equivalent emissions, would represent removing 20
approximately 42,000 vehicles from the roads for one year. 21
- 73 -
In 2017, PSE&G reported greenhouse gas emissions amounting to 699,487 metric 1
tons of CO2 equivalent. The annual cumulative reduction of methane emissions, at 2
completion of all CI and US replacement/rehabilitation, is approximately 599,000 metric 3
tons of CO2 equivalent emissions. This represents a reduction of nearly 86% of the 2017 4
reported emissions and is equivalent to removing approximately 127,000 vehicles from the 5
road every year. 6
Cost Efficiency 7
Q. What are the quantitative benefits associated with the Program that are 8 applied to the entire PSE&G system? 9
A. There are quantitative benefits from this approach to modernization, which we have 10
estimated based on the assumptions in our analysis and estimates of certain key parameters. 11
For example, the O&M costs associated with CI/US is significantly higher than the O&M 12
costs associated with the replacement materials. This benefit is described as “avoided O&M 13
costs.” 14
Unprotected Steel services normally would not be repaired but would be replaced at 15
a higher unit cost than the anticipated cost under a planned program. For example, PSE&G 16
calculates that over the last s ever a l years, the cost of replacement due to individual 17
leakage is approximately $2,000 more compared to the cost of service replacement as part 18
of a planned program. The calculated individual leakage replacement cost is viewed as an 19
“avoided capital cost” and represents a benefit under the modernization plan applied to the 20
entire PSE&G system. Other “avoided capital costs” include the cost of CI bell joint 21
encapsulations due to individual joint leakage. 22
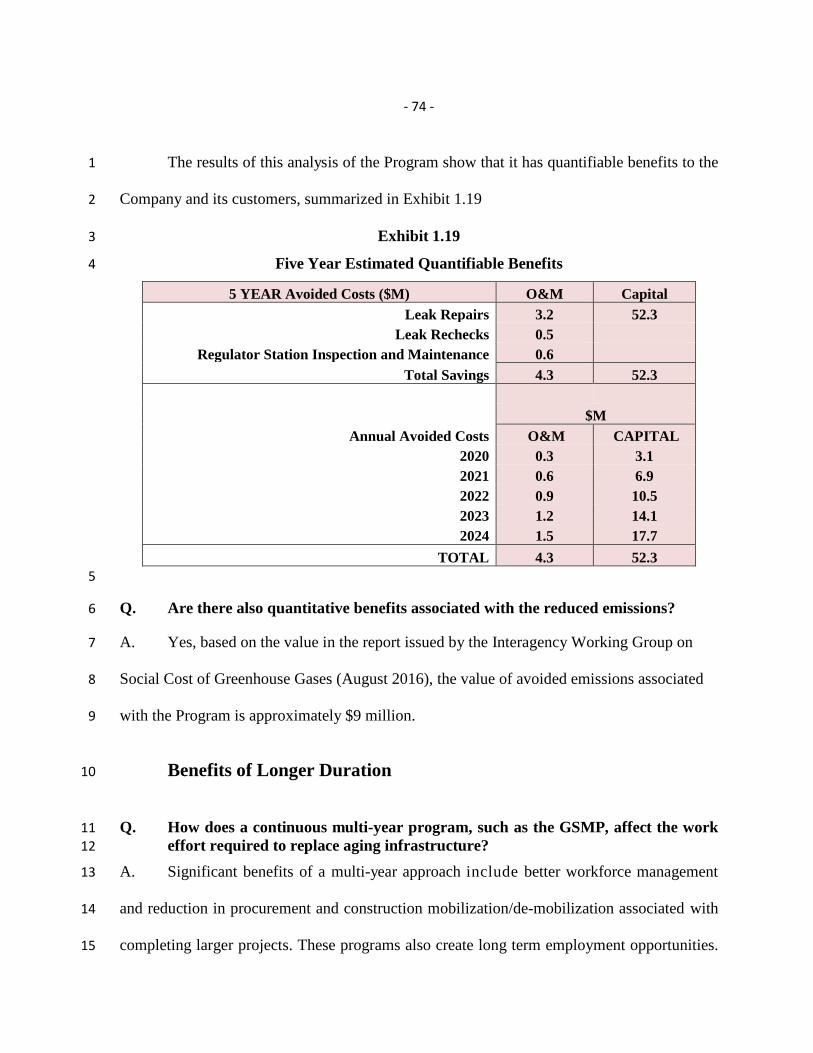
- 74 -
The results of this analysis of the Program show that it has quantifiable benefits to the 1
Company and its customers, summarized in Exhibit 1.19 2
Exhibit 1.19 3
Five Year Estimated Quantifiable Benefits 4
5 YEAR Avoided Costs ($M) O&M Capital Leak Repairs 3.2 52.3
Leak Rechecks 0.5 Regulator Station Inspection and Maintenance 0.6
Total Savings 4.3 52.3
$M Annual Avoided Costs O&M CAPITAL
2020 0.3 3.1 2021 0.6 6.9 2022 0.9 10.5 2023 1.2 14.1 2024 1.5 17.7
TOTAL 4.3 52.3 5
Q. Are there also quantitative benefits associated with the reduced emissions? 6
A. Yes, based on the value in the report issued by the Interagency Working Group on 7
Social Cost of Greenhouse Gases (August 2016), the value of avoided emissions associated 8
with the Program is approximately $9 million. 9
Benefits of Longer Duration 10
Q. How does a continuous multi-year program, such as the GSMP, affect the work 11 effort required to replace aging infrastructure? 12
A. Significant benefits of a multi-year approach include better workforce management 13
and reduction in procurement and construction mobilization/de-mobilization associated with 14
completing larger projects. These programs also create long term employment opportunities. 15
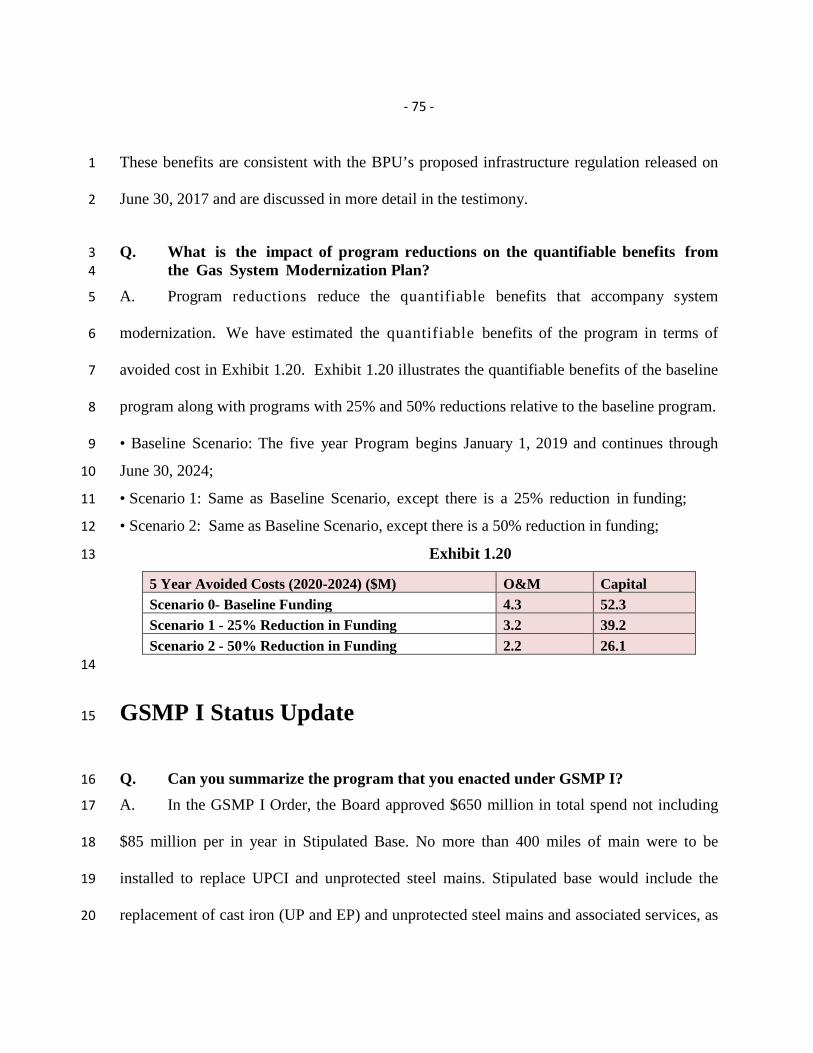
- 75 -
These benefits are consistent with the BPU’s proposed infrastructure regulation released on 1
June 30, 2017 and are discussed in more detail in the testimony. 2
Q. What is the impact of program reductions on the quantifiable benefits from 3 the Gas System Modernization Plan? 4
A. Program reductions reduce the quantifiable benefits that accompany system 5
modernization. We have estimated the quantifiable benefits of the program in terms of 6
avoided cost in Exhibit 1.20. Exhibit 1.20 illustrates the quantifiable benefits of the baseline 7
program along with programs with 25% and 50% reductions relative to the baseline program. 8
• Baseline Scenario: The five year Program begins January 1, 2019 and continues through 9
June 30, 2024; 10
• Scenario 1: Same as Baseline Scenario, except there is a 25% reduction in funding; 11
• Scenario 2: Same as Baseline Scenario, except there is a 50% reduction in funding; 12
Exhibit 1.20 13
5 Year Avoided Costs (2020-2024) ($M) O&M Capital Scenario 0- Baseline Funding 4.3 52.3 Scenario 1 - 25% Reduction in Funding 3.2 39.2 Scenario 2 - 50% Reduction in Funding 2.2 26.1
14
GSMP I Status Update 15
Q. Can you summarize the program that you enacted under GSMP I? 16
A. In the GSMP I Order, the Board approved $650 million in total spend not including 17
$85 million per in year in Stipulated Base. No more than 400 miles of main were to be 18
installed to replace UPCI and unprotected steel mains. Stipulated base would include the 19
replacement of cast iron (UP and EP) and unprotected steel mains and associated services, as 20

- 76 -
well as the costs required to uprate the UPCI systems if applicable (including the uprating of 1
associated protected steel and plastic mains and services) to higher pressures and the 2
elimination, where applicable, of district regulators, the installation of excess flow valves 3
associated with the Stipulated Base, and the additional costs associated with the relocation of 4
inside meter sets that is associated with the Stipulated Base as well as the Program main 5
replacements. During the three years 2016 – 2018, the Company would install no less than 6
110 miles of main to replace cast iron and unprotected steel mains and associated services 7
under this Stipulated Base. 8
Q. Please comment on the work that has been completed to date on GSMP I. 9
A. As of June 2017 YTD, the Company has replaced approximately 157 miles of main 10
and replaced approximately 11,820 services, or an average of 75 services per mile of main 11
replaced. The Company has also abandoned 16 district regulators associated with the 12
replacement areas. Cost to date is approximately $266 million, or approximately $1.7 million 13
per mile. Average pipe size installed is 3.4”. Please see Schedule WEM-GSMPII-5 for the 14
GSMP quarterly report as of June 30, 2017. The June 2017 quarterly report provides actual 15
results through June 2017 and a forecast for the remainder of the second year of the program. 16
Q. How do the hazard results from GSMP I compare to GSMP II? 17
A. Exhibit 1.21 below is a graph that shows the grid hazard prioritization for the 18
proposed GSMP II. The lighter shaded areas in the graph represent the grid hazard 19
prioritization prior to the start of GSMP I. 20

- 77 -
Exhibit 1.21 1
Hazard Index/Mile Comparison between 2014 and 2016 Hazard Results 2
3
As shown in the graph above, Priority A hazard will be reduced by 2/3 upon 4
completion of GSMP I and combination of Priority A and B will be reduced by over ½ upon 5
completion of GSMP I. GSMP II will be focused on remaining Priority A and B. 6
GSMP I Lessons Learned 7
Q. What have you learned from Energy Strong and GSMP I about customer 8 satisfaction? 9
A. JD Power (JDP) Residential and Business survey results have shown that overall 10
customer satisfaction has been positive throughout GSMP I through the application of strong 11
processes and tools previously discussed in the testimony. We use the JDP survey results to 12
- 78 -
understand our general customer perception. While JDP surveys customers who may or may 1
not have had a recent interaction with PSE&G, the results are very helpful to understand 2
overall customer expectations. We continue to proactively address potential customer 3
concerns that are impacted by construction and that can improve our overall perception. In 4
2016 JD Power Overall Customer Satisfaction Index showed an increase to 705 vs 668 in 5
2015. 6
Q. What have you learned from Energy Strong and GSMP I about working with 7 municipalities? 8
A. The Company’s experience with Energy Strong and GSMP I has shown that proper 9
communication with municipalities and the individual communities within those 10
municipalities is critical to the efficient execution of the program. While many of our 11
initiatives overlap between municipal governance, community and individual customer 12
impact, pre-planned municipal meetings are designed to give officials an advanced 13
understanding of our projects and an opportunity to address potential constituent concerns 14
prior to project approval and construction. At these meetings, we discuss our intentions 15
concerning customer and resident outreach, preliminary schedules, restoration, and plans to 16
minimize overall impact to the community. This includes potential traffic issues and detours, 17
work times around schools and public buildings, and any impact to local businesses. We 18
provide a standardized outreach package that includes all the communication materials to be 19
distributed to the customers. We also discuss the benefits of the facility upgrades. The initial 20
meeting is followed up by a pre-construction meeting that takes place prior to construction 21
and serves to finalize details of the construction schedule, traffic concerns, and customer 22

- 79 -
communication plan. Municipal outreach meetings are held where project impacts to a 1
community are moderate to significant and where we see a need for additional outreach. 2
Q. What have you learned from GSMP I on construction? 3
A. The Company has implemented a project management organization within our Gas 4
Construction Organization to address the project components not covered in our work 5
management system or current construction practices. We have also enlisted the use of 6
project management software to assist with scheduling and forecasting. We have 7
additionally added support to that group for project controls and we have expanded our 8
Layout and Planning group to support more proficient project management. 9
On the topic of permitting, there are additional lessons learned. Based on experience 10
from Energy Strong, Gas Delivery made many improvements obtaining soil sediment erosion 11
control plans and retaining licensed soil remediation professionals for linear construction 12
projects. For GSMP, we continued the blanket type permitting with the Soil Conservation 13
Districts (SCDs), but further consolidated work into projects for submission, thus reducing 14
the amount of paperwork and time to submit. We also took the project submission approach 15
to linear construction projects, greatly reducing lead times and paperwork to manage 16
compliance with the regulations. 17
On the subject of moving insider meter sets to outside, there are additional lessons 18
learned. The success rate of moving meter sets to the outside is significantly lower than 19
anticipated at the outset of GSMP I. The lower success rate was due to customer’s resistance 20
to moving the meter outside, primarily for aesthetic reasons. The Company implemented 21
specific policies for conditions where leaving the meter inside is acceptable. These 22
- 80 -
exceptions include limited suitable space to accommodate piping and required protection 1
measures, insufficient clearance of the equipment with regard to safety considerations, or 2
local requirements such as historic districts. The policy specifies that customers may object 3
to moving the meter inside, however, if in the sole judgement of the Company there is a 4
suitable location outside, the meter set shall be relocated outside. 5
Q. What have you learned from GSMP I on coordination of work? 6
A. We continue to make progress in coordinating work with municipal, state, and county 7
paving programs as well as with other local construction activities. This has enabled us to 8
minimize delays to established paving and reconstruction schedules by others and in some 9
cases not have to complete final restoration because of this coordination. 10
In addition, when dealing with large numbers of main outages in tandem, there are 11
challenges in coordination and logistics to ensure there is no impact to system reliability. As 12
a result, a weekly statewide system call was implemented to address coordination of these 13
outages. These calls help to coordinate system outages and ensure reliability. 14
Program Reporting 15
Q. Does the Company intend to provide regular reporting on its progress? 16
A. Yes. Consistent with the IPP proposal, the Company proposes to submit semi-annual 17
status reports to Board Staff and the Division of Rate Counsel that contain the following 18
information: 19
- 81 -
1. Forecasted and actual costs of the Infrastructure Investment Program for the 1
applicable reporting period, and for the Program to date, where Program projects 2
are identified by major category; 3
2. The estimated total quantity of work completed under the Program identified by 4
major category. In the event that the work cannot be quantified, major tasks 5
completed shall be provided; 6
3. Estimated completion dates for the Infrastructure Investment Program as a whole, 7
and estimated completion dates for each major Program category; 8
4. Anticipated changes to Infrastructure Investment Program projects, if any; and 9
5. Actual capital expenditures made by the utility in the normal course of business 10
on similar projects, identified by major category 11
Q. Will the Company commit to leak reduction? 12
A. The Company commits to reducing the open leak inventory by 80% over the five 13
years following the date of Board approval and a minimum of 20% each year in the first two 14
years except if extraordinary circumstances such as extreme weather, acts of war or 15
terrorism, or other force majeure extraordinary circumstances prevent the achievement of the 16
annual reduction. This commitment is irrespective of incremental, new, post-approval leaks 17
which will not be counted in such metric. 18

- 82 -
Conclusion 1
Q. Please summarize your recommendation. 2
A. Aging cast iron and unprotected steel pipe serving PSE&G customers exhibits 3
significantly greater leak rates than newer plastic and cathodically protected steel pipe and 4
will eventually require replacement or rehabilitation. The proposed GSMP and associated 5
cost recovery mechanism represent a prudent response to PSE&G’s long- term system 6
needs and the DOT’s “Call to Action” to facilitate the replacement of aging gas 7
infrastructure. The safety-related, customer, economic and other benefits attributable to the 8
five-year Program extension, as presented in my testimony, are compelling. The Company 9
has a proven track record to show our ability to execute the proposed program in a safe and 10
customer conscious manner. Therefore, I request that the proposed program be approved. 11
Q. Does this conclude your testimony? 12
A. Yes, it does. 13

- 83 -
SCHEDULE INDEX
Schedule WEM-GSMPII-1 Credentials of Wade E. Miller
Schedule WEM-GSMPII-2 Baseline Spending Level Calculation
Schedule WEM-GSMPII-3 Gas Delivery Capital Summary (2012 - 2021)
Schedule WEM-GSMPII-4 Gas Delivery GSMP II Cash Flows w/COR
Schedule WEM-GSMPII-5 GSMP Monthly Report – June 2017

ATTACHMENT 1 SCHEDULE WEM-GSMPII-1
PAGE 1 OF 2
CREDENTIALS 1 OF 2
WADE E. MILLER 3 DIRECTOR – GAS TRANSMISSION & 4
DISTRIBUTION ENGINEERING 5 6
I received a Bachelor of Science Degree in Mechanical Engineering from The 7
College of New Jersey in 2000. I also received my Engineer-In-Training certification in 8
2000. I became licensed as a Professional Engineer with the State of New Jersey in 2006. I 9
also received my certification as a Project Management Professional with the Project 10
Management Institute in 2006. In 2007, I earned the designation of Registered Gas 11
Distribution Professional from the Gas Technology Institute. 12
I was employed by PSE&G in June 2000 as an Associate Engineer in the Trenton Gas 13
Distribution District where I began my training program and was mentored under a senior 14
engineer. In 2001, I was relocated from Trenton District to Burlington District where I acted 15
as the sole engineer. In 2003, I was promoted to the position of Lead Engineer. During my 16
first four years, I provided engineering and managerial support for all phases of planning, 17
design, construction, and maintenance of the gas distribution system while adhering to the 18
established capital and O&M budgets. 19
In 2004, I was promoted to the position of Supervising Engineer in the Asset 20
Management department and given the responsibility for the approval of all engineering 21
designs associated with new and replacement main requisitions, district and pound to pound 22
regulator installations, large volume meter sets, higher than normal delivery pressure 23
requests, gas load increase submittals, and written gas out procedures covering six of the 24
ATTACHMENT 1 SCHEDULE WEM-GSMPII-1
PAGE 2 OF 2
twelve gas districts. In addition, I was also responsible for developing the replacement main 1
plans for these same six districts including identification and prioritization. 2
In 2007, I was promoted to the position of Planning & Design Manager in the Asset 3
Management department overseeing a team of engineers and given the responsibility for 4
developing and maintaining Company design standards for the Gas system, maintaining 5
system integrity, and providing technical support to gas field operations. I was also 6
responsible for developing the annual replacement main, regulator, and system reinforcement 7
programs for the Company. 8
In April 2014, I assumed my current position, which involves overall responsibility 9
for system planning and reliability as well as the safe and efficient engineering, design, and 10
operating procedures of PSE&G’s gas transmission and distribution assets. I am also 11
responsible for the management of the Transmission and Distribution Integrity Management 12
Programs, operation and maintenance of 48 city gate stations, four gas plants, and gas control 13
to over 1.8 million customers. 14
I am the Committee sponsor for PSE&G’s Gas Engineering Committee which is 15
responsible for approval of action items due to regulatory changes and changes to Company 16
technical manuals, the Operator Qualification program, Integrity Management programs, and 17
new technology and materials. 18
I am a member of the Operations Safety Regulatory Action committee and the 19
Engineering committee of the American Gas Association. 20
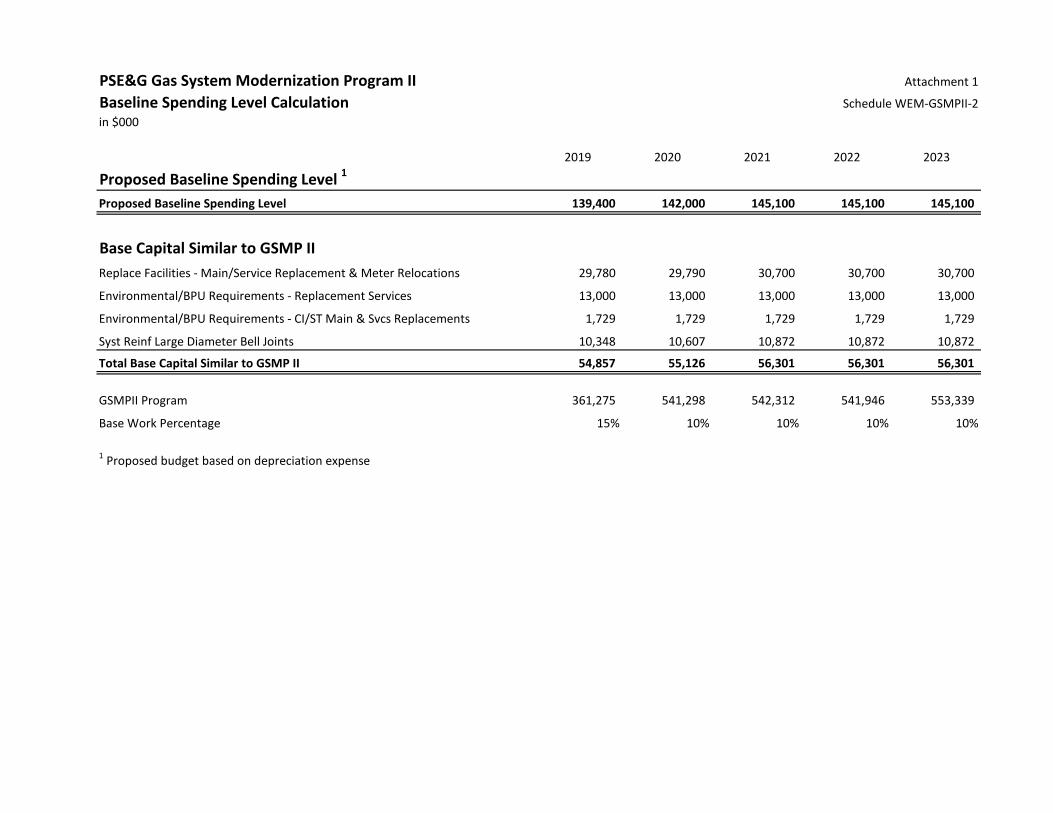
PSE&G Gas System Modernization Program II Attachment 1
Baseline Spending Level Calculation Schedule WEM-GSMPII-2in $000
2019 2020 2021 2022 2023
Proposed Baseline Spending Level 1
Proposed Baseline Spending Level 139,400 142,000 145,100 145,100 145,100
Base Capital Similar to GSMP II Replace Facilities - Main/Service Replacement & Meter Relocations 29,780 29,790 30,700 30,700 30,700
Environmental/BPU Requirements - Replacement Services 13,000 13,000 13,000 13,000 13,000
Environmental/BPU Requirements - CI/ST Main & Svcs Replacements 1,729 1,729 1,729 1,729 1,729
Syst Reinf Large Diameter Bell Joints 10,348 10,607 10,872 10,872 10,872
Total Base Capital Similar to GSMP II 54,857 55,126 56,301 56,301 56,301
GSMPII Program 361,275 541,298 542,312 541,946 553,339
Base Work Percentage 15% 10% 10% 10% 10%
1 Proposed budget based on depreciation expense

PSE&G Gas System Modernization Program II ATTACHMENT 1
Gas Delivery Capital Summary (2012 - 2021) Schedule WEM-GSMPII-3
2012 2013 2014 2015 2016 2017 2018 2019 2020 2021Full Year Full Year Full Year Full Year Full Year Full Year Full Year Full Year Full Year Full Year
Capital Category Actual Actual Actual Actual Actual Plan Plan Plan Plan PlanNew Business Total $ 52.0$ 67.9$ 63.1$ 73.3$ 79.2$ 76.8$ 78.7$ 80.7$ 82.7$ 84.7$ Base Total $ 145.0$ 116.6$ 138.2$ 173.5$ 210.0$ 391.5$ 253.2$ 139.4$ 142.0$ 145.1$ Stipulated Base Total $ 94.8$ 85.0$ 85.0$ GSMP I Total $ 159.0$ 221.3$ 227.6$ 48.3$ Energy Strong Total $ 95.1$ 225.2$ 70.3$ 2.5$ GSMP II Total $ 361.3$ 541.3$ 542.3$ CIP II Total $ 54.3$ 4.9$
Total Capital $ 251.3$ 189.4$ 296.5$ 472.0$ 613.3$ 777.2$ 644.5$ 629.7$ 766.0$ 772.1$
Base Breakdown by Major CategoryReplace Facilities 62.8$ 41.5$ 44.3$ 72.3$ 77.0$ 189.3$ 101.7$ 32.3$ 32.3$ 33.2$ System Reinforcement 28.2$ 30.5$ 48.2$ 51.4$ 60.4$ 80.8$ 46.8$ 32.2$ 33.3$ 34.0$ Environmental Regulatory 22.8$ 26.1$ 27.6$ 25.9$ 27.2$ 40.8$ 33.9$ 30.0$ 30.0$ 30.0$ Replace Meters 26.6$ 15.0$ 14.0$ 19.2$ 36.7$ 62.3$ 62.4$ 40.9$ 42.4$ 43.9$ Support Facilities 4.6$ 3.4$ 4.0$ 4.7$ 8.7$ 18.3$ 8.4$ 4.0$ 4.0$ 4.0$
Base Total $ 145.0$ 116.6$ 138.2$ 173.5$ 210.0$ 391.5$ 253.2$ 139.4$ 142.0$ 145.1$

PSE&G Gas System Modernization Program II ATTACHMENT 1
Gas Delivery GSMP II Cash Flows w/COR Schedule WEM-GSMPII-4
Cash Flows ($000s) Jan Feb Mar Apr May Jun July Aug Sept Oct Nov Dec Total5 Year Program ($000s)
GSMP II (2019) 1,279$ 2,557$ 5,114$ 12,786$ 30,687$ 33,244$ 36,591$ 46,922$ 45,353$ 54,456$ 44,455$ 47,831$ 361,275$ GSMP II (2019) COR 90$ 179$ 358$ 895$ 2,148$ 2,327$ 2,561$ 3,285$ 3,175$ 3,812$ 3,112$ 3,348$ 25,289$ GSMP II (2019) Net Plant 1,189$ 2,378$ 4,756$ 11,891$ 28,539$ 30,917$ 34,030$ 43,638$ 42,178$ 50,644$ 41,343$ 44,483$ 335,986$
GSMP II (2020) 15,833$ 12,304$ 18,822$ 31,280$ 55,241$ 52,472$ 56,566$ 58,655$ 55,796$ 68,072$ 54,674$ 61,585$ 541,298$ GSMP II (2020) COR 1,108$ 861$ 1,318$ 2,190$ 3,867$ 3,673$ 3,960$ 4,106$ 3,906$ 4,765$ 3,827$ 4,311$ 37,891$ GSMP II (2020) Net Plant 14,725$ 11,442$ 17,504$ 29,090$ 51,374$ 48,799$ 52,607$ 54,549$ 51,890$ 63,307$ 50,847$ 57,274$ 503,407$
GSMP II (2021) 15,862$ 12,327$ 18,857$ 31,338$ 55,344$ 52,571$ 56,672$ 58,764$ 55,900$ 68,199$ 54,776$ 61,700$ 542,312$ GSMP II (2021) COR 1,110$ 863$ 1,320$ 2,194$ 3,874$ 3,680$ 3,967$ 4,114$ 3,913$ 4,774$ 3,834$ 4,319$ 37,962$ GSMP II (2021) Net Plant 14,752$ 11,464$ 17,537$ 29,145$ 51,470$ 48,891$ 52,705$ 54,651$ 51,987$ 63,425$ 50,942$ 57,381$ 504,350$
GSMP II (2022) 15,852$ 12,318$ 18,844$ 31,317$ 55,307$ 52,535$ 56,634$ 58,725$ 55,862$ 68,153$ 54,739$ 61,659$ 541,946$ GSMP II (2022) COR 1,110$ 862$ 1,319$ 2,192$ 3,871$ 3,677$ 3,964$ 4,111$ 3,910$ 4,771$ 3,832$ 4,316$ 37,936$ GSMP II (2022) Net Plant 14,742$ 11,456$ 17,525$ 29,125$ 51,435$ 48,858$ 52,670$ 54,614$ 51,952$ 63,383$ 50,907$ 57,343$ 504,009$
GSMP II (2023) 16,185$ 12,577$ 19,240$ 31,976$ 56,469$ 53,640$ 57,825$ 59,959$ 57,037$ 69,586$ 55,890$ 62,955$ 553,339$ GSMP II (2023) COR 1,133$ 880$ 1,347$ 2,238$ 3,953$ 3,755$ 4,048$ 4,197$ 3,993$ 4,871$ 3,912$ 4,407$ 38,734$ GSMP II (2023) Net Plant 15,052$ 11,697$ 17,894$ 29,737$ 52,517$ 49,885$ 53,777$ 55,762$ 53,044$ 64,715$ 51,978$ 58,548$ 514,606$
GSMP II (2024) 18,425$ 15,590$ 21,259$ 31,180$ 29,763$ 25,511$ 141,729$ GSMP II (2024) COR 1,290$ 1,091$ 1,488$ 2,183$ 2,083$ 1,786$ 9,921$ GSMP II (2024) Net Plant 17,135$ 14,499$ 19,771$ 28,998$ 27,680$ 23,725$ 131,808$
Total 2,681,899$
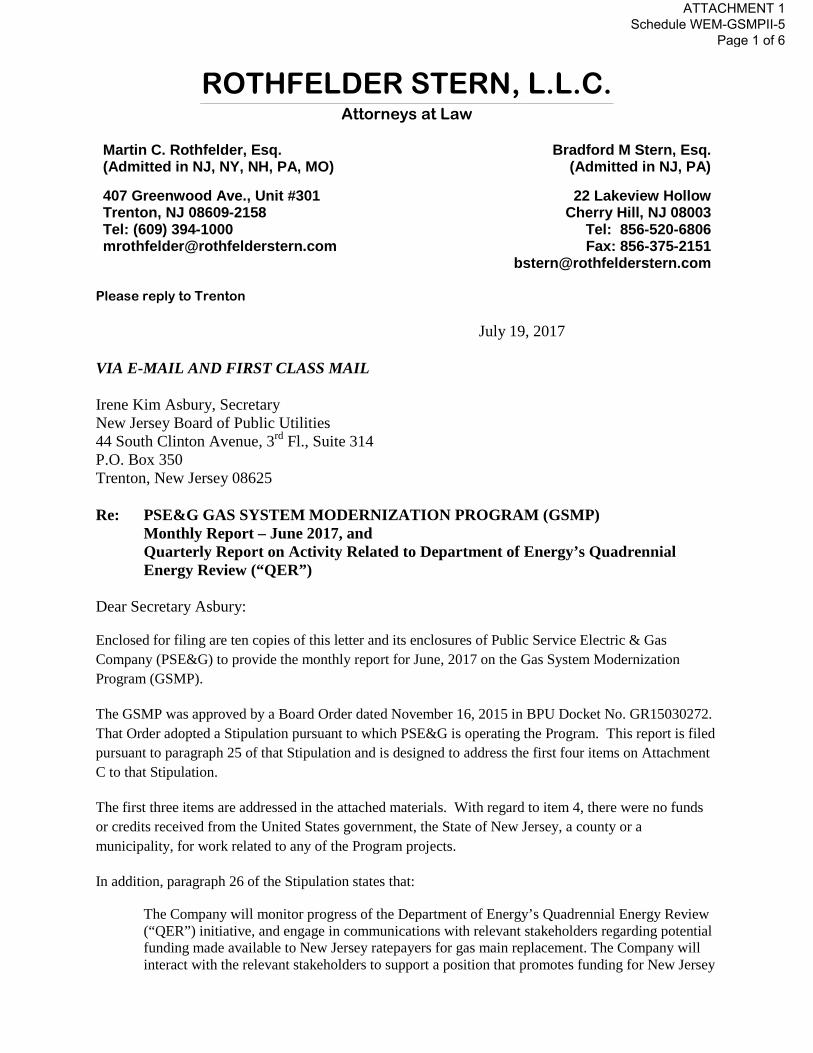
ROTHFELDER STERN, L.L.C. _______________________________________________________________________________________________________________________________________________________________________________________________________________
Attorneys at Law
Martin C. Rothfelder, Esq. (Admitted in NJ, NY, NH, PA, MO) 407 Greenwood Ave., Unit #301 Trenton, NJ 08609-2158 Tel: (609) 394-1000 [email protected]
Bradford M Stern, Esq. (Admitted in NJ, PA)
22 Lakeview Hollow
Cherry Hill, NJ 08003 Tel: 856-520-6806 Fax: 856-375-2151
Please reply to Trenton July 19, 2017
VIA E-MAIL AND FIRST CLASS MAIL Irene Kim Asbury, Secretary New Jersey Board of Public Utilities 44 South Clinton Avenue, 3rd Fl., Suite 314 P.O. Box 350 Trenton, New Jersey 08625 Re: PSE&G GAS SYSTEM MODERNIZATION PROGRAM (GSMP)
Monthly Report – June 2017, and Quarterly Report on Activity Related to Department of Energy’s Quadrennial
Energy Review (“QER”) Dear Secretary Asbury:
Enclosed for filing are ten copies of this letter and its enclosures of Public Service Electric & Gas Company (PSE&G) to provide the monthly report for June, 2017 on the Gas System Modernization Program (GSMP).
The GSMP was approved by a Board Order dated November 16, 2015 in BPU Docket No. GR15030272. That Order adopted a Stipulation pursuant to which PSE&G is operating the Program. This report is filed pursuant to paragraph 25 of that Stipulation and is designed to address the first four items on Attachment C to that Stipulation.
The first three items are addressed in the attached materials. With regard to item 4, there were no funds or credits received from the United States government, the State of New Jersey, a county or a municipality, for work related to any of the Program projects.
In addition, paragraph 26 of the Stipulation states that:
The Company will monitor progress of the Department of Energy’s Quadrennial Energy Review (“QER”) initiative, and engage in communications with relevant stakeholders regarding potential funding made available to New Jersey ratepayers for gas main replacement. The Company will interact with the relevant stakeholders to support a position that promotes funding for New Jersey
ATTACHMENT 1 Schedule WEM-GSMPII-5
Page 1 of 6
ratepayers. The Company agrees to provide quarterly updates to Board Staff and Rate Counsel of any QER developments of which it becomes aware.
The PSE&G report on the QER for the second quarter of 2017 is as follows. During 2016, both houses of Congress passed different version of a major energy bill (S. 2012), but no version of the bill passed both houses. That legislation died in early January 2017 at the end of the 114th Congress. During the second quarter of 2017, to the extent possible, PSE&G continued to pursue discussions of the QER recommendation to provide federal funds toward replacement of gas infrastructure with stakeholders and staff on Capitol Hill but, at this time, there is no active consideration of this matter. Sincerely,
Martin C. Rothfelder cc: Stefanie Brand (2 hard copies and e-mail)
Paul Flanagan (e-mail only) Lisa Gurkas (e-mail only) Brian Lipman (e-mail only) Thomas Walker (e-mail only) Alex Moreau (e-mail only) Stacy Peterson (e-mail only) Bethany Rocque-Romaine (e-mail only) Felicia Thomas-Friel (e-mail only) Caroline Vachier (e-mail only)
ATTACHMENT 1 Schedule WEM-GSMPII-5
Page 2 of 6
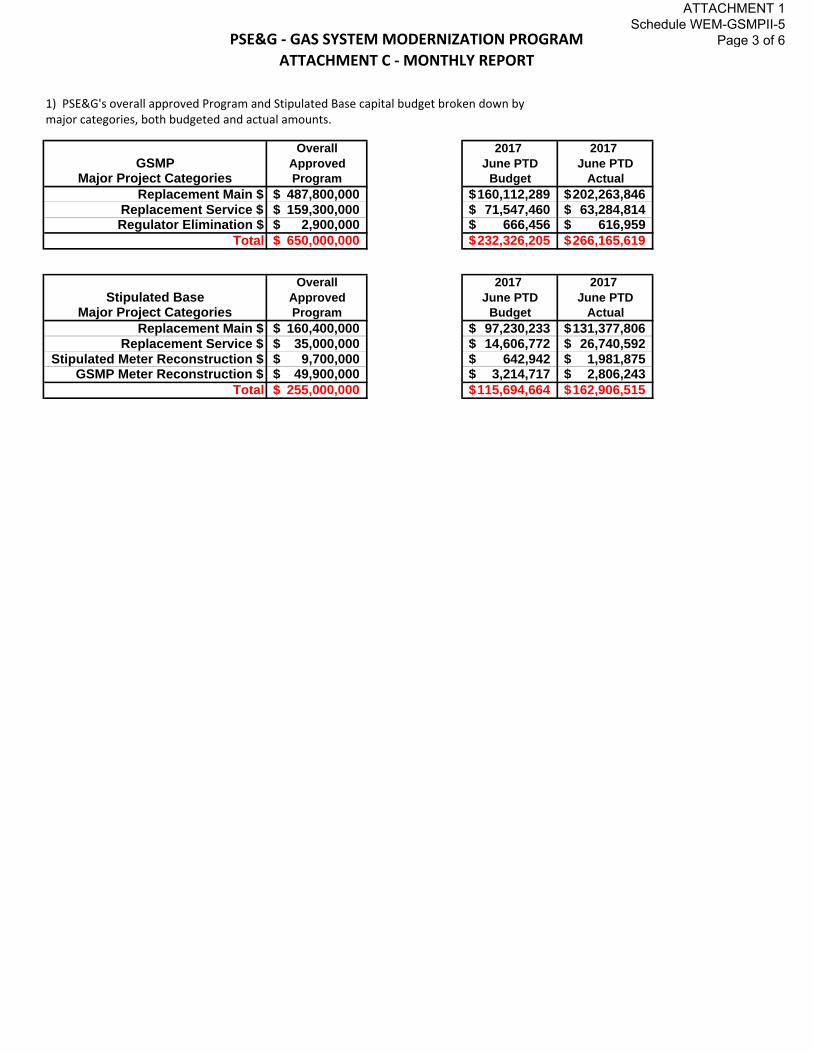
PSE&G ‐ GAS SYSTEM MODERNIZATION PROGRAM
ATTACHMENT C ‐ MONTHLY REPORT
1) PSE&G's overall approved Program and Stipulated Base capital budget broken down bymajor categories, both budgeted and actual amounts.
Overall 2017 2017GSMP Approved June PTD June PTD
Major Project Categories Program Budget ActualReplacement Main $ 487,800,000$ 160,112,289$ 202,263,846$
Replacement Service $ 159,300,000$ 71,547,460$ 63,284,814$ Regulator Elimination $ 2,900,000$ 666,456$ 616,959$
Total 650,000,000$ 232,326,205$ 266,165,619$
Overall 2017 2017Stipulated Base Approved June PTD June PTD
Major Project Categories Program Budget ActualReplacement Main $ 160,400,000$ 97,230,233$ 131,377,806$
Replacement Service $ 35,000,000$ 14,606,772$ 26,740,592$ Stipulated Meter Reconstruction $ 9,700,000$ 642,942$ 1,981,875$
GSMP Meter Reconstruction $ 49,900,000$ 3,214,717$ 2,806,243$ Total 255,000,000$ 115,694,664$ 162,906,515$
ATTACHMENT 1 Schedule WEM-GSMPII-5
Page 3 of 6
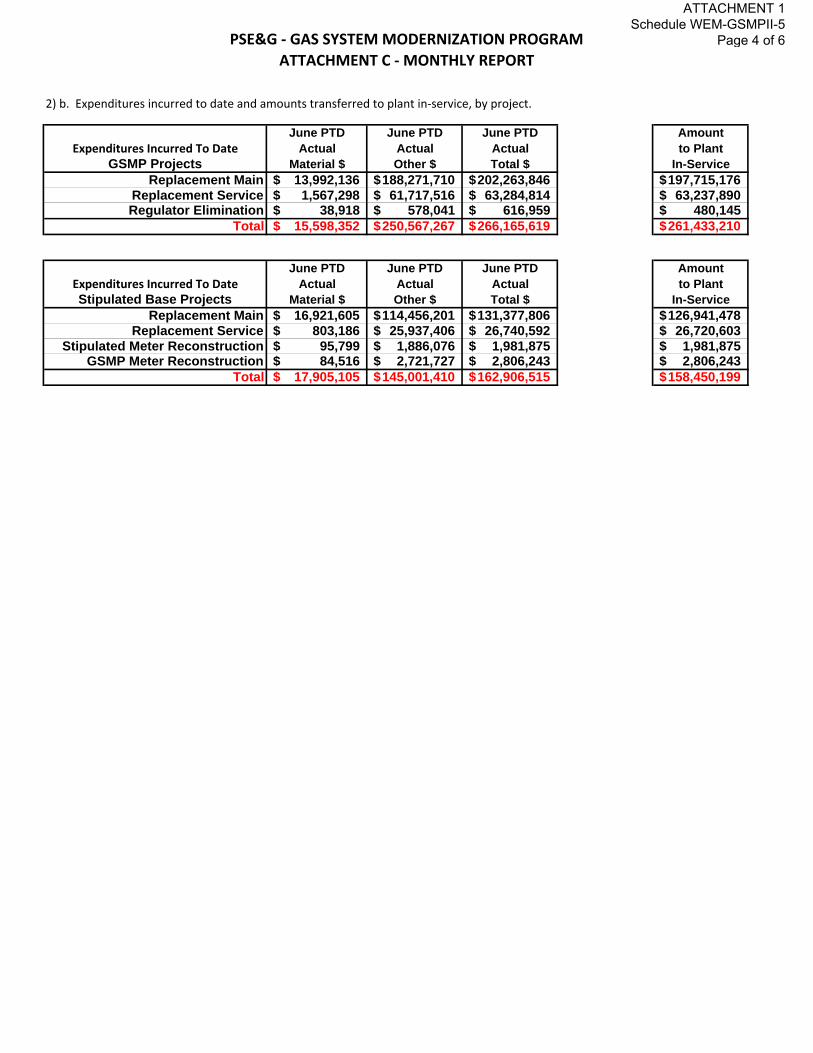
PSE&G ‐ GAS SYSTEM MODERNIZATION PROGRAM
ATTACHMENT C ‐ MONTHLY REPORT
2) b. Expenditures incurred to date and amounts transferred to plant in‐service, by project.
June PTD June PTD June PTD AmountExpenditures Incurred To Date Actual Actual Actual to Plant
GSMP Projects Material $ Other $ Total $ In-ServiceReplacement Main 13,992,136$ 188,271,710$ 202,263,846$ 197,715,176$
Replacement Service 1,567,298$ 61,717,516$ 63,284,814$ 63,237,890$ Regulator Elimination 38,918$ 578,041$ 616,959$ 480,145$
Total 15,598,352$ 250,567,267$ 266,165,619$ 261,433,210$
June PTD June PTD June PTD AmountExpenditures Incurred To Date Actual Actual Actual to PlantStipulated Base Projects Material $ Other $ Total $ In-Service
Replacement Main 16,921,605$ 114,456,201$ 131,377,806$ 126,941,478$Replacement Service 803,186$ 25,937,406$ 26,740,592$ 26,720,603$
Stipulated Meter Reconstruction 95,799$ 1,886,076$ 1,981,875$ 1,981,875$ GSMP Meter Reconstruction 84,516$ 2,721,727$ 2,806,243$ 2,806,243$
Total 17,905,105$ 145,001,410$ 162,906,515$ 158,450,199$
ATTACHMENT 1 Schedule WEM-GSMPII-5
Page 4 of 6

PSE&G - GAS SYSTEM MODERNIZATION PROGRAMATTACHMENT C - MONTHLY REPORT
REPORT DATE: JUNE 20172a - Description of projects2c - Projected and actual miles of main installed2d - Projected and actual number of services installed
Project Sub-Project
Project Completion
Date UnitsSize
InstalledMaterial Installed
2016Quantity
Completed
Projected QuantityJan 2017
Actual QuantityJan 2017
Projected QuantityFeb 2017
Actual QuantityFeb 2017
Projected QuantityMar 2017
Actual QuantityMar 2017
Projected QuantityApr 2017
Actual QuantityApr 2017
Projected QuantityMay 2017
Actual QuantityMay 2017
Projected QuantityJun 2017
Actual QuantityJun 2017
2017 Estimated Quantity
Quantity Completed
2017 Year To Date
Total Program Quantity
Completed To Date
2" Plastic 361,739 - 12,816 - 3,479 4,000 3,196 4,000 13,083 28,119 42,238 37,115 49,573 313,149 124,385 486,124 4" Plastic 182,371 - 2,044 - 2,249 4,341 1,231 4,341 3,299 14,653 9,042 14,653 15,389 119,957 33,254 215,625 6" Plastic 60,016 - 2,446 - 2,690 4,088 1,027 4,088 3,729 5,023 4,695 6,494 4,538 57,972 19,125 79,141 8" Plastic 13,461 - 835 - 466 2,334 5,389 2,334 3,561 1,799 3,616 1,799 308 15,862 14,175 27,636 12" Plastic - - - - - 1,077 - 1,077 - 1,006 - 1,000 - 4,160 - - 12" Steel 7,324 - - - 213 - 5,428 - 5,293 2,200 2,688 2,300 - 16,898 13,622 20,946 16" Steel - - - - - - - - - - - - - - - -
Replace Facilities Blanket Replacement Main N/A Feet of Main N/A N/A 624,911 - 18,141 - 9,097 15,840 16,271 15,840 28,965 52,800 62,279 63,360 69,808 527,998 204,561 829,472
2" Plastic 6,804 367 1,113 301 787 411 576 617 757 993 803 942 972 10,000 5,008 11,812 >2" Plastic 4 - 2 - - - 1 - - - 1 - - - 4 8
Replace Facilities Blanket Replacement Service N/A Services Replaced N/A N/A 6,808 367 1,115 301 787 411 577 617 757 993 804 942 972 10,000 5,012 11,820
Abandon Facilities Blanket Abandon Regulator Dec-18 Regulators Abandoned N/A N/A 5 - 1 2 - 2 6 11 16 Abandon Facilities Blanket
Abandon Regulator N/A Regulators Abandoned N/A N/A 5 - 1 2 - 2 6 11 16
2" Plastic 155,411 - 3,739 - 1,364 2,500 3,830 5,000 6,867 6,277 4,603 4,628 2,475 41,249 22,878 178,289 4" Plastic 95,033 - 3,166 - 1,807 1,000 5,132 4,000 2,996 6,049 1,782 4,671 2,682 36,741 17,565 112,598 6" Plastic 34,296 - 2,320 - 1,132 252 1,492 2,672 76 2,719 232 1,719 97 16,881 5,349 39,645 8" Plastic 16,633 - - - 38 - 944 - 14 1,580 14 1,580 - 9,177 1,010 17,643 8" Steel - - - - - - - - - - - - - - - - 12" Plastic - - - - - - - - - 414 - 413 - 2,892 - - 12" Steel 63,212 - 4,937 - 2,304 - 3,444 - 1,430 2,500 1,591 6,528 3,304 30,348 17,010 80,222 16" Steel 10,331 - 3,147 - 4,744 1,000 8,420 1,000 9,509 4,223 6,206 4,222 7,765 21,112 39,791 50,122 20" Steel 111 - - - - - - - - - - - - - 111
Replace Facilities Blanket Replacement Main N/A Feet of Main N/A N/A 375,027 - 17,309 - 11,389 4,752 23,262 12,672 20,892 23,760 14,428 23,760 16,323 158,399 103,603 478,630
2" Plastic 3,153 81 530 68 554 85 407 125 168 196 235 186 75 2,000 1,969 5,122 >2" Plastic 3 - - - - - - - - - - - 2 - 2 5
Replace Facilities Blanket Replacement Service N/A Services Replaced N/A N/A 3,156 81 530 68 554 85 407 125 168 196 235 186 77 2,000 1,971 5,127
Abandon Facilities Blanket Abandon Regulator Dec-18 Regulators Abandoned N/A N/A - - - - - - - - -
Abandon Facilities Blanket
Abandon Regulator N/A Regulators Abandoned N/A N/A - - - - - - - - -
STIP
ULA
TED
BA
SE
Services Replaced
Dec-18
Dec-18
Dec-18
Replace Facilities Blanket Replacement Service Dec-18
Replace Facilities Blanket Replacement Main Feet of Main
GA
S SY
STEM
MO
DER
NIZ
ATI
ON
PR
OG
RA
M
Replace Facilities Blanket Replacement Main
Replace Facilities Blanket Replacement Service Services Replaced
Feet of Main
ATTACHMENT 1 Schedule WEM-GSMPII-5
Page 5 of 6
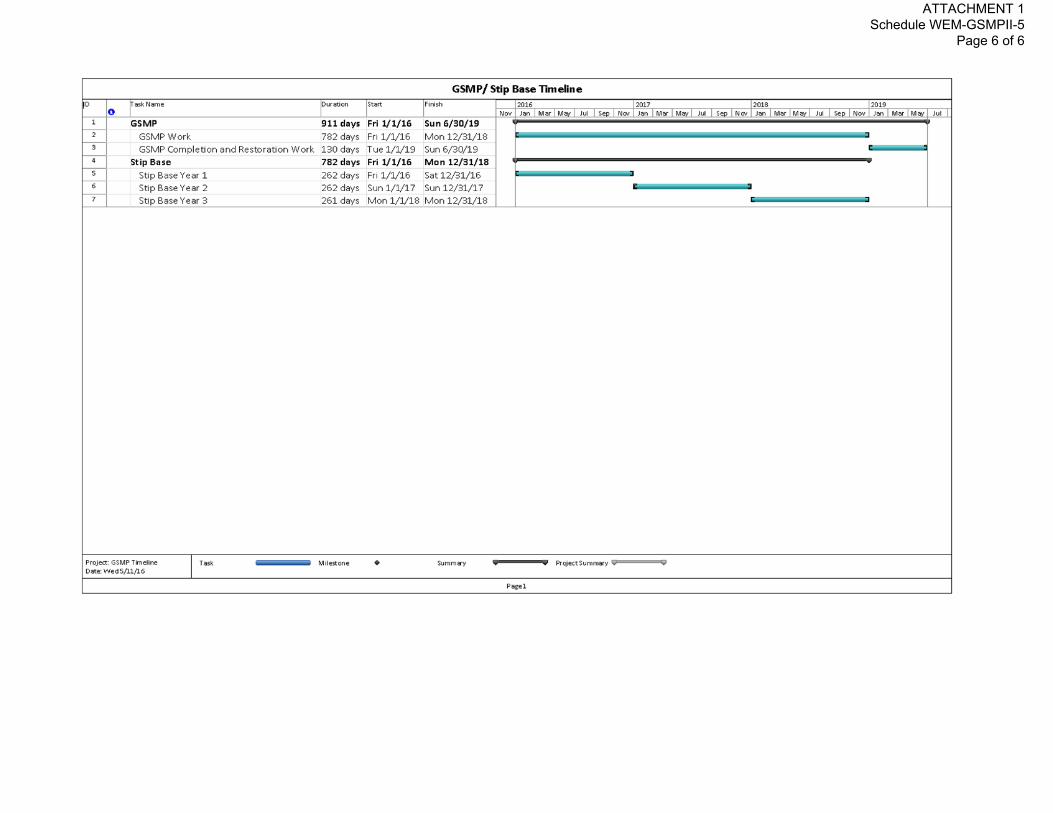
ATTACHMENT 1 Schedule WEM-GSMPII-5
Page 6 of 6
ATTACHMENT 2
STATE OF NEW JERSEY BOARD OF PUBLIC UTILITIES
IN THE MATTER OF THE PETITION OF PUBLIC SERVICE ELECTRIC AND GAS COMPANY
FOR APPROVAL OF THE NEXT PHASE OF THE GAS SYSTEM MODERNIZATION PROGRAM AND
ASSOCIATED COST RECOVERY MECHANISM (“GSMP II”)
BPU Docket No. __________
PUBLIC SERVICE ELECTRIC AND GAS COMPANY DIRECT TESTIMONY
OF STEPHEN SWETZ
SENIOR DIRECTOR – CORPORATE RATES AND REVENUE REQUIREMENTS
July 27, 2017

PUBLIC SERVICE ELECTRIC AND GAS COMPANY DIRECT TESTIMONY
OF STEPHEN SWETZ
SENIOR DIRECTOR – CORPORATE RATES AND REVENUE REQUIREMENTS
Q. Please state your name, affiliation and business address. 1 A. My name is Stephen Swetz and I am the Senior Director – Corporate Rates and 2
Revenue Requirements for PSEG Services Corporation. My principal place of business is 80 3
Park Plaza, Newark, New Jersey 07102. My credentials are set forth in the attached 4
Schedule SS-GSMPII-1. 5
Q. Please describe your responsibilities as the Senior Director – Corporate Rates 6 and Revenue Requirements for PSEG Services Corporation. 7
A. As Senior Director - Corporate Rates and Revenue Requirements, my primary duties 8
are to plan, develop and direct Public Service Electric and Gas Company’s (PSE&G or the 9
Company) calculation of electric and gas revenue requirements for the Company’s base rates 10
as well as all cost recovery clauses. I also direct the retail pricing strategies, retail rate 11
design, embedded and marginal cost studies, and development and interpretation of tariff 12
provisions. 13
Q. What is the purpose of your direct testimony in this proceeding? 14 A. My testimony provides the details for the calculation of PSE&G’s Gas System 15
Modernization Program II (GSMP II or the Program) revenue requirements, the associated 16
cost recovery methodology and rate design for the GSMP II Petition filed with the New 17
Jersey Board of Public Utilities (BPU or the Board). This testimony also provides detailed 18
schedules setting forth the projected revenue requirements, rates and bill impacts over the 19
expected Program life. 20

- 2 -
Q. Please briefly describe PSE&G’s proposed GSMP II cost recovery methodology. 1 A. PSE&G is proposing a cost recovery mechanism for GSMP II that is consistent with 2
the recently proposed BPU Infrastructure Investment And Recovery (IIR) regulations 3
(Proposed New Subchapter: N.J.A.C. 14:3-2A, BPU Docket Number: AX17050469) and the 4
existing Gas System Modernization Program (GSMP I) where applicable, which was 5
approved by the Board in Docket No. GR15030272 on November 16, 2015. The details of 6
the costs to be recovered, as well as the mechanism to recover such costs, are set forth in this 7
testimony. 8
Q. How does PSE&G propose to calculate the revenue requirements? 9 A. PSE&G proposes to calculate the revenue requirements associated with the Program 10
costs using the following formula: 11
Revenue Requirements = ((After Tax Cost of Capital * Net Rate Base) 12
+ Net of Tax Amortization and/or Depreciation + Tax Adjustment)* 13
Revenue Factor 14
This calculation is the same as the calculation in PSE&G’s GSMP I approved by the 15
Board in Docket No. GR15030272 on November 16, 2015. The Company is proposing to 16
recover the revenue requirements through semi-annual base rate roll-in filings as described 17
below, which is consistent with the BPU’s proposed IIR regulations. 18
Q. Please describe the components and defined terms in PSE&G’s proposed 19 revenue requirement calculation. 20
A. The following is a description of each term proposed in PSE&G’s revenue 21
requirement calculation. The term “Cost of Capital” is PSE&G’s overall weighted average 22

- 3 -
cost of capital (WACC) for the Program. PSE&G shall earn a return on its net investment in 1
the GSMP II based upon an authorized return on equity (ROE) and capital structure including 2
income tax effects. The Company’s initial cost of capital for the Program will be based on 3
the ROE, long-term debt rate and capital structure approved in the Solar 4 All Extension II 4
filing in Docket No. EO16050412, which was the latest new program approved for the 5
Company by the Board on November 30, 2016. Any change in the WACC authorized by the 6
Board in a subsequent base rate case will be reflected in the subsequent monthly revenue 7
requirement calculations. Any changes to current tax rates would be reflected in an 8
adjustment to the Pre-Tax WACC. See Schedule SS-GSMPII-2 for the calculation of the 9
current Pre-Tax WACC. Any change in the WACC authorized by the Board in a subsequent 10
electric, gas, or combined base rate case will be reflected in the appropriate corresponding 11
roll-in filing explained in more detail below. 12
The term “Net Rate Base” refers to Gross Plant less the associated accumulated 13
depreciation and/or amortization and less Accumulated Deferred Income Taxes (ADIT). 14
Gross Plant is equal to all Plant In-Service. The book recovery of each asset class and its 15
associated tax depreciation will be based on current depreciation rates. The annual book 16
depreciation rate for Mains and Services is currently 1.61%. ADIT is calculated as Book 17
Depreciation (Tax Basis) less Tax Depreciation, multiplied by the Company’s effective tax 18
rate, which is currently 40.85%. Mains and Services are depreciated for tax purposes using a 19
20 year MACRS schedule. Cost of Removal Expenditures are depreciated 100% in the year 20
incurred for tax purposes. Any future changes to the book or tax depreciation rates, such as 21
“bonus depreciation” during the construction period of the Program and at the time of each 22

- 4 -
base rate roll-in, will be reflected in the accumulated depreciation and/or ADIT calculation 1
described above. 2
The “Net of Tax Depreciation and/or Amortization” allows for recovery of the 3
Company’s investment in the Program assets over the useful book life of each asset class. 4
PSE&G proposes to depreciate the GSMP II assets in accordance with the Company’s 5
approved capitalization policy or as ordered by the Board. The book recovery of each asset 6
class will be based on current depreciation rates (1.61%). For plant in service investment, the 7
net of tax depreciation expense is calculated as the depreciation expense multiplied by one 8
minus the current tax rate. For CWIP projects, there is no tax deduction for the equity 9
portion of the capitalized AFUDC. As a result, the net of tax depreciation expense is 10
calculated as the depreciation expense associated with the Plant In-Service, excluding the 11
equity portion of AFUDC, multiplied by one minus the current tax rate plus the depreciation 12
expense associated with the equity portion of the AFUDC. Since the equity portion of 13
AFUDC will not be included in the tax basis of the Program assets, the equity portion must 14
be grossed-up for taxes in order for the Company to earn its allowed rate of return. Any 15
future changes to the book depreciation or tax rates during the construction period of the 16
Program and at the time of each base rate roll-in, will be reflected in the net of tax 17
depreciation expense calculation described above. 18
The term “Tax Adjustment” refers to any applicable tax items that may impact the 19
revenue requirement calculation for the Program. There are no tax adjustments forecasted 20
for the program at this time. 21
- 5 -
The “Revenue Factor” adjusts the Revenue Requirement Net of Tax for federal and 1
state income taxes and the costs associated with the BPU and Rate Counsel (RC) Annual 2
Assessments and Gas Revenue Uncollectibles. The BPU/RC Assessment Expenses consist 3
of payments, based upon a percentage of revenues collected (updated annually), to the State 4
based on the gas intrastate operating revenues for the utility. The Company has utilized the 5
respective BPU and RC assessment rates based on the 2017 fiscal year assessment. In 6
addition, gas revenue uncollectible expenses need to be recovered for these Program 7
revenues. The percentage used to calculate the gas uncollectible expense is based upon the 8
percentage determined in the Company’s latest base rate case. When this percentage is 9
updated in future base rate cases, the revised percentage would be applied to this Program 10
effective on the date new base rates become effective. 11
Q. Please describe the type of expenditures to be included in Net Rate Base? 12 A. The Program will include requests for recovery in base rates of all capital 13
expenditures associated with the GSMP II projects, including actual costs of engineering, 14
design and construction, cost of removal (net of salvage) and property acquisition, including 15
actual labor, materials, overhead, and capitalized AFUDC associated with the projects (the 16
“Capital Investment Costs”). Capital Investment Costs will be recorded, during construction, 17
in an associated CWIP account or in a Plant In-Service account upon the respective project 18
being deemed used and useful. 19
- 6 -
Q. Are there any items that may affect the tax impacts of the Program? 1 A. Yes. While other items may arise in the future, such as tax bonus depreciation, there 2
are two areas that the Company wishes to make the BPU aware of that may affect this 3
Program in the future. These are: 4
1. The amount and vintage of assets that will be removed and retired may impact 5
various tax deductions such as repair allowance, retirements, and cost of removal. 6
At the time such actual information becomes available, the impact of these 7
deductions on either rate-base or tax expense will be incorporated into the ADIT 8
balance. 9
2. The IRS has announced that it will be issuing further guidance regarding the tax 10
repair deduction that applies to gas distribution activities. This guidance is 11
anticipated to be released and effective within the Program investment period. As 12
these rules are not yet known, they have not been incorporated in this filing. 13
3. Congress is contemplating reforming the income tax code. Among other items 14
this may include reducing the corporate income tax rate, eliminating or increasing 15
tax deductions or a border adjustment tax. In the event income tax reform is 16
enacted any changes will be incorporated into the applicable filing. 17
Q. Will any of the Gas System Modernization Program II expenditures be eligible 18 for AFUDC? 19
A. Yes, but only for those projects that meet the Company’s criteria for accrual of 20
AFUDC. AFUDC is a component of construction costs representing the net cost of 21
borrowed funds and an equity return rate used during the period of construction. Under the 22
Company’s current policy, only projects that have both costs exceeding $5,000 and a 23
- 7 -
construction period longer than 60 days are eligible for AFUDC. Most of the investments 1
under this Program are not anticipated to be eligible for AFUDC because they will take less 2
than 60 days to construct. However, it is possible that some projects will require more than 3
60 days of construction and will therefore accrue AFUDC. In the event the Company’s 4
criteria for the accrual of AFUDC changes, the Company’s criteria in place at the time the 5
expenditures are incurred would be applied. 6
Q. How will AFUDC be calculated on eligible projects? 7 A. The Company accrues AFUDC on eligible projects utilizing the “full FERC method” 8
as set forth in FERC Order 561. AFUDC is accrued monthly and capitalized to CWIP until 9
the project is placed into service. 10
Q. Will the Company utilize AFUDC once the projects are placed into service? 11 A. No. Consistent with the proposed IIP regulations, the Company will not accrue any 12
AFUDC on projects that have already been placed into service. 13
Q. What is the source of the capital expenditures you use to calculate the revenue 14 requirements? 15
A. The projected monthly cash flow for the Program projects was provided by Mr. Wade 16
Miller. See Schedule WEM-GSMPII-2. As discussed in the testimony of Mr. Miller, the 17
Company envisions a long term, continuous effort to replace or rehabilitate all cast iron and 18
unprotected steel mains in its system and pursue other gas system modernization activities, 19
but is only proposing an initial five year program at this time. 20

- 8 -
Q. Is the Company planning capital expenditures similar to those included in 1 GSMP II not to be recovered via GSMP II? 2
A. Yes, the Company plans to maintain capital expenditures of at least 10% of the 3
approved GSMP II expenditures on projects similar to those proposed in GSMP II. These 4
capital expenditures shall be made in the normal course of business and recovered in future 5
base rate proceedings, and shall not be subject to the recovery via the GSMP II cost recovery 6
mechanism. 7
Q. Is there a schedule showing the calculation of the revenue requirements? 8 A. Yes. See Schedule SS-GSMPII-3 for the calculation of the GSMP II revenue 9
requirements based on the forecasted cash flow provided in Schedule WEM-GSMPII-4. 10
Q. How does the Company propose to recover the revenue requirements as 11 described above? 12
A. The Company proposes to recover the revenue requirements associated with the 13
Program through semi-annual rate base roll-in filings, which is consistent with the recently 14
proposed BPU IIP regulations and the same used for our Energy Strong program (for electric 15
investments). The Company’s GSMP I utilizes annual roll-ins, which causes a significant 16
amount of regulatory lag as investments are made, placed in service and depreciated, but not 17
recovered in rates for sometimes as long as fifteen months. As stated in Mr. Miller’s 18
Program testimony, the Company plans to begin main replacement work January 1, 2019. 19
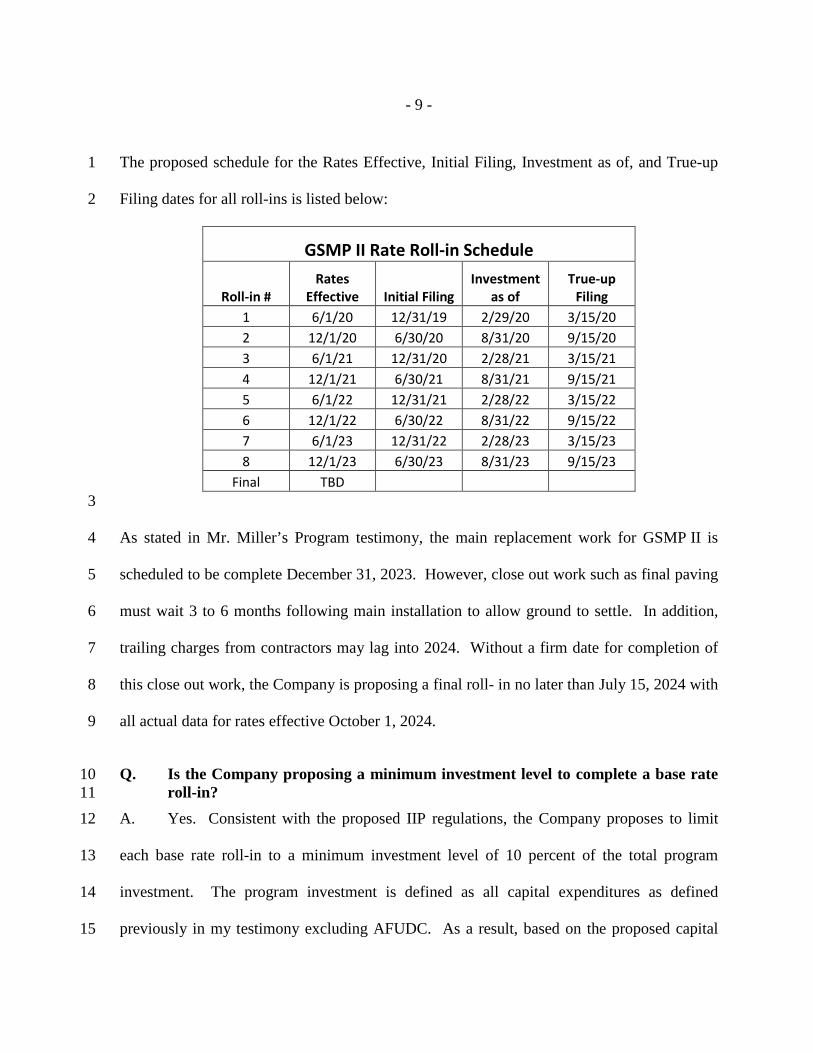
- 9 -
The proposed schedule for the Rates Effective, Initial Filing, Investment as of, and True-up 1
Filing dates for all roll-ins is listed below: 2
GSMP II Rate Roll-in Schedule
Roll-in # Rates
Effective Initial Filing Investment
as of True-up
Filing 1 6/1/20 12/31/19 2/29/20 3/15/20 2 12/1/20 6/30/20 8/31/20 9/15/20 3 6/1/21 12/31/20 2/28/21 3/15/21 4 12/1/21 6/30/21 8/31/21 9/15/21 5 6/1/22 12/31/21 2/28/22 3/15/22 6 12/1/22 6/30/22 8/31/22 9/15/22 7 6/1/23 12/31/22 2/28/23 3/15/23 8 12/1/23 6/30/23 8/31/23 9/15/23
Final TBD 3
As stated in Mr. Miller’s Program testimony, the main replacement work for GSMP II is 4
scheduled to be complete December 31, 2023. However, close out work such as final paving 5
must wait 3 to 6 months following main installation to allow ground to settle. In addition, 6
trailing charges from contractors may lag into 2024. Without a firm date for completion of 7
this close out work, the Company is proposing a final roll- in no later than July 15, 2024 with 8
all actual data for rates effective October 1, 2024. 9
Q. Is the Company proposing a minimum investment level to complete a base rate 10 roll-in? 11
A. Yes. Consistent with the proposed IIP regulations, the Company proposes to limit 12
each base rate roll-in to a minimum investment level of 10 percent of the total program 13
investment. The program investment is defined as all capital expenditures as defined 14
previously in my testimony excluding AFUDC. As a result, based on the proposed capital 15

- 10 -
expenditure forecast, the first base rate roll-in filing will not occur until December of 2019 1
for rates effective June 1, 2020. 2
Q. Is there any other proposed limit that could impact the amount of investment to 3 be included in a rate base roll-in? 4
A. Yes, the Company is also proposing to limit the amount of investment to be included 5
in the rate base roll-in by an earnings test. If the Company exceeds the allowed ROE from 6
the utility’s last base rate case by fifty (50) basis points or more for the most recent twelve 7
(12) month period, the pending base rate roll-in shall not be allowed for the applicable filing 8
period. 9
Q. How does the Company propose to calculate this earnings test? 10 A. Per the proposed IIP regulations, the earnings test shall be determined based on the 11
actual net income of the utility for the most recent twelve (12) month period divided by the 12
average of the beginning and ending common equity balances for the corresponding period. 13
Q. What is the corresponding period for the earnings test? 14
A. The Company will utilize the 12 month period corresponding to the latest available 15
SEC quarterly/annual filing. In the same manner as capital expenditures, the Company will 16
provide 9 months of actual data and 3 months of forecast data at the time of its initial filing. 17
The 3 months of forecasted data will be updated with actual information at the same time the 18
Company updates investment for actuals per the schedule above. 19

- 11 -
Q. Is there any issue with calculating common equity balances for gas? 1
A. Yes. As the only combined Electric, Gas and Transmission Company in the State, 2
calculating deferred taxes and rate base specific to the Gas utility on a monthly basis is 3
impractical. 4
Q. So how do you propose to calculate the starting and ending common equity 5 balance for the earnings test? 6
A. I’m proposing that the Common Equity balance to be used in the Company’s earnings 7
test be calculated based on the starting and ending Net Plant balances multiplied by the ratio 8
of Net Plant to Common Equity determined in the Company’s most recent base rate case. 9
Q. Is there precedence for this approach? 10 A. Yes. This is the same methodology utilized in the Company’s Board approved 11
Weather Normalization Clause. 12
Q. How will the Company address an extension of the GSMP as described in the 13 testimony of Mr. Miller? 14
A. Consistent with the long term, continuous effort to replace or rehabilitate all cast iron 15
and unprotected steel mains in its system described in the testimonies of Mr. Miller, PSE&G 16
anticipates filing for a further extension of the Gas System Modernization Program 17
approximately 24 months prior to the end of the period requested in the GSMP II Petition. 18
The intent of the extension request before the end of the five year replacement period is to 19
avoid the costs and delays of ramping down for the end of the current Program and then 20
ramping investment back up for the extension. 21

- 12 -
Q. Under this proposal, what opportunity will the BPU and/or Rate Counsel have to 1 review the actual expenditures of the Program? 2
A. Upon BPU approval of the Program, PSE&G will make semi-annual filings with 3
actual expenditures based on the schedule described above. BPU Staff and Rate Counsel can 4
review each roll-in filing to ensure that the revenue requirements and proposed rates are 5
being calculated in accordance with the BPU Order approving the Program. The actual 6
prudency of the Company’s expenditures in GSMP II will be reviewed as part of PSE&G’s 7
subsequent base rate case(s) following the roll-in(s). 8
Q. Does the Company plan to file a base rate case in connection to the proposed 9 GSMP II? 10
A. Yes. The Company proposes that it will file its next rate case not later than five (5) 11
years after the commencement of GSMP II (December 31, 2023). 12
Q. What is the gas revenue requirement for the initial rate recovery period? 13 A. The revenue requirement for the first rate change will be for plant in-service from 14
Board approval through August 31, 2019, and is currently forecasted to be $41.151 million. 15
See Schedule SS-GSMPII-3. 16
Q. Does the Company plan to do engineering work once Board approval is received 17 for GSMP II? 18
A. Yes. The Company anticipates conducting engineering work as soon as Board 19
approval is received and include those costs in the first roll-in. 20

- 13 -
Q. What rate design is the Company proposing to use for this base rate 1 adjustment? 2
A. The detailed calculations supporting the gas rate design for the first forecasted roll-in 3
is shown in Schedule SS-GSMPII-4. The rate design for the roll-ins made prior to new base 4
rates being set from the 2017 Base Rate Case will use the same methodology as in the 5
Company’s GSMP I approved by the Board in Docket No. GR15030272 on November 16, 6
2015. For base rate roll-ins made as part of or after the 2017 base rate case, the Company 7
may propose modifications to the roll-in rate design associated with this Program. If no 8
modifications are made to the base rate roll-in methodology as part of the 2017 base rate case 9
or any subsequent base rate case, all subsequent roll-ins shall use the rate design 10
methodology corresponding to the latest Board approved gas base rate case. In addition, 11
Schedule SS-GSMPII-5 provides a summary of the proposed rates for all forecasted roll-ins. 12
The weather normalized billing determinants from the calendar year 2012 were used to 13
estimate the change in base rates for this Program to reflect current usage. The rate design 14
methodology described above is the same as the rate design methodology approved for the 15
GSMP I. 16
Q. What billing determinants does the Company propose to use for each roll-in 17 filing? 18
A. The Company proposes to use the latest weather normalized billing determinants 19
available for setting the rates in each roll-in. The estimated rates calculated in Schedule SS-20
GSMPII-4 for the first forecasted roll-in are based on weather normalized billing 21
determinants for calendar year 2012, which are currently being used for GSMP I. For roll-22
ins that are effective subsequent to the Company’s base rate cases, those corresponding 23
- 14 -
billing determinants will be used once approved by the BPU. To the extent the Company 1
seeks to utilize more current weather normalized billing determinants for any future roll-in 2
filings subsequent to the latest approved base rate case or to change the methodology used to 3
weather normalize billing determinants, PSE&G shall provide those updated billing 4
determinants and supporting data to Board Staff and Rate Counsel a minimum of 60 days 5
prior to any GSMP II roll-in filing. The ability to update billing determinants and weather 6
normalization methodology is consistent with GSMP I. 7
Q. What are the annual rate impacts to the typical residential customer? 8 A. Based upon the forecasted rates shown in Schedule SS-GSMPII-5, the typical annual 9
bill impacts for a residential customer as well as rate class average customers compared to 10
rates as of July 10, 2017 are set forth in Schedule SS-GSMPII-6.1 Based on the estimated 11
roll-in revenue requirements provided in Schedule SS-GSMPII-3, the initial annual impact of 12
the proposed rates for the first roll-in period to the typical residential gas heating customer 13
who uses 165 therms in a winter month and 1,010 therms annually is an increase of $22.86 or 14
approximately 2.65%. The maximum cumulative impact (impact from the entire Program) 15
on the typical residential gas heating customer is an average annual increase of 16
approximately 3.92% or about a $14.11 increase in their average monthly bill. 17
Q. Will the Company hold public comment hearings? 18 A. Although PSE&G is not proposing a rate increase at this time, the Company proposes 19
public comment hearings similar to those that are held when rate increases are proposed. A 20
1The bill impacts assume that customers receive commodity service from PSE&G under the applicable Basic Gas Supply Service (BGSS) rate.

- 15 -
proposed form of public notice of filing and public hearings, including the proposed rates and 1
bill impacts attributable to the proposed implementation of the Program are set forth in 2
Schedule SS-GSMPII-7. 3
Q. Does this conclude your testimony? 4 A. Yes, it does. 5
- 20 -
SCHEDULE INDEX
Schedule SS-GSMPII-1 Credentials of Stephen Swetz
Schedule SS-GSMPII-2 Weighted Average Cost of Capital (WACC)
Schedule SS-GSMPII-3 Gas Revenue Requirements Calculation
Schedule SS-GSMPII-4 Proof of Revenue and Forecasted Rates
Schedule SS-GSMPII-5 Summary of Forecasted Roll-in Rates
Schedule SS-GSMPII-6 RSG Typical Annual Bill Impacts for each Forecasted Roll-in
Schedule SS-GSMPII-7 Proposed Form of Public Notice

ATTACHMENT 2
SCHEDULE SS-GSMP-1 PAGE 1 OF 3
CREDENTIALS 1 OF 2
STEPHEN SWETZ 3 DIRECTOR-CORPORATE RATES AND REVENUE REQUIREMENTS 4
5 My name is Stephen Swetz and I am employed by PSEG Services 6
Corporation. I am the Director - Corporate Rates and Revenue Requirements where my 7
main responsibility is to contribute to the development and implementation of electric 8
and gas rates for Public Service Electric and Gas Company (PSE&G, the Company). 9
EDUCATIONAL BACKGROUND 10
I graduated from Worcester Polytechnic Institute with a Bachelor of 11
Science degree in Mechanical Engineering. I also earned the degree of Master of 12
Business Administration from Fairleigh Dickinson University. 13
WORK EXPERIENCE 14
I have over 20 years’ experience in Rates, Analysis, and Operations for 15
three Fortune 500 companies. Since 1991, I have worked in various positions within 16
PSEG. I have held positions in Rates & Regulation, Pricing, Corporate Planning & 17
Finance with over thirteen years of direct experience in Northeastern retail and wholesale 18
electric and gas markets. I am presently the Director - Corporate Rates and Revenue 19
Requirements and contribute to the development and implementation of PSE&G electric 20
and gas rates. 21

ATTACHMENT 2
SCHEDULE SS-GSMP-1 PAGE 2 OF 3
I have submitted pre-filed direct cost recovery testimony as well as oral 1
testimony to the New Jersey Office of Administrative Law. A history of prior filings in 2
which I have provided testimony can be found on page 3 of this document. I have also 3
contributed to other filings that the Company has made to the New Jersey Board of 4
Public Utilities, including the Capital Economic Stimulus Infrastructure Investment 5
Programs, as well as unbundling electric rates and Off-Tariff Rate Agreements. I have 6
had a leadership role in various economic analyses, asset valuations, rate design and 7
pricing efforts and participated in electric and gas marginal cost studies. 8
I am an active member of the American Gas Association’s Rate and 9
Strategic Issues Committee and the Edison Electric Institute’s Rates and Regulatory 10
Affairs Committee. I am also a member of the New Jersey Utility Association (NJUA) 11
Finance and Regulatory Committee. 12
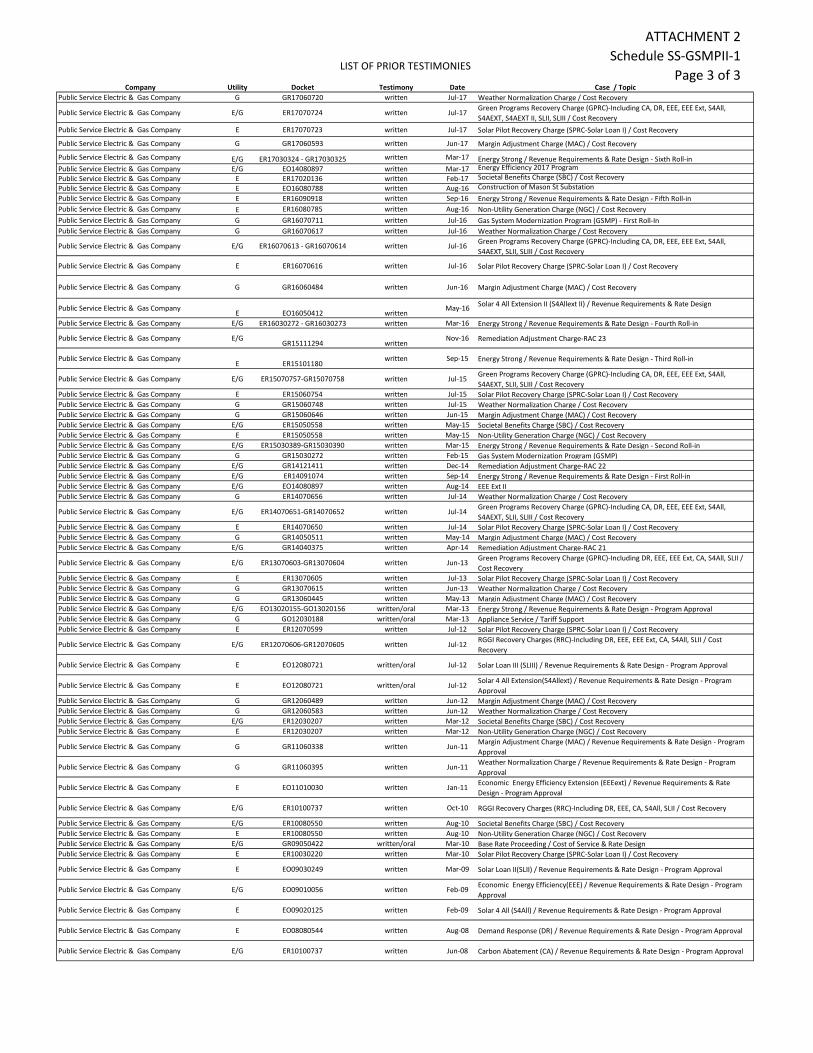
ATTACHMENT 2Schedule SS-GSMPII-1
Page 3 of 3Company Utility Docket Testimony Date Case / Topic
Public Service Electric & Gas Company G GR17060720 written Jul-17 Weather Normalization Charge / Cost Recovery
Public Service Electric & Gas Company E/G ER17070724 written Jul-17 Green Programs Recovery Charge (GPRC)-Including CA, DR, EEE, EEE Ext, S4All, S4AEXT, S4AEXT II, SLII, SLIII / Cost Recovery
Public Service Electric & Gas Company E ER17070723 written Jul-17 Solar Pilot Recovery Charge (SPRC-Solar Loan I) / Cost Recovery
Public Service Electric & Gas Company G GR17060593 written Jun-17 Margin Adjustment Charge (MAC) / Cost Recovery
Public Service Electric & Gas Company E/G ER17030324 - GR17030325 written Mar-17 Energy Strong / Revenue Requirements & Rate Design - Sixth Roll-inPublic Service Electric & Gas Company E/G EO14080897 written Mar-17 Energy Efficiency 2017 ProgramPublic Service Electric & Gas Company E ER17020136 written Feb-17 Societal Benefits Charge (SBC) / Cost RecoveryPublic Service Electric & Gas Company E EO16080788 written Aug-16 Construction of Mason St SubstationPublic Service Electric & Gas Company E ER16090918 written Sep-16 Energy Strong / Revenue Requirements & Rate Design - Fifth Roll-inPublic Service Electric & Gas Company E ER16080785 written Aug-16 Non-Utility Generation Charge (NGC) / Cost RecoveryPublic Service Electric & Gas Company G GR16070711 written Jul-16 Gas System Modernization Program (GSMP) - First Roll-InPublic Service Electric & Gas Company G GR16070617 written Jul-16 Weather Normalization Charge / Cost Recovery
Public Service Electric & Gas Company E/G ER16070613 - GR16070614 written Jul-16 Green Programs Recovery Charge (GPRC)-Including CA, DR, EEE, EEE Ext, S4All, S4AEXT, SLII, SLIII / Cost Recovery
Public Service Electric & Gas Company E ER16070616 written Jul-16 Solar Pilot Recovery Charge (SPRC-Solar Loan I) / Cost Recovery
Public Service Electric & Gas Company G GR16060484 written Jun-16 Margin Adjustment Charge (MAC) / Cost Recovery
Public Service Electric & Gas CompanyE EO16050412 written
May-16 Solar 4 All Extension II (S4Allext II) / Revenue Requirements & Rate Design
Public Service Electric & Gas Company E/G ER16030272 - GR16030273 written Mar-16 Energy Strong / Revenue Requirements & Rate Design - Fourth Roll-in
Public Service Electric & Gas Company E/GGR15111294 written
Nov-16 Remediation Adjustment Charge-RAC 23
Public Service Electric & Gas CompanyE ER15101180
written Sep-15 Energy Strong / Revenue Requirements & Rate Design - Third Roll-in
Public Service Electric & Gas Company E/G ER15070757-GR15070758 written Jul-15 Green Programs Recovery Charge (GPRC)-Including CA, DR, EEE, EEE Ext, S4All, S4AEXT, SLII, SLIII / Cost Recovery
Public Service Electric & Gas Company E ER15060754 written Jul-15 Solar Pilot Recovery Charge (SPRC-Solar Loan I) / Cost RecoveryPublic Service Electric & Gas Company G GR15060748 written Jul-15 Weather Normalization Charge / Cost RecoveryPublic Service Electric & Gas Company G GR15060646 written Jun-15 Margin Adjustment Charge (MAC) / Cost RecoveryPublic Service Electric & Gas Company E/G ER15050558 written May-15 Societal Benefits Charge (SBC) / Cost RecoveryPublic Service Electric & Gas Company E ER15050558 written May-15 Non-Utility Generation Charge (NGC) / Cost RecoveryPublic Service Electric & Gas Company E/G ER15030389-GR15030390 written Mar-15 Energy Strong / Revenue Requirements & Rate Design - Second Roll-inPublic Service Electric & Gas Company G GR15030272 written Feb-15 Gas System Modernization Program (GSMP)Public Service Electric & Gas Company E/G GR14121411 written Dec-14 Remediation Adjustment Charge-RAC 22Public Service Electric & Gas Company E/G ER14091074 written Sep-14 Energy Strong / Revenue Requirements & Rate Design - First Roll-inPublic Service Electric & Gas Company E/G EO14080897 written Aug-14 EEE Ext IIPublic Service Electric & Gas Company G ER14070656 written Jul-14 Weather Normalization Charge / Cost Recovery
Public Service Electric & Gas Company E/G ER14070651-GR14070652 written Jul-14 Green Programs Recovery Charge (GPRC)-Including CA, DR, EEE, EEE Ext, S4All, S4AEXT, SLII, SLIII / Cost Recovery
Public Service Electric & Gas Company E ER14070650 written Jul-14 Solar Pilot Recovery Charge (SPRC-Solar Loan I) / Cost RecoveryPublic Service Electric & Gas Company G GR14050511 written May-14 Margin Adjustment Charge (MAC) / Cost RecoveryPublic Service Electric & Gas Company E/G GR14040375 written Apr-14 Remediation Adjustment Charge-RAC 21
Public Service Electric & Gas Company E/G ER13070603-GR13070604 written Jun-13 Green Programs Recovery Charge (GPRC)-Including DR, EEE, EEE Ext, CA, S4All, SLII / Cost Recovery
Public Service Electric & Gas Company E ER13070605 written Jul-13 Solar Pilot Recovery Charge (SPRC-Solar Loan I) / Cost RecoveryPublic Service Electric & Gas Company G GR13070615 written Jun-13 Weather Normalization Charge / Cost RecoveryPublic Service Electric & Gas Company G GR13060445 written May-13 Margin Adjustment Charge (MAC) / Cost RecoveryPublic Service Electric & Gas Company E/G EO13020155-GO13020156 written/oral Mar-13 Energy Strong / Revenue Requirements & Rate Design - Program ApprovalPublic Service Electric & Gas Company G GO12030188 written/oral Mar-13 Appliance Service / Tariff SupportPublic Service Electric & Gas Company E ER12070599 written Jul-12 Solar Pilot Recovery Charge (SPRC-Solar Loan I) / Cost Recovery
Public Service Electric & Gas Company E/G ER12070606-GR12070605 written Jul-12 RGGI Recovery Charges (RRC)-Including DR, EEE, EEE Ext, CA, S4All, SLII / Cost Recovery
Public Service Electric & Gas Company E EO12080721 written/oral Jul-12 Solar Loan III (SLIII) / Revenue Requirements & Rate Design - Program Approval
Public Service Electric & Gas Company E EO12080721 written/oral Jul-12 Solar 4 All Extension(S4Allext) / Revenue Requirements & Rate Design - Program Approval
Public Service Electric & Gas Company G GR12060489 written Jun-12 Margin Adjustment Charge (MAC) / Cost RecoveryPublic Service Electric & Gas Company G GR12060583 written Jun-12 Weather Normalization Charge / Cost RecoveryPublic Service Electric & Gas Company E/G ER12030207 written Mar-12 Societal Benefits Charge (SBC) / Cost RecoveryPublic Service Electric & Gas Company E ER12030207 written Mar-12 Non-Utility Generation Charge (NGC) / Cost Recovery
Public Service Electric & Gas Company G GR11060338 written Jun-11 Margin Adjustment Charge (MAC) / Revenue Requirements & Rate Design - Program Approval
Public Service Electric & Gas Company G GR11060395 written Jun-11 Weather Normalization Charge / Revenue Requirements & Rate Design - Program Approval
Public Service Electric & Gas Company E EO11010030 written Jan-11 Economic Energy Efficiency Extension (EEEext) / Revenue Requirements & Rate Design - Program Approval
Public Service Electric & Gas Company E/G ER10100737 written Oct-10 RGGI Recovery Charges (RRC)-Including DR, EEE, CA, S4All, SLII / Cost Recovery
Public Service Electric & Gas Company E/G ER10080550 written Aug-10 Societal Benefits Charge (SBC) / Cost RecoveryPublic Service Electric & Gas Company E ER10080550 written Aug-10 Non-Utility Generation Charge (NGC) / Cost RecoveryPublic Service Electric & Gas Company E/G GR09050422 written/oral Mar-10 Base Rate Proceeding / Cost of Service & Rate DesignPublic Service Electric & Gas Company E ER10030220 written Mar-10 Solar Pilot Recovery Charge (SPRC-Solar Loan I) / Cost Recovery
Public Service Electric & Gas Company E EO09030249 written Mar-09 Solar Loan II(SLII) / Revenue Requirements & Rate Design - Program Approval
Public Service Electric & Gas Company E/G EO09010056 written Feb-09 Economic Energy Efficiency(EEE) / Revenue Requirements & Rate Design - Program Approval
Public Service Electric & Gas Company E EO09020125 written Feb-09 Solar 4 All (S4All) / Revenue Requirements & Rate Design - Program Approval
Public Service Electric & Gas Company E EO08080544 written Aug-08 Demand Response (DR) / Revenue Requirements & Rate Design - Program Approval
Public Service Electric & Gas Company E/G ER10100737 written Jun-08 Carbon Abatement (CA) / Revenue Requirements & Rate Design - Program Approval
LIST OF PRIOR TESTIMONIES

PSE&G Gas System Modernization Program II Schedule SS‐GSMPII‐2
Weighted Average Cost of Capital (WACC)
Pre-Tax Pre-Tax After TaxEmbedded Weighted Weighted Weighted Weighted
Percent Cost Cost Cost Cost CostOther Capital 48.1848% 4.1439% 1.9967% 1.0000 1.9967%Customer Deposits 0.6152% 0.1100% 0.0007% 1.0000 0.0007%
Sub-total 48.8000% 1.9974% 1.9974% 1.1815%
Preferred Stock 0.0000% 0.0000% 0.0000% 1.6906 0.0000% 0.0000%Common Equity 51.2000% 9.7500% 4.9920% 1.6906 8.4396% 4.9920%
Total 100.0000% 6.99% 10.44% 6.1735%
Federal Income Tax 35.00%State NJ Business Incm Tax 9.00%Tax Rate 40.8500%
ATTACHMENT 2
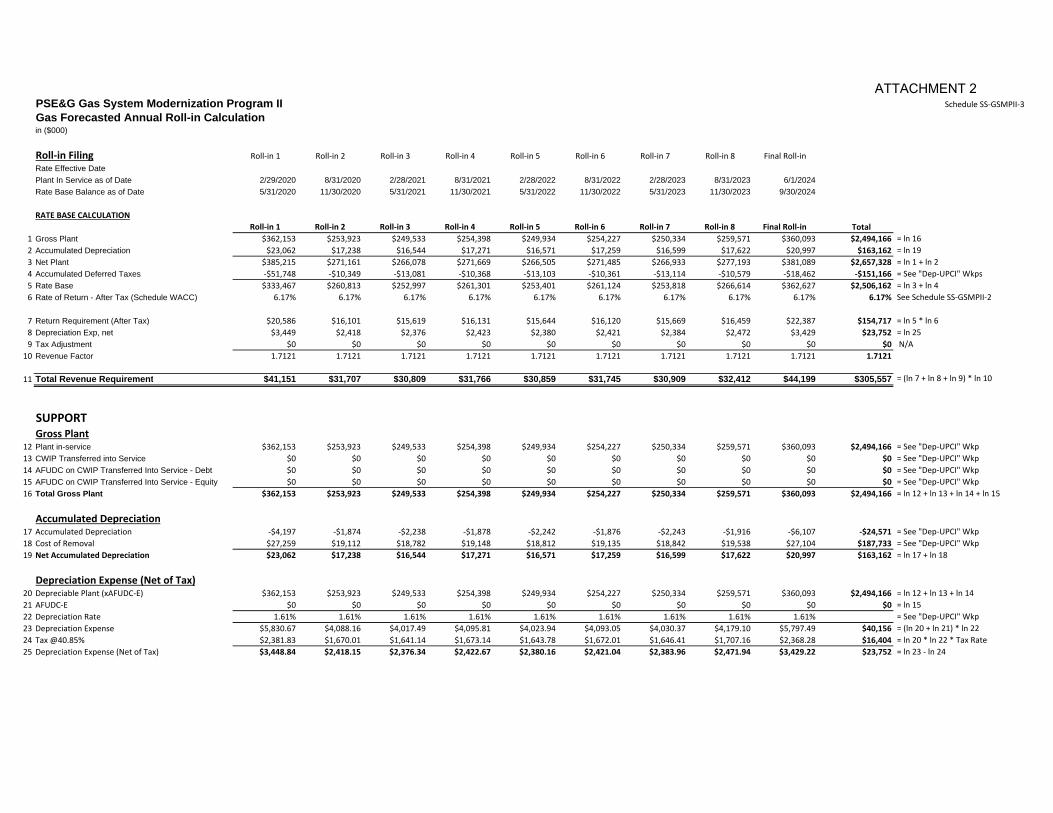
PSE&G Gas System Modernization Program II Schedule SS‐GSMPII‐3
Gas Forecasted Annual Roll-in Calculationin ($000)
Roll‐in Filing Roll‐in 1 Roll‐in 2 Roll‐in 3 Roll‐in 4 Roll‐in 5 Roll‐in 6 Roll‐in 7 Roll‐in 8 Final Roll‐in
Rate Effective DatePlant In Service as of Date 2/29/2020 8/31/2020 2/28/2021 8/31/2021 2/28/2022 8/31/2022 2/28/2023 8/31/2023 6/1/2024Rate Base Balance as of Date 5/31/2020 11/30/2020 5/31/2021 11/30/2021 5/31/2022 11/30/2022 5/31/2023 11/30/2023 9/30/2024
RATE BASE CALCULATION
Roll‐in 1 Roll‐in 2 Roll‐in 3 Roll‐in 4 Roll‐in 5 Roll‐in 6 Roll‐in 7 Roll‐in 8 Final Roll‐in Total
1 Gross Plant $362,153 $253,923 $249,533 $254,398 $249,934 $254,227 $250,334 $259,571 $360,093 $2,494,166 = ln 16
2 Accumulated Depreciation $23,062 $17,238 $16,544 $17,271 $16,571 $17,259 $16,599 $17,622 $20,997 $163,162 = ln 19
3 Net Plant $385,215 $271,161 $266,078 $271,669 $266,505 $271,485 $266,933 $277,193 $381,089 $2,657,328 = ln 1 + ln 2
4 Accumulated Deferred Taxes ‐$51,748 ‐$10,349 ‐$13,081 ‐$10,368 ‐$13,103 ‐$10,361 ‐$13,114 ‐$10,579 ‐$18,462 ‐$151,166 = See "Dep‐UPCI" Wkps
5 Rate Base $333,467 $260,813 $252,997 $261,301 $253,401 $261,124 $253,818 $266,614 $362,627 $2,506,162 = ln 3 + ln 4
6 Rate of Return - After Tax (Schedule WACC) 6.17% 6.17% 6.17% 6.17% 6.17% 6.17% 6.17% 6.17% 6.17% 6.17% See Schedule SS‐GSMPII‐2
7 Return Requirement (After Tax) $20,586 $16,101 $15,619 $16,131 $15,644 $16,120 $15,669 $16,459 $22,387 $154,717 = ln 5 * ln 6
8 Depreciation Exp, net $3,449 $2,418 $2,376 $2,423 $2,380 $2,421 $2,384 $2,472 $3,429 $23,752 = ln 25
9 Tax Adjustment $0 $0 $0 $0 $0 $0 $0 $0 $0 $0 N/A
10 Revenue Factor 1.7121 1.7121 1.7121 1.7121 1.7121 1.7121 1.7121 1.7121 1.7121 1.7121
11 Total Revenue Requirement $41,151 $31,707 $30,809 $31,766 $30,859 $31,745 $30,909 $32,412 $44,199 $305,557 = (ln 7 + ln 8 + ln 9) * ln 10
SUPPORTGross Plant
12 Plant in-service $362,153 $253,923 $249,533 $254,398 $249,934 $254,227 $250,334 $259,571 $360,093 $2,494,166 = See "Dep‐UPCI" Wkp
13 CWIP Transferred into Service $0 $0 $0 $0 $0 $0 $0 $0 $0 $0 = See "Dep‐UPCI" Wkp
14 AFUDC on CWIP Transferred Into Service - Debt $0 $0 $0 $0 $0 $0 $0 $0 $0 $0 = See "Dep‐UPCI" Wkp
15 AFUDC on CWIP Transferred Into Service - Equity $0 $0 $0 $0 $0 $0 $0 $0 $0 $0 = See "Dep‐UPCI" Wkp
16 Total Gross Plant $362,153 $253,923 $249,533 $254,398 $249,934 $254,227 $250,334 $259,571 $360,093 $2,494,166 = ln 12 + ln 13 + ln 14 + ln 15
Accumulated Depreciation17 Accumulated Depreciation ‐$4,197 ‐$1,874 ‐$2,238 ‐$1,878 ‐$2,242 ‐$1,876 ‐$2,243 ‐$1,916 ‐$6,107 ‐$24,571 = See "Dep‐UPCI" Wkp
18 Cost of Removal $27,259 $19,112 $18,782 $19,148 $18,812 $19,135 $18,842 $19,538 $27,104 $187,733 = See "Dep‐UPCI" Wkp
19 Net Accumulated Depreciation $23,062 $17,238 $16,544 $17,271 $16,571 $17,259 $16,599 $17,622 $20,997 $163,162 = ln 17 + ln 18
Depreciation Expense (Net of Tax)20 Depreciable Plant (xAFUDC‐E) $362,153 $253,923 $249,533 $254,398 $249,934 $254,227 $250,334 $259,571 $360,093 $2,494,166 = ln 12 + ln 13 + ln 14
21 AFUDC‐E $0 $0 $0 $0 $0 $0 $0 $0 $0 $0 = ln 15
22 Depreciation Rate 1.61% 1.61% 1.61% 1.61% 1.61% 1.61% 1.61% 1.61% 1.61% = See "Dep‐UPCI" Wkp
23 Depreciation Expense $5,830.67 $4,088.16 $4,017.49 $4,095.81 $4,023.94 $4,093.05 $4,030.37 $4,179.10 $5,797.49 $40,156 = (ln 20 + ln 21) * ln 22
24 Tax @40.85% $2,381.83 $1,670.01 $1,641.14 $1,673.14 $1,643.78 $1,672.01 $1,646.41 $1,707.16 $2,368.28 $16,404 = ln 20 * ln 22 * Tax Rate
25 Depreciation Expense (Net of Tax) $3,448.84 $2,418.15 $2,376.34 $2,422.67 $2,380.16 $2,421.04 $2,383.96 $2,471.94 $3,429.22 $23,752 = ln 23 ‐ ln 24
ATTACHMENT 2

Schedule SS-GSMPII-4 Page 1 of 9
Gas Rate Design (Proof of Revenue by Rate Class) Explanation of Format The summary provides by rate schedule the Annualized Weather Normalized (all customers assumed to be on BGSS) revenue based on current tariff rates and the proposed initial rate change. The detailed rate design by rate schedule follows the summary page. The pages presented in Schedule SS-GSMPII-4 are the 9 relevant pages from the complete rate change workpapers from the Company’s 2009 Gas Base Rate Case and have been appropriately modified per my testimony to reflect this GSMPII roll-in. Annualized Weather Normalized (all customers assumed to be on BGSS) and the Proposed Detailed Rate Design. In the detailed rate design pages, all the components are separated into Delivery and Supply. In addition to the Distribution components of Delivery, also included in the schedule are lines for Balancing, Societal Benefits Charge, Realignment Adjustment Charge, Margin Adjustment Charge, Weather Normalization Charge, GPRC Recovery Charge, CIP 1 Capital Adjustment Charges (CAC), Miscellaneous items, and Unbilled Revenue. Column (1) shows the annualized weather normalized billing units. Column (2) shows present Delivery rates (without Sales and Use Tax, SUT) effective July 10, 2017. The commodity rates in the Column (2) reflect the 2012 class-weighted averages (BGSS-RSG uses the rate as of 5/1/2017). Column (3) presents annualized revenue assuming all customers are provided service under their applicable BGSS provision. Column (4) repeats the billing units of Column (1). Column (5) shows the proposed rates without SUT that result in the proposed revenues shown in Column (6). Columns (7) and (8) show the proposed base rate revenue increase, in thousands of dollars and percent increase, respectively, for each of the billing unit blocks. The proposed tariff charges (with and without SUT) are provided on pages 1 and 2 of Schedule SS-GSMPII-5.
ATTACHMENT 2
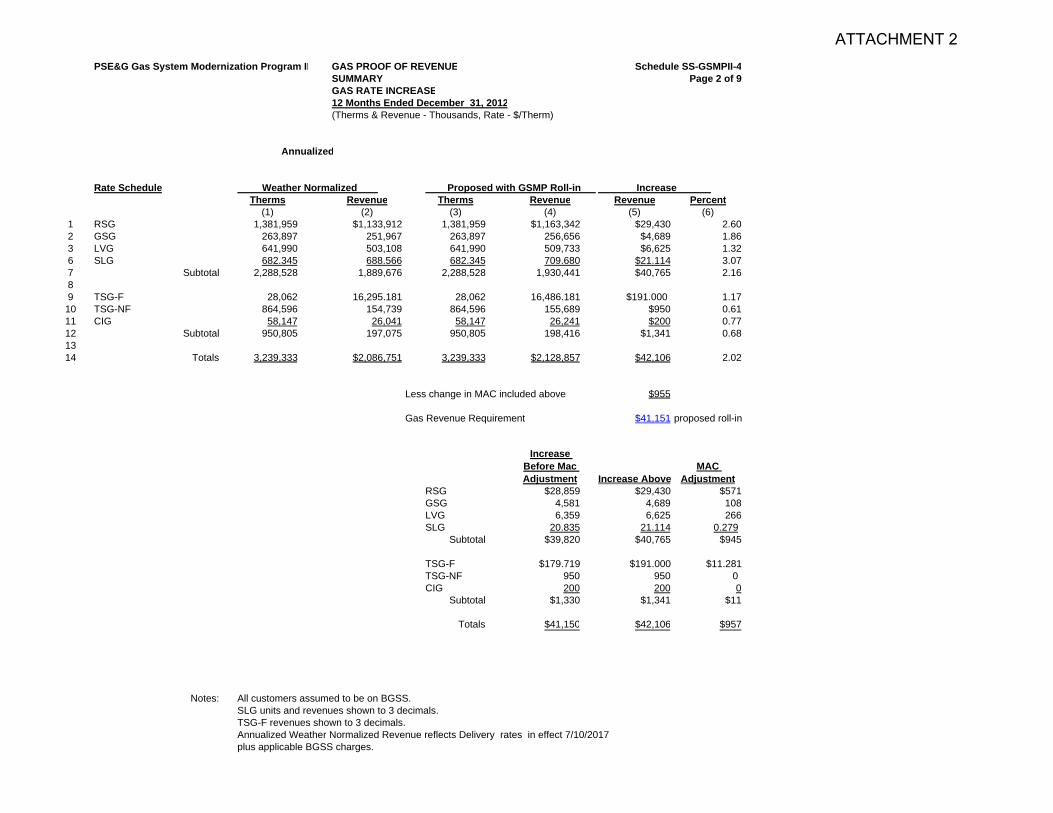
PSE&G Gas System Modernization Program II GAS PROOF OF REVENUE Schedule SS-GSMPII-4SUMMARY Page 2 of 9GAS RATE INCREASE12 Months Ended December 31, 2012(Therms & Revenue - Thousands, Rate - $/Therm)
Annualized
Rate Schedule Weather Normalized Proposed with GSMP Roll-in Increase Therms Revenue Therms Revenue Revenue Percent
(1) (2) (3) (4) (5) (6)1 RSG 1,381,959 $1,133,912 1,381,959 $1,163,342 $29,430 2.602 GSG 263,897 251,967 263,897 256,656 $4,689 1.863 LVG 641,990 503,108 641,990 509,733 $6,625 1.326 SLG 682.345 688.566 682.345 709.680 $21.114 3.077 Subtotal 2,288,528 1,889,676 2,288,528 1,930,441 $40,765 2.1689 TSG-F 28,062 16,295.181 28,062 16,486.181 $191.000 1.1710 TSG-NF 864,596 154,739 864,596 155,689 $950 0.6111 CIG 58,147 26,041 58,147 26,241 $200 0.7712 Subtotal 950,805 197,075 950,805 198,416 $1,341 0.681314 Totals 3,239,333 $2,086,751 3,239,333 $2,128,857 $42,106 2.02
Less change in MAC included above $955
Gas Revenue Requirement $41,151 proposed roll-in
Increase Before Mac Adjustment Increase Above
MAC Adjustment
RSG $28,859 $29,430 $571GSG 4,581 4,689 108LVG 6,359 6,625 266SLG 20.835 21.114 0.279
Subtotal $39,820 $40,765 $945
TSG-F $179.719 $191.000 $11.281TSG-NF 950 950 0CIG 200 200 0
Subtotal $1,330 $1,341 $11
Totals $41,150 $42,106 $957
Notes: All customers assumed to be on BGSS.SLG units and revenues shown to 3 decimals.TSG-F revenues shown to 3 decimals.Annualized Weather Normalized Revenue reflects Delivery rates in effect 7/10/2017plus applicable BGSS charges.
ATTACHMENT 2
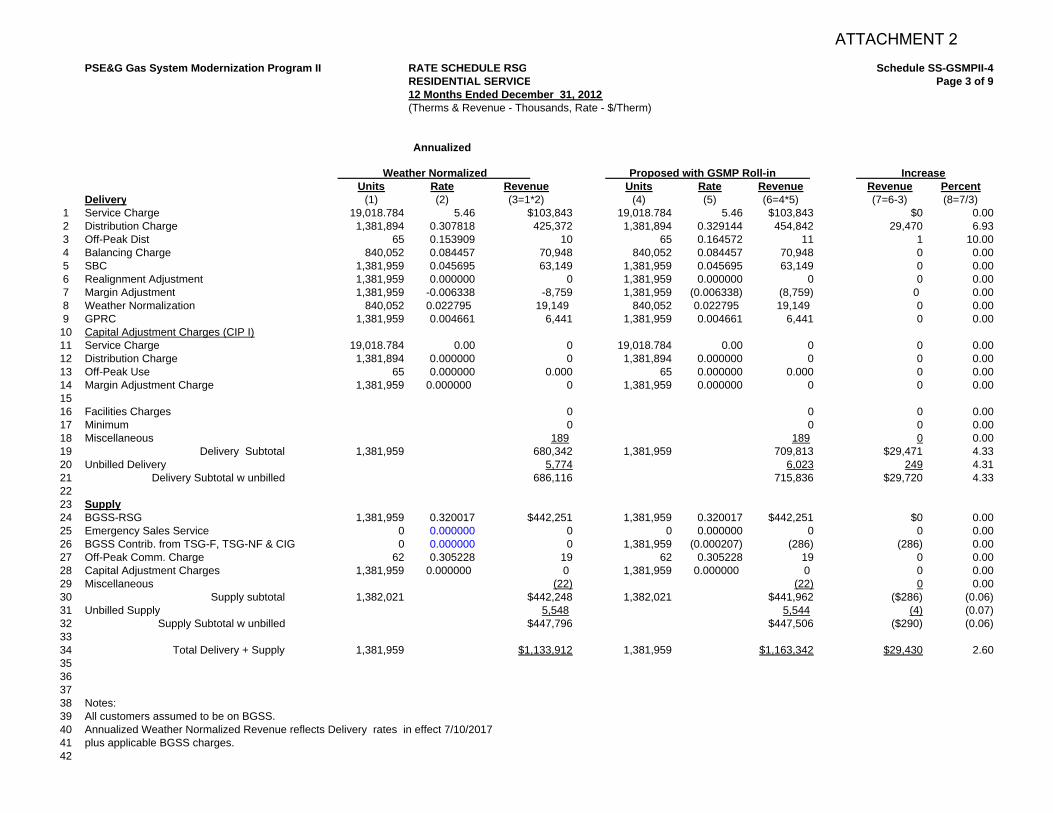
PSE&G Gas System Modernization Program II RATE SCHEDULE RSG Schedule SS-GSMPII-4RESIDENTIAL SERVICE Page 3 of 912 Months Ended December 31, 2012(Therms & Revenue - Thousands, Rate - $/Therm)
Annualized
Weather Normalized Proposed with GSMP Roll-in IncreaseUnits Rate Revenue Units Rate Revenue Revenue Percent
Delivery (1) (2) (3=1*2) (4) (5) (6=4*5) (7=6-3) (8=7/3)1 Service Charge 19,018.784 5.46 $103,843 19,018.784 5.46 $103,843 $0 0.002 Distribution Charge 1,381,894 0.307818 425,372 1,381,894 0.329144 454,842 29,470 6.933 Off-Peak Dist 65 0.153909 10 65 0.164572 11 1 10.004 Balancing Charge 840,052 0.084457 70,948 840,052 0.084457 70,948 0 0.005 SBC 1,381,959 0.045695 63,149 1,381,959 0.045695 63,149 0 0.006 Realignment Adjustment 1,381,959 0.000000 0 1,381,959 0.000000 0 0 0.007 Margin Adjustment 1,381,959 -0.006338 -8,759 1,381,959 (0.006338) (8,759) 0 0.008 Weather Normalization 840,052 0.022795 19,149 840,052 0.022795 19,149 0 0.009 GPRC 1,381,959 0.004661 6,441 1,381,959 0.004661 6,441 0 0.00
10 Capital Adjustment Charges (CIP I)11 Service Charge 19,018.784 0.00 0 19,018.784 0.00 0 0 0.0012 Distribution Charge 1,381,894 0.000000 0 1,381,894 0.000000 0 0 0.0013 Off-Peak Use 65 0.000000 0.000 65 0.000000 0.000 0 0.0014 Margin Adjustment Charge 1,381,959 0.000000 0 1,381,959 0.000000 0 0 0.001516 Facilities Charges 0 0 0 0.0017 Minimum 0 0 0 0.0018 Miscellaneous 189 189 0 0.0019 Delivery Subtotal 1,381,959 680,342 1,381,959 709,813 $29,471 4.3320 Unbilled Delivery 5,774 6,023 249 4.3121 Delivery Subtotal w unbilled 686,116 715,836 $29,720 4.332223 Supply24 BGSS-RSG 1,381,959 0.320017 $442,251 1,381,959 0.320017 $442,251 $0 0.0025 Emergency Sales Service 0 0.000000 0 0 0.000000 0 0 0.0026 BGSS Contrib. from TSG-F, TSG-NF & CIG 0 0.000000 0 1,381,959 (0.000207) (286) (286) 0.0027 Off-Peak Comm. Charge 62 0.305228 19 62 0.305228 19 0 0.0028 Capital Adjustment Charges 1,381,959 0.000000 0 1,381,959 0.000000 0 0 0.0029 Miscellaneous (22) (22) 0 0.0030 Supply subtotal 1,382,021 $442,248 1,382,021 $441,962 ($286) (0.06)31 Unbilled Supply 5,548 5,544 (4) (0.07)32 Supply Subtotal w unbilled $447,796 $447,506 ($290) (0.06)3334 Total Delivery + Supply 1,381,959 $1,133,912 1,381,959 $1,163,342 $29,430 2.60353637 38 Notes:39 All customers assumed to be on BGSS.40 Annualized Weather Normalized Revenue reflects Delivery rates in effect 7/10/201741 plus applicable BGSS charges.42
ATTACHMENT 2

PSE&G Gas System Modernization Program II RATE SCHEDULE GSG Schedule SS-GSMPII-4GENERAL SERVICE Page 4 of 912 Months Ended December 31, 2012(Therms & Revenue - Thousands, Rate - $/Therm)
Annualized
Weather Normalized Proposed with GSMP Roll-in Increase Units Rate Revenue Units Rate Revenue Revenue Percent
Delivery (1) (2) (3=1*2) (4) (5) (6=4*5) (7=6-3) (8=7/3)1 Service Charge 1,683.715 11.59 $19,514 1,683.715 12.56 $21,147 $1,633 8.372 Distribution Charge - Pre 7/14/97 2,367 0.251844 596 2,367 0.263528 624 28 4.703 Distribution Charge - All Others 261,497 0.251844 65,856 261,497 0.263528 68,912 3,056 4.644 Off-Peak Dist Charge - Pre 7/14/97 0 0.125922 0 0 0.131764 0 0 0.005 Off-Peak Dist Charge - All Others 33 0.125922 4 33 0.131764 4 0 0.006 Balancing Charge 160,049 0.084457 13,517 160,049 0.084457 13,517 0 0.007 SBC 263,897 0.045695 12,059 263,897 0.045695 12,059 0 0.008 Realignment Adjustment 263,897 0.000000 0 263,897 0.000000 0 0 0.009 Margin Adjustment 263,897 -0.006338 -1,673 263,897 (0.006338) (1,673) 0 0.00
10 Weather Normalization 160,049 0.022795 3,648 160,049 0.022795 3,648 0 0.0011 GPRC 263,897 0.004661 1,230 263,897 0.004661 1230 0 0.0012 Capital Adjustment Charges (CIP I)13 Service Charge 1,683.715 0.00 0 1,683.715 0.00 0 0 0.0014 Distribution Charge - Pre July 14, 1997 2,367 0.000000 0 2,367 0.000000 0 0 0.0015 Distribution Charge - All Others 261,497 0.000000 0 261,497 0.000000 0 0 0.0016 Off-Peak Use Dist Charge - Pre July 14, 1997 0 0.000000 0 0 0.000000 0 0 0.0017 Off-Peak Use Dist Charge - All Others 33 0.000000 0 33 0.000000 0 0 0.0018 Margin Adjustment Charge 263,897 0.000000 0 263,897 0.000000 0 0 0.001920 Facilities Charges 0 0 0 0.0021 Minimum 6 6 0 0.0022 Miscellaneous (1,275) (1,275) 0 0.0023 Delivery Subtotal 263,897 $113,482 263,897 $118,199 $4,717 4.1624 Unbilled Delivery 68 70 2 2.9425 Delivery Subtotal w unbilled $113,550 $118,269 $4,719 4.162627 Supply 28 BGSS 263,897 0.526198 $138,862 263,897 0.526198 $138,862 $0 0.0029 Emergency Sales Service 0 0.000000 0 0 0.000000 0 0 0.0030 BGSS Contrib. from TSG-F, TSG-NF & CIG 0 0.000000 0 263,897 (0.000115) (30) (30) 031 Capital Adjustment Charges 263,897 0.000000 0 263,897 0.000000 0 0 032 Miscellaneous (1,705) (1,705) 0 0.0033 Supply subtotal 263,897 $137,157 263,897 $137,127 (30) (0.02)34 Unbilled Supply 1,260 1,260 0 0.0035 Supply Subtotal w unbilled $138,417 $138,387 (30) (0.02)3637 Total Delivery + Supply 263,897 $251,967 263,897 $256,656 $4,689 1.8638394041 Notes:42 All customers assumed to be on BGSS.43 Annualized Weather Normalized Revenue reflects Delivery rates in effect 7/10/201744 plus applicable BGSS charges.45
ATTACHMENT 2

PSE&G Gas System Modernization Program II RATE SCHEDULE LVG Schedule SS-GSMPII-4LARGE VOLUME SERVICE Page 5 of 912 Months Ended December 31, 2012(Therms & Revenue - Thousands, Rate - $/Therm)
Annualized
Weather Normalized Proposed with GSMP Roll-in Increase Units Rate Revenue Units Rate Revenue Revenue Percent
Delivery (1) (2) (3=1*2) (4) (5) (6=4*5) (7=6-3) (8=7/3)1 Service Charge 221.074 100.12 $22,134 221.074 100.12 $22,134 $0 0.002 Demand Charge 17,876 3.8295 68,456 17,876 4.0972 73,242 4,786 6.993 Distribution Charge 0-1,000 pre 7/14/97 10,437 0.044153 461 10,437 0.049467 516 55 11.934 Distribution Charge over 1,000 pre 7/14/97 57,522 0.039804 2,290 57,522 0.041913 2,411 121 5.285 Distribution Charge 0-1,000 post 7/14/97 138,521 0.044153 6,116 138,521 0.049467 6,852 736 12.036 Distribution Charge over 1,000 post 7/14/97 435,510 0.039804 17,335 435,510 0.041913 18,254 919 5.307 Balancing Charge 321,889 0.084457 27,186 321,889 0.084457 27,186 0 0.008 SBC 641,990 0.045695 29,336 641,990 0.045695 29,336 0 0.009 Realignment Adjustment 641,990 0.000000 0 641,990 0.000000 0 0 0.0010 Margin Adjustment 641,990 (0.006338) -4,069 641,990 (0.006338) (4069) 0 0.0011 Weather Normalization 321,889 0.022795 7,337 321,889 0.022795 7,337 0 0.0012 GPRC 641,990 0.004661 2,992 641,990 0.004661 2,992 0 0.0013 Capital Adjustment Charges (CIP I)14 Service Charge 221.074 0.00 0 221.074 0.00 0 0 0.0015 Demand Charge 17,876 0.0000 0 17,876 0.0000 0 0 0.0016 Distribution Charge 0-1,000 pre July 14, 1997 10,437 0.000000 0 10,437 0.000000 0 0 0.0017 Distribution Charge over 1,000 pre July 14, 1997 57,522 0.000000 0 57,522 0.000000 0 0 0.0018 Distribution Charge 0-1,000 post July 14, 1997 138,521 0.000000 0 138,521 0.000000 0 0 0.0019 Distribution Charge over 1,000 post July 14, 1997 435,510 0.000000 0 435,510 0.000000 0 0 0.0020 Margin Adjustment Charge 641,990 0.000000 0 641,990 0.000000 0 0 0.002122 Facilities Charges 0 0 0 0.0023 Minimum 227 227 0 0.0024 Miscellaneous (764) (764) 0 0.0025 Delivery Subtotal 641,990 179,037 641,990 185,654 $6,617 3.7026 Unbilled Delivery 2,100 2,178 78 3.7127 Delivery Subtotal w unbilled $181,137 $187,832 $6,695 3.70282930 Supply31 BGSS 641,990 0.523527 $336,099 641,990 0.523527 $336,099 $0 0.0032 Emergency Sales Service 0 0.000000 0 0 0.000000 0 0 0.0033 BGSS Contrib. from TSG-F, TSG-NF & CIG 0 0.000000 0 641,990 (0.000115) (74) (74) 0.0034 Capital Adjustment Charges 641,990 0.000000 0 641,990 0.000000 0 0 0.0035 Miscellaneous 2,184 2,184 0 0.0036 Supply Subtotal 641,990 $338,283 641,990 $338,209 (74) (0.02)37 Unbilled Supply (16,312) (16,308) 4 (0.02)38 Supply Subtotal w unbilled $321,971 $321,901 (70) (0.02)3940 Total Delivery + Supply 641,990 $503,108 641,990 $509,733 $6,625 1.32414243 44 Notes:45 All customers assumed to be on BGSS.46 Annualized Weather Normalized Revenue reflects Delivery rates in effect 7/10/201747 plus applicable BGSS charges.48
ATTACHMENT 2

PSE&G Gas System Modernization Program II RATE SCHEDULE SLG Schedule SS-GSMPII-4STREET LIGHTING SERVICE Page 6 of 912 Months Ended December 31, 2012(Therms & Revenue - Thousands, Rate - $/Therm)
Annualized
Weather Normalized Proposed with GSMP Roll-in Increase Units Rate Revenue Units Rate Revenue Revenue Percent
Delivery (1) (2) (3=1*2) (4) (5) (6=4*5) (7=6-3) (8=7/3)1 Single 10.392 9.6316 $100.092 10.392 9.6316 $100.092 $0.000 0.002 Double Inverted 0.108 9.4856 1.024 0.108 9.4856 1.024 0.000 0.003 Double Upright 0.588 8.3906 4.934 0.588 8.3906 4.934 0.000 0.004 Triple prior to 1/1/93 18.156 9.4856 172.221 18.156 9.4856 172.221 0.000 0.005 Triple on and after 1/1/93 0.432 61.9958 26.782 0.432 61.9958 26.782 0.000 0.006 Distribution Therm Charge 682.345 0.094750 64.652 682.345 0.125807 85.844 21.192 32.7878 SBC 682.345 0.045695 31.180 682.345 0.045695 31.180 0.000 0.009 Realignment Adjustment 682.345 0.000000 0.000 682.345 0.000000 0.000 0.000 0.0010 Margin Adjustment 682.345 (0.006338) (4.325) 682.345 (0.006338) (4.325) 0.000 0.001112 GPRC 682.345 0.004661 3.180 682.345 0.004661 3.180 0.000 0.0013 Capital Adjustment Charges (CIP I)14 Single-Mantle Lamp 10.392 0.0000 0.000 10.392 0.0000 0.000 0.000 0.0015 Double-Mantle Lamp, inverted 0.108 0.0000 0.000 0.108 0.0000 0.000 0.000 0.0016 Double Mantle Lamp, upright 0.588 0.0000 0.000 0.588 0.0000 0.000 0.000 0.0017 Triple-Mantle Lamp, prior to January 1, 19933 18.156 0.0000 0.000 18.156 0.000000 0 0 0.0018 Triple-Mantle Lamp, on and after January 1, 1993 0.432 0.0000 0.000 0.432 0.0000 0.000 0.000 0.0019 Distribution Therm Charge 682.345 0.000000 0.000 682.345 0.000000 0.000 0.000 0.0020 Margin Adjustment Charge 682.345 0.000000 0.000 682.345 0.000000 0.000 0.000 0.002122 Facilities Charges 0.000 0.000 0.000 0.0023 Minimum 0.000 0.000 0.000 0.0024 Miscellaneous 15.746 15.746 0.000 0.0025 Delivery Subtotal 682.345 $415.486 682.345 $436.678 $21.192 5.1026 Unbilled Delivery 0.000 0.000 0.000 0.0027 Delivery Subtotal w unbilled $415.486 $436.678 $21.192 5.102829 Supply30 BGSS 682.063 0.511642 $348.972 682.063 0.511642 $348.972 $0.000 0.0031 Emergency Sales Service 0.000 0.000000 0.000 0.000 0.000000 0.000 0.000 0.0032 BGSS Contrib. from TSG-F, TSG-NF & CIG 0.000 0.000000 0.000 682.345 (0.000115) (0.078) (0.078) 0.0033 Capital Adjustment Charges 682.345 0.000000 0.000 682.345 0.000000 0.000 0.000 0.0034 Miscellaneous (75.892) (75.892) 0.000 0.0035 Supply Subtotal 682.063 $273.080 682.063 $273.002 ($0.078) (0.03)36 Unbilled Supply 0.000 0.000 0.000 0.0037 Supply Subtotal w unbilled $273.080 $273.002 ($0.078) (0.03)3839 Total Delivery + Supply 682.345 $688.566 682.345 $709.680 $21.114 3.0740414243 Notes:44 All customers assumed to be on BGSS.45 SLG units and revenues shown to 3 decimals.46 Annualized Weather Normalized Revenue reflects Delivery rates in effect 7/10/201747 plus applicable BGSS charges.48
ATTACHMENT 2

PSE&G Gas System Modernization Program II RATE SCHEDULE TSG-F Schedule SS-GSMPII-4FIRM TRANSPORTATION GAS SERVICE Page 7 of 912 Months Ended December 31, 2012(Therms & Revenue - Thousands, Rate - $/Therm)
Annualized
Weather Normalized Proposed with GSMP Roll-in Increase Units Rate Revenue Units Rate Revenue Revenue Percent
Delivery (1) (2) (3=1*2) (4) (5) (6=4*5) (7=6-3) (8=7/3)1 Service Charge 0.622 550.09 $342.156 0.622 596.18 $370.824 $28.668 8.382 Demand Charge 575 1.8880 1,085.600 575 1.9911 1,144.883 59.283 5.463 Demand Charge, Agreements 16 1.6563 26.501 16 1.6563 26.501 0.000 0.004 Distribution Charge 27,094 0.072167 1,955.293 27,094 0.076109 2,062.097 106.804 5.465 Distribution Charge, Agreements 968 0.031380 30.376 968 0.031380 30.376 0.000 0.006 SBC 27,094 0.045695 1,238.060 27,094 0.045695 1,238.060 0.000 0.007 SBC, Agreements 968 0.050438 48.824 968 0.050438 48.824 0.000 0.008 Margin Adjustment 27,094 (0.006338) (171.722) 27,094 (0.006338) (171.722) 0.000 0.009 Margin Adjustment, Agreements 968 (0.006338) (6.135) 968 (0.006338) (6.135) 0.000 0.001011 GPRC 27,094 0.004661 126.285 27,094 0.004661 126 0 0.0012 GPRC, Agreements 968 0.003908 3.783 968 0.003908 3.783 0.000 0.0013 Capital Adjustment Charges (CIP I)14 Service Charge 0.622 0.00 0.000 0.622 0.00 0.000 0.000 0.0015 Demand Charge 575 0.0000 0.000 575 0.0000 0.000 0.000 0.0016 Demand Charge, Agreements 16 0.0000 0.000 16 0.0000 0.000 0.000 0.0017 Distribution Charge 27,094 0.000000 0.000 27,094 0.000000 0.000 0.000 0.0018 Distribution Charge, Agreements 968 0.000000 0.000 968 0.000000 0.000 0.000 0.0019 Margin Adjustment Charge 27,094 0.000000 0.000 27,094 0.000000 0.000 0.000 0.0020 Margin Adjustment Charge, Agreements 968 0.000000 0.000 968 0.000000 0.000 0.000 0.002122 Facilities Charges 0.000 0.000 0.000 0.0023 Minimum 0.000 0.000 0.000 0.0024 Miscellaneous (20.523) (20.492) 0.031 -0.1525 Delivery Subtotal 28,062 4,658.498 28,062 4,853.284 $194.786 4.1826 Unbilled Delivery (90.542) (94.328) (3.786) 4.1827 Delivery Subtotal w unbilled $4,567.956 $4,758.956 $191.000 4.182829 Supply30 Commodity Charge, BGSS-F 27,094 0.515243 $13,960.000 27,094 0.515243 $13,960.000 $0.000 0.0031 Emergency Sales Service 0 0.000000 0.000 0 0.000000 0.000 0.000 0.0032 Miscellaneous 0.000 0.000 0.000 0.0033 Supply Subtotal 27,094 $13,960.000 27,094 $13,960.000 $0.000 0.0034 Unbilled Supply (2,232.775) (2,232.775) 0.000 0.0035 Supply Subtotal w unbilled $11,727.225 $11,727.225 $0.000 0.003637 Total Delivery + Supply 28,062 $16,295.181 28,062 $16,486.181 $191.000 1.1738394041 Notes:42 All customers assumed to be on BGSS.43 TSG-F revenues shown to 3 decimals.44 Annualized Weather Normalized Revenue reflects Delivery rates in effect 7/10/201745 plus applicable BGSS charges.46
ATTACHMENT 2
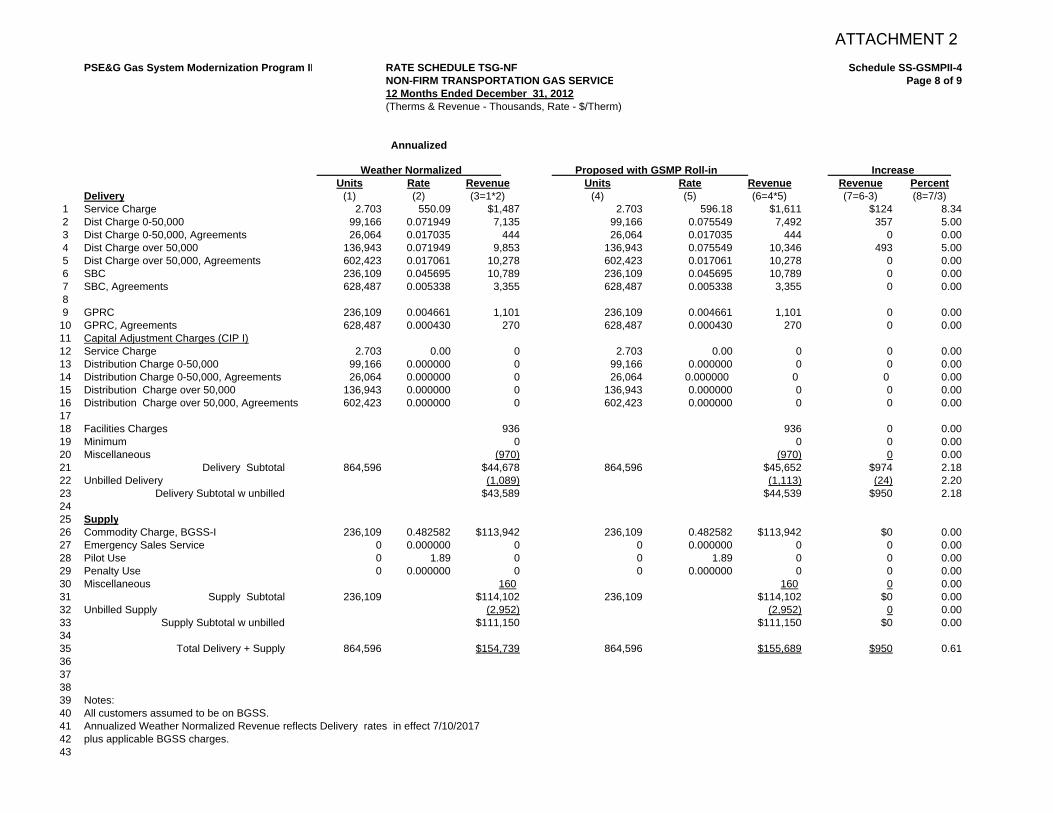
PSE&G Gas System Modernization Program II RATE SCHEDULE TSG-NF Schedule SS-GSMPII-4NON-FIRM TRANSPORTATION GAS SERVICE Page 8 of 912 Months Ended December 31, 2012(Therms & Revenue - Thousands, Rate - $/Therm)
Annualized
Weather Normalized Proposed with GSMP Roll-in Increase Units Rate Revenue Units Rate Revenue Revenue Percent
Delivery (1) (2) (3=1*2) (4) (5) (6=4*5) (7=6-3) (8=7/3)1 Service Charge 2.703 550.09 $1,487 2.703 596.18 $1,611 $124 8.342 Dist Charge 0-50,000 99,166 0.071949 7,135 99,166 0.075549 7,492 357 5.003 Dist Charge 0-50,000, Agreements 26,064 0.017035 444 26,064 0.017035 444 0 0.004 Dist Charge over 50,000 136,943 0.071949 9,853 136,943 0.075549 10,346 493 5.005 Dist Charge over 50,000, Agreements 602,423 0.017061 10,278 602,423 0.017061 10,278 0 0.006 SBC 236,109 0.045695 10,789 236,109 0.045695 10,789 0 0.007 SBC, Agreements 628,487 0.005338 3,355 628,487 0.005338 3,355 0 0.0089 GPRC 236,109 0.004661 1,101 236,109 0.004661 1,101 0 0.00
10 GPRC, Agreements 628,487 0.000430 270 628,487 0.000430 270 0 0.0011 Capital Adjustment Charges (CIP I)12 Service Charge 2.703 0.00 0 2.703 0.00 0 0 0.0013 Distribution Charge 0-50,000 99,166 0.000000 0 99,166 0.000000 0 0 0.0014 Distribution Charge 0-50,000, Agreements 26,064 0.000000 0 26,064 0.000000 0 0 0.0015 Distribution Charge over 50,000 136,943 0.000000 0 136,943 0.000000 0 0 0.0016 Distribution Charge over 50,000, Agreements 602,423 0.000000 0 602,423 0.000000 0 0 0.001718 Facilities Charges 936 936 0 0.0019 Minimum 0 0 0 0.0020 Miscellaneous (970) (970) 0 0.0021 Delivery Subtotal 864,596 $44,678 864,596 $45,652 $974 2.1822 Unbilled Delivery (1,089) (1,113) (24) 2.2023 Delivery Subtotal w unbilled $43,589 $44,539 $950 2.182425 Supply26 Commodity Charge, BGSS-I 236,109 0.482582 $113,942 236,109 0.482582 $113,942 $0 0.0027 Emergency Sales Service 0 0.000000 0 0 0.000000 0 0 0.0028 Pilot Use 0 1.89 0 0 1.89 0 0 0.0029 Penalty Use 0 0.000000 0 0 0.000000 0 0 0.0030 Miscellaneous 160 160 0 0.0031 Supply Subtotal 236,109 $114,102 236,109 $114,102 $0 0.0032 Unbilled Supply (2,952) (2,952) 0 0.0033 Supply Subtotal w unbilled $111,150 $111,150 $0 0.003435 Total Delivery + Supply 864,596 $154,739 864,596 $155,689 $950 0.6136373839 Notes:40 All customers assumed to be on BGSS.41 Annualized Weather Normalized Revenue reflects Delivery rates in effect 7/10/201742 plus applicable BGSS charges.43
ATTACHMENT 2
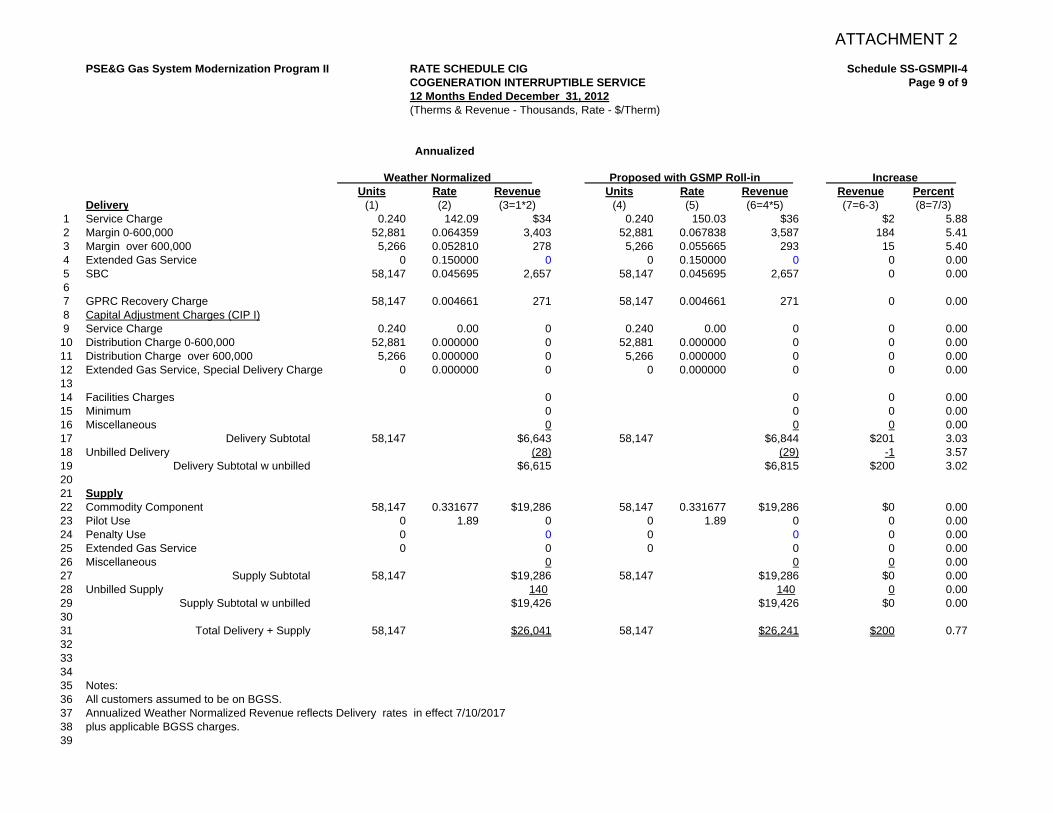
PSE&G Gas System Modernization Program II RATE SCHEDULE CIG Schedule SS-GSMPII-4COGENERATION INTERRUPTIBLE SERVICE Page 9 of 912 Months Ended December 31, 2012(Therms & Revenue - Thousands, Rate - $/Therm)
Annualized
Weather Normalized Proposed with GSMP Roll-in Increase Units Rate Revenue Units Rate Revenue Revenue Percent
Delivery (1) (2) (3=1*2) (4) (5) (6=4*5) (7=6-3) (8=7/3)1 Service Charge 0.240 142.09 $34 0.240 150.03 $36 $2 5.882 Margin 0-600,000 52,881 0.064359 3,403 52,881 0.067838 3,587 184 5.413 Margin over 600,000 5,266 0.052810 278 5,266 0.055665 293 15 5.404 Extended Gas Service 0 0.150000 0 0 0.150000 0 0 0.005 SBC 58,147 0.045695 2,657 58,147 0.045695 2,657 0 0.0067 GPRC Recovery Charge 58,147 0.004661 271 58,147 0.004661 271 0 0.008 Capital Adjustment Charges (CIP I)9 Service Charge 0.240 0.00 0 0.240 0.00 0 0 0.0010 Distribution Charge 0-600,000 52,881 0.000000 0 52,881 0.000000 0 0 0.0011 Distribution Charge over 600,000 5,266 0.000000 0 5,266 0.000000 0 0 0.0012 Extended Gas Service, Special Delivery Charge 0 0.000000 0 0 0.000000 0 0 0.001314 Facilities Charges 0 0 0 0.0015 Minimum 0 0 0 0.0016 Miscellaneous 0 0 0 0.0017 Delivery Subtotal 58,147 $6,643 58,147 $6,844 $201 3.0318 Unbilled Delivery (28) (29) -1 3.5719 Delivery Subtotal w unbilled $6,615 $6,815 $200 3.022021 Supply22 Commodity Component 58,147 0.331677 $19,286 58,147 0.331677 $19,286 $0 0.0023 Pilot Use 0 1.89 0 0 1.89 0 0 0.0024 Penalty Use 0 0 0 0 0 0.0025 Extended Gas Service 0 0 0 0 0 0.0026 Miscellaneous 0 0 0 0.0027 Supply Subtotal 58,147 $19,286 58,147 $19,286 $0 0.0028 Unbilled Supply 140 140 0 0.0029 Supply Subtotal w unbilled $19,426 $19,426 $0 0.003031 Total Delivery + Supply 58,147 $26,041 58,147 $26,241 $200 0.7732333435 Notes:36 All customers assumed to be on BGSS.37 Annualized Weather Normalized Revenue reflects Delivery rates in effect 7/10/201738 plus applicable BGSS charges.39
ATTACHMENT 2

PSE&G Gas System Modernization Program II Schedule SS-GSMPII-5Gas Annual Tariff Rate Summary Page 1 of 2
6/1/2020 12/1/2020 6/1/2021 12/1/2021
Rate ScheduleCharge w/o
SUT
Charge Including
SUTCharge w/o
SUT
Charge Including
SUTCharge w/o
SUT
Charge Including
SUTCharge w/o
SUT
Charge Including
SUTCharge w/o
SUT
Charge Including
SUTRSG Service Charge $5.46 $5.84 $5.46 $5.84 $5.46 $5.84 $5.46 $5.84 $5.46 $5.84
Distribution Charges $0.307818 $0.328980 $0.329144 $0.351773 $0.345573 $0.369331 $0.361535 $0.386391 $0.377991 $0.403978Balancing Charge $0.084457 $0.090263 $0.084457 $0.090263 $0.084457 $0.090263 $0.084457 $0.090263 $0.084457 $0.090263Off-Peak Use $0.153909 $0.164490 $0.164572 $0.175886 $0.172787 $0.184666 $0.180768 $0.193196 $0.188996 $0.201989
GSG Service Charge $11.59 $12.39 $12.56 $13.42 $13.33 $14.25 $14.09 $15.06 $14.89 $15.91Distribution Charge - Pre July 14, 1997 $0.251844 $0.269158 $0.263528 $0.281646 $0.272380 $0.291106 $0.280903 $0.300215 $0.289589 $0.309498Distribution Charge - All Others $0.251844 $0.269158 $0.263528 $0.281646 $0.272380 $0.291106 $0.280903 $0.300215 $0.289589 $0.309498Balancing Charge $0.084457 $0.090263 $0.084457 $0.090263 $0.084457 $0.090263 $0.084457 $0.090263 $0.084457 $0.090263Off-Peak Use Dist Charge - Pre July 14, 1997 $0.125922 $0.134579 $0.131764 $0.140823 $0.136190 $0.145553 $0.140452 $0.150108 $0.144795 $0.154750Off-Peak Use Dist Charge - All Others $0.125922 $0.134579 $0.131764 $0.140823 $0.136190 $0.145553 $0.140452 $0.150108 $0.144795 $0.154750
LVG Service Charge $100.12 $107.00 $100.12 $107.00 $100.12 $107.00 $100.12 $107.00 $100.12 $107.00Demand Charge $3.8295 $4.0928 $4.0972 $4.3789 $4.3036 $4.5995 $4.5043 $4.8140 $4.7114 $5.0353Distribution Charge 0-1,000 pre July 14, 1997 $0.044153 $0.047189 $0.049467 $0.052868 $0.053327 $0.056993 $0.056932 $0.060846 $0.060484 $0.064642Distribution Charge over 1,000 pre July 14, 1997 $0.039804 $0.042541 $0.041913 $0.044795 $0.043611 $0.046609 $0.045306 $0.048421 $0.047105 $0.050343Distribution Charge 0-1,000 post July 14, 1997 $0.044153 $0.047189 $0.049467 $0.052868 $0.053327 $0.056993 $0.056932 $0.060846 $0.060484 $0.064642Distribution Charge over 1,000 post July 14, 1997 $0.039804 $0.042541 $0.041913 $0.044795 $0.043611 $0.046609 $0.045306 $0.048421 $0.047105 $0.050343Balancing Charge $0.084457 $0.090263 $0.084457 $0.090263 $0.084457 $0.090263 $0.084457 $0.090263 $0.084457 $0.090263
SLG Single-Mantle Lamp $9.6316 $10.2938 $9.6316 $10.2938 $9.6316 $10.2938 $9.6316 $10.2938 $9.6316 $10.2938Double-Mantle Lamp, inverted $9.4856 $10.1377 $9.4856 $10.1377 $9.4856 $10.1377 $9.4856 $10.1377 $9.4856 $10.1377Double Mantle Lamp, upright $8.3906 $8.9675 $8.3906 $8.9675 $8.3906 $8.9675 $8.3906 $8.9675 $8.3906 $8.9675Triple-Mantle Lamp, prior to January 1, 19933 $9.4856 $10.1377 $9.4856 $10.1377 $9.4856 $10.1377 $9.4856 $10.1377 $9.4856 $10.1377Triple-Mantle Lamp, on and after January 1, 1993 $61.9958 $66.2580 $61.9958 $66.2580 $61.9958 $66.2580 $61.9958 $66.2580 $61.9958 $66.2580Distribution Therm Charge $0.094750 $0.101264 $0.125807 $0.134456 $0.149720 $0.160013 $0.172942 $0.184832 $0.196873 $0.210408
TSG-F Service Charge $550.09 $587.91 $596.18 $637.17 $632.64 $676.13 $668.76 $714.74 $706.68 $755.26Demand Charge $1.8880 $2.0178 $1.9911 $2.1280 $2.0707 $2.2131 $2.1473 $2.2949 $2.2264 $2.3795Distribution Charges $0.072167 $0.077128 $0.076109 $0.081341 $0.079153 $0.084595 $0.082081 $0.087724 $0.085103 $0.090954
TSG-NF Service Charge $550.09 $587.91 $596.18 $637.17 $632.64 $676.13 $668.76 $714.74 $706.68 $755.26Distribution Charge 0-50,000 $0.071949 $0.076895 $0.075549 $0.080743 $0.078298 $0.083681 $0.080958 $0.086524 $0.083690 $0.089444Distribution Charge over 50,000 $0.071949 $0.076895 $0.075549 $0.080743 $0.078298 $0.083681 $0.080958 $0.086524 $0.083690 $0.089444
Special Provision (d) $1.89 $2.02 $1.89 $2.02 $1.89 $2.02 $1.89 $2.02 $1.89 $2.02
CIG Service Charge $142.09 $151.86 $150.03 $160.34 $156.15 $166.89 $162.09 $173.23 $168.22 $179.79Distribution Charge 0-600,000 $0.064359 $0.068784 $0.067838 $0.072502 $0.070531 $0.075380 $0.073118 $0.078145 $0.075810 $0.081022Distribution Charge over 600,000 $0.052810 $0.056441 $0.055665 $0.059492 $0.057874 $0.061853 $0.059997 $0.064122 $0.062206 $0.066483
Special Provision (c) 1st para $1.89 $2.02 $1.89 $2.02 $1.89 $2.02 $1.89 $2.02 $1.89 $2.02
BGSS RSG Commodity Charge including Losses $0.317575 $0.339408 $0.317367 $0.339186 $0.317206 $0.339014 $0.317050 $0.338847 $0.316890 $0.338676
CSG Service Charge 550.09$ 587.91$ 596.18$ 637.17$ 632.64$ 676.13$ 668.76$ 714.74$ 706.68$ 755.26$
Present
ATTACHMENT 2

PSE&G Gas System Modernization Program IIGas Annual Tariff Rate Summary
Rate ScheduleRSG Service Charge
Distribution ChargesBalancing ChargeOff-Peak Use
GSG Service ChargeDistribution Charge - Pre July 14, 1997Distribution Charge - All OthersBalancing ChargeOff-Peak Use Dist Charge - Pre July 14, 1997Off-Peak Use Dist Charge - All Others
LVG Service ChargeDemand ChargeDistribution Charge 0-1,000 pre July 14, 1997Distribution Charge over 1,000 pre July 14, 1997Distribution Charge 0-1,000 post July 14, 1997Distribution Charge over 1,000 post July 14, 1997Balancing Charge
SLG Single-Mantle LampDouble-Mantle Lamp, invertedDouble Mantle Lamp, uprightTriple-Mantle Lamp, prior to January 1, 19933Triple-Mantle Lamp, on and after January 1, 1993Distribution Therm Charge
TSG-F Service ChargeDemand ChargeDistribution Charges
TSG-NF Service ChargeDistribution Charge 0-50,000Distribution Charge over 50,000
Special Provision (d)
CIG Service ChargeDistribution Charge 0-600,000Distribution Charge over 600,000
Special Provision (c) 1st para
BGSS RSG Commodity Charge including Losses
CSG Service Charge
Schedule SS-GSMPII-5Page 2 of 2
6/1/2022 12/1/2022 6/1/2023 12/1/2023
Charge w/o SUT
Charge Including
SUTCharge w/o
SUT
Charge Including
SUTCharge w/o
SUT
Charge Including
SUTCharge w/o
SUT
Charge Including
SUTCharge w/o
SUT
Charge Including
SUT$5.46 $5.84 $5.46 $5.84 $5.46 $5.84 $5.46 $5.84 $5.46 $5.84
$0.393975 $0.421061 $0.410416 $0.438632 $0.426427 $0.455744 $0.443217 $0.473688 $0.466110 $0.498155$0.084457 $0.090263 $0.084457 $0.090263 $0.084457 $0.090263 $0.084457 $0.090263 $0.084457 $0.090263$0.196988 $0.210531 $0.205209 $0.219317 $0.213215 $0.227874 $0.221610 $0.236846 $0.233056 $0.249079
$15.68 $16.76 $16.51 $17.65 $17.33 $18.52 $18.20 $19.45 $19.41 $20.74$0.297941 $0.318424 $0.306426 $0.327493 $0.314612 $0.336242 $0.323131 $0.345346 $0.334598 $0.357602$0.297941 $0.318424 $0.306426 $0.327493 $0.314612 $0.336242 $0.323131 $0.345346 $0.334598 $0.357602$0.084457 $0.090263 $0.084457 $0.090263 $0.084457 $0.090263 $0.084457 $0.090263 $0.084457 $0.090263$0.148971 $0.159213 $0.153213 $0.163746 $0.157306 $0.168121 $0.161566 $0.172674 $0.167299 $0.178801$0.148971 $0.159213 $0.153213 $0.163746 $0.157306 $0.168121 $0.161566 $0.172674 $0.167299 $0.178801
$100.12 $107.00 $100.12 $107.00 $100.12 $107.00 $100.12 $107.00 $100.12 $107.00$4.9127 $5.2504 $5.1199 $5.4719 $5.3218 $5.6877 $5.5337 $5.9141 $5.8228 $6.2231
$0.063809 $0.068196 $0.067059 $0.071669 $0.070083 $0.074901 $0.073165 $0.078195 $0.077113 $0.082415$0.048897 $0.052259 $0.050790 $0.054282 $0.052681 $0.056303 $0.054684 $0.058444 $0.057503 $0.061456$0.063809 $0.068196 $0.067059 $0.071669 $0.070083 $0.074901 $0.073165 $0.078195 $0.077113 $0.082415$0.048897 $0.052259 $0.050790 $0.054282 $0.052681 $0.056303 $0.054684 $0.058444 $0.057503 $0.061456$0.084457 $0.090263 $0.084457 $0.090263 $0.084457 $0.090263 $0.084457 $0.090263 $0.084457 $0.090263
$9.6316 $10.2938 $9.6316 $10.2938 $9.6316 $10.2938 $9.6316 $10.2938 $9.6316 $10.2938$9.4856 $10.1377 $9.4856 $10.1377 $9.4856 $10.1377 $9.4856 $10.1377 $9.4856 $10.1377$8.3906 $8.9675 $8.3906 $8.9675 $8.3906 $8.9675 $8.3906 $8.9675 $8.3906 $8.9675$9.4856 $10.1377 $9.4856 $10.1377 $9.4856 $10.1377 $9.4856 $10.1377 $9.4856 $10.1377
$61.9958 $66.2580 $61.9958 $66.2580 $61.9958 $66.2580 $61.9958 $66.2580 $61.9958 $66.2580$0.220106 $0.235238 $0.243995 $0.260770 $0.252199 $0.269538 $0.260806 $0.278736 $0.272550 $0.291288
$744.19 $795.35 $783.43 $837.29 $822.29 $878.82 $863.69 $923.07 $921.06 $984.38$2.3025 $2.4608 $2.3811 $2.5448 $2.4573 $2.6262 $2.5376 $2.7121 $2.6465 $2.8284
$0.088010 $0.094061 $0.091013 $0.097270 $0.093925 $0.100382 $0.096993 $0.103661 $0.101156 $0.108110
$744.19 $795.35 $783.43 $837.29 $822.29 $878.82 $863.69 $923.07 $921.06 $984.38$0.086324 $0.092259 $0.089026 $0.095147 $0.091648 $0.097949 $0.094376 $0.100864 $0.098086 $0.104829$0.086324 $0.092259 $0.089026 $0.095147 $0.091648 $0.097949 $0.094376 $0.100864 $0.098086 $0.104829
$1.89 $2.02 $1.89 $2.02 $1.89 $2.02 $1.89 $2.02 $1.89 $2.02
$174.17 $186.14 $180.29 $192.68 $186.25 $199.05 $192.50 $205.73 $201.03 $214.85$0.078397 $0.083787 $0.081071 $0.086645 $0.083659 $0.089411 $0.086386 $0.092325 $0.090092 $0.096286$0.064329 $0.068752 $0.066524 $0.071098 $0.068647 $0.073366 $0.070885 $0.075758 $0.073926 $0.079008
$1.89 $2.02 $1.89 $2.02 $1.89 $2.02 $1.89 $2.02 $1.89 $2.02
$0.316734 $0.338509 $0.316574 $0.338338 $0.316418 $0.338172 $0.316254 $0.337996 $0.316031 $0.337758
744.19$ 795.35$ 783.43$ 837.29$ 822.29$ 878.82$ 863.69$ 923.07$ 921.06$ 984.38$
10/1/2024
ATTACHMENT 2
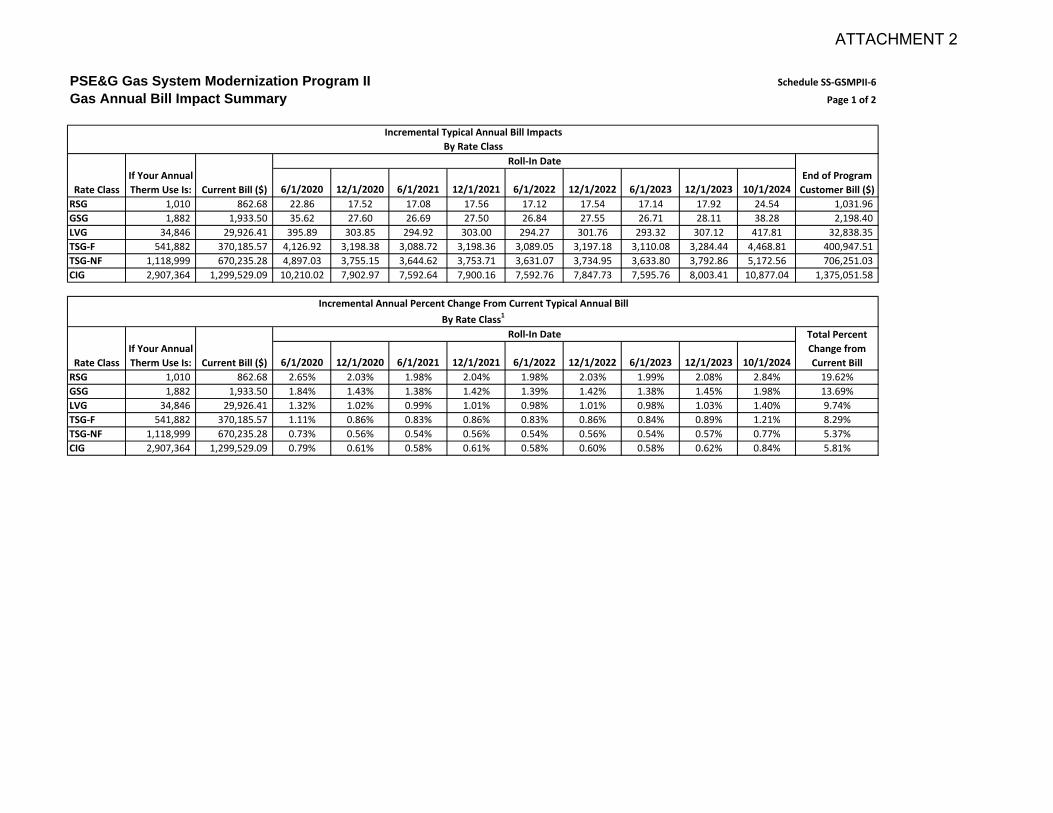
PSE&G Gas System Modernization Program II Schedule SS‐GSMPII‐6
Gas Annual Bill Impact Summary Page 1 of 2
6/1/2020 12/1/2020 6/1/2021 12/1/2021 6/1/2022 12/1/2022 6/1/2023 12/1/2023 10/1/2024
RSG 1,010 862.68 22.86 17.52 17.08 17.56 17.12 17.54 17.14 17.92 24.54 1,031.96
GSG 1,882 1,933.50 35.62 27.60 26.69 27.50 26.84 27.55 26.71 28.11 38.28 2,198.40
LVG 34,846 29,926.41 395.89 303.85 294.92 303.00 294.27 301.76 293.32 307.12 417.81 32,838.35
TSG‐F 541,882 370,185.57 4,126.92 3,198.38 3,088.72 3,198.36 3,089.05 3,197.18 3,110.08 3,284.44 4,468.81 400,947.51
TSG‐NF 1,118,999 670,235.28 4,897.03 3,755.15 3,644.62 3,753.71 3,631.07 3,734.95 3,633.80 3,792.86 5,172.56 706,251.03
CIG 2,907,364 1,299,529.09 10,210.02 7,902.97 7,592.64 7,900.16 7,592.76 7,847.73 7,595.76 8,003.41 10,877.04 1,375,051.58
6/1/2020 12/1/2020 6/1/2021 12/1/2021 6/1/2022 12/1/2022 6/1/2023 12/1/2023 10/1/2024
RSG 1,010 862.68 2.65% 2.03% 1.98% 2.04% 1.98% 2.03% 1.99% 2.08% 2.84% 19.62%
GSG 1,882 1,933.50 1.84% 1.43% 1.38% 1.42% 1.39% 1.42% 1.38% 1.45% 1.98% 13.69%
LVG 34,846 29,926.41 1.32% 1.02% 0.99% 1.01% 0.98% 1.01% 0.98% 1.03% 1.40% 9.74%
TSG‐F 541,882 370,185.57 1.11% 0.86% 0.83% 0.86% 0.83% 0.86% 0.84% 0.89% 1.21% 8.29%
TSG‐NF 1,118,999 670,235.28 0.73% 0.56% 0.54% 0.56% 0.54% 0.56% 0.54% 0.57% 0.77% 5.37%
CIG 2,907,364 1,299,529.09 0.79% 0.61% 0.58% 0.61% 0.58% 0.60% 0.58% 0.62% 0.84% 5.81%
Incremental Annual Percent Change From Current Typical Annual Bill
By Rate Class1
Rate Class
If Your Annual
Therm Use Is: Current Bill ($)
Total Percent
Change from
Current Bill
Roll‐In Date
Incremental Typical Annual Bill Impacts
By Rate Class
End of Program
Customer Bill ($)Rate Class
If Your Annual
Therm Use Is: Current Bill ($)
Roll‐In Date
ATTACHMENT 2
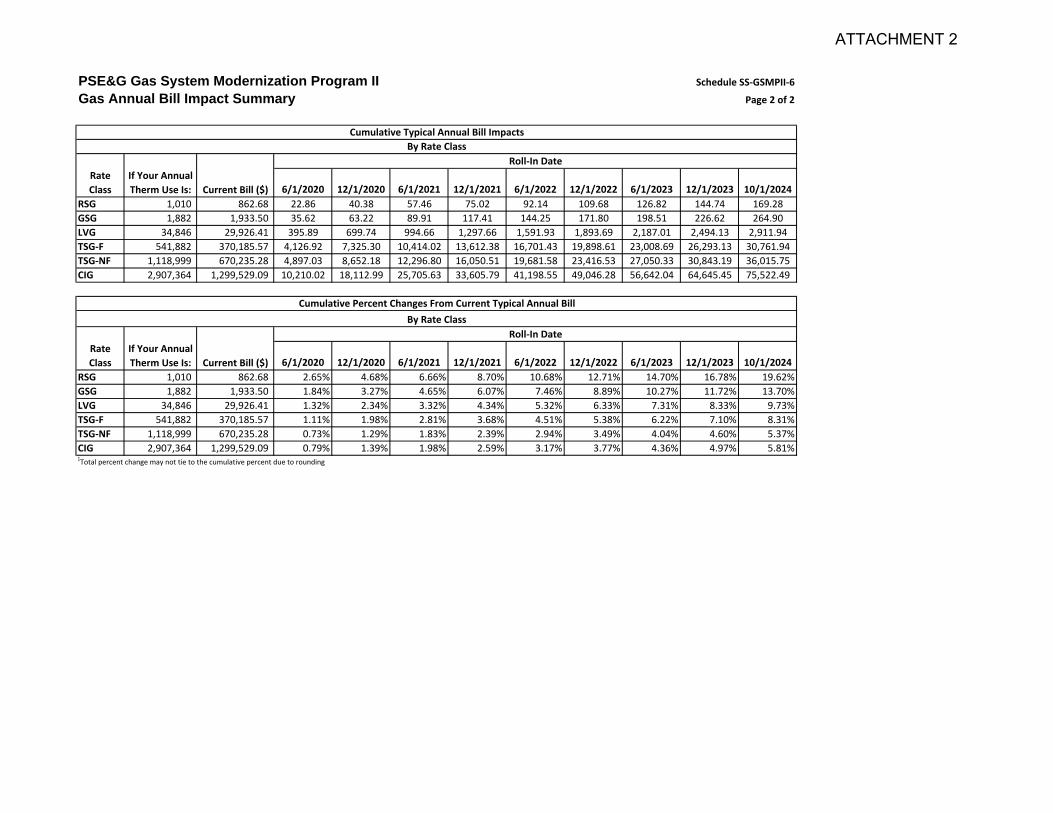
PSE&G Gas System Modernization Program II Schedule SS‐GSMPII‐6
Gas Annual Bill Impact Summary Page 2 of 2
6/1/2020 12/1/2020 6/1/2021 12/1/2021 6/1/2022 12/1/2022 6/1/2023 12/1/2023 10/1/2024
RSG 1,010 862.68 22.86 40.38 57.46 75.02 92.14 109.68 126.82 144.74 169.28
GSG 1,882 1,933.50 35.62 63.22 89.91 117.41 144.25 171.80 198.51 226.62 264.90
LVG 34,846 29,926.41 395.89 699.74 994.66 1,297.66 1,591.93 1,893.69 2,187.01 2,494.13 2,911.94
TSG‐F 541,882 370,185.57 4,126.92 7,325.30 10,414.02 13,612.38 16,701.43 19,898.61 23,008.69 26,293.13 30,761.94
TSG‐NF 1,118,999 670,235.28 4,897.03 8,652.18 12,296.80 16,050.51 19,681.58 23,416.53 27,050.33 30,843.19 36,015.75
CIG 2,907,364 1,299,529.09 10,210.02 18,112.99 25,705.63 33,605.79 41,198.55 49,046.28 56,642.04 64,645.45 75,522.49
6/1/2020 12/1/2020 6/1/2021 12/1/2021 6/1/2022 12/1/2022 6/1/2023 12/1/2023 10/1/2024
RSG 1,010 862.68 2.65% 4.68% 6.66% 8.70% 10.68% 12.71% 14.70% 16.78% 19.62%
GSG 1,882 1,933.50 1.84% 3.27% 4.65% 6.07% 7.46% 8.89% 10.27% 11.72% 13.70%
LVG 34,846 29,926.41 1.32% 2.34% 3.32% 4.34% 5.32% 6.33% 7.31% 8.33% 9.73%
TSG‐F 541,882 370,185.57 1.11% 1.98% 2.81% 3.68% 4.51% 5.38% 6.22% 7.10% 8.31%
TSG‐NF 1,118,999 670,235.28 0.73% 1.29% 1.83% 2.39% 2.94% 3.49% 4.04% 4.60% 5.37%
CIG 2,907,364 1,299,529.09 0.79% 1.39% 1.98% 2.59% 3.17% 3.77% 4.36% 4.97% 5.81%1Total percent change may not tie to the cumulative percent due to rounding
Rate
Class
If Your Annual
Therm Use Is: Current Bill ($)
Roll‐In Date
Cumulative Typical Annual Bill Impacts
By Rate Class
Rate
Class
If Your Annual
Therm Use Is: Current Bill ($)
Roll‐In Date
Cumulative Percent Changes From Current Typical Annual Bill
By Rate Class
ATTACHMENT 2
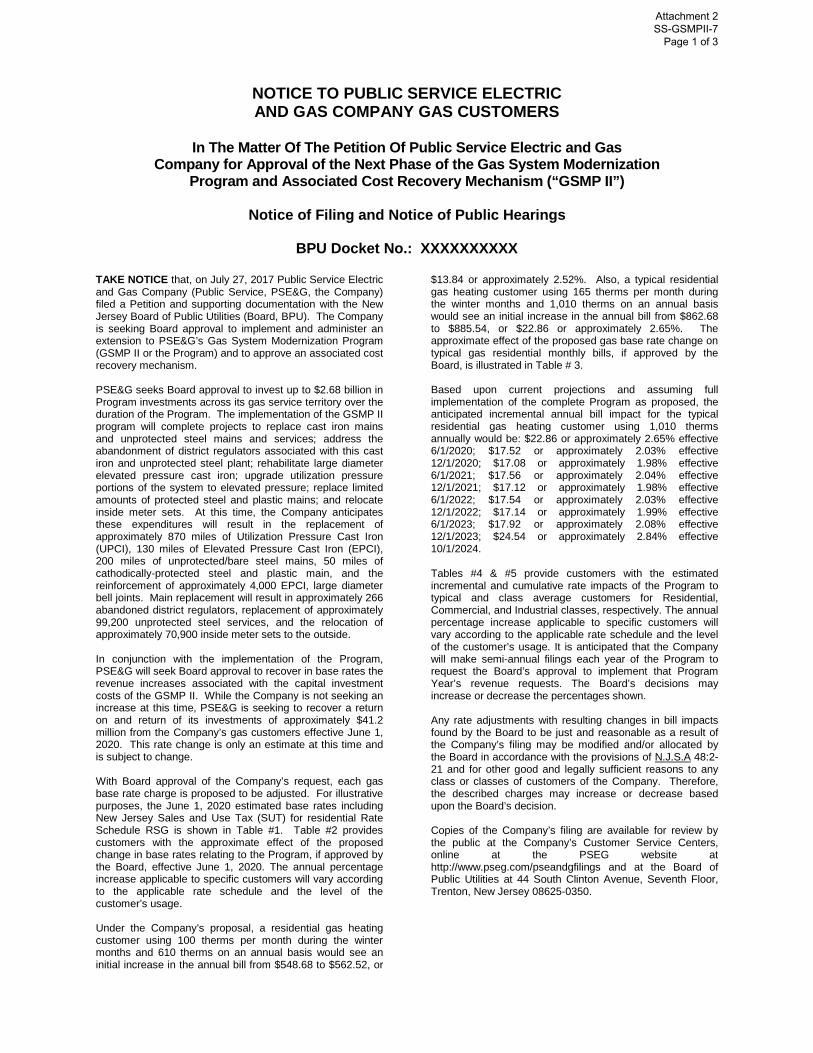
NOTICE TO PUBLIC SERVICE ELECTRIC AND GAS COMPANY GAS CUSTOMERS
In The Matter Of The Petition Of Public Service Electric and Gas
Company for Approval of the Next Phase of the Gas System Modernization Program and Associated Cost Recovery Mechanism (“GSMP II”)
Notice of Filing and Notice of Public Hearings
BPU Docket No.: XXXXXXXXXX
TAKE NOTICE that, on July 27, 2017 Public Service Electric and Gas Company (Public Service, PSE&G, the Company) filed a Petition and supporting documentation with the New Jersey Board of Public Utilities (Board, BPU). The Company is seeking Board approval to implement and administer an extension to PSE&G’s Gas System Modernization Program (GSMP II or the Program) and to approve an associated cost recovery mechanism. PSE&G seeks Board approval to invest up to $2.68 billion in Program investments across its gas service territory over the duration of the Program. The implementation of the GSMP II program will complete projects to replace cast iron mains and unprotected steel mains and services; address the abandonment of district regulators associated with this cast iron and unprotected steel plant; rehabilitate large diameter elevated pressure cast iron; upgrade utilization pressure portions of the system to elevated pressure; replace limited amounts of protected steel and plastic mains; and relocate inside meter sets. At this time, the Company anticipates these expenditures will result in the replacement of approximately 870 miles of Utilization Pressure Cast Iron (UPCI), 130 miles of Elevated Pressure Cast Iron (EPCI), 200 miles of unprotected/bare steel mains, 50 miles of cathodically-protected steel and plastic main, and the reinforcement of approximately 4,000 EPCI, large diameter bell joints. Main replacement will result in approximately 266 abandoned district regulators, replacement of approximately 99,200 unprotected steel services, and the relocation of approximately 70,900 inside meter sets to the outside. In conjunction with the implementation of the Program, PSE&G will seek Board approval to recover in base rates the revenue increases associated with the capital investment costs of the GSMP II. While the Company is not seeking an increase at this time, PSE&G is seeking to recover a return on and return of its investments of approximately $41.2 million from the Company’s gas customers effective June 1, 2020. This rate change is only an estimate at this time and is subject to change. With Board approval of the Company’s request, each gas base rate charge is proposed to be adjusted. For illustrative purposes, the June 1, 2020 estimated base rates including New Jersey Sales and Use Tax (SUT) for residential Rate Schedule RSG is shown in Table #1. Table #2 provides customers with the approximate effect of the proposed change in base rates relating to the Program, if approved by the Board, effective June 1, 2020. The annual percentage increase applicable to specific customers will vary according to the applicable rate schedule and the level of the customer’s usage. Under the Company’s proposal, a residential gas heating customer using 100 therms per month during the winter months and 610 therms on an annual basis would see an initial increase in the annual bill from $548.68 to $562.52, or
$13.84 or approximately 2.52%. Also, a typical residential gas heating customer using 165 therms per month during the winter months and 1,010 therms on an annual basis would see an initial increase in the annual bill from $862.68 to $885.54, or $22.86 or approximately 2.65%. The approximate effect of the proposed gas base rate change on typical gas residential monthly bills, if approved by the Board, is illustrated in Table # 3. Based upon current projections and assuming full implementation of the complete Program as proposed, the anticipated incremental annual bill impact for the typical residential gas heating customer using 1,010 therms annually would be: $22.86 or approximately 2.65% effective 6/1/2020; $17.52 or approximately 2.03% effective 12/1/2020; $17.08 or approximately 1.98% effective 6/1/2021; $17.56 or approximately 2.04% effective 12/1/2021; $17.12 or approximately 1.98% effective 6/1/2022; $17.54 or approximately 2.03% effective 12/1/2022; $17.14 or approximately 1.99% effective 6/1/2023; $17.92 or approximately 2.08% effective 12/1/2023; $24.54 or approximately 2.84% effective 10/1/2024. Tables #4 & #5 provide customers with the estimated incremental and cumulative rate impacts of the Program to typical and class average customers for Residential, Commercial, and Industrial classes, respectively. The annual percentage increase applicable to specific customers will vary according to the applicable rate schedule and the level of the customer’s usage. It is anticipated that the Company will make semi-annual filings each year of the Program to request the Board’s approval to implement that Program Year’s revenue requests. The Board’s decisions may increase or decrease the percentages shown. Any rate adjustments with resulting changes in bill impacts found by the Board to be just and reasonable as a result of the Company’s filing may be modified and/or allocated by the Board in accordance with the provisions of N.J.S.A 48:2-21 and for other good and legally sufficient reasons to any class or classes of customers of the Company. Therefore, the described charges may increase or decrease based upon the Board’s decision. Copies of the Company’s filing are available for review by the public at the Company’s Customer Service Centers, online at the PSEG website at http://www.pseg.com/pseandgfilings and at the Board of Public Utilities at 44 South Clinton Avenue, Seventh Floor, Trenton, New Jersey 08625-0350.
Attachment 2 SS-GSMPII-7
Page 1 of 3
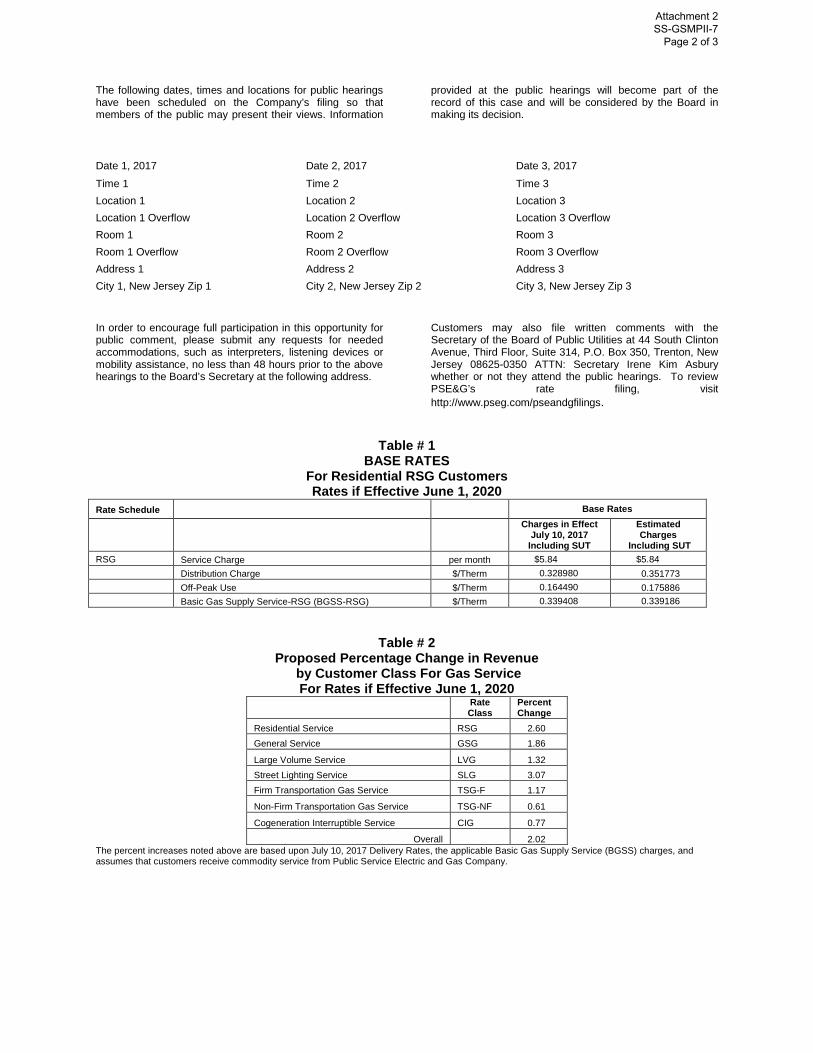
The following dates, times and locations for public hearings have been scheduled on the Company’s filing so that members of the public may present their views. Information
provided at the public hearings will become part of the record of this case and will be considered by the Board in making its decision.
In order to encourage full participation in this opportunity for public comment, please submit any requests for needed accommodations, such as interpreters, listening devices or mobility assistance, no less than 48 hours prior to the above hearings to the Board’s Secretary at the following address.
Customers may also file written comments with the Secretary of the Board of Public Utilities at 44 South Clinton Avenue, Third Floor, Suite 314, P.O. Box 350, Trenton, New Jersey 08625-0350 ATTN: Secretary Irene Kim Asbury whether or not they attend the public hearings. To review PSE&G’s rate filing, visit http://www.pseg.com/pseandgfilings.
Table # 1
BASE RATES For Residential RSG Customers Rates if Effective June 1, 2020
Rate Schedule Base Rates
Charges in Effect
July 10, 2017 Including SUT
Estimated Charges
Including SUT RSG Service Charge per month $5.84 $5.84 Distribution Charge $/Therm 0.328980 0.351773 Off-Peak Use $/Therm 0.164490 0.175886 Basic Gas Supply Service-RSG (BGSS-RSG) $/Therm 0.339408 0.339186
Table # 2
Proposed Percentage Change in Revenue by Customer Class For Gas Service For Rates if Effective June 1, 2020
Rate Class
Percent Change
Residential Service RSG 2.60 General Service GSG 1.86
Large Volume Service LVG 1.32 Street Lighting Service SLG 3.07 Firm Transportation Gas Service TSG-F 1.17
Non-Firm Transportation Gas Service TSG-NF 0.61
Cogeneration Interruptible Service CIG 0.77
Overall 2.02 The percent increases noted above are based upon July 10, 2017 Delivery Rates, the applicable Basic Gas Supply Service (BGSS) charges, and assumes that customers receive commodity service from Public Service Electric and Gas Company.
Date 1, 2017 Date 2, 2017 Date 3, 2017
Time 1 Time 2 Time 3 Location 1 Location 2 Location 3 Location 1 Overflow Location 2 Overflow Location 3 Overflow Room 1 Room 2 Room 3 Room 1 Overflow Room 2 Overflow Room 3 Overflow Address 1 Address 2 Address 3 City 1, New Jersey Zip 1 City 2, New Jersey Zip 2 City 3, New Jersey Zip 3
Attachment 2 SS-GSMPII-7
Page 2 of 3
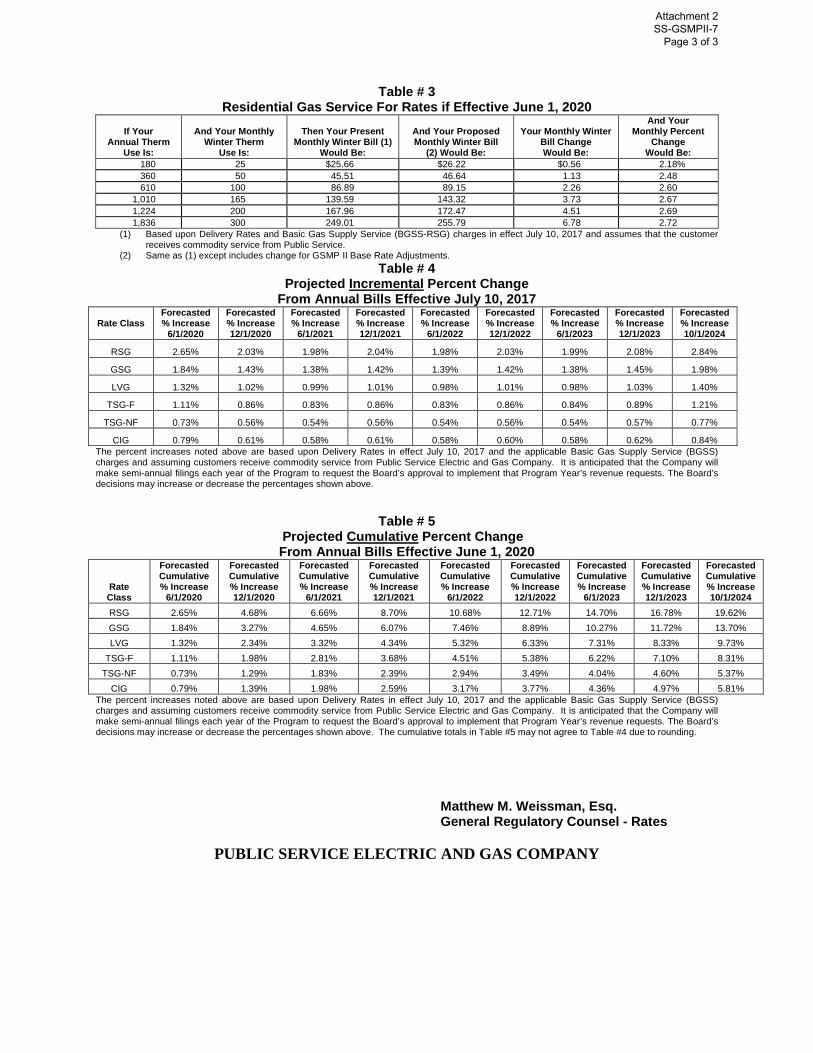
Table # 3 Residential Gas Service For Rates if Effective June 1, 2020
If Your
Annual Therm Use Is:
And Your Monthly
Winter Therm Use Is:
Then Your Present
Monthly Winter Bill (1) Would Be:
And Your Proposed Monthly Winter Bill
(2) Would Be:
Your Monthly Winter
Bill Change Would Be:
And Your Monthly Percent
Change Would Be:
180 25 $25.66 $26.22 $0.56 2.18% 360 50 45.51 46.64 1.13 2.48 610 100 86.89 89.15 2.26 2.60
1,010 165 139.59 143.32 3.73 2.67 1,224 200 167.96 172.47 4.51 2.69 1,836 300 249.01 255.79 6.78 2.72
(1) Based upon Delivery Rates and Basic Gas Supply Service (BGSS-RSG) charges in effect July 10, 2017 and assumes that the customer receives commodity service from Public Service.
(2) Same as (1) except includes change for GSMP II Base Rate Adjustments. Table # 4
Projected Incremental Percent Change From Annual Bills Effective July 10, 2017
Rate Class Forecasted % Increase
6/1/2020
Forecasted % Increase 12/1/2020
Forecasted % Increase
6/1/2021
Forecasted % Increase 12/1/2021
Forecasted % Increase
6/1/2022
Forecasted % Increase 12/1/2022
Forecasted % Increase
6/1/2023
Forecasted % Increase 12/1/2023
Forecasted % Increase 10/1/2024
RSG 2.65% 2.03% 1.98% 2.04% 1.98% 2.03% 1.99% 2.08% 2.84%
GSG 1.84% 1.43% 1.38% 1.42% 1.39% 1.42% 1.38% 1.45% 1.98%
LVG 1.32% 1.02% 0.99% 1.01% 0.98% 1.01% 0.98% 1.03% 1.40%
TSG-F 1.11% 0.86% 0.83% 0.86% 0.83% 0.86% 0.84% 0.89% 1.21%
TSG-NF 0.73% 0.56% 0.54% 0.56% 0.54% 0.56% 0.54% 0.57% 0.77%
CIG 0.79% 0.61% 0.58% 0.61% 0.58% 0.60% 0.58% 0.62% 0.84% The percent increases noted above are based upon Delivery Rates in effect July 10, 2017 and the applicable Basic Gas Supply Service (BGSS) charges and assuming customers receive commodity service from Public Service Electric and Gas Company. It is anticipated that the Company will make semi-annual filings each year of the Program to request the Board’s approval to implement that Program Year’s revenue requests. The Board’s decisions may increase or decrease the percentages shown above.
Table # 5 Projected Cumulative Percent Change From Annual Bills Effective June 1, 2020
Rate Class
Forecasted Cumulative % Increase
6/1/2020
Forecasted Cumulative % Increase 12/1/2020
Forecasted Cumulative % Increase
6/1/2021
Forecasted Cumulative % Increase 12/1/2021
Forecasted Cumulative % Increase
6/1/2022
Forecasted Cumulative % Increase 12/1/2022
Forecasted Cumulative % Increase
6/1/2023
Forecasted Cumulative % Increase 12/1/2023
Forecasted Cumulative % Increase 10/1/2024
RSG 2.65% 4.68% 6.66% 8.70% 10.68% 12.71% 14.70% 16.78% 19.62% GSG 1.84% 3.27% 4.65% 6.07% 7.46% 8.89% 10.27% 11.72% 13.70% LVG 1.32% 2.34% 3.32% 4.34% 5.32% 6.33% 7.31% 8.33% 9.73%
TSG-F 1.11% 1.98% 2.81% 3.68% 4.51% 5.38% 6.22% 7.10% 8.31% TSG-NF 0.73% 1.29% 1.83% 2.39% 2.94% 3.49% 4.04% 4.60% 5.37%
CIG 0.79% 1.39% 1.98% 2.59% 3.17% 3.77% 4.36% 4.97% 5.81% The percent increases noted above are based upon Delivery Rates in effect July 10, 2017 and the applicable Basic Gas Supply Service (BGSS) charges and assuming customers receive commodity service from Public Service Electric and Gas Company. It is anticipated that the Company will make semi-annual filings each year of the Program to request the Board’s approval to implement that Program Year’s revenue requests. The Board’s decisions may increase or decrease the percentages shown above. The cumulative totals in Table #5 may not agree to Table #4 due to rounding.
Matthew M. Weissman, Esq.
General Regulatory Counsel - Rates
PUBLIC SERVICE ELECTRIC AND GAS COMPANY
Attachment 2 SS-GSMPII-7
Page 3 of 3