mathematics hl, year 2 · freehold regional high school district office of curriculum and...
TRANSCRIPT

FREEHOLD REGIONAL HIGH SCHOOL DISTRICT
OFFICE OF CURRICULUM AND INSTRUCTION
INTERNATIONAL BACCALAUREATE PROGRAM
MATHEMATICS HL, YEAR 2
Grade Level: 12
Credits: 5
BOARD OF EDUCATION ADOPTION DATE:
AUGUST 28, 2017
SUPPORTING RESOURCES AVAILABLE IN DISTRICT RESOURCE SHARING
APPENDIX A: ACCOMMODATIONS AND MODIFICATIONS
APPENDIX B: ASSESSMENT EVIDENCE
APPENDIX C: INTERDISCIPLINARY CONNECTIONS

FREEHOLD REGIONAL HIGH SCHOOL DISTRICT
Board of Education Mrs. Jennifer Sutera, President Mr. Peter Bruno, Vice President
Mr. Vincent Accettola Mrs. Elizabeth Canario
Mr. Samuel Carollo Mrs. Amy Fankhauser
Mrs. Kathie Lavin Mr. Michael Messinger
Mr. Heshy Moses
Central Administration Mr. Charles Sampson, Superintendent
Dr. Nicole Hazel, Chief Academic Officer Ms. Shanna Howell, Director of Curriculum and Instruction
Mr. Oscar Diaz, Administrative Supervisor of Curriculum & Instruction Ms. Stephanie Mechmann, Administrative Supervisor of Curriculum & Instruction
Ms. Renee Schneider, Administrative Supervisor of Curriculum & Instruction
Curriculum Writing Committee Mr. David Patterson
Supervisor Ms. Mary Hough

IB MATHEMATICS HL YEAR 2
COURSE PHILOSOPHY
The International Baccalaureate Organization provides the following philosophy for the teaching of mathematics and Mathematics HL: “The nature of mathematics can be summarized in a number of ways: for example, it can be seen as a well-defined body of knowledge, as an abstract system of ideas, or as a useful tool. For many people it is probably a combination of these, but there is no doubt that mathematical knowledge provides an important key to understanding the world in which we live. Mathematics can enter our lives in a number of ways: we buy produce in the market, consult a timetable, read a newspaper, time a process or estimate a length. Mathematics, for most of us, also extends into our chosen profession: visual artists need to learn about perspective; musicians need to appreciate the mathematical relationships within and between different rhythms; economists need to recognize trends in financial dealings; and engineers need to take account of stress patterns in physical materials. Scientists view mathematics as a language that is central to our understanding of events that occur in the natural world. Some people enjoy the challenges offered by the logical methods of mathematics and the adventure in reason that mathematical proof has to offer. Others appreciate mathematics as an aesthetic experience or even as a cornerstone of philosophy. This prevalence of mathematics in our lives, with all its interdisciplinary connections, provides a clear and sufficient rationale for making the study of this subject compulsory for students studying the full diploma. This course caters for students with a good background in mathematics who are competent in a range of analytical and technical skills. The majority of these students will be expecting to include mathematics as a major component of their university studies, either as a subject in its own right or within courses such as physics, engineering and technology. Others may take this subject because they have a strong interest in mathematics and enjoy meeting its challenges and engaging with its problems.”
COURSE DESCRIPTION
The International Baccalaureate Organization provides the following description for the teaching of mathematics and Mathematics HL: “The course focuses on developing important mathematical concepts in a comprehensible, coherent and rigorous way. This is achieved by means of a carefully balanced approach. Students are encouraged to apply their mathematical knowledge to solve problems set in a variety of meaningful contexts. Development of each topic should feature justification and proof of results. Students embarking on this course should expect to develop insight into mathematical form and structure, and should be intellectually equipped to appreciate the links between concepts in different topic areas. They should also be encouraged to develop the skills needed to continue their mathematical growth in other learning environments. . . This course is a demanding one, requiring students to study a broad range of mathematical topics through a number of different approaches and to varying degrees of depth.”

COURSE SUMMARY
COURSE GOALS
CG1: Students will model, manipulate, and develop abstract reasoning skills about different types of functions while making mathematical connections and building an appreciation for the elegance and power of mathematics. CG2: Students will analyze, model, and interpret data to communicate clearly and confidently and make sound, logical decisions based on probability models. CG3: Students will use calculus constructs to interpret and reason abstractly about quantitative models of change and deduce their consequences. CG4: Students will create, analyze, and solve real-world problems and communicate results that are meaningful in a variety of real-world contexts. CG5: Students will derive mathematical proofs for known equations and understand the value of completing these exercises.
COURSE ENDURING UNDERSTANDINGS COURSE ESSENTIAL QUESTIONS
CEU1: There are many similarities between types of functions and knowledge of one type can lead to an understanding of other types.
CEQ1a: How can our understanding of one type of function help us to learn a new type? CEQ1b: How do we know if a feature of a function is unique to that function? CEQ1c: How can we compare functions if they are represented in different forms?
CEU2: Analyzing change mathematically enriches understanding of a given scenario and allows for problem solving at a high level.
CEQ2a: How is change measured mathematically? CEQ2b: What is the value of studying change in a relationship?
CEU3: Many situations in the real world can be represented using different probability models and we can learn much about these situations by exploring these models.
CEQ3a: How can a particular probability model be identified? CEQ3b: Can you learn some things about certain models that cannot be determined from other models?
CEU4: Communication in mathematics is critical to forming logical arguments that will inform decisions.
CEQ4a: How do we communicate mathematically? CEQ4b: What makes communication effective?
CEU5: Problem solving requires open-mindedness, risk-taking, and perseverance that allows for creativity when exploring a variety of topics.
CEQ5a: How does risk-taking relate to studying topics in mathematics? CEQ5b: Why does keeping an open-mind help students problem solve? CEQ5c: What does it mean to persevere when problem solving in mathematics

UNIT GOALS AND PACING
UNIT TITLE UNIT GOALS DURATION
Unit 1: Internal Assessment
Students will explore a mathematical topic of their choosing to pursue their personal interests and demonstrate their ability to transfer their learning to a new topic with an emphasis on mathematical rigor.
4 weeks
Unit 2: Calculus
Students will use calculus to analyze the rates of change of a function over specific intervals in application and theoretical settings.
10 weeks
Unit 3: Statistics and Probability
Students will explore, analyze, model and reason abstractly about distributions and compare these distributions to commonly studied distributions to determine the likelihood of certain outcomes.
10 weeks
Unit 4: Option A - Further Statistics
Students will explore and interpret a variety of probability distributions and form a sound understanding of statistical significance and error analysis as it pertains to different probability models.
10 weeks
Unit 4: Option B – Further Calculus
Students will use limit theorems and convergence of series to build a conceptual understanding of calculus and use calculus to solve and interpret solutions to differential equations.
10 weeks
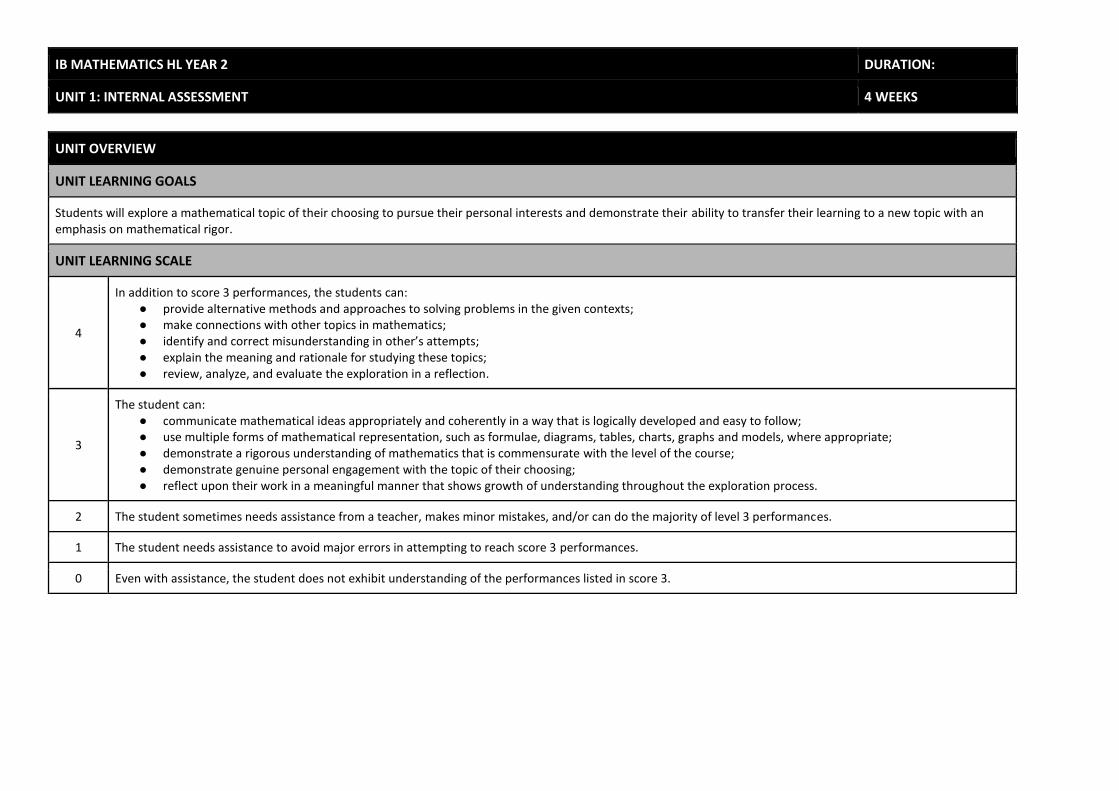
IB MATHEMATICS HL YEAR 2 DURATION:
UNIT 1: INTERNAL ASSESSMENT 4 WEEKS
UNIT OVERVIEW
UNIT LEARNING GOALS
Students will explore a mathematical topic of their choosing to pursue their personal interests and demonstrate their ability to transfer their learning to a new topic with an emphasis on mathematical rigor.
UNIT LEARNING SCALE
4
In addition to score 3 performances, the students can: ● provide alternative methods and approaches to solving problems in the given contexts; ● make connections with other topics in mathematics; ● identify and correct misunderstanding in other’s attempts; ● explain the meaning and rationale for studying these topics; ● review, analyze, and evaluate the exploration in a reflection.
3
The student can: ● communicate mathematical ideas appropriately and coherently in a way that is logically developed and easy to follow; ● use multiple forms of mathematical representation, such as formulae, diagrams, tables, charts, graphs and models, where appropriate; ● demonstrate a rigorous understanding of mathematics that is commensurate with the level of the course; ● demonstrate genuine personal engagement with the topic of their choosing; ● reflect upon their work in a meaningful manner that shows growth of understanding throughout the exploration process.
2 The student sometimes needs assistance from a teacher, makes minor mistakes, and/or can do the majority of level 3 performances.
1 The student needs assistance to avoid major errors in attempting to reach score 3 performances.
0 Even with assistance, the student does not exhibit understanding of the performances listed in score 3.

ENDURING UNDERSTANDINGS ESSENTIAL QUESTIONS
EU1: Exploring mathematics will lead to a richer understanding of the mathematics and convey the universal applicability of math.
EQ1a: What are the different ways to explore mathematics and how do I know which are appropriate for a given topic? EQ1b: How can I go beyond research and interact with the mathematics on a more personal level?
EU2: Writing mathematical analyses will improve communication skills and will therefore lead to a higher level of mathematical competence.
EQ2a: What are the similarities and differences between communicating and writing mathematically versus other subjects? EQ2b: How do I know that I effectively communicated to my audience?
COMMON ASSESSMENT
ALIGNMENT DESCRIPTION
LG1 EU1, 2 EQ1a, b, EQ2a, b SMP 1-8 DOK 4
Internal Assessment: The common assessment for this unit is the Internal Assessment established by IB. Students will complete an independent exploration project and research investigation on a related mathematical topic of interest involving the collection of information or the generation of measurements and the analysis and evaluation of the information. Students can choose from a wide variety of project types, such as modeling, investigations, applications, statistical analysis, or a combination of multiple of these. Students will use mathematical methods to draw conclusions and answer questions based on their individual interests. Students are expected to demonstrate application and theoretical understanding of the mathematics involved. Each project must contain:
● a statement of the task and plan; ● research, data, and/or mathematical exploration that have been collected and/or generated; ● an analysis of the research, data and/or mathematical exploration; ● proof of personal engagement to the exploration; ● reflection of exploration; ● appropriate notation and terminology.

TARGETED UNIT STANDARDS
DECLARATIVE KNOWLEDGE PROCEDURAL KNOWLEDGE STANDARDS
appropriate mathematical language (e.g. notation, symbols, terminology) beauty, power and usefulness of mathematics coherent exploration graphs, tables, and diagrams mathematical processes nature of mathematics patience and persistence power of technology as a mathematical tool well-organized exploration
ICT tools (i.e., graphic display calculators, screenshots, graphing, spreadsheets, databases, drawing and word-processing software) mathematical representation (e.g., formulae, diagrams, tables, charts, graphs, and models reflection)
Explain the meaning of an exploration and identifying entry points to its solution (DOK 2) Analyze known information, question of investigation and goals (DOK 3) Make conjectures about the form and meaning of the investigation and plan a solution pathway (DOK 3) Consider analogous pathways for investigation, and try special cases and simpler forms of the original problem in order to gain insight into its investigation (DOK 3)
Monitor and evaluate their progress and change course if necessary (DOK 3) Explain correspondences between equations, verbal descriptions, tables, and graphs or draw diagrams of important features and relationships, graph data, and search for regularity or trends (DOK 3) Understand, analyze and critique the approaches of others to solving complex problems and identify correspondences between different approaches within the investigation (DOK 3)
MP1 Make sense of problems and persevere in solving them.
Make sense of quantities and their relationships in problem situations (DOK 2) Bring two complementary abilities to bear on problems involving quantitative relationships: the ability to decontextualize-to abstract a given situation and represent it symbolically and manipulate the representing symbols as if they have a life of their own, without necessarily attending to their referents-and the ability to contextualize, to pause as needed during the manipulation process in order to probe into the referents for the symbols involved (DOK 3) Quantitative reasoning entails habits of creating a coherent representation of the problem at hand; considering the units involved; attending to the meaning of quantities, not just how to compute them; and knowing and flexibly using different properties of operations and objects (DOK 3)
MP2 Reason abstractly and quantitatively.

DECLARATIVE KNOWLEDGE PROCEDURAL KNOWLEDGE STANDARDS
(see above) Use stated assumptions, definitions, and previously established results in constructing arguments (DOK 2) Analyze situations by breaking them into cases, and can recognize and use counterexamples (DOK 2) Make conjectures and build a logical progression of statements to explore the truth of their conjectures (DOK 3) Justify conclusions, communicate them to others, and respond to the arguments of others (DOK 4) Reason inductively about data, making plausible arguments that take into account the context from which the data arose (DOK 4) Compare the effectiveness of two plausible arguments, distinguish correct logic or reasoning from that which is flawed, and-if there is a flaw in an argument-explain what it is (DOK 4)
MP3 Construct viable arguments and critique the reasoning of others.
Apply the mathematics they know to solve problems arising within the investigation. (DOK 2) Identify important quantities in the investigation and map their relationships using such tools as diagrams, two-way tables, graphs, flowcharts and formulas (DOK 2) Interpret their mathematical results in the context of the situation and reflect on whether the results make sense, possibly improving the model if it has not served its purpose (DOK 3) Analyze those relationships mathematically to draw conclusions (DOK 4)
MP4 Model with mathematics.
DECLARATIVE KNOWLEDGE PROCEDURAL KNOWLEDGE STANDARDS
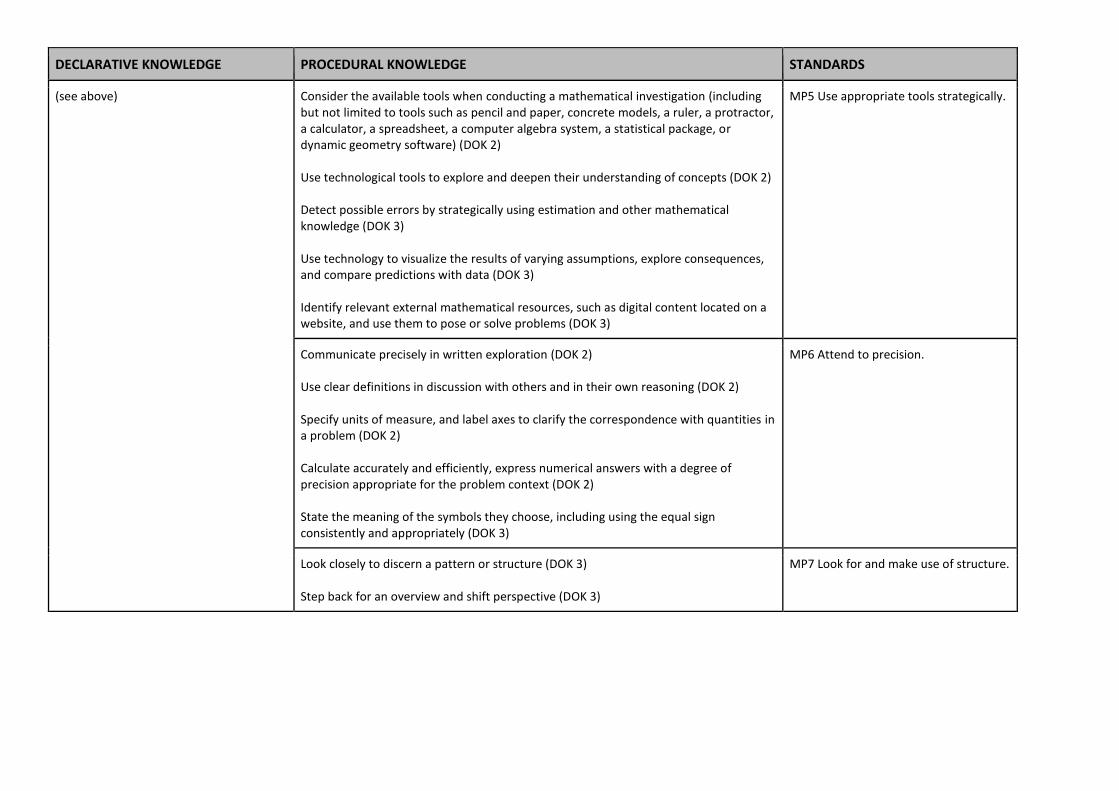
(see above) Consider the available tools when conducting a mathematical investigation (including but not limited to tools such as pencil and paper, concrete models, a ruler, a protractor, a calculator, a spreadsheet, a computer algebra system, a statistical package, or dynamic geometry software) (DOK 2) Use technological tools to explore and deepen their understanding of concepts (DOK 2) Detect possible errors by strategically using estimation and other mathematical knowledge (DOK 3) Use technology to visualize the results of varying assumptions, explore consequences, and compare predictions with data (DOK 3) Identify relevant external mathematical resources, such as digital content located on a website, and use them to pose or solve problems (DOK 3)
MP5 Use appropriate tools strategically.
Communicate precisely in written exploration (DOK 2) Use clear definitions in discussion with others and in their own reasoning (DOK 2) Specify units of measure, and label axes to clarify the correspondence with quantities in a problem (DOK 2) Calculate accurately and efficiently, express numerical answers with a degree of precision appropriate for the problem context (DOK 2) State the meaning of the symbols they choose, including using the equal sign consistently and appropriately (DOK 3)
MP6 Attend to precision.
Look closely to discern a pattern or structure (DOK 3) Step back for an overview and shift perspective (DOK 3)
MP7 Look for and make use of structure.

DECLARATIVE KNOWLEDGE PROCEDURAL KNOWLEDGE STANDARDS
(see above) Notice if calculations are repeated, and look both for general methods and for shortcuts (DOK 3) Evaluate the reasonableness of their intermediate results (DOK 3)
MP8 Look for and express regularity in repeated reasoning.
Use multiple sources to explore topic and draw understanding from while reflecting on the process of learning and mapping connections to other concepts (DOK 2)
RST.11-12.1. Accurately cite strong and thorough evidence from the text to support analysis of science and technical texts, attending to precise details for explanations or descriptions.
Thoroughly explain the exploration process by coherently synthesizing the exploration including research from multiple sources, personal engagement, reflection and a clear understanding of the mathematics involved (DOK 4)
RST.11-12.9. Synthesize information from a range of sources (e.g., texts, experiments, simulations) into a coherent understanding of a process, phenomenon, or concept, resolving conflicting information when possible.
Synthesize information from a variety of sources to demonstrate understanding of exploration topic (DOK 4)
WHST.11-12.8 Gather relevant information from multiple authoritative print and digital sources, using advanced searches effectively; assess the strengths and limitations of each source in terms of the specific task, purpose, and audience; integrate information into the text selectively to maintain the flow of ideas, avoiding plagiarism and overreliance on any one source and following a standard format for citation.

IB MATHEMATICS HL YEAR 2 DURATION:
UNIT 2: CALCULUS 10 WEEKS
UNIT OVERVIEW
UNIT LEARNING GOALS
Students will use calculus to analyze the rates of change of a function over specific intervals in application and theoretical settings.
UNIT LEARNING SCALE
4
In addition to score 3 performances, the student can: ● provide alternative methods and approaches to solving problems in the given contexts; ● make connections with other topics in mathematics; ● identify and correct misunderstanding in other’s attempts;
● explain the meaning and rationale for studying these topics.
3
For a variety of types of functions, the student can proficiently: ● find derivatives and integrals for a variety of functions and explain the conceptual understanding of completing such a task; ● represent derivatives and integrals in a variety of manners (algebraically, graphically, and verbally); ● apply mathematical theory to use the rules of differentiation and integration; ● apply the properties of finding derivatives and integrals to a variety of application problems and explain the meaning of the solutions in context.
2 The student sometimes needs assistance from a teacher, makes minor mistakes, and/or can do the majority of level 3 performances.
1 The student needs assistance to avoid major errors in attempting to reach score 3 performances.
0 Even with assistance, the student does not exhibit understanding of the performances listed in score 3.

ENDURING UNDERSTANDINGS ESSENTIAL QUESTIONS
EU1: Derivatives and integrals can be used to solve a variety of problems related to instantaneous rate of change from a variety of contexts.
EQ1a: How do I know when exploring a problem whether I should be exploring a derivative or an integral? EQ1b: How do derivatives and integrals lead to a better understanding of the data that a function describes?
EU2: Differentiation and definite integration are inverse operations.
EQ2a: What similarities and differences exist in finding derivatives and integrals for different types of function? EQ2b: How can an understanding of this inverse relationship help to find one given the other?
COMMON ASSESSMENT
ALIGNMENT DESCRIPTION
LG1 EU1, 2 EQ1a, b, EQ2a, b M.HS.F.LE.A.3 M.HS.F.BF.A.1 M.HS.F.IF.B.4, 5, 6 M.HS.F.IF.C.7, 8, 9 SMP 1-8 DOK 4
Students will explore the relationship between position, velocity and acceleration of an object in motion of their choosing. They can select something small that moves rather fast, something large that moves more slowly, or anything in between. Because the data will be experimental, regression techniques from statistics will be required to find the model that best fits the function of position versus time. Once this is found, students will explore velocity and acceleration models and use them to learn more about this object in motion. Students will create their own functions, graphs, and give explanations of each giving clear evidence of conceptual understanding of derivatives and integrals of each. Students will also develop theoretical models for their exploration and analyze differences between theoretical and experimental data.

TARGETED UNIT STANDARDS
DECLARATIVE KNOWLEDGE PROCEDURAL KNOWLEDGE PREVIOUSLY COVERED STANDARDS TO DEVELOP FURTHER
increasing and decreasing functions limits, continuity and convergence local maximum and minimum values points of inflection with zero and non-zero gradients
Find and interpret the limit at a specific value for a variety of functions (DOK 3) Relate limits to derivatives in concept and for a variety of functions (DOK 2) Explore functions as they change over the domain; when are they increasing, decreasing, horizontal and vertical and what does this mean for the derivative at these points (DOK 3)
F-LE.A.3 Observe using graphs and tables that a quantity increasing exponentially eventually exceeds a quantity increasing linearly, quadratically, or (more generally) as a polynomial function. F-BF.A.1 Write a function that describes a relationship between two quantities. F-BF.B.3 Identify the effect on the graph of replacing 𝘧(𝘹) by 𝘧(𝘹) + 𝘬, 𝘬 𝘧(𝘹), 𝘧(𝘬𝘹), and 𝘧(𝘹 + 𝘬) for specific values of 𝘬 (both positive and negative); find the value of 𝘬 given the graphs. Experiment with cases and illustrate an explanation of the effects on the graph using technology. F-IF.B.4 For a function that models a relationship between two quantities, interpret key features of graphs and tables in terms of the quantities, and sketch graphs showing key features given a verbal description of the relationship. F-IF.B.5 Relate the domain of a function to its graph and, where applicable, to the quantitative relationship it describes. F-IF.B.6 Calculate and interpret the average rate of change of a function (presented symbolically or as a table) over a specified interval. Estimate the rate of change from a graph. F-IF.C.7 Graph functions expressed symbolically and show key features of the graph, by hand in simple cases and using technology for more complicated cases.
definition of derivative from first principles derivative interpreted as a gradient derivatives derivatives of sec x, csc x, cot x, ax, loga x, arcsin x, arccos x, and arctan x derivatives of xn, sin x, cos x, tan x, ex and ln x differentiation rules
● differentiation of sums and multiples of functions
● product and quotient rules ● chain rule for composite functions
equations of tangents and normal function and as a rate of change graphical behavior of functions, including the relationship between the graphs of f, f’, and f’’ higher derivatives implicit differentiation optimization problems related rates of change second derivative
Investigate the relationship between a function, its derivative, and higher derivatives to better understand the nature of the function (DOK 3) Differentiate between different differentiation rules for a variety of functions (DOK 3)

DECLARATIVE KNOWLEDGE PROCEDURAL KNOWLEDGE PREVIOUSLY COVERED STANDARDS TO DEVELOP FURTHER
anti-differentiation with a boundary condition to determine the constant term areas under curves (between the curve and the x-axis) and between curves definite integrals, both analytically and using technology indefinite integral of xn, sin x, cos x, and ex and composites of any of these with the linear function ax + b indefinite integration as anti-differentiation integration by inspection, or substitution kinematic problems involving displacement, velocity, acceleration total distance travelled volumes of revolution about the x-axis
Find and interpret integrals for a variety of functions (DOK 3) Explore the relationship between derivatives and integrals for a variety of functions (DOK 3) Distinguish between different integration techniques depending on the type of integration problem that a function presents (DOK 2) Apply integral calculus to a variety of kinematic problems to explore the value of studying integration (DOK 4)
F-LE.A.3 Observe using graphs and tables that a quantity increasing exponentially eventually exceeds a quantity increasing linearly, quadratically, or (more generally) as a polynomial function. F-BF.A.1 Write a function that describes a relationship between two quantities. F-BF.B.3 Identify the effect on the graph of replacing 𝘧(𝘹) by 𝘧(𝘹) + 𝘬, 𝘬 𝘧(𝘹), 𝘧(𝘬𝘹), and 𝘧(𝘹 + 𝘬) for specific values of 𝘬 (both positive and negative); find the value of 𝘬 given the graphs. Experiment with cases and illustrate an explanation of the effects on the graph using technology. F-IF.B.4 For a function that models a relationship between two quantities, interpret key features of graphs and tables in terms of the quantities, and sketch graphs showing key features given a verbal description of the relationship. F-IF.B.5 Relate the domain of a function to its graph and, where applicable, to the quantitative relationship it describes. F-IF.B.6 Calculate and interpret the average rate of change of a function (presented symbolically or as a table) over a specified interval. Estimate the rate of change from a graph. F-IF.C.7 Graph functions expressed symbolically and show key features of the graph, by hand in simple cases and using technology for more complicated cases.

IB MATHEMATICS HL YEAR 2 DURATION:
UNIT 3: PROBABILITY AND STATISTICS 10 WEEKS
UNIT OVERVIEW
UNIT LEARNING GOALS
Students will explore, analyze, model, and reason abstractly about distributions and compare these distributions to commonly studied distributions to determine the likelihood of certain outcomes.
UNIT LEARNING SCALE
4
In addition to score 3 performances, the students can: ● provide alternative methods and approaches to solving problems in the given contexts; ● make connections with other topics in mathematics; ● identify and correct misunderstanding in other’s attempts; ● explain the meaning and rationale for studying these topics.
3
For a variety of data types, the student can: ● analyze distributions of data using appropriate measures and graphical displays; ● appropriately model the data and discuss the strength of the relationship based on the model type selected; ● use probability to discuss the likelihood of specific outcomes based on experimental data and known distributions of theoretical data; ● apply mathematical theory to derive and prove rules of probability and application to formal statistical analysis.
2 The student sometimes needs assistance from a teacher, makes minor mistakes, and/or can do the majority of level 3 performances.
1 The student needs assistance to avoid major errors in attempting to reach score 3 performances.
0 Even with assistance, the student does not exhibit understanding of the performances listed in score 3.

ENDURING UNDERSTANDINGS ESSENTIAL QUESTIONS
EU1: Sample data will vary depending on many factors including sample method, sample size and bias.
EQ1a: What measures can be taken to limit the variability within a sample? EQ1b: How does this variability affect our decision making process? EQ2c: What is the connection between theoretical variability and experimental variability?
EU2: Making a prediction is a multistep process that requires the continual analysis and summary of data in order to find the patterns within the distribution. Some data distributions will yield predictions that will be more accurate than others.
EQ2a: How do you know when to use which measures of numerical summary for different distributions?
EQ2b: What makes one model better than another when trying to find patterns within a distribution? EQ2c: How can you tell how accurate a prediction is going to be?
EU3: Probability, the study of the likelihood of certain outcomes, can lead to a better understanding of distributions in general and of getting specific results when compared to the population.
EQ3a: What is the connection between sample data and the theoretical population data? EQ3b: How can data from a sample be used to make inferential decisions about a population?
COMMON ASSESSMENT
ALIGNMENT DESCRIPTION
LG1 EU1, 2 EQ1a, b, EQ2a, b, c M.HS.S.IC.A.1 M.HS.S.ID.A.2, 3 M.HS.S.ID.B.6 M.HS.S.ID.C.9 SMP 1-8 DOK 4
Students will create a statistical question that can be answered based on an experiment or observational study. Students will outline the design of the study and identify any lurking variables or other limitations prior to data collection. Once data is collected, students will analyze the distribution and summarize numerically and graphically. Probability will then be used to discuss the likelihood of specific outcomes and answer the initial question based on the probabilities found in order to answer the original question demonstrating a clear understanding of data production, data analysis, probability, and inferential statistics. Students will reason abstractly about their findings, derive formulas used, and use precise theoretical notation where appropriate. Students will discuss the strength of their study in the context of statistics and discuss any ways to improve their study.

TARGETED UNIT STANDARDS
DECLARATIVE KNOWLEDGE PROCEDURAL KNOWLEDGE NEW STANDARDS TO INTRODUCE
concepts of population (sample, discrete
and continuous data)
grouped data (mid-interval values, interval
width, upper and lower interval
boundaries, modal class)
presentation of data (frequency
distributions, frequency histograms,
boxplots, outliers)
Investigate samples and make conjectures about the
accuracy of the sample when compared to the
population (DOK 3)
Represent data with plots on the real number line,
using appropriate display type (DOK 2)
Explain logically and mathematically patterns and
deviations from these patterns in data (DOK 3)
Develop a logical argument for dividing data using
appropriate means, which will vary depending on the
data that is being analyzed (DOK 3)
S-ID.A.1 Represent data with plots on the real number line (dot plots, histograms, and box plots). S-IC.A.1 Understand statistics as a process for making inferences about population parameters based on a random sample from that population.
central tendency (mean, median and
mode)
cumulative frequency (cumulative
frequency graphs, median, quartiles,
percentiles)
dispersion (range, IQR, variance, standard
deviation)
effects of constant changes to the original
data
quartiles, percentiles
statistical measures and interpretations
Explain why certain statistical measures are more
appropriate than others for a variety of distributions
and interpret these values (DOK 3)
Compare distributions using appropriate measures of
center and spread (DOK 2)
Analyze the effect of changes to a data set by changing
units (DOK 3)
Identify patterns in cumulative data in a variety of
forms (DOK 3)
S-ID.A.2 Use statistics appropriate to the shape of the data distribution to compare center (median, mean) and spread (interquartile range, standard deviation) of two or more different data sets. S-ID.A.3 Interpret differences in shape, center, and spread in the context of the data sets, accounting for possible effects of extreme data points (outliers).

DECLARATIVE KNOWLEDGE PROCEDURAL KNOWLEDGE NEW STANDARDS TO INTRODUCE
equation of the regression line of y on x
linear correlation of bivariate data
mathematical & contextual interpretation
Pearson’s product-moment correlation
coefficient r
scatter diagrams; lines of best fit
use of the equation for prediction
purposes
Represent bivariate data in a variety of forms including
table, graphical and equation (DOK 3)
Assess the strength of a linear relationship using a variety of methods and synthesize these methods to determine the appropriateness of the model (DOK 3) Interpret key features of a linear model in context and comment on the values using logical arguments (DOK 3) Explain the differences between correlation and causation when it refers to relationships for bivariate data (DOK 3)
S-ID.B.6 Represent data on two quantitative variables on a scatter plot, and describe how the variables are related. S-ID.B.6.a Fit a function to the data; use functions fitted to data to solve problems in the context of the data. S-ID.B.6.b Informally assess the fit of a function by plotting and analyzing residuals. S-ID.B.6.c Fit a linear function for a scatter plot that suggests a linear association. S-ID.C.7 Interpret the slope (rate of change) and the intercept (constant term) of a linear model in the context of the data. S-ID.C.8 Compute (using technology) and interpret the correlation coefficient of a linear fit. S-ID.C.9 Distinguish between correlation and causation.
DECLARATIVE KNOWLEDGE PROCEDURAL KNOWLEDGE NEW STANDARDS TO INTRODUCE
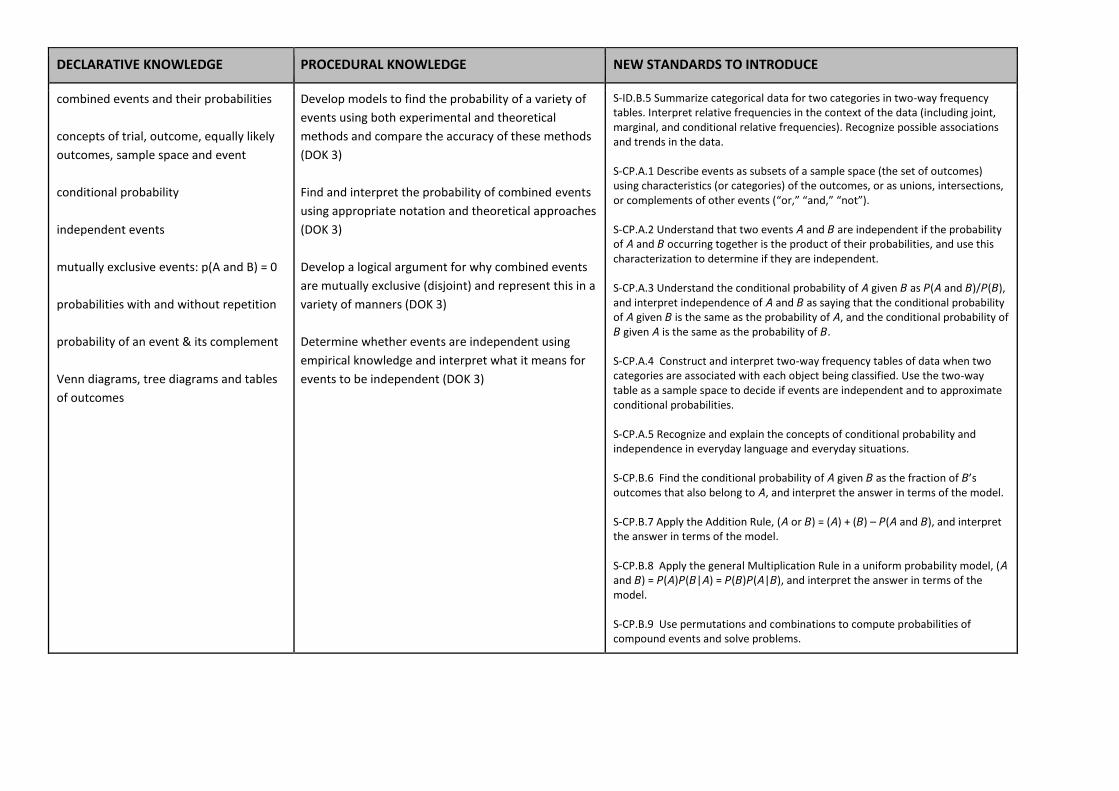
combined events and their probabilities
concepts of trial, outcome, equally likely
outcomes, sample space and event
conditional probability
independent events
mutually exclusive events: p(A and B) = 0
probabilities with and without repetition
probability of an event & its complement
Venn diagrams, tree diagrams and tables
of outcomes
Develop models to find the probability of a variety of
events using both experimental and theoretical
methods and compare the accuracy of these methods
(DOK 3)
Find and interpret the probability of combined events
using appropriate notation and theoretical approaches
(DOK 3)
Develop a logical argument for why combined events
are mutually exclusive (disjoint) and represent this in a
variety of manners (DOK 3)
Determine whether events are independent using
empirical knowledge and interpret what it means for
events to be independent (DOK 3)
S-ID.B.5 Summarize categorical data for two categories in two-way frequency tables. Interpret relative frequencies in the context of the data (including joint, marginal, and conditional relative frequencies). Recognize possible associations and trends in the data. S-CP.A.1 Describe events as subsets of a sample space (the set of outcomes) using characteristics (or categories) of the outcomes, or as unions, intersections, or complements of other events (“or,” “and,” “not”). S-CP.A.2 Understand that two events 𝘈 and 𝘉 are independent if the probability of 𝘈 and 𝘉 occurring together is the product of their probabilities, and use this characterization to determine if they are independent. S-CP.A.3 Understand the conditional probability of 𝘈 given 𝘉 as 𝘗(𝘈 and 𝘉)/𝘗(𝘉), and interpret independence of 𝘈 and 𝘉 as saying that the conditional probability of 𝘈 given 𝘉 is the same as the probability of 𝘈, and the conditional probability of 𝘉 given 𝘈 is the same as the probability of 𝘉. S-CP.A.4 Construct and interpret two-way frequency tables of data when two categories are associated with each object being classified. Use the two-way table as a sample space to decide if events are independent and to approximate conditional probabilities. S-CP.A.5 Recognize and explain the concepts of conditional probability and independence in everyday language and everyday situations. S-CP.B.6 Find the conditional probability of 𝘈 given 𝘉 as the fraction of 𝘉’s outcomes that also belong to 𝘈, and interpret the answer in terms of the model. S-CP.B.7 Apply the Addition Rule, (𝘈 or 𝘉) = (𝘈) + (𝘉) – 𝘗(𝘈 and 𝘉), and interpret the answer in terms of the model. S-CP.B.8 Apply the general Multiplication Rule in a uniform probability model, (𝘈 and 𝘉) = 𝘗(𝘈)𝘗(𝘉|𝘈) = 𝘗(𝘉)𝘗(𝘈|𝘉), and interpret the answer in terms of the model. S-CP.B.9 Use permutations and combinations to compute probabilities of compound events and solve problems.

DECLARATIVE KNOWLEDGE PROCEDURAL KNOWLEDGE NEW STANDARDS TO INTRODUCE
binomial distribution
discrete random variables & probability
distribution
expected value for discrete data
mean and variance of the binomial
distribution
Differentiate between discrete and continuous
random variables in concept, representation and in
how probabilities are found (DOK 2)
Represent discrete random variables and their
probabilities in a probability distribution and a
probability histogram (DOK 2)
Explain the requirements for a discrete random
variable to follow a binomial distribution and classify
examples as binomial or not (DOK 3)
Find and interpret the expected value, variance and standard deviation for discrete random variables (DOK 2)
S-MD.A.1 Define a random variable for a quantity of interest by assigning a numerical value to each event in a sample space; graph the corresponding probability distribution using the same graphical displays as for data distributions. S-MD.A.2 Calculate the expected value of a random variable; interpret it as the mean of the probability distribution. S-MD.A.3 Develop a probability distribution for a random variable defined for a sample space in which theoretical probabilities can be calculated; find the expected value. S-MD.A.4 Develop a probability distribution for a random variable defined for a sample space in which probabilities are assigned empirically; find the expected value. S-MD.B.5.a Find the expected payoff for a game of chance. S-MD.B.5.b Evaluate and compare strategies on the basis of expected values.
normal distributions and curves
properties of the normal distribution
standardization of normal variables (z-
values, z-scores)
Convert data to standardized values to compare values
with different properties (DOK 2)
Cite evidence to determine that a distribution is
Normal (DOK 3)
Find probabilities for distributions that are Normal and interpret these values (DOK 2)
S-ID.A.4 Use the mean and standard deviation of a data set to fit it to a normal distribution and to estimate population percentages. Recognize that there are data sets for which such a procedure is not appropriate. Use calculators, spreadsheets, and tables to estimate areas under the normal curve.

IB MATHEMATICS HL YEAR 2 DURATION:
UNIT 4: OPTION A - FURTHER STATISTICS 10 WEEKS
UNIT OVERVIEW
UNIT LEARNING GOALS
Students will analyze and interpret a variety of probability distributions and form a sound understanding of statistical significance and error analysis as it pertains to different probability models.
UNIT LEARNING SCALE
4
In addition to score 3 performances, the students can: ● provide alternative methods and approaches to solving problems in the given contexts; ● make connections with other topics in mathematics; ● identify and correct misunderstanding in other’s attempts;
● explain the meaning and rationale for studying these topics.
3
For a variety of different types of distributions, the student can: ● approach statistics in a practical way; ● demonstrate a good level of statistical understanding of discrete and continuous random variables and significance tests; ● apply distributions to the appropriate situations; ● explore mathematical theory and apply it to a variety of distributions and inference procedures; ● interpret the given results.
2 The student sometimes needs assistance from a teacher, makes minor mistakes, and/or can do the majority of level 3 performances.
1 The student needs assistance to avoid major errors in attempting to reach score 3 performances.
0 Even with assistance, the student does not exhibit understanding of the performances listed in score 3.
ENDURING UNDERSTANDINGS ESSENTIAL QUESTIONS
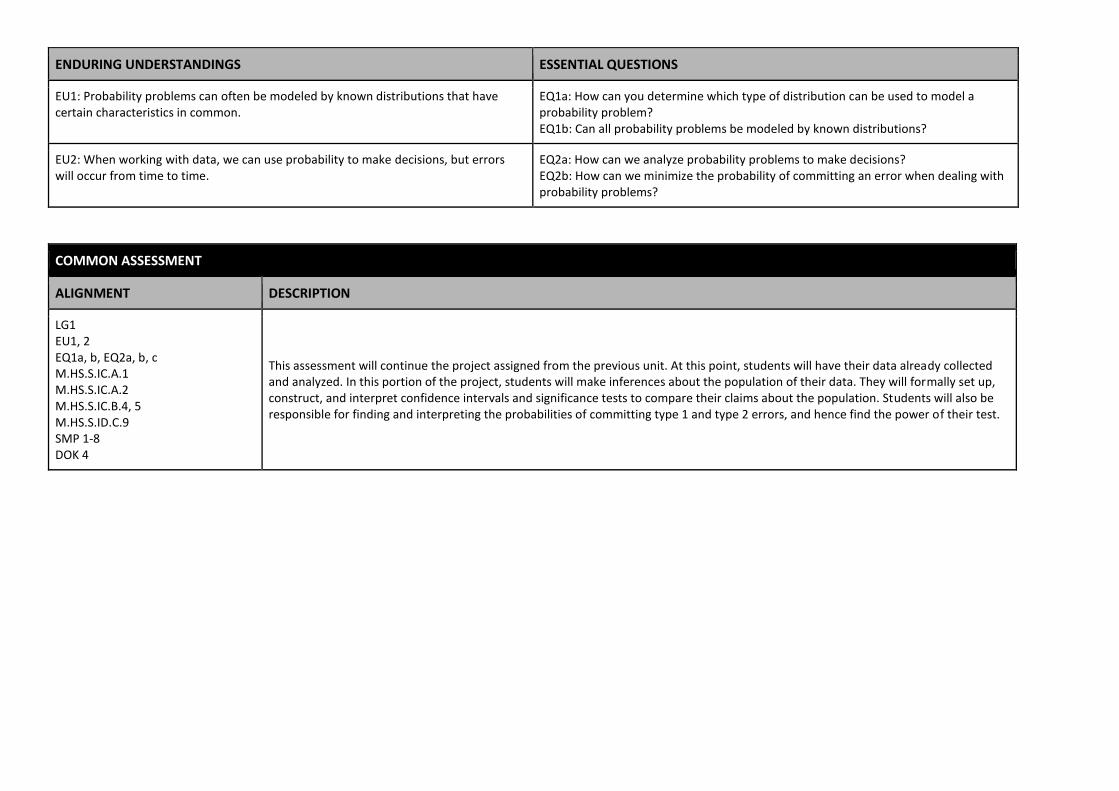
EU1: Probability problems can often be modeled by known distributions that have certain characteristics in common.
EQ1a: How can you determine which type of distribution can be used to model a probability problem? EQ1b: Can all probability problems be modeled by known distributions?
EU2: When working with data, we can use probability to make decisions, but errors will occur from time to time.
EQ2a: How can we analyze probability problems to make decisions? EQ2b: How can we minimize the probability of committing an error when dealing with probability problems?
COMMON ASSESSMENT
ALIGNMENT DESCRIPTION
LG1 EU1, 2 EQ1a, b, EQ2a, b, c M.HS.S.IC.A.1 M.HS.S.IC.A.2 M.HS.S.IC.B.4, 5 M.HS.S.ID.C.9 SMP 1-8 DOK 4
This assessment will continue the project assigned from the previous unit. At this point, students will have their data already collected and analyzed. In this portion of the project, students will make inferences about the population of their data. They will formally set up, construct, and interpret confidence intervals and significance tests to compare their claims about the population. Students will also be responsible for finding and interpreting the probabilities of committing type 1 and type 2 errors, and hence find the power of their test.

TARGETED UNIT STANDARDS
DECLARATIVE KNOWLEDGE PROCEDURAL KNOWLEDGE NEW STANDARDS TO INTRODUCE
confidence intervals for the mean of a normal population critical regions, critical values, p-values, 1-tailed and 2-tailed tests null and alternative hypotheses significance level testing hypotheses for the mean of a normal population Type I and II errors, including calculations of their probabilities
Construct confidence intervals and significance tests to determine whether sample data provides evidence for or against a claim about a population (DOK 2) Explain rationale for checking conditions required to complete confidence intervals and significance tests (DOK 3) Interpret findings of confidence intervals and significance test for sample data in relation in relation to population data (DOK 4)
S-IC.A.1 Understand statistics as a process for making inferences about population parameters based on a random sample from that population.
S-IC.A.2 Decide if a specific model is consistent with results from a given data-generating process.
S-IC.B.4 Use data from a sample survey to estimate a population mean or proportion; develop a margin of error through the use of simulation for random sampling.
S-IC.B.5 Use data from a randomized experiment to compare two treatments; use simulation to decide if differences between parameters are significant.

DECLARATIVE KNOWLEDGE PROCEDURAL KNOWLEDGE NEW STANDARDS TO INTRODUCE
bivariate distributions covariance and (population) product
moment correlation coefficient 𝜌 definition of the (sample) product moment correlation coefficient R in terms of n paired observations on X and Y; application
to the estimation of 𝜌 informal interpretation of r, the observed value of R scatter diagrams least-squares estimates of these regression lines
proof that 𝜌= 0 in the case of
independence and ±1 in the case of a linear relationship between X and Y regression of X on Y (E(X|Y = y)) and Y on X (E(Y|X = x)) are linear use of the t-statistics to test the null
hypothesis 𝜌= 0 use of these regression lines to predict the value of one of the variables given the value of the other
Create a linear model to represent the relationship between two quantitative variables and interpret the slope and y-intercept (DOK 2) Interpret the strength relationship between two quantitative variables by analyzing correlation, covariance and residual plots (DOK 3) Extend understanding of relationships for bivariate data to explore causal relationships and how they differ from relationships with strong correlation (DOK 4)
S-ID.C.7 Interpret the slope (rate of change) and the intercept (constant term) of a linear model in the context of the data.
S-ID.C.8 Compute (using technology) and interpret the correlation coefficient of a linear fit.
S-ID.C.9 Distinguish between correlation and causation.

DECLARATIVE KNOWLEDGE PROCEDURAL KNOWLEDGE PREVIOUSLY COVERED STANDARDS TO DEVELOP FURTHER
central limit theorem comparison of unbiased estimators based on variances cumulative distribution functions for both discrete and continuous random variables expectation of the product of independent random variables geometric distributions linear combination of independent normal random variables is normally distributed linear transformation of a single random variable mean of linear combinations of n random variables negative binomial distributions probability generating functions for discrete random variables probability generating functions to find mean, variance and the distribution of the sum of n independent random variables s2 as an unbiased estimator for population variance,𝜎2 unbiased estimators and estimates variance of linear combinations of n independent random variables X-bar as an unbiased estimator for population mean,𝜇
Extend understanding of discrete and continuous random variables to include Bernoulli, geometric, negative binomial, Poisson distributions and normal distributions (DOK 3) Find and interpret probabilities associated with specific outcomes of a variety of random variables (DOK 2) For each type of random variable, find and interpret the expectation and variance using a variety of methods depending on the known information (DOK 3) Explore relationships between specific types of random variables (specifically what requirements are needed for a binomial distribution to behave like a Poisson distribution or a normal distribution) (DOK 3)
S-MD.A.1 Define a random variable for a quantity of interest by assigning a numerical value to each event in a sample space; graph the corresponding probability distribution using the same graphical displays as for data distributions.
S-MD.A.2 Calculate the expected value of a random variable; interpret it as the mean of the probability distribution.
S-MD.A.3 Develop a probability distribution for a random variable defined for a sample space in which theoretical probabilities can be calculated; find the expected value.
S-MD.A.4 Develop a probability distribution for a random variable defined for a sample space in which probabilities are assigned empirically; find the expected value.
S-MD.B.5.a Find the expected payoff for a game of chance.
S-MD.B.5.b Evaluate and compare strategies on the basis of expected values.
IB MATHEMATICS HL YEAR 2 DURATION:
UNIT 4: OPTION B - FURTHER CALCULUS 10 WEEKS
UNIT OVERVIEW
UNIT LEARNING GOALS
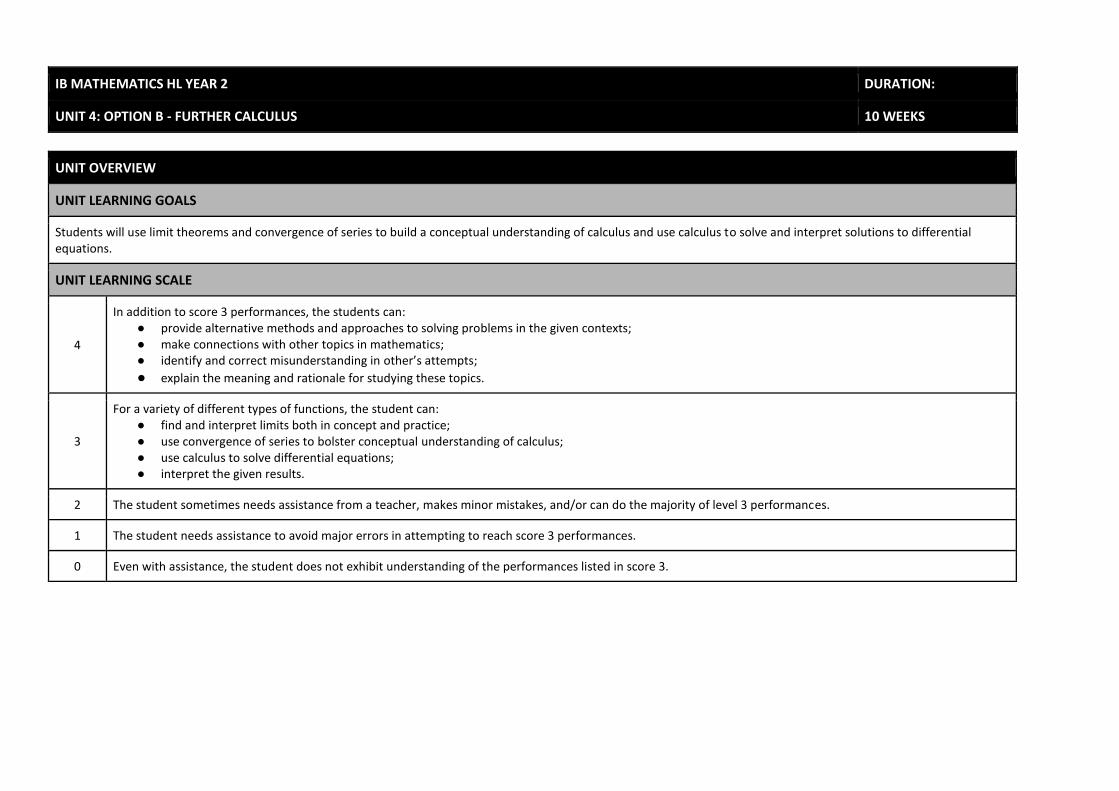
Students will use limit theorems and convergence of series to build a conceptual understanding of calculus and use calculus to solve and interpret solutions to differential equations.
UNIT LEARNING SCALE
4
In addition to score 3 performances, the students can: ● provide alternative methods and approaches to solving problems in the given contexts; ● make connections with other topics in mathematics; ● identify and correct misunderstanding in other’s attempts;
● explain the meaning and rationale for studying these topics.
3
For a variety of different types of functions, the student can: ● find and interpret limits both in concept and practice; ● use convergence of series to bolster conceptual understanding of calculus; ● use calculus to solve differential equations; ● interpret the given results.
2 The student sometimes needs assistance from a teacher, makes minor mistakes, and/or can do the majority of level 3 performances.
1 The student needs assistance to avoid major errors in attempting to reach score 3 performances.
0 Even with assistance, the student does not exhibit understanding of the performances listed in score 3.

ENDURING UNDERSTANDINGS ESSENTIAL QUESTIONS
EU1: There are a variety of methods for approximating the area under a curve for a function.
EQ1a: Which methods of approximating the area under a curve are most accurate? EQ1b: How does understanding the approximation methods help with the conceptual understanding of the more formal and more precise method for finding the area under a curve?
EU2: Curves have special properties that can be discovered and proved by exploring the derivatives at specific points and integrals over various intervals.
EQ2a: How can looking at the derivatives at specific points and integrals over various intervals help us understand more about a function? EQ2b: How can these properties be proven using Calculus? EQ2c: How can these properties be used to solve questions about specific curves?
COMMON ASSESSMENT
ALIGNMENT DESCRIPTION
LG1 EU1, 2 EQ1a, b, EQ2a, b, c M.HS.F-LE.A.3 M.HS.F-BF.A.1 M.HS.F-IF.B.4, 5 M.HS.F-IF.C.6 SMP 1-8 DOK 4
Solids of Revolution Activity: Students will take a three-dimensional object and model it using a combination of calculus and curve-fitting regression. Once students have modeled the object, they will find properties of the object (such as the volume) and create a physical model of the object using calculus techniques.
TARGETED UNIT STANDARDS
DECLARATIVE KNOWLEDGE PROCEDURAL KNOWLEDGE PREVIOUSLY COVERED STANDARDS TO DEVELOP FURTHER
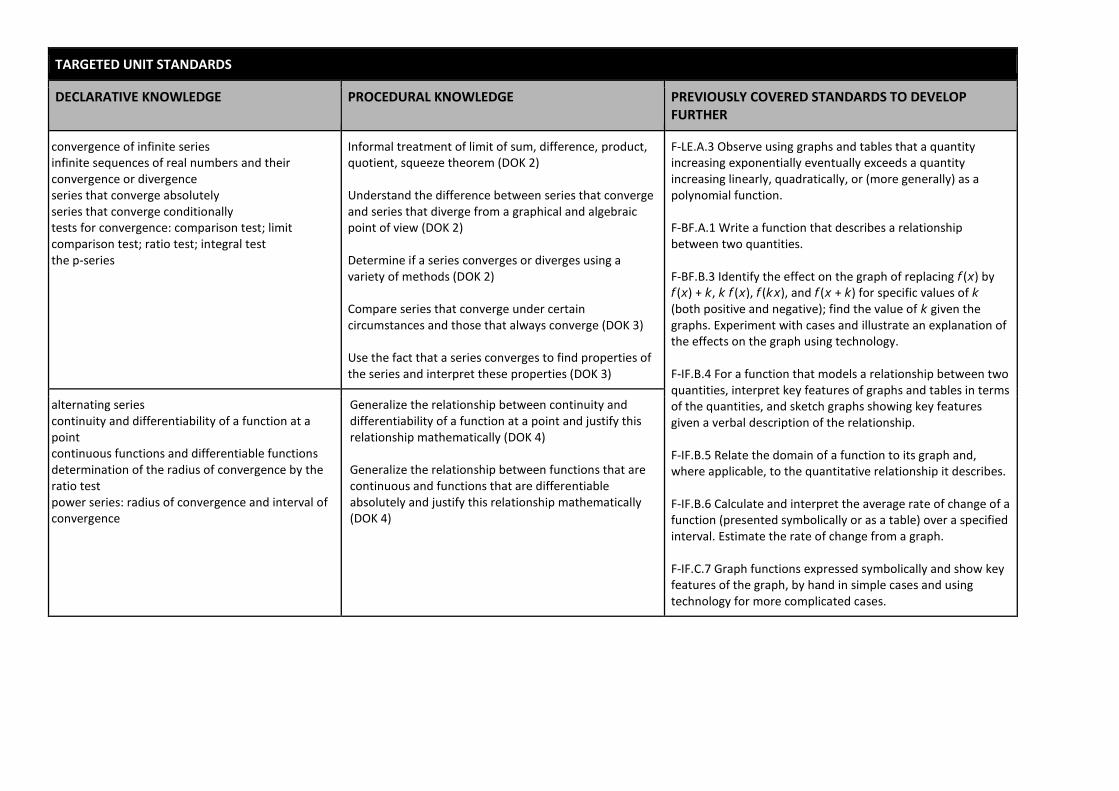
convergence of infinite series infinite sequences of real numbers and their convergence or divergence series that converge absolutely series that converge conditionally tests for convergence: comparison test; limit comparison test; ratio test; integral test the p-series
Informal treatment of limit of sum, difference, product, quotient, squeeze theorem (DOK 2) Understand the difference between series that converge and series that diverge from a graphical and algebraic point of view (DOK 2) Determine if a series converges or diverges using a variety of methods (DOK 2) Compare series that converge under certain circumstances and those that always converge (DOK 3) Use the fact that a series converges to find properties of the series and interpret these properties (DOK 3)
F-LE.A.3 Observe using graphs and tables that a quantity increasing exponentially eventually exceeds a quantity increasing linearly, quadratically, or (more generally) as a polynomial function. F-BF.A.1 Write a function that describes a relationship between two quantities. F-BF.B.3 Identify the effect on the graph of replacing 𝘧(𝘹) by 𝘧(𝘹) + 𝘬, 𝘬 𝘧(𝘹), 𝘧(𝘬𝘹), and 𝘧(𝘹 + 𝘬) for specific values of 𝘬 (both positive and negative); find the value of 𝘬 given the graphs. Experiment with cases and illustrate an explanation of the effects on the graph using technology. F-IF.B.4 For a function that models a relationship between two quantities, interpret key features of graphs and tables in terms of the quantities, and sketch graphs showing key features given a verbal description of the relationship. F-IF.B.5 Relate the domain of a function to its graph and, where applicable, to the quantitative relationship it describes. F-IF.B.6 Calculate and interpret the average rate of change of a function (presented symbolically or as a table) over a specified interval. Estimate the rate of change from a graph. F-IF.C.7 Graph functions expressed symbolically and show key features of the graph, by hand in simple cases and using technology for more complicated cases.
alternating series continuity and differentiability of a function at a point continuous functions and differentiable functions determination of the radius of convergence by the ratio test power series: radius of convergence and interval of convergence
Generalize the relationship between continuity and differentiability of a function at a point and justify this relationship mathematically (DOK 4) Generalize the relationship between functions that are continuous and functions that are differentiable absolutely and justify this relationship mathematically (DOK 4)

DECLARATIVE KNOWLEDGE PROCEDURAL KNOWLEDGE PREVIOUSLY COVERED STANDARDS TO DEVELOP FURTHER
first-order differentiable equations fundamental theorem of calculus geometric interpretation using slope fields, including identification of isoclines
homogeneous differential equation 𝑑𝑦
𝑑𝑥= 𝑓(
𝑦
𝑥)
improper integrals integral as a limit of a sum; lower and upper Riemann sums
numerical solution of 𝑑𝑦
𝑑𝑥= 𝑓(𝑥, 𝑦)using Euler’s
method solution of y’ + P(x)y = Q(x), using the integrating factor using the substitution y = vx variables separable
Make the connection between finding Riemann sums and the limit of a function (DOK 3) Make connections between derivatives and antiderivatives to find integrals for a variety of functions (DOK 3) Find and interpret improper integrals for intervals that extend to infinity (DOK 3) Find and interpret slope fields to represent first-order differential equations (DOK 2) Using Euler’s method to solve a first-order differential equation (DOK 2) Identify and interpret differential equations as homogeneous or inhomogeneous (DOK 3) Conceptually and in practice understand that there is a point over a continuous and differentiable interval where the first derivative equals the average rate of change over that interval (DOK 3)
F-LE.A.3 Observe using graphs and tables that a quantity increasing exponentially eventually exceeds a quantity increasing linearly, quadratically, or (more generally) as a polynomial function. F-BF.A.1 Write a function that describes a relationship between two quantities. F-BF.B.3 Identify the effect on the graph of replacing 𝘧(𝘹) by 𝘧(𝘹) + 𝘬, 𝘬 𝘧(𝘹), 𝘧(𝘬𝘹), and 𝘧(𝘹 + 𝘬) for specific values of 𝘬 (both positive and negative); find the value of 𝘬 given the graphs. Experiment with cases and illustrate an explanation of the effects on the graph using technology. F-IF.B.4 For a function that models a relationship between two quantities, interpret key features of graphs and tables in terms of the quantities, and sketch graphs showing key features given a verbal description of the relationship. F-IF.B.5 Relate the domain of a function to its graph and, where applicable, to the quantitative relationship it describes. F-IF.B.6 Calculate and interpret the average rate of change of a function (presented symbolically or as a table) over a specified interval. Estimate the rate of change from a graph. F-IF.C.7 Graph functions expressed symbolically and show key features of the graph, by hand in simple cases and using technology for more complicated cases.
l’Hopital’s rule or the Taylor series Maclaurin series for 𝑒𝑥, sin x, cos x, 𝑙𝑛(1 + 𝑥), (1 +𝑥)𝑝, where p is an element of Q mean value theorem Rolle’s theorem Taylor polynomials; the Lagrange form of the error term Taylor series developed from differential equations
the evaluation of limits of the form 𝑙𝑖𝑚𝑥→𝑎
𝑓(𝑥)
𝑔(𝑥)and
𝑙𝑖𝑚𝑥→∞
𝑓(𝑥)
𝑔(𝑥)
use of substitution, products, integration, and differentiation to obtain other series
Understand Rolle’s theorem as a special case of the mean value theorem for finding an interval that must contain where the first derivative is 0 (DOK 2) Create and interpret Taylor polynomials to understand the sum of terms calculated from the derivatives as a single point (DOK 3) Represent and interpret Taylor polynomials graphically using Maclaurin series (DOK 3) Apply and interpret limits in different forms to find derivative functions when other rules are not applicable (DOK 3) Apply and interpret l’Hopital’s rule to differentiate functions that cannot be differentiated using more traditional rules (DOK 3)