maternal green tea extract supplementation to rats fed a high-fat diet ameliorates insulin...
TRANSCRIPT

Available online at www.sciencedirect.com
Journal of Nutritional Biochemistry 23 (2012) 1655–1660
Maternal green tea extract supplementation to rats fed a high-fat diet amelioratesinsulin resistance in adult male offspring☆
Shiying Li, Iris M.Y. Tse, Edmund T.S. Li⁎
Food and Nutritional Science Division, School of Biological Sciences, The University of Hong Kong, Hong Kong, People's Republic of China
Received 3 May 2011; received in revised form 22 November 2011; accepted 23 November 2011
Abstract
Maternal overnutrition is associated with increased risk of metabolic disorders in the offspring. This study tested the hypothesis that maternal green tea (GT)supplementation can alleviate metabolic derangements in high-fat-diet-fed rats born of obese dams. Female Sprague–Dawley rats were fed low-fat (LF, 7%),high-fat (HF, 30%) or HF diet containing 0.75% or 1.0% GT extract (GT1, GT2) prior to conception and throughout gestation and lactation. Both doses of GTsignificantly improved metabolic parameters of HF-fed lactating dams (Pb.05). Birth weight and litter size of offspring from HF dams were similar, but GTsupplementation led to lighter pups on day 21 (Pb.05). The weaned male pups received HF, GT1 or GT2 diet (dam/pup diet groups: LF/HF, HF/HF, HF/GT1, HF/GT2, GT1/HF and GT2/HF). At week 13, they had similar weight but insulin resistance index (IRI), serum nonesterified fatty acid (NEFA) and liver triglyceride ofrats born to GT dams were 57%, 23% and 26% lower, accompanied by improved gene/protein expressions related to lipid and glucose metabolism, compared withthe HF/HF rats (Pb.05). Although HF/GT1 and HF/GT2 rats had lower serum NEFA, their insulin and IRI were comparable to HF/HF rats. This study shows thatmetabolic derangements induced by an overnourished mother could be offset by supplementing GT to the maternal diet and that this approach is more effectivethan giving GT to offspring since weaning. Hence, adverse effects of developmental programming are reversible, at least in part, by supplementing bioactive foodcomponent(s) to the mother's diet.© 2012 Elsevier Inc. All rights reserved.
Keywords: Developmental programming; High-fat; Green tea; Insulin resistance; Offspring
1. Introduction
A growing body of literature suggests a causal link betweenmaternal and child obesity [1–3]. With the increasing proportion ofoverweight and obesity in women of child-bearing age [4], it ispertinent to investigate the role of maternal overnutrition andexplore potential intervening strategies. To this end, emergingevidence [5–8] suggests that the increased risk of chronic disease inlater life is related, at least in part, to the process of developmentalprogramming originally proposed by Hales and Baker to explain theimpact of undernutrition in utero and early postnatal life [9].
Numerous studies have demonstrated a potential role forbioactive food components (BFCs) as an adjunct to the treatment ofobesity and metabolic syndrome [10,11]. Common to these BFCs isthat most possess strong antioxidant properties. Indeed, a recentstudy had demonstrated a protective role of supplementing antiox-idants to the dam's diet. In the latter study, maternal-obesity-inducedoxidative imbalance was restored when Western-diet-fed damsreceived a mixture of antioxidant supplement, and that benefit inoffspring was a decrease in adiposity [12]. The type of vitamin
☆ This study was supported by an HKU grant.⁎ Corresponding author. Tel.: +852 2299 0807; fax: +852 2559 9114.E-mail address: [email protected] (E.T.S. Li).
0955-2863/$ - see front matter © 2012 Elsevier Inc. All rights reserved.http://dx.doi.org/10.1016/j.jnutbio.2011.11.008
supplement obviously is critical because others have reportedincrease in adiposity in young rats fed an obesogenic diet whendams received excessive amount of vitamin during pregnancy [13].
Our interest in tea stems from the fact that it is a popular beveragefor many cultures and is consumed worldwide. The health benefits oftea have appeared in numerous reviews, and the effects are usuallyattributable to the catechins [14,15]. Epigallocatechin gallate (EGCG)is the most abundant catechin in green tea. Being an insulinpotentiating factor and antioxidant, EGCG is postulated to play arole in preventing metabolic syndrome [15]. Dietary EGCG supple-mentation reduced body fat in male mice [16], and EGCG injected intolean and obese Zucker rats significantly reduced blood glucose andinsulin levels [17]. Dietary EGCG supplementation also reduced bodyweight as well as plasma glucose, insulin and lipids in human [18,19].
To our best knowledge, the effect of GT on developmentalprogramming has not been studied. Hence, this study aimed to testthe hypothesis that the beneficial effects of green tea extract (GTE) onmetabolic control of dams would pass on to the offspring as adults,that is, themetabolic derangements in offspring born to high-fat-diet-fed dams could be ameliorated if dams are supplemented with GTE.Different frommost programming studies inwhich the offspringwerenormally fed a control diet, in the present study, the male pups werealso given a high-fat diet. This two-generation fat exposure designaims to simulate the worse case scenario in our modern societies. We

1656 S. Li et al. / Journal of Nutritional Biochemistry 23 (2012) 1655–1660
first established the impacts of maternal high fat in the presence andabsence of GTE supplementation on dams and then compared theeffects of prenatal vs. postweaning GTE supplementation on maleoffspring. Males were selected because the programming effects oninsulin response appear to be gender specific, with insulin resistanceand hyperinsulinemia readily observed in male pups born of obesedams [20]. In this study, two doses of GTE were added to the maternalHF diet or postweaning HF diet separately, generating six maternal/postweaning diet combinations: LF/HF, HF/HF, HF/GT1, HF/GT2,GT1/HF and GT2/HF pups. The glucose, insulin concentration andlipid profile of adult male were monitored, and changes in theirmetabolic regulation by maternal dietary manipulations weredescribed in the context of relevant mRNA/protein expressions inliver, adipose tissues and muscle.
2. Materials and methods
2.1. GTE and experimental diets
The GTE was a commercial product (Teavigo) purchased from DSM NutritionProducts Ltd., Switzerland. It contains a minimum of 90% EGCG.
The formulation of diets was based on the AIN-93G recommendation [21]. Thecontrol diet was the low-fat (LF) diet which contained corn oil (70 g/kg), casein(200 g/kg), corn starch (529.5 g/kg), mineral mix (35 g/kg) and vitamin mix (10 g/kg).The high-fat (HF) diet contained corn oil (70 g/kg), Crisco shortening (230 g/kg;Procter & Gamble, Cincinnati, OH, USA), casein (235 g/kg), corn starch (255.5 g/kg),mineral mix (42 g/kg) and vitamin mix (12 g/kg). In addition, all diets containedsucrose (100 g/kg), cellulose (50 g/kg) andmiscellaneous ingredients (2.5 g/kg cholinebitartrate, 3.0 g/kg L-cystine and 0.014 g/kg tert-butylhydroquinone). Green tea extractwas added to the HF diet at the expense of cornstarch. GT1 and GT2 diets contained,respectively, 7.5 g and 10 g GTE/kg. Energy density of the LF and HF diet was 16.5 and21.1 MJ/kg, respectively.
2.2. Animal experiments
All animal protocols were approved by the Committee on the Use of Live Animals inTeaching and Research at The University of Hong Kong (no. 1949-09). Virgin femaleSprague–Dawley rats, at 4 weeks of age, andmale Sprague–Dawley rats (for mating), at7 weeks of age, were obtained from the animal unit of the Medicine Faculty. Rats werehoused individually and kept in a controlled environment at 22°C under a 12-h-light/12-h-dark cycle with light on from 7:00 a.m. to 7:00 p.m. Water and laboratoryfood (Lab Diet, The Richmond Standard; PMI Nutritional International Inc., St. Louis,MO, USA) were available ad libitum to male rats at all time and female rats for a fewdays before they were assigned to their respective diet groups. Food intake and bodyweight were measured two to three times weekly.
The female rats (n=8 per group) were given LF, HF, GT1 or GT2 diet for 8 weeks.Tail blood was collected at the end of week 8. Starting at week 9, female rats and malerats (450–500 g) were housed together. On the day that a copulation plug was found(referred to as G1 in Table 1), the pregnant female was separately housed and
Table 1Body weight, energy intake, energy efficiency and fat mass of dams1
LF HF GT1 GT2
Before matingBody weight (week 1), g 116±6 120±3 119±3 118±3Body weight (week 8), g 311±10b 345±10a 295±8bc 278±5c
Weight gain (week 1–8), g 195±13b 225±8a 176±8bc 160±4c
Energy intake (week 1–8), MJ 16.3±0.3ab 17.2±0.3a 15.6±0.4bc 15.0±0.5c
Energy efficiency (week 1–8),g gain/MJ consumed
11.9±0.6ab 13.1±0.3a 11.3±0.4bc 10.6±0.3c
GestationBody weight (G1), g 319±12ab 333±9a 290±8b 289±13b
Body weight (G15),2 g 417±19 427±16 378±14 379±19Weight gain (G1–15), g 98±11 94±8 88±8 89±10Energy intake (G1–21), MJ 8.3±0.7 9.5±0.4 9.4±0.3 8.3±0.3LactationBody weight (PPD1), g 380±16ab 408±17a 354±14b 346±14b
Weight change (PPD1–21), g −25±7bc −46±7c −12±8ab 4±7a
Energy intake (PPD1–21), MJ 17.1±1.2 14.4±1.3 15.2±0.7 14.4±0.9Visceral fat (PPD21), g 14.8±1.7ab 18.0±2.5a 11.2±2.1b 11.6±1.6b
1 Values are means±S.E.M., n=8. Means within a row lacking a common superscriptlettera,b,c,d differ (Pb.05).
2 To avoid disturbing the dams near parturition, body weight of dams was onlymeasured up to day 15 of gestation.
remained on its original diet throughout gestation and lactation. At parturition, thepups were weighed, and litter size was standardized to eight per dam. At weaning[postpartum day (PPD) 21], male pups (with median body weight [BW]) were selectedfrom each litter and weaned to the HF, GT1 or GT2 diet. Hence, there were sixmaternal/postweaning diet groups: LF/HF, HF/HF, HF/GT1, HF/GT2, GT1/HF andGT2/HF. These rats were kept on their respective diet for 10 weeks. Both the damsand offspring were killed by decapitation in the absence of anesthesia at the end oflactation (PPD 21) and week 13 of age, respectively. Blood was collected from thecervical wound into chilled test tube and centrifuged (2000g at 4°C). Serum collectedtogether with liver, visceral fat [22], brown adipose tissue and the red medial part ofgastrocnemius [23] were stored at −80°C.
2.3. Biochemical assays
Plasma glucose was assayed immediately using a commercially available glucoseoxidase kit (kit no. 510-A, Sigma Chemical). Serum insulin was determined by enzyme-linked immunosorbent assay (ELISA) kit (Mercodia rat insulin 10-1124-01; MercodiaAB, Uppsala, Sweden). The insulin resistance index (IRI) was calculated as the productof insulin and glucose concentration (10−3 pmol insulin · mmol glucose · L−2) for eachindividual rat [24].
Serum, liver and muscle triglyceride (TG) were measured using TriglycerideLiquiColor (2200-430, Stanbio Laboratory). Cholesterol was measured using Choles-terol Liquid Stable Reagent (TR13421, Thermo Scientific). Serum nonesterified fattyacid (NEFA) was measured using Labassay NEFA (294-63601, Wako). Serum leptin andadiponectin were determined by ELISA kits (EZRL-83K, EZRADP-62K, Linco, USA).
2.4. RNA isolation and reverse transcriptase polymerase chain reaction (RT-PCR) analysis
RNA was extracted by the TRIZOL reagent according to manufacturer's protocol(Invitrogen). First-strand cDNAs were synthesized from 2 μg of total RNA using 200 Uof M-MLV reverse transcriptase (28025-021, Invitrogen), RNaseOUT RecombinantRibonuclease Inhibitor (10777-019, Invitrogen), oligo (dT) primers (18418-012,Invitrogen) and dNTP mix (US77212, Amersham Biosciences). The PCR was performedin the presence of Taq DNA polymerase with PCR buffer and MgCl2 (Bio-firm), dNTPmix (US77212, Amersham Biosciences), and forward and reverse primers (Invitrogen).Sequences of the primers used in the RT-PCR reaction are shown in Table S1.
2.5. Western blotting analysis
The liver and gastrocnemius muscle tissues were homogenized with a tissue teaser(Biospec Products) in a lysis buffer (1% Triton X-100, 25 mmol/L HEPES, 150 mmol/LNaCl, 1 mmol/L EDTA disodium salt, 1 mmol/L dithiothreitol) with added proteaseinhibitors: 2 μg/ml aprotinin, 10 μg/ml leupeptin and 1 mM phenylmethylsulfonylfluoride (Usb). Samples were centrifuged at 600g for 10 min to pellet the nuclei.Supernatants were centrifuged at 16,000g for 20 min. The cytosolic fraction wascollected. Protein concentration in the samples was measured using the BradfordReagent (Bio-Rad). Fifty micrograms of protein of each sample was applied forelectrophoresis on 12.5% sodium dodecyl sulfate polyacrylamide gel electrophoresisgels and transferred to polyvinylidene diflouride membrane (GE Healthcare).Membranes were blocked with 5% nonfat dried milk powder in TBST buffer (50mmol/L Tris-HCl, pH 7.4, 0.15 mol/L NaCl, .05% Tween 20) for 2 h. Themembranes werethen incubated for 2 h with anti-PGC1α (ab72230, Abcam) (1:1000), anti-GLUT4 (sc-1608, Santa Cruz) (1:1000), anti-SREBP1 (sc-13551, Santa Cruz) (1:1000), anti-G6pase(sc-33839, Santa Cruz) (1:1000) and anti-tubulin (sc-5286, Santa Cruz) (1:4000). α-Tubulin was used as an internal control to verify equal loading of the protein.Horseradish-peroxidase-conjugated secondary antibodies (sc-2004, sc-2031, sc-2020,Santa Cruz) were used. Membranes were developed using ECL Western blottingreagents (Amersham Biosciences), and the chemiluminescence was detected onHyperfilm ECL (Amersham Biosciences). The band intensities were measured withQuantity One software (Bio-Rad).
2.6. Statistical analysis
Data are expressed as means±S.E.M. Analyses were carried out using SPSS 12.0 forWindows. Data were analyzed by analysis of variance followed by post hoc Duncan'smultiple range tests to determine treatment effect and compare differences amonggroup means. Differences were considered significant at Pb.05.
3. Results
3.1. Weight gain, body fat and energy efficiency
Before mating, GTE-supplemented females gained less weight andhad lower energy efficiency than HF females (Table 1, Pb.05). The GT1rats had similar weight gain and energy efficiency compared to the LFrats, while the GT2 rats gained less and had lower energy efficiencythan the LF rats (Table 1, Pb.05). During gestation, weight gain and

Table 2Serum, liver and muscle parameters of dams at the end of lactation (PPD21)1
Parameter LF HF GT1 GT2
TG, mg.dl−1 58.5±1.4b 72.3 ±5.4a 47.6±4.1b 50.2±1.8b
Cholesterol, mg.dl−1 61.0±1.1b 71.4±4.7a 56.0±2.7b 56.6±4.2b
NEFA, mEq.L−1 1.01±0.07ab 1.09±0.10a 0.76±0.09b 0.79±0.07b
Insulin, µg.L−1 0.13±0.01b 0.18±0.03a 0.11±0.01b 0.10±0.01b
Glucose, mg.dl−1 167±8 166±8 166±5 162±7IRI, 10−3 pmol.mmol.L−3 0.22±0.02ab 0.29±0.04a 0.18±0.02b 0.16±0.01b
Leptin, ng.ml−1 1.3±0.2b 2.4±0.3a 1.0±0.1b 1.2±0.2b
Adiponectin, ng.ml−1 18.4±3.0 14.2±3.0 18.3±4.0 17.6±1.4Liver TG, mg/g tissue 12.4±0.4b 16.0±1.1a 10.5±0.8b 10.8±1.5b
G TG, mg/g tissue 2.3±0.3b 6.1±0.7a 2.8±0.4b 3.4±0.3b
1 Values are means±S.E.M., n=8. Means within a row lacking a common superscriptlettera,b,c,d differ (Pb.05).
1657S. Li et al. / Journal of Nutritional Biochemistry 23 (2012) 1655–1660
energy intake were not different between the GTE-supplemented andHF dams (Table 1). One day postpartum (PPD1), GTE-supplementeddamswere lighter than the HF dams (Table 1, Pb.05), but not differentfrom the LF dams. All dams lost weight throughout the lactationperiod, but loss was significantly less in the GTE-supplemented damsthan the HF dams (Table 1, Pb.05). Energy intake among the fourgroups, however, was not different. At the end of lactation (PPD21),the GTE dams had less visceral fat than the HF dams (Table 1, Pb.05).
On PPD1, the bodyweight and litter size of offspring born to the HFdams and the GTE dams were not different (Table 3). But on PPD21,offspring from the GTE dams weighed less than those from the HFdams (Table 3, Pb.05). At week 13, there was no difference in bodyweight and visceral fat mass among the six groups. The GT2/HF group,however, demonstrated higher energy efficiency than the HF/HFgroup (Table 3).
3.2. Glucose and insulin sensitivity
On PPD21, the HF dams had higher serum insulin concentrationthan the LF dams (Table 2). GTE supplementation decreased seruminsulin in the HF dams to the level of the LF dams. There was nodifference in plasma glucose concentration among the LF, HF and GTEdams (Table 2).
At week 13, male rats born to the LF dams (LF/HF) tended to havelower serum insulin concentration and IRI compared with those fromHF dams (HF/HF, HF/GT1 and HF/GT2). And rats born to the GTE-
Table 3Effects of maternal and postweaning diets on growth and biochemical parameters of male of
Lactation2 LF HF
Litter size (PPD1)3 12±1 14BW (PPD1), g 7.0±0.1a 6.5BW (PPD21), g 63.8±0.9a 62Postweaning LF/HF HF/HF HFBW (week 13), g 523±23 558±19 51EI4, MJ 30.0±1.3ab 30.0±0.9ab 27EE5, g gain/MJ consumed 15.6±0.4c 16.4±0.3bc 16Insulin, µg.L−1 1.0±0.2ab 1.2±0.2a 1.4Glucose, mg.dl−1 180±10a 169±11a 15IRI, 10−3 pmol.mmol.L−3 1.77±0.44ab 2.01±0.41a 2.2Adiponectin, ng/ml 22.6±1.9a 14.7±1.5b 19NEFA, mEq.L−1 0.73±0.03ab 0.81±0.05a 0.6TG, mg.dl−1 96.0±4.1b 122.9±5.8a 88Cholesterol, mg.dl−1 99.0±4.4ab 108.3±4.7a 88Liver TG, mg/g tissue 21.1±0.5bc 23.0±0.6a 22G TG, mg/g tissue 4.3±0.2d 7.3±0.5a 6.4Visceral fat, g 32±3 41±3 29
1 Values are means±S.E.M., n=7–8. Means within a row lacking a common superscript let2 Dam's diet during lactation.3 Litter size per dam on PPD1.4 EI=energy intake, from week 4 to week 13.5 EE=energy efficiency, from week 4 to week 13.
supplemented dams (GT1/HF and GT2/HF) had lower serum insulinconcentration and IRI than those born to the HF dams (HF/HF)(Pb.05), while rats from the HF dams who received GTE supplemen-tation postweaning did not experience reduction in serum insulin andIRI (HF/GT1 and HF/GT2 vs. HF/HF) (Table 3). Concentration of serumglucose among the GT1/HF, HF/HF, HF/GT1 and LF/HF rats was notdifferent, but the GT2/HF and HF/GT2 rats had lower serum glucoseconcentration compared to the HF/HF rats (Table 3, Pb.05).
3.3. Lipid profiles in serum, liver and muscle and serum adipocytokines
At the end of lactation (PPD21), the HF dams had elevated serumTG and cholesterol, as well as liver and gastrocnemius muscle TG,compared with the LF dams. But both doses of GTE supplementationameliorated these abnormalities (Table 2). GTE supplementation alsolowered serum NEFA in the HF dams. Furthermore, the HF dams hadhigher serum leptin concentration than the LF dams, while GTEsupplementation lowered the leptin concentration in the HF dams(Table 2, Pb.05).
At week 13, male rats born to the HF dams (HF/HF) had higherserum, liver and gastrocnemius muscle TG compared with those fromthe LF dams (LF/HF), while maternal GTE supplementation amelio-rated these abnormalities in the HF offspring (GT1/HF and GT2/HF).Maternal GTE supplementation also lowered serum cholesterol andNEFA in the HF offspring (GT1/HF and GT2/HF vs. HF/HF) (Table 3,Pb.05). Postweaning GTE supplementation alone (HF/GT1 andHF/GT2) resulted in lower serum TG, NEFA and cholesterol comparedwith the HF/HF rats. However, there was no difference in liver andgastrocnemius muscle TG concentration among the HF/GT1, HF/GT2and HF/HF rats (except that the HF/GT2 rats had lower muscle TGthan the HF/HF rats) (Table 3).
3.4. mRNA expression
The HF dams had elevated mRNA expression of hepatic glucose-6-phosphatase (G6pase) and sterol regulatory element binding protein(SREBP-1c), but decreased mRNA expression of adiponectin in whiteadipose tissue (WAT) and insulin receptor (IR) in liver as well as IRand PGC-1α in gastrocnemius (G), compared with the control dams(Fig. 1, Pb.05). Both GTE supplements normalized mRNA expressionof hepatic G6pase and SREBP-1c, as well asmuscle PGC-1α and IR. The
fspring at week 131
GT1 GT2
±1 13±1 13±1±0.1b 6.4±0.1b 6.5±0.1b
.3±0.9a 55.0±1.2b 56.0±0.8b
/GT1 HF/GT2 GT1/HF GT2/HF6±21 520±19 552±17 576±15.1±1.1c 27.3±1.8bc 30.8±0.7a 29.8±0.7abc
.9±0.2ab 16.7±0.3ab 16.0±0.2bc 17.2±0.2a
±0.2a 1.3±0.2a 0.6±0.1b 0.6±0.1b
8±9ab 137±13b 160±7.0ab 135±5b
0±0.31a 1.72±0.35ab 0.92±0.16b 0.82±0.17b
.9±1.3a 21.7±0.8a 20.0±1.5a 18.9±0.7a
1±0.05b 0.63±0.05b 0.60±0.05b 0.64±0.05b
.8±8.9b 78.7±9.7b 84.0±7.0b 97.6±10.8b
.2±3.0b 86.5±3.1b 93.9±4.3b 92.7±5.6b
.0±0.4ab 21.6±0.4ab 20.2±0.4c 18.6±0.5d
±0.3ab 4.1±0.4d 5.4±0.5bc 5.2±0.3cd
±3 31±3 37±3 36±3
tera,b,c,d differ (Pb.05).

Fig. 1. Relative mRNA levels of liver (L) G6pase, SREBP-1 and IR, gastrocnemius (G)PGC-1α and IR, and WAT adiponectin in LF-, HF-, GT1- and GT2-diet-fed dams onPPD21. Each bar represents mean±S.E.M, n=8. Means without a common letterdiffer, Pb.05.
Fig. 2. Relative mRNA levels of genes in (A) liver, (B) gastrocnemius and (C) WAT andBAT⁎ of week 13 male offspring fed with HF, GT1 or GT2 diet (LF/HF, HF/HF, HF/GT1,HF/GT2, GT1/HF and GT2/HF). Each bar represents mean±S.E.M, n=7–8. Meanswithout a common letter differ, Pb.05.
1658 S. Li et al. / Journal of Nutritional Biochemistry 23 (2012) 1655–1660
maternal supplementations also increased mRNA expression ofhepatic IR and WAT adiponectin (Fig. 1, Pb.05).
Comparedwith the HF/HF rats, rats born to the GTE-supplementeddams had mRNA expression reduced for hepatic G6pase and SREBP-1c. Maternal GTE supplements, however, restored or furtherincreased mRNA expression for GLUT4 and adiponectin in WAT,uncoupling protein 1 (UCP1) in brown adipose tissue (BAT) andhepatic IR (Pb.05) to that of the LF/HF rats. Maternal 0.75% GTEsupplementation also restored muscle mRNA expression for PGC-1α,IR and GLUT4 to that of the LF/HF offspring.
GTE supplementation in the postweaning diet led to lower hepaticSREBP-1c in male offspring born to the HF dams (HF/GT1 and HF/GT2vs. HF/HF; Pb.05). One percent GTE in the postweaning diet increasedexpression of hepatic IR and WAT adiponectin, whereas 0.75% GTEincreased IR and PGC-1α in muscle (Fig. 2).
3.5. Protein expression
GTE supplementation to thematernal diet or the postweaning dietlowered the protein level of hepatic G6pase and SREBP-1 in the HFrats (Fig. 3A). Andmaternal 0.75% GTE supplementation increased theprotein level of PGC-1α and GLUT4 in muscle of the HF rats (GT1/HFvs. HF/HF), while 1% GTE supplementation increased protein level ofPGC-1α, but not GLUT4 (GT2/HF vs. HF/HF) (Fig. 3B). When added tothe postweaning diet, 0.75% GTE increased the protein level of PGC-1α and GLUT4 in gastrocnemius (HF/GT1 vs. HF/HF) (Fig. 3B).
4. Discussion
The powerful effect of developmental programming is clearlymanifested in this study. Although all pups were weaned to the HFdiet, serum TG and tissue lipid accumulation in offspring born toobese dams were further elevated when compared to those born tononobese dams. Hence, maternal HF diet could predispose offspringto metabolic syndrome. Our objective was to intervene programmingusing BFC, and in this context, male offspring born to GTE-supplemented dams exhibited significant improvements in all aspectsof metabolic profiles to a condition that is comparable to offspringborn to dams fed an LF diet.
Through developmental programming, maternal HF intake canpredispose the offspring to glucose intolerance and increase adiposityin adulthood [5,25]. This concept is further substantiated by thepresent results which employed a unique two-generation fatexposure design to simulate the dietary practice of some population
subgroups. Although the HF-diet-fed offspring born to HF-diet-feddams (HF/HF) were not significantly heavier compared with thosefrom LF-diet-fed dams (LF/HF) at week 13, the former did exhibitsignificantly higher serum andmuscle TG concentration, lower serumadiponectin concentration and 28% more visceral fat mass (Table 3).These results are in keeping with those from our laboratory [26] aswell as those others [27,28] in that not all phenotypic features in theoffspring derived from the two-generation exposure model wouldworsen compared with those from one-generation exposure. How-ever, the similar metabolic profiles observed between dams andoffspring lend support to the notion of programming effects of
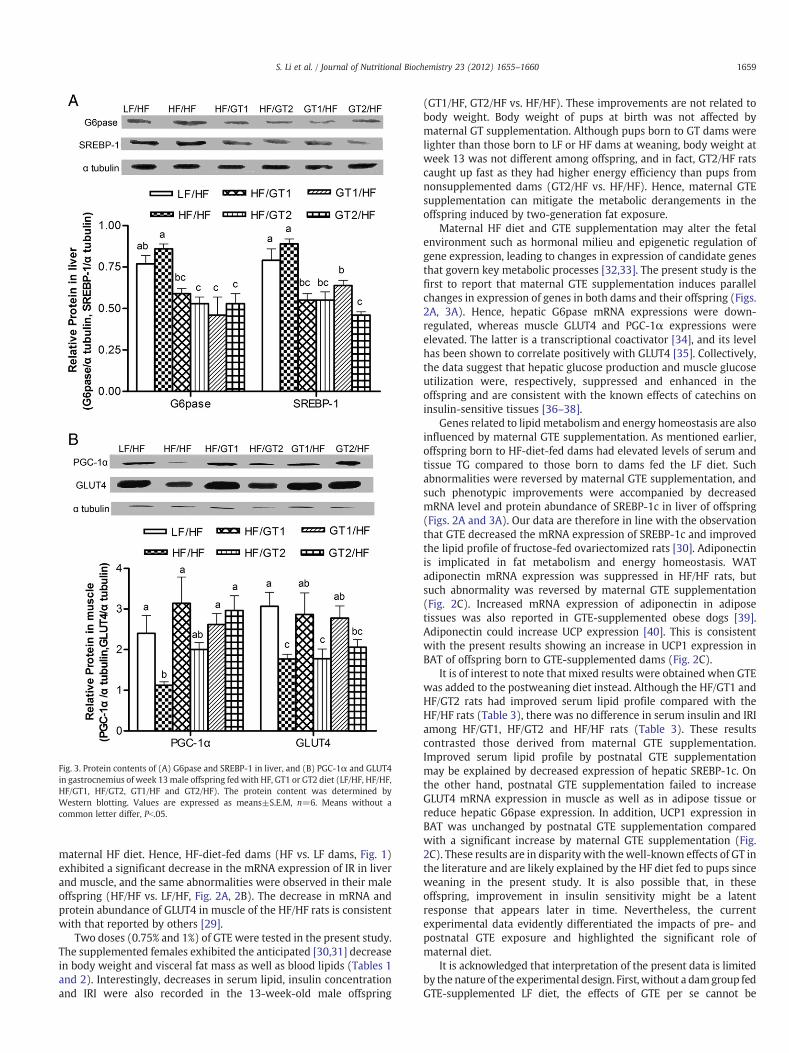
Fig. 3. Protein contents of (A) G6pase and SREBP-1 in liver, and (B) PGC-1α and GLUT4in gastrocnemius of week 13male offspring fed with HF, GT1 or GT2 diet (LF/HF, HF/HF,HF/GT1, HF/GT2, GT1/HF and GT2/HF). The protein content was determined byWestern blotting. Values are expressed as means±S.E.M, n=6. Means without acommon letter differ, Pb.05.
1659S. Li et al. / Journal of Nutritional Biochemistry 23 (2012) 1655–1660
maternal HF diet. Hence, HF-diet-fed dams (HF vs. LF dams, Fig. 1)exhibited a significant decrease in the mRNA expression of IR in liverand muscle, and the same abnormalities were observed in their maleoffspring (HF/HF vs. LF/HF, Fig. 2A, 2B). The decrease in mRNA andprotein abundance of GLUT4 in muscle of the HF/HF rats is consistentwith that reported by others [29].
Two doses (0.75% and 1%) of GTE were tested in the present study.The supplemented females exhibited the anticipated [30,31] decreasein body weight and visceral fat mass as well as blood lipids (Tables 1and 2). Interestingly, decreases in serum lipid, insulin concentrationand IRI were also recorded in the 13-week-old male offspring
(GT1/HF, GT2/HF vs. HF/HF). These improvements are not related tobody weight. Body weight of pups at birth was not affected bymaternal GT supplementation. Although pups born to GT dams werelighter than those born to LF or HF dams at weaning, body weight atweek 13 was not different among offspring, and in fact, GT2/HF ratscaught up fast as they had higher energy efficiency than pups fromnonsupplemented dams (GT2/HF vs. HF/HF). Hence, maternal GTEsupplementation can mitigate the metabolic derangements in theoffspring induced by two-generation fat exposure.
Maternal HF diet and GTE supplementation may alter the fetalenvironment such as hormonal milieu and epigenetic regulation ofgene expression, leading to changes in expression of candidate genesthat govern key metabolic processes [32,33]. The present study is thefirst to report that maternal GTE supplementation induces parallelchanges in expression of genes in both dams and their offspring (Figs.2A, 3A). Hence, hepatic G6pase mRNA expressions were down-regulated, whereas muscle GLUT4 and PGC-1α expressions wereelevated. The latter is a transcriptional coactivator [34], and its levelhas been shown to correlate positively with GLUT4 [35]. Collectively,the data suggest that hepatic glucose production and muscle glucoseutilization were, respectively, suppressed and enhanced in theoffspring and are consistent with the known effects of catechins oninsulin-sensitive tissues [36–38].
Genes related to lipidmetabolism and energy homeostasis are alsoinfluenced by maternal GTE supplementation. As mentioned earlier,offspring born to HF-diet-fed dams had elevated levels of serum andtissue TG compared to those born to dams fed the LF diet. Suchabnormalities were reversed by maternal GTE supplementation, andsuch phenotypic improvements were accompanied by decreasedmRNA level and protein abundance of SREBP-1c in liver of offspring(Figs. 2A and 3A). Our data are therefore in line with the observationthat GTE decreased the mRNA expression of SREBP-1c and improvedthe lipid profile of fructose-fed ovariectomized rats [30]. Adiponectinis implicated in fat metabolism and energy homeostasis. WATadiponectin mRNA expression was suppressed in HF/HF rats, butsuch abnormality was reversed by maternal GTE supplementation(Fig. 2C). Increased mRNA expression of adiponectin in adiposetissues was also reported in GTE-supplemented obese dogs [39].Adiponectin could increase UCP expression [40]. This is consistentwith the present results showing an increase in UCP1 expression inBAT of offspring born to GTE-supplemented dams (Fig. 2C).
It is of interest to note that mixed results were obtained when GTEwas added to the postweaning diet instead. Although the HF/GT1 andHF/GT2 rats had improved serum lipid profile compared with theHF/HF rats (Table 3), there was no difference in serum insulin and IRIamong HF/GT1, HF/GT2 and HF/HF rats (Table 3). These resultscontrasted those derived from maternal GTE supplementation.Improved serum lipid profile by postnatal GTE supplementationmay be explained by decreased expression of hepatic SREBP-1c. Onthe other hand, postnatal GTE supplementation failed to increaseGLUT4 mRNA expression in muscle as well as in adipose tissue orreduce hepatic G6pase expression. In addition, UCP1 expression inBAT was unchanged by postnatal GTE supplementation comparedwith a significant increase by maternal GTE supplementation (Fig.2C). These results are in disparity with thewell-known effects of GT inthe literature and are likely explained by the HF diet fed to pups sinceweaning in the present study. It is also possible that, in theseoffspring, improvement in insulin sensitivity might be a latentresponse that appears later in time. Nevertheless, the currentexperimental data evidently differentiated the impacts of pre- andpostnatal GTE exposure and highlighted the significant role ofmaternal diet.
It is acknowledged that interpretation of the present data is limitedby the nature of the experimental design. First, without a damgroup fedGTE-supplemented LF diet, the effects of GTE per se cannot be

1660 S. Li et al. / Journal of Nutritional Biochemistry 23 (2012) 1655–1660
determined and will remain associated with the suppressed weightgain during gestation.However, if LF-diet-fed damswere supplementedwith GTE at the current levels, they will most certainly reduce energyintake and fat mass, further complicating overall data interpretation.For the purpose of the study, we were able to simulate a metabolic andgene expression profile associate with LF diet in the GTE-supplementedHF-diet-fed dams. Perhaps, in future experiments, lower levels of GTE(0.3% and 0.5%) could be tested. Such doses may help to establish theminimum effective dose and to determine if the GTE effects are entirelyattributable to prevention of maternal weight gain. In this study, EGCGexposure in dams receiving the lower dose (0.75%) approximated theno-observed adverse effect level of 500mg/kg/d [41]. Because catechinsare known to cross placenta [42], we could not rule out the possibilitythat the effects were, at least in part, a direct influence on thedeveloping fetus. Second, the lighter pups (PPD21) born to GT damscompared with those born to LF or HF dams might be the consequenceof GTE exposure via milk [43]. To further examine the perinatal effectsof GTE supplementation, a subsequent studywas performed that aimedto differentiate the effects of GTE supplementation during gestation andlactation (manuscript in preparation).
In conclusion, metabolic derangements induced by overnourisheddams could be offset by supplementing GTE to the maternal diet. Thecurrent findings provide preliminary evidence to spur furtherresearch to fine-tune the exposure level and mechanism of actionon developmental programming for many BFCs known to conferhealth benefits.
Supplementarymaterials related to this article can be found onlineat http://dx.doi.org/10.1016/j.jnutbio.2011.11.008.
References
[1] Crozier SR, Inskip HM, Godfrey KM, Cooper C, Harvey NC, Cole ZA, et al. Weightgain in pregnancy and childhood body composition: findings from theSouthampton Women's Survey. Am J Clin Nutr 2010;91:1745–51.
[2] Oken E. Maternal and child obesity: the causal link. Obstet Gynecol Clin North Am2009;36:361–77 ix-x.
[3] Tequeanes AL, Gigante DP, Assuncao MC, Chica DA, Horta BL. Maternalanthropometry is associated with the body mass index and waist:height ratio ofoffspring at 23 years of age. J Nutr 2009;139:750–4.
[4] Flegal KM, Carroll MD, Ogden CL, Curtin LR. Prevalence and trends in obesityamong US adults, 1999-2008. JAMA 2010;303:235–41.
[5] Armitage JA, Taylor PD, Poston L. Experimental models of developmentalprogramming: consequences of exposure to an energy rich diet duringdevelopment. J Physiol 2005;565:3–8.
[6] Gardner DS, Tingey K, Van Bon BW, Ozanne SE, Wilson V, Dandrea J, et al.Programming of glucose–insulin metabolism in adult sheep after maternalundernutrition. Am J Physiol Regul Integr Comp Physiol 2005;289:R947–54.
[7] Nivoit P, Morens C, Van Assche FA, Jansen E, Poston L, Remacle C, et al. Establisheddiet-induced obesity in female rats leads to offspring hyperphagia, adiposity andinsulin resistance. Diabetologia 2009;52:1133–42.
[8] Taylor PD, Poston L. Developmental programming of obesity in mammals. ExpPhysiol 2007;92:287–98.
[9] Hales CN, Barker DJ. The thrifty phenotype hypothesis. Br Med Bull 2001;60:5–20.
[10] Tapsell LC, Hemphill I, Cobiac L, Patch CS, Sullivan DR, Fenech M, et al. Healthbenefits of herbs and spices: the past, the present, the future. Med J Aust2006;185:S4–24.
[11] Yin J, Zhang H, Ye J. Traditional chinese medicine in treatment of metabolicsyndrome. Endocr Metab Immune Disord Drug Targets 2008;8:99–111.
[12] Sen S, Simmons RA. Maternal antioxidant supplementation prevents adiposity inthe offspring of Western diet-fed rats. Diabetes 2010;59:3058–65.
[13] Reza-López SA, Anderson GH, Szeto IM, Taha AY, Ma DW. High vitamin intake byWistar rats during pregnancy alters tissue fatty acid concentration in the offspringfed an obesogenic diet. Metabolism 2009;58:722–30.
[14] Rains TM, Agarwal S, Maki KC. Antiobesity effects of green tea catechins: amechanistic review. J Nutr Biochem 2011;22:1–7.
[15] Thielecke F, Boschmann M. The potential role of green tea catechins in theprevention of the metabolic syndrome — a review. Phytochemistry 2009;70:11–24.
[16] Klaus S, Pultz S, Thone-Reineke C, Wolfram S. Epigallocatechin gallate attenuatesdiet-induced obesity in mice by decreasing energy absorption and increasing fatoxidation. Int J Obes (Lond) 2005;29:615–23.
[17] Kao YH, Hiipakka RA, Liao S. Modulation of obesity by a green tea catechin. Am JClin Nutr 2000;72:1232–4.
[18] Erba D, Riso P, Bordoni A, Foti P, Biagi PL, Testolin G. Effectiveness of moderategreen tea consumption on antioxidative status and plasma lipid profile inhumans. J Nutr Biochem 2005;16:144–9.
[19] Hase T, Komine Y, Meguro S, Takeda Y, Takahashi H, Matsui Y, et al. Anti-obesityeffects of tea catechins in humans. J Oleo Sci 2001;50:599–605.
[20] Sugden MC, Holness MJ. Gender-specific programming of insulin secretion andaction. J Endocrinol 2002;175:757–67.
[21] Reeves PG, Nielsen FH, Fahey Jr GC. AIN-93 purified diets for laboratory rodents:final report of the American Institute of Nutrition ad hoc writing committee on thereformulation of the AIN-76A rodent diet. J Nutr 1993;123:1939–51.
[22] Chen Q, Chan LL, Li ET. Bitter melon (Momordica charantia) reduces adiposity,lowers serum insulin and normalizes glucose tolerance in rats fed a high fat diet. JNutr 2003;133:1088–93.
[23] Franch J, Knudsen J, Ellis BA, Pedersen PK, Cooney GJ, Jensen J. Acyl-CoA bindingprotein expression is fiber type- specific and elevated in muscles from the obeseinsulin-resistant Zucker rat. Diabetes 2002;51:449–54.
[24] Ahren B, Scheurink AJ. Marked hyperleptinemia after high-fat diet associatedwithsevere glucose intolerance in mice. Eur J Endocrinol 1998;139:461–7.
[25] Srinivasan M, Katewa SD, Palaniyappan A, Pandya JD, Patel MS. Maternal high-fatdiet consumption results in fetal malprogramming predisposing to the onset ofmetabolic syndrome-like phenotype in adulthood. Am J Physiol Endocrinol Metab2006;291:E792–9.
[26] Ching RH, Yeung LO, Tse IM, Sit WH, Li ET. Supplementation of bitter melon to ratsfed a high-fructose diet during gestation and lactation ameliorates fructose-induced dyslipidemia and hepatic oxidative stress in male offspring. J Nutr 2011;141:1664–72.
[27] Elahi MM, Cagampang FR, Mukhtar D, Anthony FW, Ohri SK, Hanson MA. Long-term maternal high-fat feeding from weaning through pregnancy and lactationpredisposes offspring to hypertension, raised plasma lipids and fatty liver in mice.Br J Nutr 2009;102:514–9.
[28] Khan I, Dekou V, Hanson M, Poston L, Taylor P. Predictive adaptive responses tomaternal high-fat diet prevent endothelial dysfunction but not hypertension inadult rat offspring. Circulation 2004;110:1097–102.
[29] Simar D, Chen H, Lambert K, Mercier J, Morris MJ. Interaction between maternalobesity and post-natal over-nutrition on skeletal muscle metabolism. Nutr MetabCardiovasc Dis 2011.
[30] Shrestha S, Ehlers SJ, Lee JY, Fernandez ML, Koo SI. Dietary green tea extractlowers plasma and hepatic triglycerides and decreases the expression of sterolregulatory element-binding protein-1c mRNA and its responsive genes infructose-fed, ovariectomized rats. J Nutr 2009;139:640–5.
[31] Wolfram S, Raederstorff D, Wang Y, Teixeira SR, Elste V, Weber P. TEAVIGO(epigallocatechin gallate) supplementation prevents obesity in rodents byreducing adipose tissue mass. Ann Nutr Metab 2005;49:54–63.
[32] Langley-Evans SC. Nutritional programming of disease: unravelling the mecha-nism. J Anat 2009;215:36–51.
[33] Lillycrop KA, Rodford J, Garratt ES, Slater-Jefferies JL, Godfrey KM, Gluckman PD,et al. Maternal protein restriction with or without folic acid supplementationduring pregnancy alters the hepatic transcriptome in adult male rats. Br J Nutr2010;103:1711–9.
[34] Bonen A. PGC-1alpha-induced improvements in skeletal muscle metabolism andinsulin sensitivity. Appl Physiol Nutr Metab 2009;34:307–14.
[35] Benton CR, Nickerson JG, Lally J, Han XX, Holloway GP, Glatz JF, et al. Modest PGC-1alpha overexpression in muscle in vivo is sufficient to increase insulin sensitivityand palmitate oxidation in subsarcolemmal, not intermyofibrillar, mitochondria. JBiol Chem 2008;283:4228–40.
[36] Anton S, Melville L, Rena G. Epigallocatechin gallate (EGCG) mimics insulin actionon the transcription factor FOXO1a and elicits cellular responses in the presenceand absence of insulin. Cell Signal 2007;19:378–83.
[37] Nishiumi S, Bessyo H, Kubo M, Aoki Y, Tanaka A, Yoshida K, et al. Green and blacktea suppress hyperglycemia and insulin resistance by retaining the expression ofglucose transporter 4 in muscle of high-fat diet-fed C57BL/6J mice. J Agric FoodChem 2010;58:12916–23.
[38] Waltner-Law ME, Wang XL, Law BK, Hall RK, Nawano M, Granner DK.Epigallocatechin gallate, a constituent of green tea, represses hepatic glucoseproduction. J Biol Chem 2002;277:34933–40.
[39] Serisier S, Leray V, Poudroux W, Magot T, Ouguerram K, Nguyen P. Effectsof green tea on insulin sensitivity, lipid profile and expression of PPARalphaand PPARgamma and their target genes in obese dogs. Br J Nutr 2008;99:1208–16.
[40] Masaki T, Chiba S, Yasuda T, Tsubone T, Kakuma T, Shimomura I, et al. Peripheral,but not central, administration of adiponectin reduces visceral adiposity andupregulates the expression of uncoupling protein in agouti yellow (Ay/a) obesemice. Diabetes 2003;52:2266–73.
[41] Isbrucker RA, Edwards JA, Wolz E, Davidovich A, Bausch J. Safety studies onepigallocatechin gallate (EGCG) preparations. Part 2: dermal, acute and short-term toxicity studies. Food Chem Toxicol 2006;44:636–50.
[42] Chu KO, Wang CC, Chu CY, Chan KP, Rogers MS, Choy KW, et al. Pharmacokineticstudies of green tea catechins in maternal plasma and fetuses in rats. J Pharm Sci2006;95:1372–81.
[43] Isbrucker RA, Edwards JA, Wolz E, Davidovich A, Bausch J. Safety studieson epigallocatechin gallate (EGCG) preparations. Part 3: teratogenicityand reproductive toxicity studies in rats. Food Chem Toxicol 2006;44:651–61.