maternal dietary quality, inflammatory potential and
TRANSCRIPT
RESEARCH ARTICLE Open Access
Maternal dietary quality, inflammatorypotential and childhood adiposity: anindividual participant data pooled analysisof seven European cohorts in theALPHABET consortiumLing-Wei Chen1* , Adrien M. Aubert2, Nitin Shivappa3,4, Jonathan Y. Bernard2,5, Sara M. Mensink-Bout6,7,Aisling A. Geraghty8, John Mehegan1, Matthew Suderman9, Kinga Polanska10, Wojciech Hanke10,Agnieszka Jankowska10, Caroline L. Relton9, Sarah R. Crozier11, Nicholas C. Harvey11,12, Cyrus Cooper11,12,Mark Hanson12,13, Keith M. Godfrey11,12, Romy Gaillard6,14, Liesbeth Duijts6,7,15, Barbara Heude2, James R. Hébert3,4,Fionnuala M. McAuliffe8, Cecily C. Kelleher1 and Catherine M. Phillips1*
Abstract
Background: Mounting evidence suggests that maternal diet influences pregnancy and birth outcomes, but itscontribution to the global epidemic of childhood obesity has not as yet been definitively characterized. Weinvestigated whether maternal whole diet quality and inflammatory potential influence childhood adiposity.
Methods: We harmonized and pooled individual participant data from 16,295 mother-child pairs in seven Europeanbirth cohorts. Maternal pre-, early-, late-, and whole-pregnancy (any time during pregnancy) dietary quality andinflammatory potential assessed with the Dietary Approaches to Stop Hypertension (DASH) score and the energy-adjusted Dietary Inflammatory Index (E-DII™) score, respectively. Primary outcome was childhood overweight andobesity (OWOB) (age-and-sex-specific BMI z-score > 85th percentile). Secondary outcomes were sum of skinfoldthickness (SST), fat mass index (FMI) and fat-free mass index (FFMI). We used multivariable regression analyses(adjusting for maternal lifestyle and sociodemographic factors) to assess the associations of maternal DASH and E-DIIscores with offspring adiposity outcomes in cohort-specific analyses, with subsequent random-effect meta-analyses.
(Continued on next page)
© The Author(s). 2021 Open Access This article is licensed under a Creative Commons Attribution 4.0 International License,which permits use, sharing, adaptation, distribution and reproduction in any medium or format, as long as you giveappropriate credit to the original author(s) and the source, provide a link to the Creative Commons licence, and indicate ifchanges were made. The images or other third party material in this article are included in the article's Creative Commonslicence, unless indicated otherwise in a credit line to the material. If material is not included in the article's Creative Commonslicence and your intended use is not permitted by statutory regulation or exceeds the permitted use, you will need to obtainpermission directly from the copyright holder. To view a copy of this licence, visit http://creativecommons.org/licenses/by/4.0/.The Creative Commons Public Domain Dedication waiver (http://creativecommons.org/publicdomain/zero/1.0/) applies to thedata made available in this article, unless otherwise stated in a credit line to the data.
* Correspondence: [email protected]; [email protected] Centre for Health and Diet Research, School of Public Health,Physiotherapy, and Sports Science, University College Dublin, Dublin,Republic of IrelandFull list of author information is available at the end of the article
Chen et al. BMC Medicine (2021) 19:33 https://doi.org/10.1186/s12916-021-01908-7
(Continued from previous page)
Results: The study mothers had a mean (SD) age of 30.2 (4.6) years and a mean BMI of 23.4 (4.2) kg/m2. Higher early-pregnancy E-DII scores (more pro-inflammatory diet) tended to be associated with a higher odds of late-childhood[10.6 (1.2) years] OWOB [OR (95% CI) 1.09 (1.00, 1.19) per 1-SD E-DII score increase], whereas an inverse association wasobserved for late-pregnancy E-DII score and early-childhood [2.8 (0.3) years] OWOB [0.91 (0.83, 1.00)]. Higher maternalwhole pregnancy DASH score (higher dietary quality) was associated with a lower odds of late-childhood OWOB [OR(95% CI) 0.92 (0.87, 0.98) per 1-SD DASH score increase]; associations were of similar magnitude for early and late-pregnancy [0.86 (0.72, 1.04) and 0.91 (0.85, 0.98), respectively]. These associations were robust in several sensitivity analysesand further adjustment for birth weight and childhood diet did not meaningfully alter the associations and conclusions.In two cohorts with available data, a higher whole pregnancy E-DII and lower DASH scores were associated with a lowerlate-childhood FFMI in males and a higher mid-childhood FMI in females (P interactions < 0.10).
Conclusions: A pro-inflammatory, low-quality maternal antenatal diet may adversely influence offspring bodycomposition and OWOB risk, especially during late-childhood. Promoting an overall healthy and anti-inflammatorymaternal dietary pattern may contribute to the prevention of childhood obesity, a complex health issue requiringmultifaceted strategy.
Keywords: Childhood obesity, Maternal, Pregnancy, Diet, Quality, Inflammation, Dietary inflammatory index, Dietaryapproaches to stop hypertension, Developmental origin of health and diseases
BackgroundChildhood obesity has reached epidemic proportionsworldwide [1]. Obesity in childhood has a pronouncedimpact on subsequent health risks as it often tracks intoadulthood and is associated with a higher risk of chronicdiseases including type 2 diabetes [2]. Although immedi-ate lifestyle intervention in the paediatric population isessential, mounting evidence has pointed to the first1000 days of life (from conception to 2 years old) as acritical period for preventing childhood obesity [3, 4]. Inthe 2016 Commission on Ending Childhood Obesity re-port commissioned by the World Health Organization(WHO), appropriate prenatal care such as optimizingmaternal nutrition was highlighted as a key strategy toprevent childhood obesity [5].The Developmental Origins of Health and Diseases
(DOHaD) concept posits that early life represents a win-dow of opportunity to optimize health trajectory of theimmediate offspring and subsequent generations. Indeed,exposure to severe (in response to famine) or mild (e.g.suboptimal macronutrient composition) in utero malnu-trition has been associated with a higher risk of obesity/higher adiposity [6–10] and metabolic disorders such astype 2 diabetes [11] later in life. Furthermore, maternalover-nutrition has also been shown to have a long-terminfluence on the offspring, including a higher risk ofchildhood obesity and other metabolic disorders (re-cently reviewed in [12]).Due to the complexity of human diet [13] and because
individuals do not consume nutrients and foods in isola-tion, the effectiveness of public health messaging to in-fluence eating behaviours could be improved byassessing diet in a more holistic way. One such approachis through the use of diet quality indices based on
previous scientific evidence that summarizes several as-pects of dietary intake either against dietary guidelinesor in terms of biological mechanism [14]. Because ma-ternal inflammatory markers are associated with higheroffspring adiposity [15, 16], reducing maternal inflam-mation through dietary optimization [17, 18] may be apotential strategy to reduce childhood obesity risk. Adietary inflammatory index (DII) has been designed spe-cifically to measure diet-related inflammatory potential.DII likely captures a slightly different and narrower di-mension of diet than a general dietary quality index, assuggested by only a moderate correlation between theseindices [19]. Although maternal inflammation can be amechanism through which maternal diet affects childhealth, other pathways such as epigenetic programmingcan also be responsible. Thus, by investigating maternaldietary inflammatory potential, we can infer the poten-tial involvement of inflammation in our studied out-comes and make more specific dietary recommendationsbased on the DII if it does.Most studies to date examining dietary quality or
inflammatory potential and childhood adiposity havebeen conducted in a single country [20–23], poten-tially limiting generalizability because dietary habitscould differ substantially across countries. These stud-ies, in general, observed beneficial influence of highermaternal dietary quality and lower dietary inflamma-tory potential on offspring adiposity measures; how-ever, one study reported null associations afteradjusting for covariates [22]. We thus aimed to fur-ther elucidate the associations between maternal diet-ary quality, inflammatory potential and offspringadiposity outcomes through an individual participantdata meta-analysis involving five countries.
Chen et al. BMC Medicine (2021) 19:33 Page 2 of 14

A UK study that followed women from pre-conceptionthrough pregnancy showed that maternal dietary intakesand patterns changed little from before pregnancy toearly and late pregnancy [24]. However, maternal diet atdifferent stages of pregnancy could potentially differen-tially influence child outcomes, as such stages representdifferent phases of foetal growth and development. Forexample, foetal fat accretion starts only in late gestation[25]. We thus hypothesized that a pro-inflammatory andlow-quality maternal diet is associated with a higher riskof childhood obesity, potentially with differential influ-ences of maternal diet at different stages of preconcep-tion/pregnancy. Pre-conception diet has been increasinglyassociated with child outcomes, suggesting that there maybe opportunities for interventions that change dietary pat-terns before conception to influence long-term childhealth [26]. Thus, in cohorts with available data, we alsoinvestigated potential influence of pre-pregnancy maternaldietary quality and inflammatory potential on childhoodobesity.
MethodsStudy populationThis study involves seven mother-offspring cohort stud-ies from five European countries within the ALPHABETconsortium. These cohorts and longitudinal follow-upfrom a randomized controlled trial include the LifewaysCross-Generation Cohort Study (Lifeways) (ISRCTN16537904) and the Randomised cOntrol trial of LOwglycaemic index diet during pregnancy study (ROLO) inIreland (ISRCTN54392969); the study on the pre- andearly postnatal determinants of child health and develop-ment (EDEN) in France; the Avon Longitudinal Study ofParents and Children (ALSPAC) and the SouthamptonWomen’s Survey (SWS) in the UK; the Polish Motherand Child Cohort (REPRO_PL) (NCT01861548) inPoland; and The Generation R Study (Generation R)(NTR6671) in the Netherlands [27–35]. All studies havebeen approved by the respective local ethical reviewcommittees (see the ‘Acknowledgements’ section for de-tails) and written consent was obtained from allmothers. The characteristics of each study and numbersof participants included in the current analysis are sum-marized in Additional file 1: Table S1 [27–35]. For moredetails of the respective cohorts, please refer to Add-itional file 1: Table S2 for a summary [36].
ExposureMaternal dietary assessmentPre-pregnancy or antenatal dietary intakes of the studymothers were assessed using validated (except for ALSPAC which used a FFQ that had not been formallyvalidated but covered the main foods consumed inBritain) food frequency questionnaires (FFQ) (mean food
items in ALPHABET: 137), which have been described indetail elsewhere [37–45]. In ALPHABET, pre-pregnancymaternal diet was available in two studies (SWS andEDEN), while pregnancy maternal diet was assessed in allstudies. Pregnancy diet was further classified based on aperiod of assessment: early pregnancy (1st/early 2ndtrimester, n = 5 cohorts) and late pregnancy (3rd trimester,n = 3 cohorts). Since maternal diet was assessed duringboth early and late pregnancy in SWS, both were includedand the average was taken to reflect whole pregnancyexposure. Whole pregnancy refers to dietary informationassessed at any time point of pregnancy.
Derivation of maternal dietary inflammatory potential scoreMaternal dietary inflammatory potential was rankedusing the energy-adjusted Dietary Inflammatory Index(E-DII™), a well-validated literature-derived score de-scribed in detail elsewhere [46]. Briefly, dietary informa-tion for each mother was converted to amount per1000-kcal intake and then linked to a regionally repre-sentative database. The regionally representative worldcomposite database was constructed using national nu-trition survey information across diverse populations liv-ing in a variety of countries in different regions of theworld (USA, Australia, Bahrain, Denmark, India, Japan,New Zealand, Taiwan, South Korea, UK). The compositedatabase provides a basis for benchmarking individualdietary intake to a representative range of dietary intakebased on actual human consumption (more details avail-able at [46]). The database provides an overall estimateof mean and standard deviation of energy-standardizedintakes (using density method) for each of the dietaryparameters (i.e. nutrients, foods, and other food compo-nents). Subsequently, z-scores for each dietary parameterwere derived by subtracting the mean of the energy-adjusted regionally representative world composite data-base from the participants-reported amount and dividingthis value by the parameter’s representative standard de-viation. The z-scores were then converted to proportions(i.e. with values ranging from 0 to 1) and then centredby doubling and subtracting 1. The resulting value wasthen multiplied by the corresponding food parameter-specific inflammatory effect score (derived from a com-prehensive literature review of 1943 peer-reviewed arti-cles) and summed to yield the overall E-DII score. Ahigher E-DII score indicates a more pro-inflammatorydiet. The systematic review was conducted through acomprehensive search of the National Library of Medi-cine database from 1950 through 2010, and the literaturesearch strategy along with inclusion criteria were de-scribed in detail in the DII development paper [46]. Thematernal E-DII score in ALPHABET was generated from24 to 28 dietary parameters (out of 44 possible; as en-ergy intake has been intrinsically adjusted for in E-DII, it
Chen et al. BMC Medicine (2021) 19:33 Page 3 of 14

is not considered as a separate parameter) in all cohortsexcept for Generation R, which has 20 dietary parame-ters (see Additional file 1: Table S3). In available cohorts(except EDEN), child E-DII scores were also generated.When calculated from all the 45 possible food parame-ters (including energy intake), DII scores ranged from −8.87 (most anti-inflammatory) to + 7.98 (most pro-inflammatory); however, when derived from 25 to 30food parameters, the range seen for many population isfrom − 5.5 to + 5.5 [19]. In our constituent studies, therange of E-DII is within − 5.5 to + 5.5, supporting thatthey have been calculated correctly. The range for Gen-eration R using only 20 parameters appears comparableto other cohorts (see Additional file 1: Fig. S1). We thusbelieve that the E-DII score captures dietary inflamma-tory potential sufficiently in our study.
Derivation of maternal dietary quality scoreDietary quality was assessed by degree of adherence tothe Dietary Approaches to Stop Hypertension (DASH)diet. The moderation and harmonization process forDASH score generation within the ALPHABET consor-tium has been described elsewhere [36]. The derivationof the DASH score in ALPHABET was based mainly onthe index proposed by Fung et al. [47], which ranks anindividual’s diet based on population quintile ranking.We deemed Fung et al.’s approach more suitable for ourFFQ derived data, which aims to rank participants ac-cording to their intakes rather than absolute estimationof food intakes, as compared with other ranking ap-proaches based on whether one meets recommendedservings of foods [48]. The final ALPHABET DASHscore comprised 8 components (see Additional file 1:Table S4). For food components with higher intake rec-ommended (fruits, vegetables excluding potatoes, totalgrains, non-full-fat dairy products, and nuts/seeds/le-gumes), participants in the highest quintile received ascore of 5 while those in the lowest quintile received ascore of 1. Reverse scoring was applied to food compo-nents with moderation recommended (red and proc-essed meats, sugar-sweetened beverages/sweets/addedsugars, and sodium). The DASH score has a theoreticalrange of 8 to 40, with a higher score reflecting a higherdietary quality.
OutcomesThe primary outcome was childhood overweight andobesity (OWOB), defined as age- and sex-specific bodymass index z score (BMI z) > 85th percentile [49]. BMIwas calculated from reported or measured weight andheight using the formula weight (in kg)/height (in m2),which was subsequently converted to z-scores using theWHO Child Growth Standards for 0–5 years [50] and5–19 years [51]. Secondary outcomes were sum of
skinfold thickness (SST; subscapular skinfold + tricepsskinfold, mm), fat mass index (FMI, kg/m2) and fat-freemass index (FFMI, kg/m2) in available cohorts (see Add-itional file 1: Table S5 for outcome data availability).Body composition measures used in this study werebased on bioelectrical impedance analysis, except forSWS, which used dual-energy X-ray absorptiometry.Outcomes were assessed in early (pre-school) [mean(SD) age: 2.8 (0.3) years], mid [6.1 (0.6) years] and late-childhood [10.6 (1.2) years] [52, 53].
CovariatesPotential confounders and relevant covariates were iden-tified from literature and harmonized for subsequentanalysis. These were maternal age at delivery (in years),maternal height (in cm), pre-pregnancy BMI (in kg/m2),maternal educational status (study-specific definition oflow/medium/high), self-reported maternal birthplace/ethnicity (European-born/White or non-European-born/non-White), maternal cigarette smoking [never/ever(stopped during the pregnancy)/current (continued dur-ing the pregnancy)], maternal alcohol intake duringpregnancy (yes/no), maternal parity (primiparous/mul-tiparous) and child exact age at anthropometry measure-ment (in months) and sex (male/female). These datawere originally abstracted from birth records or collectedusing questionnaires (interviewer- or self-administered).
Statistical analysisParticipants’ characteristics were summarized for theALPHABET consortium and according to its constituentstudies. These were limited to participants with availabil-ity of the exposure (maternal diet) and main outcome(childhood BMI measurement at any time point) vari-ables. We further excluded participants (n = 396) withlikely implausible energy intakes (< 500 or > 3500 kcal/day) to avoid extreme misreporting [54, 55].A two-stage individual participant data meta-analysis
was used to assess the associations between maternaldiet quality and inflammatory potential and childhoodadiposity outcomes. First, cohort-specific effect estimateswere generated by using linear and logistic regression forcontinuous and binary outcomes, respectively. The effectestimates were subsequently pooled using random-effectsmeta-analysis, which considers both within- and between-study variability. Cochran’s Q test and I2 statistic wereused to assess statistical heterogeneity among includedstudies [56, 57].The aforementioned a priori selected covariates were
adjusted. Missing covariate information was imputedusing cohort-specific means (continuous variables) ormodal categories (categorical variables). Complete caseanalysis yielded largely similar results and did not affectstudy conclusions (results not shown).
Chen et al. BMC Medicine (2021) 19:33 Page 4 of 14

We also conducted several sensitivity analyses. First,we limited our analysis to European-born/White partici-pants (which make up 89% of the study population) toreduce heterogeneity in participants' characteristics. Sec-ond, we excluded participants with gestational diabetes,gestational hypertension and pre-eclampsia to see if as-sociations persist in a subset of relatively low-risk preg-nancies. Third, a stricter definition of obesity was used(> 95th percentile of age- and sex-specific z-score) to in-vestigate whether maternal dietary quality and inflam-matory potential can impact more severe childhoodobesity. To explore potential mechanism related to in-flammation, we mutually adjusted for DASH and E-DIIscores in the same model. For statistically significant as-sociations, we further tested potential mediation throughdietary inflammation or dietary quality using mixed ef-fects (with random intercept for each cohort) causal me-diation model through the ‘Mediation’ package in Rversion 3.6.3 (R Foundation for Statistical Computing,Vienna, Austria). Because we previously showed that alow quality and pro-inflammatory maternal diet was asso-ciated with lower birth size [58], we further investigatedwhether birthweight is a potential mediator in the currentstudy. As with birth weight, gestational age is also knownto influence both growth and body composition in child-hood, so we conducted analysis further adjusting for ges-tational age. Child E-DII scores were available in allcohorts except EDEN and were also examined as a poten-tial mediator for maternal diet vs late-childhood adiposityrelationships (because child E-DII scores were mostly ex-amined during mid to late-childhood). Child E-DII scorewas used over child DASH score (not generated) due tologistical constraints, because childhood diet was not themain focus of the ALPHABET consortium. Most cohortsalso used a shortened FFQ for child dietary intake assess-ment, causing an insufficient number of food items in sev-eral food groups for DASH score generation (DII is lessaffected because it has predominantly nutrient parame-ters). In addition, although the child DII score has beendeveloped and validated [59], we are not aware of similarvalidation being conducted for a child version of theDASH score.We investigated whether child sex was a potential
modifier of the associations of maternal dietary qualityand inflammatory potential with offspring adiposity out-comes by including the multiplicative interaction termsinto the model one at a time. This was done usingparticipant-level data for each cohort, and the estimateswere subsequently pooled. When P-interaction was <0.10, downstream stratification analyses were conducted.All analyses, unless otherwise specified, were per-
formed using the statistical software Stata version 13.1(StataCorp, College Station, TX, USA), and statisticalsignificance was defined as two-sided P values < 0.05.
Because many statistical tests were conducted, thethreshold of P < 0.05 is appropriate for analyses concern-ing our primary outcome i.e. childhood OWOB. Otheranalyses involving secondary outcomes, albeit reachingstatistical significance, should be considered as hypoth-esis generating and such findings need to be replicatedin further studies.
ResultsThe current analysis included up to 16,295 mother-childpairs from seven European studies. Overall, the studymothers had a mean (SD) age of 30.2 (4.6) years at deliv-ery and a mean BMI of 23.4 (4.2) kg/m2 (Additional file 1:Table S1). Mean (SD) [range] of dietary scores were:pre-pregnancy E-DII = 0.0 (1.7) [− 4.7 to 4.3]; pregnancyE-DII = 0.1 (1.6) [− 5.4 to 5.5]; pre-pregnancy DASH =24.3 (4.3) [10 to 37]; and pregnancy DASH = 24.3 (4.2)[10 to 38]. Pearson’s correlation coefficients between E-DII and DASH were − 0.59 for pre-pregnancy and − 0.49during pregnancy (both P < 0.001) (also see Add-itional file 1: Fig. S2 for scatter plots). The percentagesof children classified as OWOB ranged from 8.1%(EDEN) to 21.6% (ALSPAC) during early-childhood,6.4% (EDEN) to 23.8% (Lifeways) during mid-childhoodand 7.0% (EDEN) to 19.1% (Lifeways) during late-childhood.
Associations of E-DII and DASH scores with primaryoutcome (OWOB)The main associations (involving greatest numbers ofmother-child pairs) between maternal whole pregnancyE-DII and DASH scores and late-childhood OWOB aresummarized in Fig. 1. A higher maternal DASH score(higher dietary quality) during whole pregnancy was as-sociated with a lower odds of late-childhood OWOB[OR (95% CI) 0.92 (0.87, 0.98) per 1-SD increase inDASH score], whereas no statistically significant associ-ation was observed for whole-pregnancy E-DII score[OR (95% CI) 1.07 (0.98, 1.16) per 1-SD increase in E-DII score; P > 0.05]. These associations were of similarmagnitude for early- and late-pregnancy (instead ofwhole-pregnancy) dietary scores with slight variations instatistical significance (Table 1).In general, no consistent associations were observed
between maternal E-DII and DASH scores with regardsto early- and mid-childhood OWOB. The only exceptionis that higher late-pregnancy E-DII score was associatedwith a lower odds of early-childhood OWOB [OR (95%CI) 0.91 (0.83, 1.00)].
Associations of E-DII and DASH scores with secondaryadiposity measuresSimilar to the primary outcome, associations betweenmaternal dietary scores and secondary adiposity
Chen et al. BMC Medicine (2021) 19:33 Page 5 of 14

measures were only observed during late-childhood(Table 2). A higher whole pregnancy E-DII score was as-sociated with a lower late-childhood FFMI [β (95% CI −0.06 (− 0.08, − 0.03) kg/m2 per 1-SD increase in E-DIIscore]. In contrast, a higher whole pregnancy DASHscore was associated with a lower late-childhood FMI [β(95% CI − 0.09 (− 0.15, − 0.03) kg/m2]. Across differentpregnancy periods, the point estimates were in the samedirection and of comparable magnitude, though thesample sizes and statistical significance varied (someanalyses include only 1 study). No other apparent associ-ations were observed for other periods or between ma-ternal E-DII, DASH scores and childhood SST.
Sensitivity analysesWhen non-European-born/non-White participants wereexcluded, the aforementioned associations were stronger(i.e. estimates moved away from null) (Additional file 1:Table S6 and Table S7). In contrast, there was a slightattenuation between maternal DASH and late-childhoodOWOB (but not late-childhood FMI) when mothers
with pregnancy complications were removed (Add-itional file 1: Table S8 and Table S9) or in models withmutual adjustment of the dietary scores (Additional file 1:Table S10 and Table S11); however, the overall patternsof associations remained the same. Further causal medi-ation analyses showed little evidence of mediationthrough the other dietary score for the significant associ-ations between whole pregnancy dietary quality and in-flammation and late childhood OWOB/adiposity. Theproportions mediated by dietary inflammation on higherdietary quality vs. lower FMI relationship was 5.5% (P =0.73) and that on higher dietary quality vs. lower OWOBodds was 13.1% (P = 0.48). For the significant associationbetween more pro-inflammatory diet and lower FFMI,the proportion mediated by dietary quality was 7.0%(P = 0.69). When a stricter childhood obesity outcomewas used (> 95th sex-and-age-specific BMI z-score),most of the abovementioned point estimates were stron-ger, except for late-pregnancy E-DII and early-childhoodobesity which was largely attenuated (Additional file 1:Table S12); the confidence intervals became overall
Fig. 1 Associations between maternal pregnancy E-DII and DASH scores and late-childhood [10.6 (1.2) years] OWOB. Black dots indicate study-specific point effect estimates with corresponding 95% CIs indicated by horizontal lines, and diamonds indicate the pooled estimates with theircorresponding 95% CIs. When studies were omitted one at a time for pregnancy E-DII and DASH meta-analysis, the overall pooled estimateswere largely the same: for E-DII, pooled estimates ranged from 1.05 (0.98, 1.12) when excluding EDEN to 1.12 (1.02, 1.22) when excluding ALSPAC;for DASH, the pooled estimates ranged from 0.93 (0.88, 0.99) when excluding SWS to 0.90 (0.84, 0.97) when excluding GEN R. Effect estimateswere adjusted for maternal education, ethnicity, pre-pregnancy BMI, maternal height, parity, energy intake (for DASH analysis only), cigarettesmoking and alcohol consumption during pregnancy and (intrinsically adjusted for the outcome) child sex and age at measurement. E-DII,energy-adjusted Dietary Inflammatory Index; DASH, Dietary Approach to Stop Hypertension; OWOB, overweight and obesity
Chen et al. BMC Medicine (2021) 19:33 Page 6 of 14

wider, probably due to the smaller number of cases.When birthweight was included in the model, the esti-mates changed little (Additional file 1: Table S13 andTable S14), suggesting little mediation by birth size.Similarly, results remained the same with adjustment forgestational age at birth (Additional file 1: Table S15 andTable S16). Associations also remained very similarwhen all children born small for gestational age were ex-cluded (results not shown). In cohorts with child E-DIIscores, further adjusting for child dietary inflammatorypotential also led to very similar estimates (Add-itional file 1: Table S17), and the association reportedfor higher maternal E-DII vs. lower late-childhood FFMIremained statistically significant. Similarly, resultsremained essentially unchanged with further adjustmentfor whether the child was ever breastfed (results notshown).
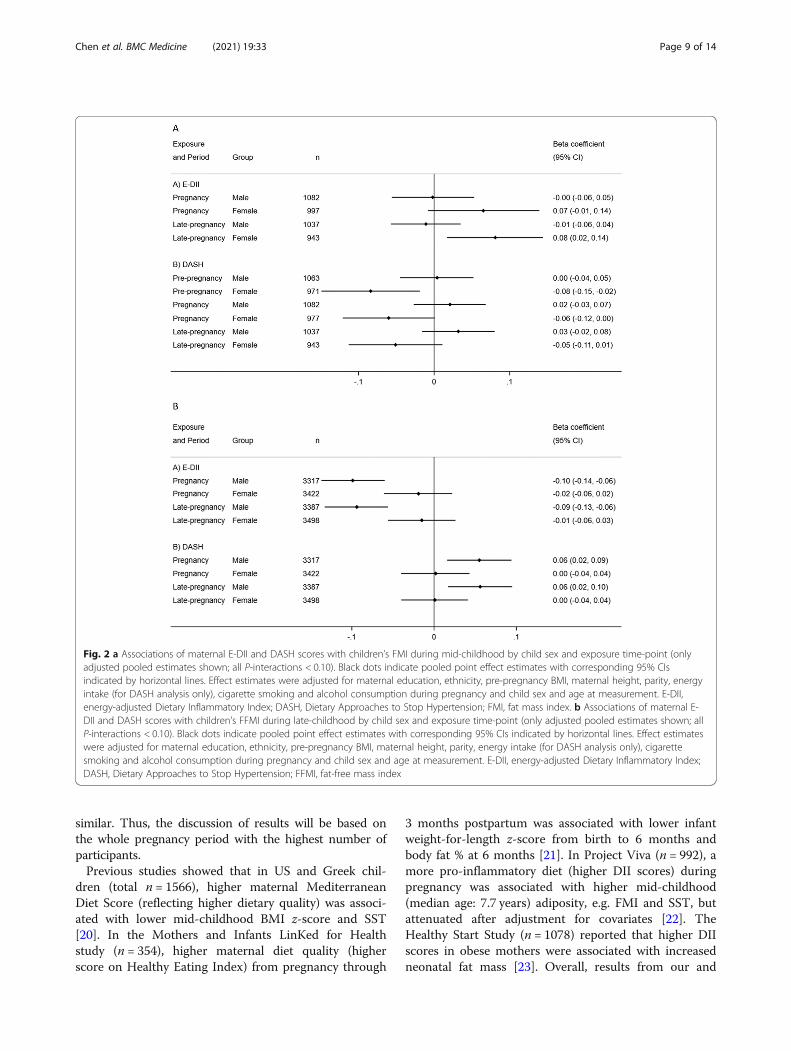
Sex-stratified analysisSome potential sex-interactions were noted, especiallyfor mid- and late-childhood FMI and FFMI outcomes(see Additional file 1: Table S18 and S19). In stratifiedanalyses, the associations between a higher maternal
pregnancy E-DII score and higher mid-childhood FMI,and a higher DASH score with lower mid-childhoodFMI, were stronger in females (Fig. 2a) (all P-for-sex in-teractions < 0.10). In contrast, higher maternal preg-nancy E-DII score was associated with lower [β (95% CI)− 0.10 (− 0.14, − 0.06) kg/m2], whereas higher DASHscore was associated with higher [β (95% CI) 0.06 (0.02,0.09) kg/m2], late-childhood FFMI in males (Fig. 2b) (allP-for-sex interactions < 0.10).
DiscussionWe observed that higher maternal dietary quality (higherDASH) during pregnancy was associated with a lowerodds of late-childhood OWOB and lower FMI. In con-trast, a more pro-inflammatory (higher E-DII) diet dur-ing pregnancy was associated with lower late-childhoodFFMI. Furthermore, sex interactions were observed suchthat the associations of higher maternal DASH, lower E-DII and higher late-childhood FFMI were stronger in maleoffspring, while associations of lower maternal DASH,higher E-DII and higher mid-childhood FMI were stron-ger in female offspring. Contrary to our hypothesis, dietaryscore associations at different pregnancy stages were quite
Table 1 Associations between maternal E-DII and DASH scores (per 1-SD increase) and childhood OWOB (BMI z-score > 85th percentile)
Early-childhood Mid-childhood Late-childhood
OR (95%CI) I2 (%) OR (95% CI) I2 (%) OR (95% CI) I2 (%)
E-DII
Pre 0.94 (0.84, 1.05) 0 1.01 (0.89, 1.15) 0 0.96 (0.81, 1.15) 0
Np/Nc 3122/2 2635/2 1658/2
Preg 0.94 (0.87, 1.02) 0 0.97 (0.91, 1.03) 0 1.07 (0.98, 1.16) 29
Np/Nc 6111/6 8717/7 11,803/5
Early 0.98 (0.89, 1.07) 0 0.97 (0.91, 1.04) 0 1.09 (0.999, 1.19) 0
Np/Nc 4103/4 6903/5 5063/3
Late 0.91 (0.83, 0.997)* 0 0.97 (0.85, 1.11) 21 1.07 (0.93, 1.23) 41
Np/Nc 4027/3 3419/3 7779/3
DASH
Pre 0.98 (0.80, 1.22) 62 0.93 (0.81, 1.06) 0 0.96 (0.80, 1.16) 0
Np/Nc 3122/2 2635/2 1658/2
Preg 0.98 (0.91, 1.06) 0 1.03 (0.96, 1.11) 3 0.92 (0.87, 0.98)** 0
Np/Nc 6111/6 8717/7 11,803/5
Early 0.99 (0.90, 1.09) 0 1.05 (0.97, 1.14) 7 0.86 (0.72, 1.04) 55
Np/Nc 4103/4 6903/5 5065/3
Late 1.01 (0.92, 1.11) 0 0.96 (0.85, 1.07) 0 0.91 (0.85, 0.98)* 0
Np/Nc 4027/3 3419/3 7779/3
Values are adjusted pooled effect estimates [OR (95% CI)] expressed for a 1-SD increment in dietary scores, heterogeneity measure (I2) and the number ofparticipants and studies included (Np/Nc) across different outcomes and conception periods, as labelled. Effect estimates were adjusted for maternal education,ethnicity, pre-pregnancy BMI, maternal height, parity, energy intake (for DASH analysis only), cigarette smoking and alcohol consumption during pregnancy and(intrinsically adjusted for the outcome) child sex and age at measurementOR (effect estimates) and the I2 (heterogeneity) test have separate P valuesE-DII energy-adjusted Dietary Inflammatory Index, DASH Dietary Approaches to Stop Hypertension, OWOB overweight and obesity, I2 I-squared, Pre pre-pregnancy,Preg pregnancy, Early early pregnancy, Late late pregnancy, Np number of participants included, Nc number of cohorts included*P < 0.05, **P < 0.01
Chen et al. BMC Medicine (2021) 19:33 Page 7 of 14

Table
2Associatio
nsbe
tweenmaternalE-DIIandDASH
scores
(per
1-SD
increase)andsecond
arychildho
odadiposity
measures
Early-ch
ildho
od(2.8±0.3ye
ars)
Mid-childho
od(6.1±0.6ye
ars)
Late-childho
od(10.6±1.2ye
ars)
SST,
mm
SST,
mm
FMI,kg
/m2
FFMI,kg
/m2
SST,
mm
FMI,kg
/m2
FFMI,kg
/m2
β(95%
CI)
I2(%
)β(95%
CI)
I2(%
)β(95%
CI)
I2(%
)β(95%
CI)
I2(%
)β(95%
CI)
I2(%
)β(95%
CI)
I2(%
)β(95%
CI)
I2(%
)
E-DII Pre
−0.11
(−0.23,0.01)
0−0.04
(−0.22,0.14)
0−0.01
(−0.04,0.03)
0−0.04
(−0.08,0.003)
0−0.17
(−0.76,0.41)
–0.03
(−0.10,0.16)
–−0.03
(−-0.10,0.05)
–
Np/Nc
2959/2
2536/2
2034/2
2038/2
1025/1
848/1
848/1
Preg
−0.01
(−0.14,0.13)
130.09
(−0.14,0.33)
290.03
(−0.03,0.09)
25−0.06
(−0.16,0.03)
67*
0.41
(−0.23,1.06)
–0.03
(−0.03,0.10)
0−0.06
(−0.08,−
0.03)***
0
Np/Nc
2749/3
3184/4
2059/4
2063/4
780/1
6739/2
6739/2
Early
0.07
(−0.10,0.24)
0−0.01
(−0.28,0.25)
00.01
(−0.10,0.13)
41−0.13
(−0.32,0.06)
77*
0.20
(−0.43,0.82)
–0.04
(−0.09,0.17)
–−0.04
(−0.12,0.04)
–
Np/Nc
1716/2
1513/2
1120/3
1119/3
836/1
702/1
702/1
Late
−0.04
(−0.17,0.08)
00.15
(−0.07,0.38)
170.03
(−0.01,0.07)
0−0.001(−
0.04,0.04)
00.31
(−0.28,0.90)
–0.04
(−0.03,0.11)
12−0.04
(−0.10,0.01)
52
Np/Nc
2880/2
3182/3
1980/2
1984/2
969/1
6885/2
6885/2
DASH Pre
−0.03
(−0.16,0.09)
2−0.18
(−0.36,0.01)
0−0.04
(−0.08,0.003)
00.03
(−0.01,0.08)
0−0.29
(−0.88,0.31)
–−0.10
(−0.23,0.03)
–0.05
(−0.03,0.12)
–
Np/Nc
2959/2
2536/2
2034/2
2038/2
1025/1
848/1
848/1
Preg
−0.06
(−0.18,0.07)
0−0.02
(−0.29,0.26)
41−0.02
(−0.05,0.02)
00.01
(−0.03,0.06)
0−0.54
(−1.21,0.12)
–−0.09
(−0.15,−
0.03)**
00.03
(−0.002,0.06)
0
Np/Nc
2749/3
3184/4
2059/4
2063/4
780/1
6739/2
6739/2
Early
−0.10
(−0.28,0.08)
00.10
(−0.41,0.61)
68−0.07
(−0.15,0.01)
00.03
(−0.03,0.09)
0−0.58
(−1.22,0.06)
–−0.12
(−0.25,0.01)
–0.06
(−0.02,0.14)
–
Np/Nc
1716/2
1513/2
1120/3
1119/3
836/1
702/1
702/1
Late
−0.01
(−0.14,0.11)
0−0.06
(−0.24,0.13)
0−0.01
(−0.05,0.03)
0−0.001(−
0.05,0.04)
0−0.28
(−0.88,0.32)
–−0.07
(−0.13,−
0.01)*
00.03
(−0.002,0.05)
0
Np/Nc
2880/2
3182/3
1980/2
1984/2
969/1
6885/2
6885/2
Values
aread
justed
pooled
effect
estim
ates
[β(95%
CI)]
expressedfora1-SD
increm
entin
dietaryscores,h
eterog
eneity
measure
(I2),an
dnu
mbe
rof
participan
tsan
dstud
iesinclud
ed(Np/Nc)
across
differen
tou
tcom
esan
dconcep
tionpe
riods,aslabe
lled.
Effect
estim
ates
weread
justed
formaterna
ledu
catio
n,ethn
icity
,pre-pregn
ancy
BMI,materna
lheigh
t,pa
rity,en
ergy
intake
(for
DASH
analysison
ly),ciga
rettesm
oking
andalcoho
lcon
sumptiondu
ringpreg
nancyan
dchild
sexan
dag
eat
measuremen
tβ(effectestim
ates)an
dtheI2(heterog
eneity)test
have
sepa
rate
Pvalues
E-DIIen
ergy
-adjustedDietary
InflammatoryInde
x,DASH
Dietary
App
roache
sto
Stop
Hyp
ertension,
SSTsum
ofskinfold
thickn
ess,FM
Ifat
massinde
x,FFMIfat-freemassinde
x,I2I-squ
ared
,Pre
pre-preg
nancy,Preg
preg
nancy,Early
early
preg
nancy,Late
late
preg
nancy,Npnu
mbe
rof
participan
tsinclud
ed,N
cnu
mbe
rof
coho
rtsinclud
ed*P
<0.05
,**P
<0.01
,***P<0.00
1
Chen et al. BMC Medicine (2021) 19:33 Page 8 of 14
similar. Thus, the discussion of results will be based onthe whole pregnancy period with the highest number ofparticipants.Previous studies showed that in US and Greek chil-
dren (total n = 1566), higher maternal MediterraneanDiet Score (reflecting higher dietary quality) was associ-ated with lower mid-childhood BMI z-score and SST[20]. In the Mothers and Infants LinKed for Healthstudy (n = 354), higher maternal diet quality (higherscore on Healthy Eating Index) from pregnancy through
3 months postpartum was associated with lower infantweight-for-length z-score from birth to 6 months andbody fat % at 6 months [21]. In Project Viva (n = 992), amore pro-inflammatory diet (higher DII scores) duringpregnancy was associated with higher mid-childhood(median age: 7.7 years) adiposity, e.g. FMI and SST, butattenuated after adjustment for covariates [22]. TheHealthy Start Study (n = 1078) reported that higher DIIscores in obese mothers were associated with increasedneonatal fat mass [23]. Overall, results from our and
Fig. 2 a Associations of maternal E-DII and DASH scores with children’s FMI during mid-childhood by child sex and exposure time-point (onlyadjusted pooled estimates shown; all P-interactions < 0.10). Black dots indicate pooled point effect estimates with corresponding 95% CIsindicated by horizontal lines. Effect estimates were adjusted for maternal education, ethnicity, pre-pregnancy BMI, maternal height, parity, energyintake (for DASH analysis only), cigarette smoking and alcohol consumption during pregnancy and child sex and age at measurement. E-DII,energy-adjusted Dietary Inflammatory Index; DASH, Dietary Approaches to Stop Hypertension; FMI, fat mass index. b Associations of maternal E-DII and DASH scores with children’s FFMI during late-childhood by child sex and exposure time-point (only adjusted pooled estimates shown; allP-interactions < 0.10). Black dots indicate pooled point effect estimates with corresponding 95% CIs indicated by horizontal lines. Effect estimateswere adjusted for maternal education, ethnicity, pre-pregnancy BMI, maternal height, parity, energy intake (for DASH analysis only), cigarettesmoking and alcohol consumption during pregnancy and child sex and age at measurement. E-DII, energy-adjusted Dietary Inflammatory Index;DASH, Dietary Approaches to Stop Hypertension; FFMI, fat-free mass index
Chen et al. BMC Medicine (2021) 19:33 Page 9 of 14

these previous studies suggested beneficial influence ofbetter maternal dietary quality and lower dietary inflam-matory potential on offspring adiposity measures.That maternal diet can influence offspring adiposity is
biologically plausible. Maternal inflammation has beenassociated with higher offspring adiposity in both animal[16] and human [15] studies. One potential mechanismunderpinning the association between overall healthiermaternal diet and lower offspring adiposity could belowered maternal inflammation due to high intakes offoods rich in anti-oxidants such as fruit and vegetables[60, 61]. However, our mutual adjustment analyses didnot suggest that the influence of higher maternal DASHscores on childhood adiposity were mostly explained bymaternal dietary inflammatory potential. Child dietaryinflammatory potential also did not seem to meaning-fully alter the maternal E-DII vs postnatal adiposity asso-ciations, suggesting that childhood diet/influence ofshared familial diet is not a major mediator for our ob-servations. An alternative mechanism could be maternaldiet-induced modifications of epigenetic patterns in off-spring. Individuals who were prenatally exposed to ex-treme maternal undernutrition demonstrated persistentepigenetic differences 6 decades later, as compared totheir unexposed, same-sex siblings [62]. Milder in uteronutritional challenges such as lower maternal dietaryquality (low adherence to Mediterranean diet) [63],carbohydrate amount [64] and quality [65] have alsobeen shown to induce epigenetic differences in offspringat birth. Moreover, some of these epigenetic effects, e.g.greater methylation of RXRA chr9:136355885+, may becorrelated with greater adiposity in later childhood [64].Adipocyte proliferation is high during the first year of
life and from age 9–14 years but remains low in between[64, 66]. Due to the availability of data in our constituentcohorts, early childhood adiposity measures were re-corded at a mean age of 2.8 years. Thus, we might havemissed the window to detect more apparent associationsbetween maternal diet and early infancy adiposity. It isalso possible that alterations of gene expression in off-spring induced by maternal diets can present themselvesonly later in life. For example, in one animal study, in-creased expression of PPARα and CPT-1 (key genes inlipid and carbohydrate metabolism) was detected only inadult, but not neonatal, offspring of pregnant rat damsfed a protein-restricted diet [67]. However, these postu-lated mechanisms should be further investigated andconfirmed in a human population with greater granular-ity of adiposity measurements.Contrary to our expectation, higher E-DII score was
associated with a lower odds of early childhood OWOB.The BMI curve in childhood is characterized by an ini-tial increase until a peak at 1 year old, then dropping toa nadir around age 6 and starts rising again (a
phenomenon termed adiposity rebound). However, thereis variation of timing of adiposity rebound and childrenor adults who become obese have been reported as hav-ing an earlier adiposity rebound (around 3 years old) inearly childhood [68]. Those with a normal adiposity re-bound timing might thus have a higher BMI comparedto early rebounders, a potential explanation of this unex-pected result. This association was not present when astricter cut-off for obesity (> 95th percentile) was used,indicating that the unexpected association was influ-enced by a population that is less morbid. Alternatively,this unexpected association could represent chance find-ing as it is unlikely that a pro-inflammatory maternaldiet is protective against childhood OWOB.While a very useful and relevant measure, a higher
BMI may not only arise from greater body fat, but alsofrom higher fat-free mass, making it an imperfect meas-ure of adiposity [69, 70]. The differential magnitude andvelocity of fat and fat-free mass accretion during differ-ent growth periods further complicates the interpret-ation of changes in childhood BMI over time [71, 72].Our results suggest that dietary inflammatory potentialand overall quality may influence different aspects of off-spring body composition. For example, we observed thata higher E-DII score (pro-inflammatory maternal diet)tended to associate with a higher odds of late childhoodOWOB and lower FFMI; a lower FFMI can reflect over-all lower muscle or lean mass, which has been associatedwith a higher risk of metabolic syndrome in children[73, 74]. However, for our late-childhood FMI and FFMIoutcomes, only two UK cohorts (SWS and ALSPAC)were included for our analysis. Therefore, thegeneralizability of our observations should be confirmedin further studies. Nonetheless, the sex-interaction notedfor maternal dietary quality and inflammatory potentialwith FMI and FFMI during mid- and late-childhood inour study merits further investigation, as sexual di-morphism in body composition and epigenetic changesin response to early life factors is well-documented [75–79]. Difference in body composition between boys andgirls accentuates during later childhood in response tohormonal changes and could be an explanation of ourresults [80].The large sample size and substantial efforts spent in
harmonizing and curating data across multiple studiesare the major strengths of our study. To our knowledge,the current study represents the largest multi-centre col-laborative effort in investigating the influence of mater-nal dietary quality and inflammatory potential onchildhood adiposity outcomes.However, some limitations are worth noting. Our
study can mainly be generalized to European-born/White women in developed countries. Nonetheless, wedid include studies from a range of geographical regions
Chen et al. BMC Medicine (2021) 19:33 Page 10 of 14

within Europe (Ireland, British Isles, Western and East-ern Continental Europe), in which some diversity indietary intakes and sociodemographic characteristics wasobserved. Self-reported dietary data were used, whichmight have increased non-differential measurement er-rors that may bias results towards the null. Moreover,the FFQs were mainly validated for European-born/White women (e.g. in Gen R), potentially introducingheterogeneity and more measurement errors for non-European-born/non-White women. Indeed, in our ana-lyses restricted to European-born/White population, theobserved associations strengthened. We have applied acommonly used energy intake cut-off for pregnantwomen [54, 55] to exclude implausible dietary data.Other more conservative approaches such as specificallyexcluding misreporters (under- and over-reporters) ofdietary intakes could be considered in future studies.Generation of E-DII and the DASH scores in our studymight be subject to measurement errors as they aredependent on participants’ self reports and involved vari-able (20–28 out of 44 possible) dietary parameters, and48.1–79.1% of the total FFQ food items, respectively.However, former studies have found a good predictiveability of E-DII with as few as 18 E-DII parameters [19],while each food component of the DASH score com-prised at least five food items [36]. In some cohorts, chil-dren’s weights were self-reported rather than measured,potentially resulting in higher random measurement er-rors as it is unlikely that the errors depend on exposure.We did not find any consistent association with SST,probably due to challenges to obtain accurate skinfoldmeasurements in young children, resulting in larger ran-dom measurement errors [81]. As with any observationalstudy, the influence of residual confounding cannot becompletely ruled out. For instance, education attainmentcategorization and subsequently confounding controlwas presumably less precise in this study due to the needto harmonize the variable across cohorts. Furthermore,although we have harmonized and adjusted for many es-sential covariates, future studies should also considerother potential covariates such as physical activity andmediators such as gestational weight gain and detaileddata on breastfeeding duration. Finally, causality cannotbe established without further complementary evidence.
ConclusionsOur individual participant data meta-analysis within alarge consortium suggests that pro-inflammatory, low-quality maternal pregnancy diets may adversely influenceoffspring adiposity and obesity risk, especially duringlate-childhood. Promoting overall healthy dietary patternduring pregnancy may have lifelong consequences forthe offspring. Because most associations were observedat mid-childhood or later, future studies investigating in
utero programming of childhood adiposity may benefitfrom a longer follow-up.
Supplementary InformationThe online version contains supplementary material available at https://doi.org/10.1186/s12916-021-01908-7.
Additional file 1: Table S1-S19 and Fig. S1-S2. Table S1Characteristics of study participants according to included studies. TableS2 Characteristics of the cohorts in the ALPHABET consortium. Table S3Food parameters included for E-DII generation. Table S4 Food items in-cluded for DASH score generation. Fig. S1 Boxplots of E-DII scores in in-cluded studies. Table S5 Availability of outcome measures. Fig. S2Scatterplots of DASH score against E-DII score in each study. Table S6Association between maternal E-DII and DASH scores (per 1-SD increase)and childhood OWOB- excluding non-European-born/non-White partici-pants. Table S7 Association between maternal E-DII and DASH scores(per 1-SD increase) and secondary childhood adiposity measures- exclud-ing non-European-born/non-White participants. Table S8 Association be-tween maternal E-DII and DASH scores (per 1-SD increase) and childhoodOWOB- excluding mothers with pregnancy complications. Table S9 As-sociation between maternal E-DII and DASH scores (per 1-SD increase)and secondary childhood adiposity measures- excluding mothers withpregnancy complications. Table S10 Association between maternal E-DIIand DASH scores (per 1-SD increase) and childhood OWOB- with mutualadjustment of E-DII and DASH. Table S11 Association between maternalE-DII and DASH scores (per 1-SD increase) and secondary childhood adi-posity measures- with mutual adjustment of E-DII and DASH. Table S12Association between maternal E-DII and DASH scores (per 1-SD increase)and childhood obesity (BMI z-score > 95th percentile). Table S13 Associ-ation between maternal E-DII and DASH scores (per 1-SD increase) andchildhood OWOB- with further adjustment of birthweight. Table S14 As-sociation between maternal E-DII and DASH scores (per 1-SD increase)and secondary childhood adiposity measures- with further adjustment ofbirthweight. Table S15 Association between maternal E-DII and DASHscores (per 1-SD increase) and childhood OWOB- with further adjustmentof gestational age. Table S16 Association between maternal E-DII andDASH scores (per 1-SD increase) and secondary childhood adiposity mea-sures- with further adjustment of gestational age. Table S17 Associationbetween maternal E-DII (per 1-SD increase) and late-childhood OWOBand adiposity measures- with and without further adjustment for child E-DII score in cohorts with child E-DII data. Table S18 Pooled P-values forsex-interaction between maternal E-DII and DASH score and offspringadiposity outcomes. Table S19 Stratified estimates for other sex-interactions between maternal E-DII and DASH scores and offspring adi-posity outcomes (all P-interactions < 0.10).
AbbreviationsALSPAC: The Avon Longitudinal Study of Parents and Children; BMI: Bodymass index; DASH: Dietary Approaches to Stop Hypertension;DOHaD: Developmental Origins of Health and Diseases; EDEN: The study onthe pre- and early postnatal determinants of child health and development;E-DII: Energy-adjusted Dietary Inflammatory Index; FFMI: Fat-free mass index;FFQ: Food frequency questionnaire; FMI: Fat mass index; Generation R: TheGeneration R study; Lifeways: The Lifeways Cross-Generation Cohort Study;OWOB: Overweight and obesity; REPRO_PL: The Polish Mother and ChildCohort; ROLO: The Randomised cOntrol trial of LOw glycaemic index dietduring pregnancy study; SST: Sum of skinfold thickness; SWS: SouthamptonWomen’s Survey; WHO: World Health Organization
AcknowledgementsWhole consortium: the authors acknowledge all investigators working on theERA-HDHL ALPHABET project and are grateful to all the families in the par-ticipating cohorts. ALSPAC: we are extremely grateful to all the families whotook part in this study, the midwives for their help in recruiting them, andthe whole ALSPAC team, which includes interviewers, computer and labora-tory technicians, clerical workers, research scientists, volunteers, managers, re-ceptionists and nurses. Please note that the ALSPAC study website containsdetails of all available data is available through a fully searchable data
Chen et al. BMC Medicine (2021) 19:33 Page 11 of 14
dictionary and variable search tool (http://www.bristol.ac.uk/alspac/researchers/our-data/). EDEN: the authors thank the EDEN mother-child co-hort study group, whose members are I. Annesi-Maesano, J. Y. Bernard, J.Botton, M.A. Charles, P. Dargent-Molina, B. de Lauzon-Guillain, P. Ducimetière,M. de Agostini, B. Foliguet, A. Forhan, X. Fritel, A. Germa, V. Goua, R. Hankard,B. Heude, M. Kaminski, B. Larroque, N. Lelong, J. Lepeule, G. Magnin, L. Marc-hand, C. Nabet, F Pierre, R. Slama, M.J. Saurel-Cubizolles, M. Schweitzer, andO. Thiebaugeorges. Generation R: The Generation R Study is conducted bythe Erasmus Medical Centre in close collaboration with the School of Lawand the Faculty of Social Sciences at the Erasmus University, Rotterdam, theMunicipal Health Service, Rotterdam area, and the Stichting Trombosedienstand Artsenlaboratorium Rijnmond (Star-MDC), Rotterdam. We gratefully ac-knowledge the contribution of children and their parents, general practi-tioners, hospitals, midwives and pharmacies in Rotterdam. Lifeways: Wewould like to thank all members of the Lifeways cohort for their valuablecontribution to the study. The participation of families is much appreciated.REPRO_PL: We gratefully acknowledge the contribution of children and theirparents, hospitals, physicians, and midwives. ROLO: We are grateful to theparticipating mothers, children, and to the research and clinical staff who en-abled us recruit this pregnancy and birth cohort. SWS: We are grateful to thewomen of Southampton and their children, who gave their time to take partin this study, and to the research nurses and other staff who collected andprocessed the data
Role of the funding sourceThis work was supported by an award from the European Union’s Horizon2020 research and innovation programme under the ERA-Net Cofund of theJoint Programming Initiative Healthy Diet for Healthy Life (JPI-HDHL) (http://www.healthydietforhealthylife.eu). The funder was not involved in study’s de-sign, conduct and reporting.
Authors’ contributionsLW-C and CMP conceived and designed the current study. LW-C led projectcoordination of a work package within the consortium, data harmonizationand curation for the current study, undertook the statistical analysis, inter-preted results and wrote the first draft of the manuscript, with supervisionfrom CMP. CMP led the overall ALPHABET project and consortium. AMA, NS,JYB, SMM-B, AAG, JM, MS, KP, WH, AJ, CLR, SRC, NCH, CC, MH, KMG, RG, LD,BH, JRH, FMMA and CCK provided essential data for analyses and were in-volved in the data harmonization and curation process. All authors providedcritical input to the analyses, interpreted the data and revised the manuscriptcritically. The authors read and approved the final manuscript.
FundingThis work was supported by an award from the European Union’s Horizon2020 research and innovation programme under the ERA-Net Cofund of theJoint Programming Initiative Healthy Diet for Healthy Life (JPI-HDHL) (http://www.healthydietforhealthylife.eu) action number 696295 (Biomarkers for Nu-trition and Health). Co-funding was provided by Science Foundation Ireland,Ireland (Grant Number SFI/16/ERA-HDHL/3360), the UK Biotechnology andBiological Sciences Research Council (ERA-HDHL Biomarkers: BBSRC: BB/P028179/1 and BB/P028187/1), National Centre for Research and Develop-ment (ERA-HDHL/01/ALPHABET/1/2017), the ZonMW The Netherlands (no529051014; 2017)) ALPHABET project (no 696295; 2017) and the French Na-tional Agency of Research (reference AnrR16227KK). ALSPAC: The UK MedicalResearch Council and Wellcome (Grant ref.: 102215/2/13/2) and the Univer-sity of Bristol provide core support for ALSPAC. This publication is the workof the authors and Matthew Suderman will serve as guarantor for the con-tents of this paper. EDEN: The EDEN study was supported by Foundation formedical research (FRM), National Agency for Research (ANR), National Insti-tute for Research in Public health (IRESP: TGIR cohorte santé 2008 program),French Ministry of Health (DGS), French Ministry of Research, INSERM Boneand Joint Diseases National Research (PRO-A), and Human Nutrition NationalResearch Programs, Paris-Sud University, Nestlé, French National Institute forPopulation Health Surveillance (InVS), French National Institute for HealthEducation (INPES), the European Union FP7 programmes (FP7/2007–2013,HELIX, ESCAPE, ENRIECO, Medall projects), Diabetes National Research Pro-gram (through a collaboration with the French Association of Diabetic Pa-tients (AFD)), French Agency for Environmental Health Safety (now ANSES),Mutuelle Générale de l’Education Nationale a complementary health insur-ance (MGEN), French national agency for food security, French-speaking
association for the study of diabetes and metabolism (ALFEDIAM). Gener-ation R: The Generation R Study is made possible by financial support fromthe Erasmus Medical Centre, Rotterdam, the Erasmus University Rotterdamand The Netherlands Organization for Health Research and Development.The project received funding from the European Union’s Horizon 2020 re-search and innovation programme (LIFECYCLE project, grant agreement no733206; 2016). RG received funding from the Dutch Heart Foundation (grantnumber 2017 T013), the Dutch Diabetes Foundation (grant number2017.81.002) and the Netherlands Organization for Health Research and De-velopment (ZonMW, grant number 543003109). The study sponsors had norole in the study design, data analysis, interpretation of data, or writing ofthis report. Lifeways: The Lifeways Cross-Generation Cohort Study is fundedby the Irish Health Research Board (reference HRC/2007/13) and is overseenby an inter-disciplinary steering group. REPRO_PL: The REPRO_PL cohort wasmainly supported by the Ministry of Science and Higher Education, Poland(PBZ-MEiN-/8/2/2006; contract no. K140/P01/2007/1.3.1.1); by the grant PNRF-218-AI-1/07 from Norway through the Norwegian Financial Mechanismwithin the Polish- Norwegian Research Fund and National Science Centre,Poland (DEC-2014/15/B/NZ7/00998). ROLO: ROLO study is supported byHealth Research Board Health Research Centre for Diet and Health ResearchIreland and The National Maternity Hospital Medical Fund, and The EuropeanUnion’s Seventh Framework Programme (FP7/2007–2013). SWS: This workwas supported by grants from the Medical Research Council, British HeartFoundation, Arthritis Research UK, Food Standards Agency, and the EuropeanUnion’s Seventh Framework (FP7/2007–2013), projects EarlyNutrition andODIN under grant agreement numbers 289346 and 613977. KMG is sup-ported by the UK Medical Research Council (MC_UU_12011/4), the NationalInstitute for Health Research (NIHR Senior Investigator (NF-SI-0515-10042)and the NIHR Southampton Biomedical Research Centre) and the EuropeanUnion (Erasmus+ Programme Early Nutrition eAcademy Southeast Asia-573651-EPP-1-2016-1-DE-EPPKA2-CBHE-JP).
Availability of data and materialsThe data that support the findings of this study are available from theindividual studies constituting this consortium but restrictions apply to theavailability of these data, which were used under license for the currentstudy, and so are not publicly available. Data are however available from theauthors upon reasonable request and with permission from the executivecommittee in charge of the respective studies.
Ethics approval and consent to participateAll studies have been approved by the respective local ethical reviewcommittees and written consent was obtained from all mothers. Specificcohort approvals are as follows: ALSPAC: ALSPAC Ethics and Law Committee(IRB00003312) and Local Research Ethics Committees; EDEN: EthicsCommittee (CCPPRB) and CNIL (Commission Nationale Informatique etLiberté), the French data privacy institution; Generation R: Medical EthicalCommittee of the Erasmus Medical Center, Rotterdam; Lifeways: UniversityCollege Dublin Research Ethics Committee and St. Vincent’s UniversityHospital Research Ethics Committee; REPRO_PL: Ethical Committee of theNofer Institute of Occupational Medicine, Łódź, Poland (Decisions No. 7/2007,3/2008 and 22/2014); ROLO: Ethics Committee of the National MaternityHospital, Dublin, Ireland; SWS: Southampton and South West HampshireResearch Ethics Committee, ALSPAC Law and Ethics Committee, and theLocal Research Ethics Committees.
Consent for publicationNot applicable
Competing interestsDr. James R. Hébert owns controlling interest in Connecting HealthInnovations LLC (CHI), a company that has licensed the right to his inventionof the dietary inflammatory index (DII) from the University of South Carolinain order to develop computer and smart phone applications for patientcounselling and dietary intervention in clinical settings. Professor Keith MGodfrey has received reimbursement for speaking at conferences sponsoredby companies selling nutritional products and is part of an academicconsortium that has received research funding from Abbott Nutrition,Nestec, BenevolentAI Bio Ltd. and Danone. Dr. Nitin Shivappa is an employeeof CHI. Other authors declare no conflict of interest.
Chen et al. BMC Medicine (2021) 19:33 Page 12 of 14

Author details1HRB Centre for Health and Diet Research, School of Public Health,Physiotherapy, and Sports Science, University College Dublin, Dublin,Republic of Ireland. 2Université de Paris, Centre for Research in Epidemiologyand StatisticS (CRESS), Inserm, Inrae, F-75004 Paris, France. 3Arnold School ofPublic Health, University of South Carolina, Columbia, SC 29208, USA.4Connecting Health Innovations, LLC, Columbia, SC 29201, USA. 5SingaporeInstitute for Clinical Sciences (SICS), Agency for Science, Technology andResearch (A*STAR), Singapore 117609, Singapore. 6The Generation R StudyGroup, Erasmus MC, University Medical Center Rotterdam, Rotterdam, TheNetherlands. 7Department of Pediatrics, Division of Respiratory Medicine andAllergology, Erasmus MC, University Medical Center Rotterdam, Rotterdam,The Netherlands. 8UCD Perinatal Research Centre, School of Medicine,University College Dublin, National Maternity Hospital, Dublin, Ireland. 9MRCIntegrative Epidemiology Unit, Bristol Medical School, University of Bristol,Bristol, UK. 10Nofer Institute of Occupational Medicine, Lodz, Poland. 11MRCLifecourse Epidemiology Unit (University of Southampton) University HospitalSouthampton, Southampton, UK. 12NIHR Southampton Biomedical ResearchCentre, University of Southampton and University Hospital SouthamptonNHS Foundation Trust, Southampton, UK. 13Institute of DevelopmentalSciences, Faculty of Medicine, University of Southampton, Southampton, UK.14Department of Pediatrics, Erasmus MC, University Medical CenterRotterdam, Rotterdam, The Netherlands. 15Department of Pediatrics, Divisionof Neonatology, Erasmus MC, University Medical Center Rotterdam,Rotterdam, The Netherlands.
Received: 28 May 2020 Accepted: 11 January 2021
References1. Lobstein T, Jackson-Leach R, Moodie ML, Hall KD, Gortmaker SL, Swinburn
BA, et al. Child and adolescent obesity: part of a bigger picture. Lancet.2015;385:2510–20.
2. The Lancet. Managing the tide of childhood obesity. Lancet. 2015;385:2434.3. Mameli C, Mazzantini S, Zuccotti GV. Nutrition in the First 1000 Days: The
Origin of Childhood Obesity. Int J Environ Res Public Health. 2016;13(9):838.https://doi.org/10.3390/ijerph13090838.
4. Blake-Lamb TL, Locks LM, Perkins ME, Woo Baidal JA, Cheng ER, Taveras EM.Interventions for childhood obesity in the first 1,000 days a systematicreview. Am J Prev Med. 2016;50:780–9.
5. Nishtar S, Gluckman P, Armstrong T. Ending childhood obesity: a time foraction. Lancet. 2016;387:825–7.
6. Ravelli AC, van der Meulen JH, Osmond C, Barker DJ, Bleker OP. Obesity atthe age of 50 y in men and women exposed to famine prenatally. Am JClin Nutr. 1999;70:811–6.
7. Liu L, Pang ZC, Sun JP, Xue B, Wang SJ, Ning F, et al. Exposure to famine inearly life and the risk of obesity in adulthood in Qingdao: evidence fromthe 1959–1961 Chinese famine. Nutr Metab Cardiovasc Dis. 2017;27:154–60.
8. Maslova E, Rytter D, Bech BH, Henriksen TB, Rasmussen MA, Olsen SF, et al.Maternal protein intake during pregnancy and offspring overweight 20 ylater. Am J Clin Nutr. 2014;100:1139–48.
9. Chen L-W, Aris I, Bernard J, Tint M-T, Chia A, Colega M, et al. Associations ofmaternal dietary patterns during pregnancy with offspring adiposity frombirth until 54 months of age. Nutrients. 2016;9:2.
10. Chen L-W, Aris IM, Bernard JY, Tint MT, Colega M, Gluckman PD, et al.Associations of maternal macronutrient intake during pregnancy withinfant BMI peak characteristics and childhood BMI. Am J Clin Nutr.2017;105:705–13.
11. Meng R, Lv J, Yu C, Guo Y, Bian Z, Yang L, et al. Prenatal famine exposure,adulthood obesity patterns and risk of type 2 diabetes. Int J Epidemiol.2018;47:399–408.
12. Perng W, Oken E, Dabelea D. Developmental overnutrition and obesity andtype 2 diabetes in offspring. Diabetologia. 2019;62:1779–88.
13. Kant AK. Indexes of overall diet quality: a review. J Am Diet Assoc. 1996;96:785–91.
14. Cespedes EM, Hu FB. Dietary patterns: from nutritional epidemiologicanalysis to national guidelines. Am J Clin Nutr. 2015;101:899–900.
15. Gaillard R, Rifas-Shiman SL, Perng W, Oken E, Gillman MW. Maternalinflammation during pregnancy and childhood adiposity. Obesity (SilverSpring). 2016;24(6):1320-7. https://doi.org/10.1002/oby.21484. Epub 2016Apr 20.
16. Sen S, Simmons RA. Maternal antioxidant supplementation preventsadiposity in the offspring of Western diet-fed rats. Diabetes. 2010;59:3058–65.
17. Minihane AM, Vinoy S, Russell WR, Baka A, Roche HM, Tuohy KM, et al. Low-grade inflammation, diet composition and health: current research evidenceand its translation. Br J Nutr. 2015;114:999–1012.
18. Phillips CM, Chen L-W, Heude B, Bernard JY, Harvey NC, Duijts L, et al.Dietary inflammatory index and non-communicable disease risk: a narrativereview. Nutrients. 2019;11:1873.
19. Hébert JR, Shivappa N, Wirth MD, Hussey JR, Hurley TG. Perspective: thedietary inflammatory index (DII)-lessons learned, improvements made, andfuture directions. Adv Nutr. 2019;10:185–95.
20. Chatzi L, Rifas-Shiman SL, Georgiou V, Joung KE, Koinaki S, Chalkiadaki G,et al. Adherence to the Mediterranean diet during pregnancy and offspringadiposity and cardiometabolic traits in childhood. Pediatr Obes. 2017;12:47–56.
21. Tahir MJ, Haapala JL, Foster LP, Duncan KM, Teague AM, Kharbanda EO,McGovern PM, Whitaker KM, Rasmussen KM, Fields DA, Jacobs DR Jr,Harnack LJ, Demerath EW. Higher Maternal Diet Quality during Pregnancyand Lactation Is Associated with Lower Infant Weight-For-Length, Body FatPercent, and Fat Mass in Early Postnatal Life. Nutrients. 2019;11(3):632.https://doi.org/10.3390/nu11030632.
22. Sen S, Rifas-Shiman SL, Shivappa N, Wirth MD, Hebert JR, Gold DR, et al.Associations of prenatal and early life dietary inflammatory potential with childhoodadiposity and cardiometabolic risk in Project Viva. Pediatr Obes. 2018;13:292–300.
23. Moore BF, Sauder KA, Starling AP, Hébert JR, Shivappa N, Ringham BM, et al.Proinflammatory diets during pregnancy and neonatal adiposity in thehealthy start study. J Pediatr. 2018;195:121–127.e2.
24. Crozier SR, Robinson SM, Godfrey KM, Cooper C, Inskip HM. Women’s dietarypatterns change little from before to during pregnancy. J Nutr. 2009;139:1956–63.
25. Toro-Ramos T, Paley C, Pi-Sunyer FX, Gallagher D. Body composition duringfetal development and infancy through the age of 5 years. Eur J Clin Nutr.2015;69:1279–89.
26. Stephenson J, Heslehurst N, Hall J, Schoenaker DAJM, Hutchinson J, CadeJE, et al. Before the beginning: nutrition and lifestyle in the preconceptionperiod and its importance for future health. Lancet. 2018;391:1830–41.
27. Jaddoe VWV, Mackenbach JP, Moll HA, Steegers EAP, Tiemeier H, VerhulstFC, et al. The Generation R Study: design and cohort profile. Eur JEpidemiol. 2006;21:475–84.
28. Polańska K, Hanke W, Król A, Potocka A, Waszkowska M, Jacukowicz A, et al. Polishmother and child cohort study (REPRO-Pl) - methodology of the follow-up of thechildren at the age of 7. Int J Occup Med Environ Health. 2016;29:883–93.
29. Heude B, Forhan A, Slama R, Douhaud L, Bedel S, Saurel-Cubizolles M-J,et al. Cohort profile: the EDEN mother-child cohort on the prenatal andearly postnatal determinants of child health and development. Int JEpidemiol. 2016;45:353–63.
30. O'Mahony D, Fallon UB, Hannon F, Kloeckner K, Avalos G, Murphy AW,Kelleher CC; Lifeways Cross Generation Cohort Study Steering Group. TheLifeways Cross-Generation Study: design, recruitment and datamanagement considerations. Ir Med J. 2007;100(8):suppl 3-6.
31. Fraser A, Macdonald-Wallis C, Tilling K, Boyd A, Golding J, Davey Smith G,et al. Cohort profile: the Avon longitudinal study of parents and children:ALSPAC mothers cohort. Int J Epidemiol. 2013;42:97–110.
32. Inskip HM, Godfrey KM, Robinson SM, Law CM, Barker DJP, Cooper C, et al. Cohortprofile: the Southampton Women’s survey. Int J Epidemiol. 2005;35:42–8.
33. Walsh JM, McGowan CA, Mahony R, Foley ME, McAuliffe FM. Low glycaemicindex diet in pregnancy to prevent macrosomia (ROLO study): randomisedcontrol trial. BMJ. 2012;345:e5605.
34. Kooijman MN, Kruithof CJ, van Duijn CM, Duijts L, Franco OH, vanIJzendoorn MH, et al. The Generation R Study: design and cohort update2017. Eur J Epidemiol. 2016;31:1243–64.
35. Boyd A, Golding J, Macleod J, Lawlor DA, Fraser A, Henderson J, et al.Cohort profile: the ‘children of the 90s’-the index offspring of the Avonlongitudinal study of parents and children. Int J Epidemiol. 2013;42:111–27.
36. Aubert AM, Forhan A, de Lauzon-Guillain B, Chen L-W, Polanska K, Hanke W,et al. Deriving the Dietary Approaches to Stop Hypertension (DASH) scorein women from seven pregnancy cohorts from the European ALPHABETconsortium. Nutrients. 2019;11:2706.
37. Deschamps V, de Lauzon-Guillain B, Lafay L, Borys J-M, Charles MA, RomonM. Reproducibility and relative validity of a food-frequency questionnaireamong French adults and adolescents. Eur J Clin Nutr. 2007;63:282–91.
Chen et al. BMC Medicine (2021) 19:33 Page 13 of 14

38. Klipstein-Grobusch K, den Breeijen JH, Goldbohm RA, Geleijnse JM, Hofman A,Grobbee DE, et al. Dietary assessment in the elderly: validation of asemiquantitative food frequency questionnaire. Eur J Clin Nutr. 1998;52:588–96.
39. Murrin C, Shrivastava A, Kelleher CC. Maternal macronutrient intake duringpregnancy and 5 years postpartum and associations with child weightstatus aged five. Eur J Clin Nutr. 2013;67:670–9.
40. Harrington J. Validation of a Food Frequency Questionnaire as a tool forassessing nutrient intake (MA thesis). Galway: National University of IrelandGalway; 1997.
41. Horan MK, McGowan CA, Doyle O, McAuliffe FM. Well-being in pregnancy:an examination of the effect of socioeconomic, dietary and lifestyle factorsincluding impact of a low glycaemic index dietary intervention. Eur J ClinNutr. 2013;68:19–24.
42. Rogers I, Emmett P. Diet during pregnancy in a population of pregnantwomen in South West England. Eur J Clin Nutr. 1998;52:246–50.
43. Wesołowska E, Jankowska A, Trafalska E, Kałużny P, Grzesiak M, DominowskaJ, Hanke W, Calamandrei G, Polańska K. Sociodemographic, Lifestyle,Environmental and Pregnancy-Related Determinants of Dietary Patternsduring Pregnancy. Int J Environ Res Public Health. 2019;16(5):754. https://doi.org/10.3390/ijerph16050754.
44. Robinson S, Godfrey K, Osmond C, Cox V, Barker D. Evaluation of a foodfrequency questionnaire used to assess nutrient intakes in pregnantwomen. Eur J Clin Nutr. 1996;50:302–8.
45. Voortman T, Steegers-Theunissen RPM, Bergen NE, Jaddoe VWV, LoomanCWN, Kiefte-de Jong JC, et al. Validation of a semi-quantitative food-frequency questionnaire for Dutch pregnant women from the generalpopulation using the method or triads. Nutrients. 2020;12:1341.
46. Shivappa N, Steck SE, Hurley TG, Hussey JR, Hébert JR. Designing anddeveloping a literature-derived, population-based dietary inflammatoryindex. Public Health Nutr. 2014;17:1689–96.
47. Fung TT, Chiuve SE, McCullough ML, Rexrode KM, Logroscino G, Hu FB.Adherence to a DASH-style diet and risk of coronary heart disease andstroke in women. Arch Intern Med. 2008;168:713.
48. Miller PE, Cross AJ, Subar AF, Krebs-Smith SM, Park Y, Powell-Wiley T, et al.Comparison of 4 established DASH diet indexes: examining associations ofindex scores and colorectal cancer. Am J Clin Nutr. 2013;98:794–803.
49. Barlow SE; Expert Committee. Expert committee recommendationsregarding the prevention, assessment, and treatment of child andadolescent overweight and obesity: summary report. Pediatrics. 2007;120Suppl 4:S164-92. https://doi.org/10.1542/peds.2007-2329C.
50. WHO Multicentre Growth Reference Study Group. WHO Child Growth Standardsbased on length/height, weight and age. Acta Paediatr Suppl. 2006;450:76–85.
51. de Onis M, Onyango AW, Borghi E, Siyam A, Nishida C, Siekmann J.Development of a WHO growth reference for school-aged children andadolescents. Bull World Health Organ. 2007;85:660–7.
52. Fishbein DH, Michael L, Guthrie C, Carr C, Raymer J. Associations BetweenEnvironmental Conditions and Executive Cognitive Functioning andBehaviorDuring Late Childhood: A Pilot Study. Front Psychol. 2019;10:1263.https://doi.org/10.3389/fpsyg.2019.01263.
53. Duong J, Bradshaw CP. Links between contexts and middle to late childhoodsocial-emotional development. Am J Community Psychol. 2017;60:538–54.
54. Tobias DK, Hu FB, Chavarro J, Rosner B, Mozaffarian D, Zhang C. Healthfuldietary patterns and type 2 diabetes mellitus risk among women with a historyof gestational diabetes mellitus. Arch Intern Med. 2012;172:1566–72.
55. Qiu C, Zhang C, Gelaye B, Enquobahrie DA, Frederick IO, Williams MA.Gestational diabetes mellitus in relation to maternal dietary heme iron andnonheme iron intake. Diabetes Care. 2011;34:1564–9.
56. Higgins JPT, Thompson SG, Deeks JJ, Altman DG. Measuring inconsistencyin meta-analyses. BMJ. 2003;327:557–60.
57. Higgins JPT, Thompson SG. Quantifying heterogeneity in a meta-analysis.Stat Med. 2002;21:1539–58.
58. Chen L-W, Aubert AM, Shivappa N, Bernard JY, Mensink-bout SM, Geraghty AA,et al. Associations of maternal dietary inflammatory potential and quality withoffspring birth outcomes : An individual participant data pooled analysis of 7European cohorts in the ALPHABET consortium. Plos Med. 2021;In press.
59. Khan S, Wirth M, Ortaglia A, Alvarado C, Shivappa N, Hurley T, et al. Design,Development and Construct Validation of the Children’s DietaryInflammatory Index. Nutrients. 2018;10:993.
60. Holt EM, Steffen LM, Moran A, Basu S, Steinberger J, Ross JA, et al. Fruit andvegetable consumption and its relation to markers of inflammation andoxidative stress in adolescents. J Am Diet Assoc. 2009;109:414–21.
61. Giugliano D, Ceriello A, Esposito K. The effects of diet on inflammation:emphasis on the metabolic syndrome. J Am Coll Cardiol. 2006;48:677–85.
62. Heijmans BT, Tobi EW, Stein AD, Putter H, Blauw GJ, Susser ES, et al.Persistent epigenetic differences associated with prenatal exposure tofamine in humans. Proc Natl Acad Sci U S A. 2008;105:17046–9.
63. Gonzalez-Nahm S, Mendez M, Robinson W, Murphy SK, Hoyo C, Hogan V, RowleyD. Low maternal adherence to a Mediterranean diet is associated with increase inmethylation at the MEG3-IG differentially methylated region in female infants.Environ Epigenet. 2017;3(2):dvx007. https://doi.org/10.1093/eep/dvx007.
64. Godfrey KM, Sheppard A, Gluckman PD, Lillycrop KA, Burdge GC, McLean C,et al. Epigenetic gene promoter methylation at birth is associated withchild’s later adiposity. Diabetes. 2011;60:1528–34.
65. Geraghty A, Sexton-Oates A, O’Brien E, Alberdi G, Fransquet P, Saffery R,et al. A low glycaemic index diet in pregnancy induces DNA methylationvariation in blood of newborns: results from the ROLO randomisedcontrolled trial. Nutrients. 2018;10:455.
66. Baum D, Beck RQ, Hammer LD, Brasel JA, Greenwood MR. Adipose tissuethymidine kinase activity in man. Pediatr Res. 1986;20:118–21.
67. Slater-Jefferies JL, Lillycrop KA, Townsend PA, Torrens C, Hoile SP, HansonMA, et al. Feeding a protein-restricted diet during pregnancy inducesaltered epigenetic regulation of peroxisomal proliferator-activated receptor-α in the heart of the offspring. J Dev Orig Health Dis. 2011;2:250–5.
68. Rolland-Cachera MF, Deheeger M, Maillot M, Bellisle F. Early adiposity rebound:causes and consequences for obesity in children and adults. Int J Obes. 2006;30:S11–7.
69. Wells JCK. Toward body composition reference data for infants, children,and adolescents. Adv Nutr. 2014;5:320S–9S.
70. Javed A, Jumean M, Murad MH, Okorodudu D, Kumar S, Somers VK, et al.Diagnostic performance of body mass index to identify obesity as definedby body adiposity in children and adolescents: a systematic review andmeta-analysis. Pediatr Obes. 2015;10:234–44.
71. Malone SK, Zemel BS. Measurement and interpretation of body mass indexduring childhood and adolescence. J Sch Nurs. 2015;31:261–71.
72. Freedman DS, Wang J, Maynard LM, Thornton JC, Mei Z, Pierson RN, et al.Relation of BMI to fat and fat-free mass among children and adolescents.Int J Obes. 2005;29:1–8.
73. Burrows R, Correa-Burrows P, Reyes M, Blanco E, Albala C, Gahagan S. Lowmuscle mass is associated with cardiometabolic risk regardless of nutritionalstatus in adolescents: a cross-sectional study in a Chilean birth cohort.Pediatr Diabetes. 2017;18:895–902.
74. Steene-Johannessen J, Anderssen SA, Kolle E, Andersen LB. Low musclefitness is associated with metabolic risk in youth. Med Sci Sports Exerc.2009;41:1361–7.
75. Tobi EW, Lumey LH, Talens RP, Kremer D, Putter H, Stein AD, et al. DNAmethylation differences after exposure to prenatal famine are common andtiming- and sex-specific. Hum Mol Genet. 2009;18:4046–53.
76. Murphy SK, Adigun A, Huang Z, Overcash F, Wang F, Jirtle RL, et al. Gender-specific methylation differences in relation to prenatal exposure to cigarettesmoke. Gene. 2012;494:36–43.
77. Andres A, Hull HR, Shankar K, Casey PH, Cleves MA, Badger TM. Longitudinalbody composition of children born to mothers with normal weight,overweight, and obesity. Obesity. 2015;23:1252–8.
78. Chen L-W, Tint M-T, Fortier MV, Aris IM, Bernard JY, Colega M, et al. Maternalmacronutrient intake during pregnancy is associated with neonatalabdominal adiposity: The Growing Up in Singapore Towards healthyOutcomes (GUSTO) study. J Nutr. 2016;146:1571–9.
79. Donnelly JM, Lindsay K, Walsh JM, Horan MK, O'Shea D, Molloy EJ, McAuliffeFM. Perinatal inflammation and childhood adiposity - a gender effect? JMatern Fetal Neonatal Med. 2020;33(7):1203-10. https://doi.org/10.1080/14767058.2018.1517315. Epub 2018 Sep 27.
80. Veldhuis JD, Roemmich JN, Richmond EJ, Rogol AD, Lovejoy JC, Sheffield-Moore M, et al. Endocrine control of body composition in infancy,childhood, and puberty. Endocr Rev. 2005;26:114–46.
81. Ulijaszek SJ, Kerr DA. Anthropometric measurement error and theassessment of nutritional status. Br J Nutr. 1999;82:165–77.
Publisher’s NoteSpringer Nature remains neutral with regard to jurisdictional claims inpublished maps and institutional affiliations.
Chen et al. BMC Medicine (2021) 19:33 Page 14 of 14