maternal and newborn health country profiles mongolia · maternal and newborn health country...
TRANSCRIPT

Maternal and Newborn Health Country Profiles: Mongolia 1
1990 2010 MDG target 2015
Under-5mortality rate
Infantmortality rate
Neonatalmortality rate
Trends in child mortality
1990 2010 MDG target 2015
Trends in maternal mortality
Trends in maternal indicators
Maternal mortality ratio
Contraceptiveprevalence rate
(met need)
Unmet familyplanning need
Women 20-24married before
age 18
Adolescentbirth rate
2008 RHS MICS 2010 2010 UNSD/WPP
Dea
ths
per 1
,000
live
birt
hs
Dea
ths
per 1
00,0
00 li
ve b
irths
Pe
r cen
t (%
)
107
76
27 32** 26 12
36
15
**MDG target achieved
120
63 50
55.2
14.4
55
22
7
38
19.8
Mongolia has achieved MDG 4 with an impressive annual rate of reduction of 5.9 in its under-5 mortality rate between 1990 and 2011. Great disparities based on urban or rural residence and socio-economic status of households need to be confronted. Pneumonia and newborn complications lead in the challenges to child survival. The country has made substantial progress on MDG 5, although the high rates of maternal mortality in the central, western and Khangai regions require focused strategies to reduce the number of preventable deaths.
Mongolia
TRENDS AND POLICIES
Maternal and Newborn Health Country Profiles
Sources: 1World Health Organization National Health Account database 2012 (retrieved from www.data.worldbank.org); 2UNICEF Mongolia Country Office.
Sources for figures: Trends in child mortality: 1990 and 2010 Child data from UN Inter-agency Group for Child Mortality Estimation, Levels & Trends in Child Mortality, 2011; 2015 targets from Levels & Trends (U5MR) and UNDP third National Report on MDG Implementation Mongolia (IMR). Trends in maternal mortality: WHO/UNICEF/UNFPA/World Bank, Trends in Maternal Mortality: 1990 to 2010; UNICEF, Maternal, Newborn and Child Survival Mongolia Country Profile, March 2012. Trends in maternal indicators: UNDP 2012 Update for the MDG database (retrieved from www.un.org/esa/population) and Mongolia Multiple Indicator Cluster Survey (MICS) 2010. UNDP estimates are based on 2008 Mongolia Reproductive Health Survey (RHS) and United Nations Statistics Division (UNSD) and World Population Prospect (WPP) 2010. Notes: Contraceptive prevalence rate proportion of currently married women aged 15–49 who were using some method of family planning at the time of the survey; unmet family planning need: % of women with an unmet need for family planning (spacing or limiting); adolescent birth rate: annual number of births among women aged 15–19 per 1,000 women in the age group.
National health policies and services Availability
Per capita total expenditure on health (US$), 2007–20111
120
Out-of-pocket expenditure (% of private expenditure on health), 2007–20111
92.1
Specific notification of maternal deaths
Yes
Midwifery personnel authorized to administer core set of lifesaving interventions
Partial
Costed national implementation plans for maternal, newborn and child health available
Partial
Number of basic emergency obstetric and newborn care facilities2
352
Facilities per 1,000 births NA
Community treatment of pneumonia with antibiotics
Partial
Oral rehydration solution and zinc for management of diarrhoea
Yes

Maternal and Newborn Health Country Profiles: Mongolia2
Indicators of quality of careAntenatal care Intrapartum/delivery Postnatal care
0
100
20
40
60
80
ANC1+ ANC4+ BP measured
BPUABI
Blood sample
Urine sample
SBA Inst.delivery
C-section BF (excl.) Birth reg.
Per c
ent (
%)
99
81
95 97 97 97 99 99
21
59
99
Source: MICS 2010. Notes: ANC1+: % of women who received ≥1 ANC visit; ANC4+: at ≥4 ANC visits; *% of ANC visit that included measuring blood pressure (BP) and collecting blood and urine samples; SBA: % of births delivered by a skilled birth attendant (doctor, nurse, midwife); inst. delivery: % of births delivered at a health facility; C-section: % of births delivered by caesarean section; BF (excl.): % of children younger than 6 months who were exclusively breastfed; PNC within 2 days: % of women who received a postnatal check-up within 2 days of delivery (calculated by adding the sum of the % of women who received PNC within less than 4 hours, 4–23 hours and within 2 days of delivery and mentioned in the DHS); birth reg.: % of children younger than 5 years whose birth was registered with the State.
AvAILAbILITy Of NATIONAL POLICIES1 fOR hIGh-IMPACT INTERvENTIONS ShOwN TO
IMPROvE NEONATAL SuRvIvAL ThROuGhOuT ThE CONTINuuM Of CARE2
Postnatal
- Resuscitation of newborn baby- breastfeeding- Prevention and management
of hypothermia- Kangaroo mother care- Community-based pneumonia
management - Emergency neonatal care
Legend: green: intervention addressed in policy unless specified.Sources: 1Maternal and Newborn Health Strategy 2011–2015; Child Survival Strategy 2011–2015; and the Fourth National Reproductive Health Programme 2012–2016; 2Darmstadt et al., 2005. Notes: DT: diphtheria and tetanus; PROM: premature rupture of membranes; emergency obstetric care: management of complications-obstructed labour, haemorrhage, hypertension, infection; C-section: caesarean section (detection and management of breech); PMTCT: prevention of mother-to-child transmission of human immunodeficiency virus (HIV); labour surveillance (including partograph) for early diagnosis of complications); kangaroo mother care (care for low birth weight infants in health facilities); emergency neonatal care: management of serious illness (infections, asphyxia, prematurity, jaundice).Reference: Darmstadt, G.L. et al., ‘Evidence-Based, Cost-Effective Interventions: How many newborn babies can we save?’ The Lancet, 2005: 365 (9463).
Preconception
- folic acid supplmentation (No policy but planning to legislate mandatory flour fortification)
Intrapartum
- Skilled maternal and neonatal care
- Emergency obstetric care- Antibiotics for PROM- Steroids for preterm labour- C-section- PMTCT- Labour surveillance- Clean delivery practices
Antenatal
- Adolescent DT immunization- Syphilis screening- Pre-eclampsia and eclampsia
prevention- Detection and treatment of
asymptomatic bacteriuria

Maternal and Newborn Health Country Profiles: Mongolia 3
READINESS fOR NATIONAL SCALING uP Of NEwbORN CARE
- National needs assessment for newborn health conducted
- Local evidence generated for newborn survival
- Local evidence disseminated on newborn survival (partially)
- Existence of a convening mechanism for newborn health issues
- Focal person for newborn health in Ministry of Health
- Maternal and newborn indicators included in national surveys, e.g. NMR, % of newborns with low birth weight, % of newborns visited within first 3 days of birth, etc.
- National newborn policy endorsed - National behaviour change
communication strategy (but not specific to maternal, neonatal and child health)
- Essential drug list includes injectable antibiotics for primary level care (funding mechanisms or provider payment mechanisms is a barrier (for outpatient visit parents should buy whereas if you admit hospital you will get it free, health insurance subsidize 80% of cost if you buy, but designated pharmacies selling them are too far from poor areas)
- Midwives authorized to perform neonatal resuscitation
- Community-based cadres authorized to administer injectable antibiotics for newborn infections
- Primary-level cadres authorized to administer injectable antibiotics for newborn infections
- Community-based cadres authorized to perform neonatal resuscitation
- Primary-level cadres authorized to perform neonatal resuscitation
- Maternal and newborn indicators included in national health information systems
- National targets to track newborn health established
- Newborn policy integrated into other health policies or strategies
- Reproductive, maternal, newborn and child health expenditure per child younger than 5 years and per woman aged 19–49 (only marginal budgeting for bottlenecks available)
- Costed implementation plan for maternal, newborn and child health
- Cadre identified for home-based newborn care
- In-service newborn care training materials for facility-based cadres
- Pre-service newborn care education for facility-based cadres (in clinical IMCI for doctors)
- Supervision system for maternal, newborn and child health established at primary health centre level (lack of funding is available for regular supervision)
- Protocol or standards for district hospital care of sick newborns in place
- Integrated management of childhood illness algorithm adapted to include the first week of life
- Resource requirement for scaling up home based newborn care available (costed information not available, only international evidence is used)
- Pre-service newborn care education for community-based cadres (will be in revised C-IMCI module and to be taught in colleges)
- Resource requirement for primary health care level available for newborns (costed information not available)
- Resource requirement for secondary level health care available for newborns (costed information not available)
- System for neonatal death audits exists (planning to do in 2013 if Ministry of Health agrees)
- System for perinatal death audits exists (planning in 2013 if Government accepts)
Legend: green: benchmark met; red: benchmark not met.Source: Moran, A.C. et al., 2012. Availability of benchmarks as per UNICEF Mongolia Country Office.Reference: Moran, A.C. et al., ‘Benchmarks to Measure Readiness to Integrate and Scale Up Newborn Survival Interventions’, Health Policy Planning, 2012: 27 (iii29-iii39).
Agenda setting
Agenda setting
Policy formulation
Policy formulation
Policy implementation
Policy implementation

Maternal and Newborn Health Country Profiles: Mongolia4
CONTINuING INEQuITIES: Indicators by residence, wealth quintiles and provinces
ANC4 Urine sample STI screening
Disparities by residence
Disparities by wealth quintiles
SBA C-section Birth reg.
Dea
ths
per
1,0
00 li
ve b
irth
s
Disparities by residence
U5MR IMR
Dea
ths
per
1,0
00 li
ve b
irth
s
BF exd ORT/CONT. feed DPT3
SBA Inst. delivery PNC 2dU5MR IMR
Disparities by wealth quintiles
Khangai UB Khangai UB
Most and least affected provinces
Dea
ths
per
1,0
00 li
ve b
irth
s
Most and least affected provinces
Per
cen
t (%
)P
er c
ent
(%)
Per
cen
t (%
)
Rural Urban Countrytotal
Poorest Wealthiest Rural Urban Countrytotal
Poorest Wealthiest
Rural Urban Countrytotal
Poorest Wealthiest Rural Urban Countrytotal
Poorest Wealthiest
62
48
28
24
32
26 67
51
25
21 80 82 81 78 83
93 99 97 92 98
87 98 94 85 98
98
17
99
99
23
99
99
21
99
98
16
99
99
31
99
65
56
90
55
56
94
59
56
92
64
51
91
52
66
96
72
21
55
18
79 92
89 99
79
99
Western Eastern Western Eastern and UB
Western UB
Source: Mongolia MICS 2010. Notes: Comparison of data is by residence (rural versus urban versus country total), wealth quintiles (poorest versus richest versus country total) and by regions (most affected versus least affected); U5MR: Mortality for children younger than 5 years; IMR: infant mortality rate; urine sample: % of pregnant women who had their urine sample taken during an antenatal care (ANC) visit; ANC4: % of pregnant women receiving ANC 4 or more times during pregnancy (recommended # by WHO); STI screening: % of pregnant women who had a screening for sexually transmitted infections during the ANC visit; SBA: % of pregnancies delivered by a skilled birth attendant; C-section: % of births delivered by caesarean section; birth reg.: % of children younger than 5 years old whose birth was registered with the State. BF excl.: % of children younger than 6 months who were exclusively breastfed; ORT/CONT. feeding: % of children with diarrhoea who received oral rehydration therapy or increased intake and at the same time was continuously fed; DPT3: % of children age 12–23 months who received the recommended 3 doses of DPT by 12 months. Regions: Western, Eastern, UB (Ulaanbaatar), Khangai.

Maternal and Newborn Health Country Profiles: Mongolia 5
Indicator
Residence QuintilesMost and least affected provincesRural urban Poorest wealthiest
U5MR (country avg: 32 per Levels & Trends report; 45 per MICS 2010)
62 28 67 25 M: Khangai (72); L: UB (21)
NMR (country avg: 12 per Levels & Trends report)
- - - -
IMR (country avg: 26 per Levels & Trends report and 36 per MICS 2010)
48 24 51 21 M: Khangai (55); L: UB (18)
Pre-pregnancy
Contraceptive prevalence rate (55%) 59 52 58 52 M: UB (52%); L: Eastern (64)
Unmet need for contraception (country avg: 22%) 20 24 20 23 M: UB (25); L: Eastern (16)
% of women aged 20–49 who were married before 18 (country avg: 7%)
9 5 12 4 M: Khangai and Central (9); L: Western (4)
Blood sample (country avg: 46.6%) 32.7 60.7 21.6 77.9 M: ARMM (16.8); L: National Capital Region (81.2)
Urine sample taken at ANC, % (country level 54.3%)
39.9 68.8 23.9 86.7 M: ARMM (18.2); L: National Capital Region (86.3)
Antenatal
ANC1 (% of pregnant women receiving ANC 1 or more times from a skilled provider during pregnancy; country avg: 99%)
99 99 99 98 99 for all regions except Eastern with 100
ANC4 (% of pregnant women receiving ANC from any provider 81%)
80 82 78 83 M: Western (79); L: Eastern (92)
% pregnant women who received BP check, urine test, blood test before delivery (95%)
- - - - -
Blood pressure taken (country avg: 97%) 96 98 96 98 M: Western and Central (96); L: UB (99)
Blood sample (country avg: 97%) 94 99 93 98 M: Western (99); L: Eastern and UB (99)
Urine sample taken at ANC, % (country level 97%)
93 99 92 98 M: Western (89); L: Eastern and UB (99)
STI screening (94%) 87 98 85 98 M: Western (79); L: UB (99)
Intrapartum
Birth attended by any skilled attendant (country level: 99%)
98 99 98 99 All 99 except for Western with 98%
Institutional delivery (99%) 98 99 97 99 Central, Eastern and UB 99; Western and Khangai (98)
Caesarean section (country level: 21%) 17 23 16 31 M: Western (16); L: Ulaanbaatar (25)
Postpartum
No postnatal check-up - - - -
Birth registration (country avg: 99%) 99 99 99 99 All 99 except for East with 100
% of children aged 0–5 months who are exclusively breastfed (country %: 59%)
65 55 64 52 M: UB (53); L: Western (72)
EQuITy fOCuS: Indicators by residence, wealth quintiles and provinces
Maternal and Newborn Health Country Profiles: Mongolia6
Indicator
Residence QuintilesMost and least affected provincesRural urban Poorest wealthiest
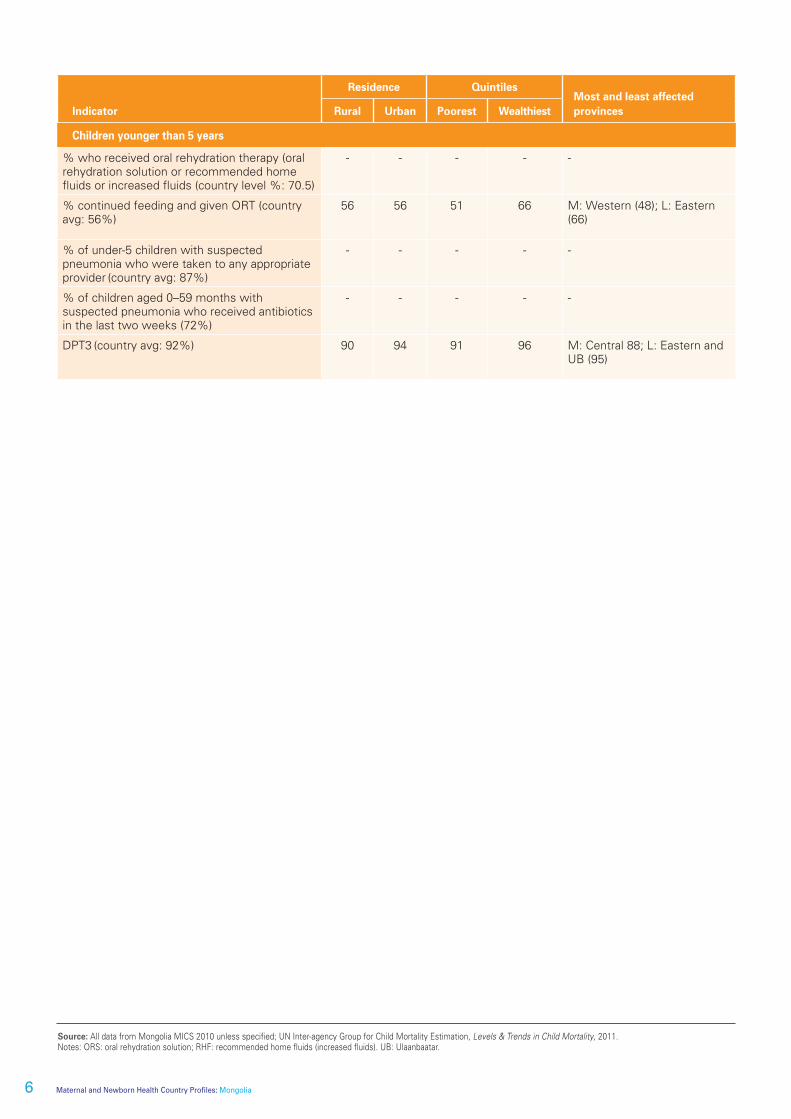
Children younger than 5 years
% who received oral rehydration therapy (oral rehydration solution or recommended home fluids or increased fluids (country level %: 70.5)
- - - - -
% continued feeding and given ORT (country avg: 56%)
56 56 51 66 M: Western (48); L: Eastern (66)
% of under-5 children with suspected pneumonia who were taken to any appropriate provider (country avg: 87%)
- - - - -
% of children aged 0–59 months with suspected pneumonia who received antibiotics in the last two weeks (72%)
- - - - -
DPT3 (country avg: 92%) 90 94 91 96 M: Central 88; L: Eastern and UB (95)
Source: All data from Mongolia MICS 2010 unless specified; UN Inter-agency Group for Child Mortality Estimation, Levels & Trends in Child Mortality, 2011. Notes: ORS: oral rehydration solution; RHF: recommended home fluids (increased fluids). UB: Ulaanbaatar.

Maternal and Newborn Health Country Profiles: Mongolia 7
Sp
otlig
ht o
n u
NIC
Ef w
ork
Evidence leads to greater investment in child survival
backgroundMongolia is on track towards achieving Millennium Development Goal 4 on a national basis. At the subnational level, a different story is unfolding in 10 of the 21 regions. These 10 provinces are lagging behind the targeted goals and thus many children continue to die each year due to insufficient and inefficient health services. The disparity is widening with the rapid social and economic transformations, creating adverse effects on health among the poor.
To burrow under the national good news, the Ministry of Health and UNICEF collaborated to conduct evidence-based planning and budgeting exercises for achieving health-related MDG targets in all provinces. They relied on the systematic use of demographic and epidemiological health systems and economics data to generate evidence of the ‘bottlenecks’ or blocks in the system. They also generated computerized scenarios for the impact of different budgets and calculated what additional funding was needed and, most critically, where it could prudently be used to achieve the targets, or rather, to return the ‘best buy’ for Mongolia’s available finances.
In culling the subnational data from a variety of sources, the health authorities discovered that despite the Government’s increase in health investments (from US$18 per capita in 2000 to US$60 in 2010), the investments were heavily skewed towards the secondary and tertiary levels of hospital care – benefitting the better off strata of society that can afford hospital care – rather than focusing on preventive primary health care in communities. According to Asian Development Bank research (2010), 24 per cent of total health care expenditure was spent on primary health care, while 53 per cent was spent on secondary and tertiary care, with 23 per cent on administrative costs.
The analysis of the evidence revealed that the investment allocation was not equally distributed nor based on need: the low-performing provinces received small amounts of funding for maternal, newborn and child health services. The insufficient investment in primary care also resulted in limited access to health care services, causing patients to seek health services at the late stage and increasing the number of complications and thus the cost of care.
From that detailed analysis of bottlenecks, two scenarios were suggested for accelerating equitable progress towards reaching health-related MDG targets (see the details in the table). The first, a core package of strategies, had the potential to reduce under-5 mortality by almost 30 per cent and neonatal mortality by 38 per cent. The second, a comprehensive set of strategies, could reduce under-5 mortality by 35 per cent and neonatal mortality by 51 per cent by 2015. Similarly, maternal mortality could decrease by 27 per cent with the core package and by 35 per cent with the comprehensive package. Stunting would be reduced by around 9 per cent with the core approach and by 10 per cent with the comprehensive package. The core package would require an additional investment of US$9 per capita and the comprehensive package would require an additional US$16 per capita, on an annual basis till 2015.
The evidence-based advocacy proved page-turning. The Government reprioritized its budget allocations for primary health care. In early 2013, the Prime Minister agreed to finance the core package of low-cost high-impact interventions.
Scenarios/ packages Strategies modelled
Scenario 1:Core package
Main focus on preventive services:yyRecruit and train community health workers yyProvide incentives and mobility allowanceyyStrengthen communication strategiesyy Free basic treatment at the point of serviceyyMonitoring and supportive supervision
Scenario 2:Comprehensive package
Main focus on strengthening hospital care in addition to the core package:yyRedistribution of doctors and nursesyyProvide refresher trainingsyy Incentives and hardship allowance for remote and rural locationsyyMonitoring and supervisionyyProcurement of essential medicines and equipment for all levels of hospital care
@U
NICEF/N
YHQ
2012-1735/Sokol