materials risk analysis · materials risk analysis thomas e. baker, p.e. state materials engineer...
TRANSCRIPT

February 2010Thomas E. BakerRobert James MolohonRuth White McIntyre
WA-RD 745.1
Office of Research & Library Services
WSDOT Research Report
Materials Risk Analysis


Materials Risk Analysis
Thomas E. Baker, P.E.
State Materials Engineer
Washington State Department of Transportation
Environmental and Engineering Program
State Materials Laboratory
PO Box 47365
Olympia WA 98504-7365
360-709-5401
Robert James Molohon
Washington State Department of Transportation
Environmental and Engineering Program
State Materials Laboratory
360-709-5441
Ruth White McIntyre
Washington State Department of Transportation
Highways and Local Programs
Standards and Procedures Engineer
360-705-7383

2
1. REPORT NO. 2. GOVERNMENT ACCESSION NO. 3. RECIPIENT'S CATALOG NO.
WA-RD 745.1
4. TITLE AND SUBTITLE 5. REPORT DATE
Materials Risk Analysis February 2010
6. PERFORMING ORGANIZATION CODE
7. AUTHOR(S) 8. PERFORMING ORGANIZATION REPORT NO.
Thomas E. Baker, Robert James Molohon, Ruth White McIntyre
9. PERFORMING ORGANIZATION NAME AND ADDRESS 10. WORK UNIT NO.
Washington State Department of Transportation
Materials Laboratory
PO Box 47365
Olympia, WA 98504-7365
11. CONTRACT OR GRANT NO.
12. SPONSORING AGENCY NAME AND ADDRESS 13. TYPE OF REPORT AND PERIOD COVERED
Washington State Department of Transportation
Research Office
PO Box 47372
Final Report
Olympia, Washington 98504-7372 14. SPONSORING AGENCY CODE
15. SUPPLEMENTARY NOTES
16. ABSTRACT
State highway authorities routinely examine the quality of the materials used to build highway construction projects. Some
materials are tested, some are accepted through a manufacturer’s certification of quality or compliance, some are physically
inspected during fabrication and yet other materials are accepted through visual inspection. Unanswered is why some
materials are more closely examined through physical testing and other materials receive much less scrutiny.
This paper describes a materials risk analysis process and the conclusions from that risk analysis conducted at the
Washington State Department of Transportation (WSDOT). Typical construction materials are examined for two critical
risks: the risk of having a material fail to meet specification and the consequences of that material failing to meet
specification. Subject matter experts (materials, construction, structures, maintenance, traffic, etc.) within the WSDOT rated
these risks through a Delphi process. Results of the risk analysis classify materials into four appropriate categories for either
more or less intensive examination by the state highway authority: highest risk materials undergo physical acceptance
testing or are inspected during fabrication under a manufacturer’s quality system plan; moderate risk materials are accepted
through the manufacturer’s certification of compliance (often combined with a quality systems plan or visual inspection);
lower risk materials are accepted with a manufacturer’s certification or with a catalog cut; and the lowest risk materials are
accepted through visual inspection in the field. Future materials risk analyses may be performed on periodic intervals (five
to ten years suggested) to re-examine the risks and rankings by subject matter experts.
17. KEY WORDS 18. DISTRIBUTION STATEMENT
Transportation materials, risk analysis No restrictions. This document is available to the
public through the National Technical Information
Service, Springfield, VA 22616
19. SECURITY CLASSIF. (of this report) 20. SECURITY CLASSIF. (of this page) 21. NO. OF PAGES 22. PRICE
None None

3
DISCLAIMER The contents of this report reflect the views of the authors, who are responsible for the facts and the
accuracy of the data presented herein. The contents do not necessarily reflect the official views or
policies of the Washington State Transportation Department of Transportation or the Federal
Highway Administration. This report does not constitute a standard, specification, or regulation.

4
TABLE OF CONTENTS
Abstract……………………………………………………………………………………….. 5
Introduction…………………………………………………………………………………… 6
Risk…………………………………………………………………………………………… 6
Rating Risk Levels……………………………………………………………………………. 7
Categories for Materials Acceptance…………………………………………………………. 9
Working Toward Consensus………………………………………………………………….. 10
Final Review………………………………………………………………………………….. 12
Conclusions…………………………………………………………………………………… 15
Recommendations…………………………………………………………………………….. 15
References…………………………………………………………………………………….. 16

5
ABSTRACT State highway authorities routinely examine the quality of the materials used to build highway
construction projects. Some materials are tested, some are accepted through a manufacturer’s
certification of quality or compliance, some are physically inspected during fabrication and yet
other materials are accepted through visual inspection. Unanswered is why some materials are
more closely examined through physical testing and other materials receive much less scrutiny.
This paper describes a materials risk analysis process and the conclusions from that risk
analysis conducted at the Washington State Department of Transportation (WSDOT). Typical
construction materials are examined for two critical risks: the risk of having a material fail to meet
specification and the consequences of that material failing to meet specification. Subject matter
experts (materials, construction, structures, maintenance, traffic, etc.) within the WSDOT rated
these risks through a Delphi process. Results of the risk analysis classify materials into four
appropriate categories for either more or less intensive examination by the state highway authority:
highest risk materials undergo physical acceptance testing or are inspected during fabrication under
a manufacturer’s quality system plan; moderate risk materials are accepted through the
manufacturer’s certification of compliance (often combined with a quality systems plan or visual
inspection); lower risk materials are accepted with a manufacturer’s certification or with a catalog
cut; and the lowest risk materials are accepted through visual inspection in the field. Future
materials risk analyses may be performed on periodic intervals (five to ten years suggested) to re-
examine the risks and rankings by subject matter experts.

6
INTRODUCTION
State departments of transportation (DOTs) accept many different materials in many different ways.
Some materials are rigorously tested while others are accepted based on visual inspection. Some
materials require inspection during fabrication but others can be accepted based upon a
manufacturer’s certification of compliance. Why do DOTs rigorously test some materials but not
others? Why might we accept reinforcing steel based on a certification from the steel mill but
require structural concrete to be physically tested for slump, air entrainment, temperature, and
compressive strength?
In asking this question at the Washington State Department of Transportation (WSDOT) it
became clear that there was no recorded history or methodology about why we evaluated the quality
of some materials more closely than others. Clearly there was background logic in the testing that
took place, with a heavy emphasis on the prime components of both pavements and structures, two
of our most valuable assets. The recording of this logic into a system that preserved the reasons for
categorizing materials for testing did not exist in any formal fashion. To examine the subject more
closely we needed to ask why our current system had varying levels of examining construction
materials and then to ask what type of system should we have to determine the level of testing
necessary to ensure highest quality on our construction projects at the least cost.
RISK
When accepting materials there are a variety of risks but two important ones stand out: the risk of
the material failing to meet the specification and the consequences if the material fails to meet this
specification. Assuming that most specifications relate to the real world performance needs of the
material, these two risks become the focal point for accepting a material. Materials can have high
risks in both of these categories, mixed risk (high in one category and low in another) or low risk in
both categories. In a logical system, materials that rate for high risk in both categories (high risk of
failing to meet specification and high risk of consequences if they do fail) should have the highest
level of scrutiny by WSDOT. Materials with mixed risks may or may not need the highest level of
assurance, depending on the risks in the individual categories. A material such as prestressed
girders may not fail very often, but failure would usually be catastrophic; on the other hand, bark
mulch might often fail to meet its specification for gradation, but the consequences of such a
specification failure are small.
This review was based upon these two risk factors. Every common construction material
would be rated and their total risk factor would preliminarily determine where the material should
fall on the materials assurance continuum. The highest level of materials assurance involves
directly sampling and testing the material, especially when performed using a statistical level of
analysis. The lowest level of acceptance would be visual inspection in the field; whereby the field
inspector visually checks and accepts the material. In between fall such efforts as fabrication
inspection, quality systems plans with annual reviews, certification of compliance by the
manufacturer, materials documentation for commercially manufactured materials used in many
industries (usually through catalog cuts) or limited testing or inspection. Table 1 displays the
ranking of these acceptance methods, from most intense with the highest level of assurance to the
lowest level.

7
FIGURE A, Acceptance Rating Matrix
1.0
2.0
3.0
4.0
5.0
1.0 2.0 3.0 4.0 5.0
Chance of Failure
Co
nse
qu
ence
of
Fa
ilu
re
State Acceptance Testing
and/or Mfr Quality System Plan
State Acceptance Testing
and/or Mfr Quality System PlanState Acceptance Testing
and/or Mfr Quality System Plan
State Acceptance Testing
and/or Mfr Quality System Plan
State Acceptance Testing
and/or Mfr Quality System Plan
Cert with Quality System Plan and/or
Visual Inspection
Cert with Quality System Plan and/or
Visual Inspection
Certification/Cat Cut or
Visual Inspection
Certification/Cat Cut or
Visual Inspection Cert with Quality System Plan
and/or Visual Inspection
Cert with Quality System Plan and/or
Visual Inspection
Certification/Cat Cut
or Visual Inspection
Certification/Cat Cut or
Visual Inspection
Visual
Inspection
Visual
Inspection
State Acceptance Testing
and/or Mfr Quality System Plan
HIGHEST (Level 1)
MEDIUM (Level 2)
MEDIUM (Level 2)MEDIUM LOW (Level 3)
MEDIUM LOW (Level 3)LOWEST (Level 4)
State Acceptance Testing = DOT testing & Inspection and/or Fab insp with Mfr QSP
FIGURE 1: Materials Acceptance Rating Matrix, depicting different levels of risk and different
acceptance criteria.
RATING RISK LEVELS
Given that we now had a system upon which to evaluate materials for their risk of failing to meet
specification and the consequences of their failure, how would the risks be evaluated for each
material? Ideally management systems that track both performance and life cycle costs would
provide the risk analysis, allowing evaluation of both the cost and the performance of a material to
the two risk categories. Unfortunately such data is lacking. Management systems with sufficient
data collection and analysis to determine life cycle performance are expensive to create and even
more expensive to operate and populate. Management systems are in place for WSDOT’s two
largest assets, bridges and pavements, but not for other construction materials. The excellent
Washington State Pavement Management System has a budget of $500,000.00 a year to measure,
track, evaluate and report on changing pavement conditions. For materials of lesser value, life
cycle cost performance and intensive database management systems are neither practical nor
affordable.
Within each department of transportation there does exist a body of knowledge on materials
performance and materials risks: it exists in the minds of the employees within the department,
particularly within the knowledge of subject matter experts. The Delphi method was used to tap
this expertise.
The Delphi method, developed at the Rand Corporation, was selected as a practical means to
evaluate the risk criteria for materials acceptance. Harold Sackman, in Delphi Critique. notes that:

8
“Delphi is an attempt to elicit expert opinion in a systematic manner for useful results. It
usually involves interactive questionnaires administered to individual experts in a manner
protecting the anonymity of their responses. Feedback of results accompanies each iteration
of the questionnaire, which continues until convergence of opinion, or a point of
diminishing returns is reached.”1
Delphi surveys rely on three main elements: structuring the flow of information, regular feedback
and anonymity of participant. We selected a group of knowledgeable people, familiar with the
subject matter, to provide their input. Together, this process would drive toward consensus on
material risks, allow them to categorize these materials in a risk matrix and ultimately place each
material in an acceptance category.
We wanted to draw a cross section that included WSDOT employees familiar in theoretical design
and field performance, generalists and specialists. WSDOT employees familiar with the highway
construction materials were selected (See Table 1). We included specialists in electrical
engineering, structural design, hydraulics, pavement design, etc. and generalists, including field
engineers, project inspector and project engineers.
There are criticisms of the Delphi method. One surrounds the formation and potential bias of the
survey questions. Linked to this criticism is that the complex future events usually dealt with
through Delphi surveys are not clear and are not unambiguous. This survey reduced or eliminated
these issues by repeatedly asking only two questions: what is the risk of failure and what is the
consequence of that risk. Another criticism is that the system eliminates the adversarial process. By
conducting individual interviews after completion of the Delphi surveys mitigated this argument:
anyone with strong opinions could voice them and demand change at this step of the process.

9
TABLE 1 WSDOT Subject Matter Disciplines General Group – Reviewing All Materials
HQ Materials Regional Materials Regional Construction FHWA HQ Construction HQ Maintenance Region Maintenance Project Engineers Construction Engineers Local Programs Pavements Group (Hot Mix Asphalt and Portland Cement Concrete Pavements) Pavement Design
Engineer Assistant Bituminous
Materials Engineer State Pavements
Engineer Chemical Materials
Engineer Bituminous Materials
Engineer Structural Materials
Testing Engineer Assistant Construction
Engineer, Roadway Liquid Asphalt
Laboratory Supervisor Hydraulics HQ Hydraulics Region Liaison
Landscape Architect Fabrication and Coating
Engineer HQ Materials
Geotechnical State Geotechnical
Engineer
Structural Materials
Testing Engineer Construction Engineer,
Bridge Bridge and Structures
Engineer HQ Materials Landscape and Environmental Roadside Design
Manager
Water Quality Specialist Chemical Materials
Engineer Region Landscape
Architect EMS Project Lead Water Quality Team
Leader Structural Materials
Testing Engr Asst. Const. Engr,
Administration Electrical
Electrical Materials
Engineer
Asst. Const. Mats.
Engr., Structural
Traffic Signal
Operations Engineer
Bridge Special
Provisions Engineer
Maintenance Operations
Supt., Signals
Traffic Engineer Region Electrical
Engineer
Chemical
Chemical Mats.
Engineer
Maintenance Asst. Const. Mats.
Engr., Structural
Construction Engineer,
Bridge
Bridge Mgmt Engineer Region Maintenance
Traffic
Electrical Materials
Engineer
Region Traffic Chemical Materials
Engineer
Traffic Control Engineer
Region Documentation HQ Traffic Safety Policy Specialist Traffic Materials
Engineer
Asst. Const. Mats.
Engr., Structural
Structures and Architectural
HQ Materials HQ Construction Chemical Materials
Engineer
Bridge Special
Provisions Engr
Bridge Project Engineer State Geotechnical
Engineer
Bridge and Structures
Engineer
Structural Materials
Testing Engineer
CATAGORIES FOR MATERIALS ACCEPTANCE
We established four levels of materials examination to determine the quality of any given material,
from the most intensive level of scrutiny to the least:
Level 1: Highest level - WSDOT acceptance testing, or a combination of fabrication
inspection coupled with a requirement for a manufacturer’s quality system plan

10
Level 2: Second highest level - Requires a manufacturer’s certification of
compliance with a quality systems plan
Level 3: Intermediate level – Either a manufacturer’s certification of compliance or
a catalog cut stating the qualities of the material being used
Level 4: Lowest level - visual inspection in the field
WORKING TOWARD CONSENSUS
Round one of the survey resulted in areas of clear consensus and areas lacking in consensus. Areas
of apparent consensus were quickly eliminated from the second round of the survey. (See Table 2)
Consensus was selected at a standard deviation equal to or less than 0.85 for both risk categories.
TABLE 2 First Delphi Iteration – Materials Reaching Risk Consensus Structures and Architectural
Risk of Failure to Meet
Specification
Consequences of Failure to
Meet Specification
Material Avg. Std. Dev. Avg. Std. Dev.
Ground Rubber for Deck Repair 1.91 0.831 2.64 0.809
Phase 2 – Structures and Architectural
Structural Metal Items for Building 2.06 0.556 3.76 0.831
Epoxy Resin Binder 2.53 0.612 3.74 0.653
Adhesive Resin for Reinforcing Steel 2.30 0.470 3.80 0.696
2 Part Rubber Joint Sealant 20.6 0.680 2.50 0.730
High Strength Bar for Soil Nails 1.67 0.594 4.28 0.826
Chemical
Clear Sealers 2.00 0.816 1.92 0.760
Galvanized Conduit 2.24 0.831 2.35 0.606
PVC Conduit 1.67 0.617 2.18 0.728
Electrical
Flexible Bends for Conduit 1.59 0.618 2.22 0.732
Innerduct and Outerduct 1.55 0.522 2.18 0.751
Bends for PVC and Steel Conduits with
Innerducts 1.69 0.480 2.23 0.599
Sign Lights Disconnect Switch 1.56 0.629 2.38 0.719
ITS Battery Backup System 1.75 0.452 3.00 0.853
Type 2 Base for Steel Post 1.71 0.469 2.50 0.760
Traffic
Type 1 Base for Sign 1.88 0.719 2.60 0.828
Environmental & Landscape
Catch Basin and Exert 1.77 0.725 2.23 0.832
Straw Wattles 1.38 0.500 1.88 0.619
Quick Coupling Equipment 1.53 0.640 1.87 0.834
Above Ground Rotary Sprinklers 1.38 0.500 2.00 0.816
Hydraulics
Irrigation Pipe and Fittings 1.58 0.692 2.25 0.851
Pavements
Mineral Aggregate for HMA 3.12 0.766 3.96 0.706
Shoulder Ballast 2.87 0.626 2.14 0.834
A typical result for a material which we considered to have reached consensus is shown in Figure 2,
which depicts first round ratings for PVC and metal conduit bends. Figure 3 provides an example
of a material that did not reach consensus in the first Delphi round of results, this time for

11
temporary silt fence. After the first round we had 23 materials in consensus and 204 materials still
needing consensus.
Round 2 of the Delphi process returned the initial survey to the subject matter experts, less
the materials reaching consensus in Round 1. The subject matter experts also received the ratings
from the first round and all of the comments from their peers. Ratings and rating comments were
shared anonymously. Round 2 resulted in 146 more materials reaching consensus, leaving 80
materials without a consensus on their risk ratings.
Example of 1st Iteration Consensus, Standard Deviation < 0.85
Material: Bends for PVC & Steel Conduit
1, 1
2, 21, 2
1, 3
2, 22, 22, 2
1, 3 2, 3
2, 22, 2
2, 3
2, 2
1.0
2.0
3.0
4.0
5.0
1.0 2.0 3.0 4.0 5.0
Chance of Failure
Co
nse
qu
ence
of
Fa
ilu
re
1 Rating
7 Ratings1Rating
2 Ratings 2 Ratings
FIGURE 2 Example of Round 1 material reaching consensus. Materials were considered to have
reached consensus if the standard deviations equal to or less than 0.85. This figure depicts the risk
ratings for Bends for PVC and Steel Conduit.

12
Example of 1st Iteration Non-Consensus, Standard Deviation > 0.85
Material: Temporary Silt Fence
3, 13, 1 5, 1
1, 2
4, 4
3, 3
2, 2
1, 3
1, 2
4, 4
1, 1
2, 3
1, 5
2, 3
1, 1
4, 22, 2 3, 22, 2
1.0
2.0
3.0
4.0
5.0
1.0 2.0 3.0 4.0 5.0
Chance of Failure
Co
nse
qu
ence
of
Fa
ilu
re
2 Ratings 1 Rating
2 Ratings
2 Ratings
1 Rating
3 Ratings
1 Rating
2 Ratings
2 Ratings
1 Rating
1 Rating1 Rating
FIGURE 3 Example of Round 1 material that failed to reach consensus. Materials were
considered to have failed to reach consensus if the standard deviations were greater than 0.85. This
figure depicts the risk ratings for temporary silt fence.
FINAL REVIEW
After completion of the two rounds of surveys, we brought back together the WSDOT subject
matter specialists for each material category, as well as selected generalists, to review the results.
This was an informal, "gut check," review, to build final consensus and to ensure that as we
implemented results we would have buy-in of the participants. The results of this final round of
review are shown in Figure 4. Materials requiring the highest level of acceptance, level 1,
decreased from 98 to 88. Materials in the second level of acceptance also decreased, from 21 to 8.
There were corresponding increases in the two lower levels of acceptance, with level 3 showing an
increase from 78 to 80 materials and level 4 showing an increase from 25 to 39 materials. Based
upon the two materials risks, we found that many materials would be served with less intensive
materials acceptance (acceptance levels 3 and 4).

13
Materials Risk Assessment
Disciplines: Pavement, Environmental, Landscape, Hydraulic, Electrical, Geotechnical, Traffic,
Chemical, Architectural, and Structures
0
20
40
60
80
100
120
Level 1 Level 2 Level 3 Level 4
Levels of Acceptance
No
. M
ate
ria
ls
Before Risk Assessment After Risk Assessment
98
88
21
8
7880
25
39
State Acceptance Testing
and/or Manufacturer's
Quality System Plan
Manufacturer Certification
and /or
Visual Acceptance
Certification
or
Visual Inspection
Visual
Inspection
FIGURE 4 Results of the materials risk analysis, showing numbers of materials by acceptance
category, both before and after the risk assessment. The number of materials in the two highest
acceptance levels (associated with physical testing, fabrication inspection and quality systems plans
– acceptance levels 1 and 2) decreased, while lower risk materials accepted through lower
acceptance methods (manufacturer’s certification of compliance or visual inspection – acceptance
levels 3 and 4) increased.
Two sets of materials that had been treated as a series of individual components were combined into
systems and are now being accepted in the whole: rock protection fencing and beam guardrail
elements. Rock protection fencing is evaluated as a system and we are in the process of
implementing an “Approved Guardrail Installer program” for beam guardrail.
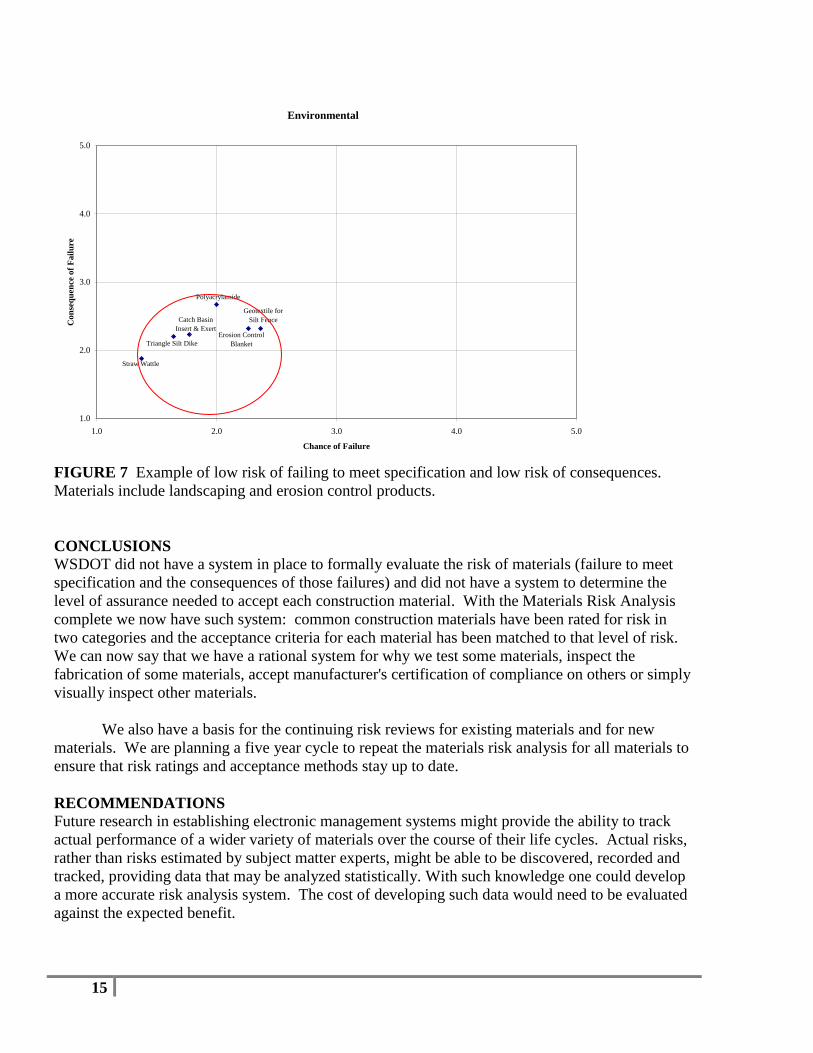
The final consensus ratings showed interesting results. None of the materials exhibited high
risk ratings in both materials simultaneously. While some materials showed a high risk of
consequences if they failed to meet specification (see Figure 5), few materials ever rose to even the
moderate risk level for failing to meet specification. Upon review, this corresponds with common
experience in DOTs acceptance of construction materials: materials failures are the exception, not
the norm. Most producers and manufacturers take care in producing materials that will meet
specification and very few materials regularly fail to meet specification. Other examples of typical
risk ratings are shown in Figures 6 and 7.

14
Phase II Structures & Architectural
1.0
2.0
3.0
4.0
5.0
1.0 2.0 3.0 4.0 5.0
Chance of Failure
Co
nse
qu
ence
of
Fa
ilu
re
High Strength Bar for
Soil Nails Tie Strips for Structural
Earth Walls
Epoxy Resin Binder
Encapsulation Conduit for
Soil Nails
Plates for Soil Nails
FIGURE 5 Example of a high consequence of failure to meet specification, with low risk of
failing to meet specification.
Electrical
1.0
2.0
3.0
4.0
5.0
1.0 2.0 3.0 4.0 5.0
Chance of Failure
Co
nse
qu
ence
of
Fa
ilu
re
Signal Controller Cabinets
with Components
FIGURE 6 Example of a moderate risk of failing to meet specification and moderate risk of
consequences
15
Environmental
1.0
2.0
3.0
4.0
5.0
1.0 2.0 3.0 4.0 5.0
Chance of Failure
Co
nse
qu
ence
of
Fa
ilu
re
Polyacrylamide
Geotextile for
Silt Fence
Erosion Control
Blanket
Catch Basin
Insert & Exert
Triangle Silt Dike
Straw Wattle
FIGURE 7 Example of low risk of failing to meet specification and low risk of consequences.
Materials include landscaping and erosion control products.
CONCLUSIONS
WSDOT did not have a system in place to formally evaluate the risk of materials (failure to meet
specification and the consequences of those failures) and did not have a system to determine the
level of assurance needed to accept each construction material. With the Materials Risk Analysis
complete we now have such system: common construction materials have been rated for risk in
two categories and the acceptance criteria for each material has been matched to that level of risk.
We can now say that we have a rational system for why we test some materials, inspect the
fabrication of some materials, accept manufacturer's certification of compliance on others or simply
visually inspect other materials.
We also have a basis for the continuing risk reviews for existing materials and for new
materials. We are planning a five year cycle to repeat the materials risk analysis for all materials to
ensure that risk ratings and acceptance methods stay up to date.
RECOMMENDATIONS
Future research in establishing electronic management systems might provide the ability to track
actual performance of a wider variety of materials over the course of their life cycles. Actual risks,
rather than risks estimated by subject matter experts, might be able to be discovered, recorded and
tracked, providing data that may be analyzed statistically. With such knowledge one could develop
a more accurate risk analysis system. The cost of developing such data would need to be evaluated
against the expected benefit.

16
REFERENCES
1 Sackman, Harold. Delphi Critique © 1975. Pg xi. LCCCN 74-14858