materials and methds 3.1 materials 3.1.1 chemicals and...
TRANSCRIPT
Page | 33
Materials and Methds
3.1 Materials
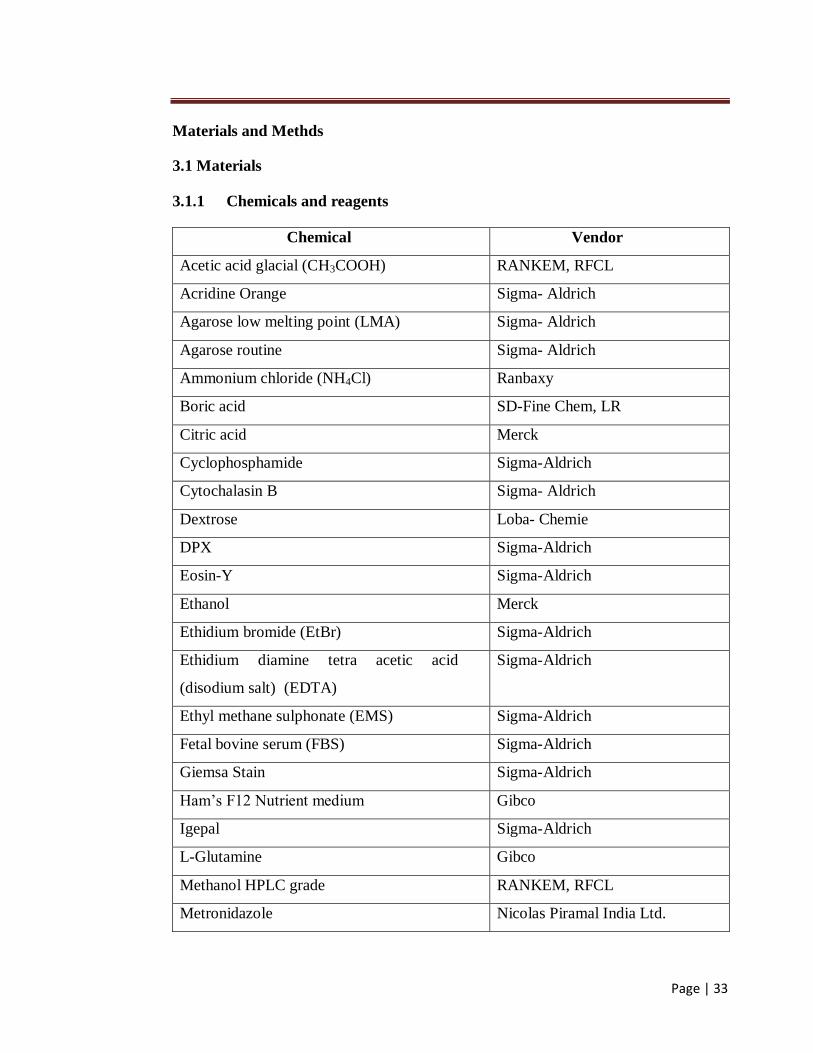
3.1.1 Chemicals and reagents
Chemical Vendor
Acetic acid glacial (CH3COOH) RANKEM, RFCL
Acridine Orange Sigma- Aldrich
Agarose low melting point (LMA) Sigma- Aldrich
Agarose routine Sigma- Aldrich
Ammonium chloride (NH4Cl) Ranbaxy
Boric acid SD-Fine Chem, LR
Citric acid Merck
Cyclophosphamide Sigma-Aldrich
Cytochalasin B Sigma- Aldrich
Dextrose Loba- Chemie
DPX Sigma-Aldrich
Eosin-Y Sigma-Aldrich
Ethanol Merck
Ethidium bromide (EtBr) Sigma-Aldrich
Ethidium diamine tetra acetic acid
(disodium salt) (EDTA)
Sigma-Aldrich
Ethyl methane sulphonate (EMS) Sigma-Aldrich
Fetal bovine serum (FBS) Sigma-Aldrich
Giemsa Stain Sigma-Aldrich
Ham‟s F12 Nutrient medium Gibco
Igepal Sigma-Aldrich
L-Glutamine Gibco
Methanol HPLC grade RANKEM, RFCL
Metronidazole Nicolas Piramal India Ltd.

Page | 34
Phosphate buffer saline (PBS) Sigma- Aldrich
Potassium bicarbonate (KHCO3) Sigma- Aldrich
Potassium chloride (KCl) Sigma- Aldrich
Potassium hydroxide (KOH) Sigma- Aldrich
Propidium Iodide (PI) Sigma- Aldrich
RNase from bovine pancrease Sigma- Aldrich
Sodium bicarbonate Gibco
Sodium chloride (NaCl) Sigma- Aldrich
Sodium citrate (RM1415) HiMedia
Sodium hydroxide (NaOH) Sigma- Aldrich
Sucrose (194957) SRL
Sulfuric acid (H2SO4) RANKEM, RFCL
Trizma base Sigma- Aldrich
Trypsin-EDTA Gibco
Tween 20 Sigma- Aldrich
Xylene Rankem- RFCL
Antibody markers
Fluorescent marker Vendor
CD71-FITC-antimouse transferine receptor B D Biosciences
CD61-PEantimouse B D Biosciences
Rabbit anti-mouse IgG HRP conjugate Sigma- Aldrich
3.1.2 Equipments
Equipment Vendor
Biochemical Analyzer (Semiautomatic) Erba, Menheim, Germany
Centrifuge (Bench top; 3K-30) Sigma
CO2 incubator Binder

Page | 35
Cytospin Thermo Shandon, UK
Deep Freezer Thermo
Digital Camera (DS-Fi1) Nikon, Japan
Electrophoresis horizontal submarine system Bio Rad
ELISA reader Thermo electron corporation
Flow cytometer (BD Facs ARIA) BD, Biosciences, California
Flow cytometer (BD Facs CANTO) BD, Biosciences, California
Fluorescent inverted microscope IX-41 Olympus, Japan
Hematology Analyzer Humacount
Leminar flow (Bio safety hood) Esco
Light Microscope (E-200) Nikon, Japan
Magnetic stirrer cum hot plate, RET Ika, Werke-Gmbh, Germany
pH meter, Thermo orion-420 A+ Thermo Orion, USA
Vacuum dryer Thermo Electron,
Weighing balance, ME215P Sartorius AG Gottingen, Germany
3.1.3 Preparations of working solutions
(a) Formaline (10%)
Formaldehyde 10mL
In 90 ml of saline solution.
(b) Phosphate buffered saline (PBS) (1000 mL)
NaCl 7.20 gm
Na2HPO4 1.48 gm
KH2PO4 0.43 gm
Prepared in d.w.
(c) Hypotonic solution (100 mL)
KCl 0.075 M
Prepared in d.w.

Page | 36
(d) Normal saline (1000 mL)
NaCl (0.91%; w/v) 9 gm
Prepared in d.W.
(e) Carnoy’s fixative solution (4 mL)
MeOH 3 mL
CH3COOH 1 mL
Prepared fresh
(f) Alsever’s solution (100 mL)
Dextrose 2.05 gm
Sodium citrate 0.80 gm
Sodium chloride 0.42 gm
Prepared in d.w.
(g) RBC lysis buffer (100 mL)
Ammonium chloride 830 mg
Potassium bicarbonate 100 mg
EDTA 4 mg
Prepared in d.w.
(h) Giemsa staining solution (100 mL)
Giemsa stain 10 mL
Prepared in d.w.
(i) Eosin-Y staining solution (100 mL)
Eosin-Y 100 mg
Prepared in d.w.
(j) Buffer’s for COMET assay
Lysis buffer (500 mL)

Page | 37
NaCl (2.5 M) 73.05 gm
Disodium EDTA (100 mM) 18.6 gm
Trizma base (10 mM) 0.6 gm
NaOH 4 gm
pH adjusted to 10 using NaOH or HCl
Electrophoresis buffer (500 mL)
Tizma base 5.44 gm
Boric acid 2.76 gm
Disodium EDTA 0.46 gm
pH 8.3-8.4
EtBr Staining Solution (10X stock; 20 µg/mL) (50 mL)
EtBr 10 mg
Prepared in dH2O.
(k) Buffer’s for in vitro micronuclei
Positive control (EMS 10 mL)
EMS 3 mM/ 6 mM
Prepared in dH2O
Ham’s F12 culture medium (complete) (1000 mL)
L-glutamine 300 mg
sodium bicarbonate 2 g
antibiotic/antibiotic solution 10 mL
supplemented with 10% heat-inactivated FBS
Trypsin Solution
Trypsin 0.25%
EDTA 0.02%
Prepared in PBS

Page | 38
Staining solution-I
Sodium Chloride 292 mg/ 100 mL
Sodium citrate 500 mg/ 100 mL
RNAse 5 mg/ 100 mL
EtBr 6.25 mg/ 50mL
Igepal 150 µl/ 100mL
Above individual stock solutions were prepared in d.w. and 3 mL of each were
mixed at the time of use to prepare 15 mL of staining solution-I.
Staining solution-II
Citric Acid 7.5 gm/ 100 mL
Sucrose 4.275 gm/ 100 mL
EtBr 10 mg/ 50 mL
Above individual stock solutions were prepared in d.w. and 3 mL of each were
mixed with d.w. (6 mL) at the time of use to prepare 15 mL of staining solution-II.
(l) Buffer’s for in vivo micronuclei
Staining solution (100 mL)
Acridine Orange 10 mg
Glacial Acetic Acid 1% v/v
Prepared in d.w.
Washing solution (100 mL)
Glacial Acetic Acid 5% v/v
Prepared in alcohol (abs.)
3.1.4 Animals
Male and female healthy Wistar rats (65–80 gm; ~ 6 weeks old) and adult
BALB/C mice (22-25 gm; 8–10 weeks old) were procured from the Institutional
animal house. They were quarantined for 2 weeks before use in regulated

Page | 39
environmental conditions (well-ventilated with > 10 air changes/h; 12-h light/dark
photoperiod; temperature 24±2ºC; relative humidity, 60 ± 10%), according to
Committee for the Purpose of Control and Supervision of Experiments on Animals
(CPCSEA) guidelines. The animals were randomized into groups keeping the weight
variation within ± 15% of the mean weight within each sex and were housed in
polycarbonate cages, fed with certified rodent pellet feed (Ashirwad Industries,
Chandigarh, India). Water was available ad libitum. The components of feed are
subjected to routine analysis at the quality control division of this institute and were
not found to vary to any noticeable extent during period of this study. All experimental
protocols were approved by Institutional Animal Ethics Committee and performed as
per the Guidelines for Animal Care as recommended by the Indian National Academy,
New Delhi (1992).
3.2 Methods
3.2.1 Preparation and chemical characterization of WSF
WSF, the bioactive fraction used in the present study was derived from
aqueous alcoholic (50%) extracts of roots and leaves of W. somnifera (AGB 002) and
the results pertaining to the chemical constituents are given in the appendix (Malik et
al., 2009). In brief finger printing of WSF formulation employing HPLC profile of
isolated chemical markers were carried out by two protocols. According to protocol-I,
HPLC was performed using acetonitrile: water gradient (with varying concentrations
of acetonitrile) and protocol-II involved isocratic resolution employing methanol: H2O
(60:40). Protocol-I resolved the mixture of eight markers where WS1 and WS2
appeared as a common single peak. In protocol-II, besides WS1 and WS2 both WSC
and WSD, in addition were resolved completely. The formulation contains almost
equal quantities of withanolide-A and withaferin-A (Malik et al., 2009).
Experimental methods
3.2.2 Preparation of WSF for oral dosing

Page | 40
WSF was solubilized in 1% gum acacia and administered orally by gavage
according to body weight. A vehicle (1% gum acacia in distilled water) was used as
control.
3.2.3 Preparation of reference compounds
Reference compounds Cyclophosphamide, EMS and metronidazole were
prepared by dissolving adequate quantity in distilled water to obtain derived
concentration. For solubilizing metronidazole 1% gum acacia was used.
3.2.4 Acute toxicity
Mice were grouped as per the following schedule.
Group WSF
(mg/kg, per oral)
Sighting study Main study
No of mice No of mice
I 5 1 -
II 50 1 -
III 300 1 -
IV 2000 1 5
V Vehicle 1 5
For sighting study, WSF was administered at fixed doses stepwise, as per the
OECD guide line (OECD, 2001). For the main study the highest dose i.e., 2000 mg
was given. Control group received vehicle only. The volume administered was 1 mL/
100 gm body weight.
Mice were kept in Perspex chambers and observed continuously for first two
hours, then half an hour interval for the next six hours for any change in the gross
general behavior and then daily for the next 14 days for mortality. During the
investigation period gross observations were made and body weight recorded. In
addition hematological parameters and biochemical parameters were determined in

Page | 41
blood collected by retro- orbital sinus puncture. Hematological parameters included
hemoglobin (Hb), red blood cells (RBC), white blood cells (WBC), lymphocytes
(Lym.), neutrophils (Neutr.) which were measured with the aid of an automated
hematology analyzer (Humacount; Human, Weisbaden, Germany). Clotting time (CT)
was measured by collecting approximately 25 µl blood in microhematocrit glass
capillary tube as described by Rubio-PÓO et al., (1998). Bleeding time (BT) was
measured by cutting the tail vein (tail vein bleeding time) as described by Broze
(2001). A transverse incision was made over a lateral tail vein at a position where the
diameter of tail is 2.25- 2.5 mm. the time from the incision to the cessation of bleeding
is recorded as BT. Biochemical parameters included blood glucose (Glu.), urea,
creatinine (CRTN), cholesterol (CHO), triglycerides (TG), uric acid (UA), total
proteins (TPR), bilirubin (BIL), aspartate aminotransferase (AST) and alanine
aminotransferase (ALT) which were evaluated using commercial kits procured from
Bayer Diagnostics (Baroda, India) with the aid of a clinical chemistry analyzer Chem-
7.
At the end of investigation aniomals were euthanized and subjected to
necropsy examination, recording of organ weights. Tissues were preserved in buffered
formaline saline for histopathology. A histopathological assessment of all the vital
organs was made by processing and staining of samples. Tissues about (2.5- 3.0 mm
thick) of the control and treated animals were paraffin embedded and 5 µ thickness
sections were prepared and processed according to standard procedure of Krajian
(1963). The prepared sections were stained with hematoxyline and eosin and slides
were observed by the vetenarian pathologist. Light microscopic examination of
multiple tissue sections was performed and representative images were taken with the
Nikon E200 microscope aided with the imaging software (NIS Element BR 3.0;
Japan).
3.2.5 Chronic toxicity
Experimental groups and treatment- Rats were grouped in different groups and
treated as per the following schedule.

Page | 42
Group No of rats Treatment (mg/kg, per oral)
I 10 Male
10 Female Vehicle
II 10 Male
10 Female WSF 250
III 10 Male
10 Female WSF 500
IV 10 Male
10 Female WSF 1000
V 10 Male
10 Female Cyclophosphamide (CP) 40
VI 10 Male
10 Female Metronidazole (MTZ; i.p.) 125
Test material WSF was administered once daily for a period of 12 months. One
highest dose (1000 mg/kg) for WSF treatment was selected as limit dose. Thereafter,
concurrent descending doses were selected to define any dose related response and no-
observed-adverse-effect level (NOAEL). CP and MTZ were administered once daily
of 7 days.
Observations
Following observations were made in group I, II, III and IV.
General clinical observations were made at least once a day usually at the
beginning and end of each day. All animals were checked for morbidity or mortality
and for specific toxicological effect. Detailed clinical observation made outside the
home cage, preferably in a standard arena and carefully recorded using scoring system.
Clinical signs of toxicological manifestation include change in skin, fur, eyes, mucous
membranes, occurrence of secretions and excretions, anatomic activities (lacrimation,
piloerection, pupil size, unusual respiratory pattern), change in gait, posture, and
response to handling as well as presence of clonic and tonic movements, stereotypes
(excessive grooming, repetitive circling) and bizarre behavior.
Food and Water Consumption
Food and water consumed in rats was measured daily and weekly consumption
was calculated for first 13 weeks and thereafter on monthly for 12 months.

Page | 43
Body Weight
Body weight was recorded once a week during the first 13 weeks and then after
4 weeks interval for 52 weeks.
Hematology
Hematological parameters were measured at the end of 3, 6 and 12 months
post-dosing. The parameters include RBC, WBC, Hb, Lym, Neutr., platelet (PLT),
haematocrit (HCT), mean carpuscular volume (MCV), mean carpuscular haemoglobin
(MCH), mean carpuscular haemoglobin concentration (MCHC) were measured with
the aid of an automated hematology analyzer (Humacount; Human, Weisbaden,
Germany). CT and BT were measured as described in section 3.2.4.
Serum biochemistry
Serum biochemistry was evaluated at the end of 3, 6 and 12 month post-
dosing. The parameters included Glu., Urea, CRTN, CHO, TG, UA, TPR, BIL, AST,
ALT, alkaline phosphatase (ALP), albumin (ALB), calcium (Ca), sodium (Na) and
potassium (K) were evaluated using commercial kits as described in section 3.2.4.
Urinalysis
Urinalysis was carried out at the end of 3, 6 and 12 months post-dosing.
Animals were kept in metabolic cages to collect urine sample. Urine examination was
done for volume, specific gravity, color, pH, protein, glucose and other determinants
include ketone, urobilinogen (Urobil), bilirubin (Bil) and occult blood using Multistix
10 SG (Bayer Diagnostics, Baroda, India). In addition of above parameters urinary
sediments, such as pus/epithelial cells, casts and crystals of calcium oxalate were
examined using Nikon E-200 microscope.
Gross necropsy and Organ/Body weight ratio and histopathology
The animals were euthanized by CO2 inhalation at the end of the experiment.
All animals were subjected to full detailed necropsy include careful examination of the

Page | 44
external surface of the body, all orifices, and the cranial, thoracic and abdominal
cavities. Weights of the vital organs were recorded using analytical balance and then
organ to body weight ratio for each organ calculated. Histopathological examination
was carried out as described in section 3.2.4.
3.2.6 In vivo Chromosome aberration assay
Chromosal aberration assay was performed in Groups I, II, III, IV (WSF-
treated) and V (cyclophosphamide –treated) as shown in section 3.2.5.
Procedure
At the end of treatment schedule of chronic toxicity, animals were given
colchicine (400 µL; 4 mg/kg) intraperitoneally and sacrificed after 2 hr. Bone marrow
from the femurs were extracted and chromosome preparation were made according to
the method of Adler (1984) and Savage (1975) with slight modifications as described
in Fig. 2.
3.2.7 In vivo COMET assay
The Comet assay was performed in Groups I, II, III, IV (WSF- treated) and
Group V (cyclophosphamide -treated) as shown in section 3.2.5.
Gel electrophoresis
Whole blood single cell gel elecgtrophoresis was carried out according to the
method of Chandna, (2004) and Dhawan et al., (2001) with minor modifications as
depicted in Fig. 3. Briefly, 50 µL of blood containing EDTA was embedded in 450 µL
of 0.1% agarose and spread over a pre- coated microscopic glass slide. The gel was
covered with a glass cover slip and left to set at 4ºC for 5-10 minutes. Gel embedded
cells were lysed in lysing solution for 20 min at 4ºC, to allow DNA unwinding, and-

Page | 45
Fig. 2 Schematic flow chart for in vivo bone marrow chromosome aberration assay.

Page | 46
Fig. 3 Schematic flow chart for in vivo COMET assay.

Page | 47
electrophoresed in electrophioresis buffer at 400 mA and 50 V for 20 minutes to
separate DNA. Slides were stained with EtBr staining solution for 20 minutes.
Comet Analysis
Stained slides were then examined with an Olympus fluorescence microscope
IX 41 equipped with an excitation filter (BP 510 nm) and a barrier filter (590 nm). A
computerized imaging analysis system (KOMET 5.5) was used to analyze the amount
of (i) DNA damage, (ii) olive tail moment values, and (iii) tail coefficient variance. A
total of two hundred cells were examined for each sample.
3.2.8 In vivo Micronucleus assay
3.2.8.1 Bone marrow micronucleus assay
Micronucleus assay was performed in all Groups I, II, III, IV (WSF –treated)
and V (cyclophosphamide-treated) as shown in section 3.2.5.
Preparation of bone marrow
Bone marrow was extracted a described in section 3.2.6 and flushed with FBS.
Marrow suspension was prepared as described in Fig. 4.
Fluorescent staining and analysis of micronuclei
Fixed bone marrow smears prepared on the clean glass slides were stained with
acridine orange according to the method of Costa and Costa (2007) as described in
Fig. 4 and examined under fluorescent microscope for the frequencies of
micronucleated polychromatic erythrocytes (MNPCE). Erythropoisis percentage of
polychromatic erythrocytes (PCE) was evaluated over 2000 total erythrocytes
(PCE+NCE) (NCE= Normochromatic erythrocytes). Micronuclei were evaluated on
the basis of number of PCE‟s, MNPCE‟s and MNNCE‟s (micronucleated
normochromatic erythrocytes).

Page | 48
3.2.8.2 Flow cytometric enumeration of peripheral blood micronuclei
Flow cytometric analysis of micronucleus (micronucleated erythrocytes;
MNRETs) was performed as per the following experimental schedule in Balb/C mice.
Group No. of mice Treatment Dose
(mg/kg; per oral)
I 6 Control
II 6 WSF 250
III 6 WSF 500
IV 6 WSF 1000
V 6 CP 12.5
VI 6 CP 25
VII 6 CP 50
WSF was administered once daily for a period of 28 days. CP was administerd once
daily for 5 days consecutively.
Procedure
At the end of treatment schedule peripheral blood samples were collected by retro-
orbital sinus puncture in EDTA containing tubes. Blood samples were processed
according to the method of Dertinger et al., (2006) as described in Fig. 5.
Briefly, processed blood samples were labeled with antibody markers (FITC-
anti-CD71 and PE-anti-CD61) were added with propidium iodide (PI) and a minimum
of 10000 cells were analyzed in flow cytometer (BD Facs ARIA) enabled with
FACSDiva software.
Gating strategy for MNRET analysis was employed as described in Mouse
Microflow Basic Analysis kit (BD Biosciences).

Page | 49
Fig. 4 Schematic flow chart for in vivo bone marrow micronuclei assay.

Page | 50
Fig. 5 Schematic flow chart for in vivo micronuclei assay in peripheral blood using
flow cytometry.

Page | 51
3.2.9 Sperm abnormality assay
Sperm abnormality assay was performed in Groups I, II, III, IV (WSF –treated)
and VI (metronidazole-treated) as shown in section 3.2.5.
Procedure
Epididymis was excised by laparoctomy. Sperm suspension was prepared by
mincing the epididymis as depicted in Fig. 6. The filtered suspension was stained with
1% eosin-Y for 30 min according to the procedure of Narayana et al. (2002). The
morphological abnormalities in sperm head shape and other changes were enumerated
by the method of Wyrobek and Bruce (1975) using Nikon E200 light microscope at
100X magnification.
For each animal, 1000 sperms were assessed for morphological damage and
data were presented as percentage incidence of total abnormalities. These included
coiled/ folded, flagellum with ansa, bent at cephalocaudal region, amorphous head,
double headed, double tailed, hookless flagellum, coiled with microcephali and
multiple abnormalities.
3.2.10 In vitro Genotoxicity study
Cell Culture
Chinese hamster ovary (CHO; wild type) cells were obtained from the National
Center for Cell Sciences, Pune, India, and maintained in complete Ham‟s F12 nutrient
medium in 25 cm2 flasks at 37ºC and humidified atmosphere of 5% CO2 in air.
Passaging of the cells was done four times a week. Experiments were performed with
cells cultivated not longer than twenty passages to avoid mutations. Exponentially
growing cultures were used for the study. Cells were counted using haemocytometer.
The viability of cells was determined by standard trypan blue exclusion test. A visual
count was made of the number of live and dead cells using haemocytometer following
staining with trypan blue (0.4% in PBS) and percentage of live vs. dead cells was
determined. Cell with >95% viability were selected for the studies. CHO cells were

Page | 52
disaggregated using 1 ml of 0.25% trypsin solution and when all the cells were
detached, trypsin was inactivated with 2 mL complete medium. The cells were
centrifuged at 250 g for 10 min. Supernatant was discarded and pellet resuspended in
complete medium to give 106 cells/ml suspensions. This suspension was then used for
plating cells in 12 well plates (40,000 cells/well) for micronuclei assay.
3.2.10.1 Flow cytometric analysis of micronuclei (MN) in CHO cells
Procedure
In vitro micronucleus assay in CHO cells using flow cytometry was carried out
as depicted in Fig 7. WSF was treated at varying concentrations ranging from 25-150
µg/ mL. The reference compound ethyl methane sulfonate (EMS) was tested at conc.
of 6 mM.
Samples were analyzed with a BD flow cytometer. A log scale was used to
register DNA and side scatter (SSC) signals. Strategies for acquiring flow cytometric
data, including configuration of regions and gating logic, were as described by Wagner
et al., (2003). Briefly G1-phase nuclei were stored around channel 2000 and
micronuclei were counted in the region between 5 and 40% of the DNA content of G1-
phase nuclei. A minimum of 20,000 events per sample were analyzed.
3.2.10.2 Cytokinesis block micronuclei (CBMN) assay
Procedure
CBMN assay was carried out according to the method of Fenech (2000) as
depicted in Fig 8. CHO Cells were treated with different concentrations (25, 50, 75,
100, 125 and 150 µg/ml) of test material for 6 hour. DMSO 1% and EMS 6mM were
served as vehicle control and positive controls, respectively. After exposure, cells were
washed with medium and grown further for 18 h in 1 mL of fresh complete HF12
medium containing Cytochalasin-B (final concentration 3 µg/ mL medium) in a CO2
incubator at 5% CO2.

Page | 53
Fig. 6 Schematic flow chart for sperm abnormality assay.

Page | 54
Fig. 7 Schematic flow chart for in vitro micronucleus assay in CHO cells using flow
cytometry.

Page | 55
Fig. 8 Schematic flow chart for CBMN assay

Page | 56
Cells were harvested (500 µl of trypsin; 0.125%) and washed with PBS and
then resuspended in incomplete culture medium. This suspension loaded in cytofunnel
(250 µl) and centrifuged in cytospin (Thermo Shadon, UK). Slides were then air dried
and fixed in MeOH. Slides further kept overnight for air drying. Slides were stained
with 10% Giemsa and 1000 binucleate cells from each concentration scored according
to the protocol of Shukla et al., (2011b). A cytokinesis block proliferation index
(CBPI) was further calculated from 500 cells/ concentrations as recommended in the
OECD guideline No. 487 (OECD, 2007) as follows: CBPI = (No. of mononucleate
cells + 2 X No. of binucleate cells + 3 X No. of multinucleate cells) / Total No. of
cells.
3.2.11 Effect of WSF on immune response
Collection of sheep RBC (SRBC)
Sheep red blood cells (SRBC) were collected asceptically from jugular vein of
sheep at weekly intervals and stored in cold sterile Alsever‟s solution. SRBC collected
in Alsever's solution were centrifuged and washed 3 times with sterile normal saline
(0.9 % NaCl w/v).
Immunization
Mice were immunized by injecting 0.2 mL of SRBC suspension (5 x 10⁹ cells)
i.p. on day 0, and segregated into 5 groups of 6 mice each and treated as indicated
below. The dose volume was 0.2 ml. Control group animals received vehicle only.
Group No. of mice Treatment
(mg/kg p.o.)
I. 6 -
II. 6 WSF 250
III. 6 WSF 500
IV. 6 WSF 1000
V 6 CP 50

Page | 57
Test material was administered for 21 days consecutively and CP was
administered daily from day -5 to day 0.
3.2.11.1 Determination of serum antibody (anti-SRBC) titre
Blood samples were collected by retro-orbital plexus on day 7 (for primary
antibody titre) and day 14 (for secondary antibody titre). Serum was separated and
antibody levels were determined by the hemagglutination technique (Gupta et al,
2006). Briefly, equal volumes of individual serum samples of each group were pooled.
Two- fold dilutions of pooled serum samples were made in 25 μL of normal saline in a
micro-titration plate to which was added 25 μL of 1% suspension of SRBC in saline.
After mixing, the plates were incubated at room temperature for 1 h and examined
under the microscope. The reciprocal of the highest dilution of the test serum
producing agglutination was taken as the antibody titre.
3.2.11.2 Determination of IgG titre.
SRBC specific IgG antibody response in the serum of control and treatment
groups were measured by ELISA method as described by Biella et al., (2008) with
slight modifications. In brief, SRBC antigen, in aliquots of a 5 μg/mL suspension in
PBS, pH 7.2 (150 μL/well), was incubated overnight at 4ºC in high-binding
microplates (Costar, New York, USA). Prior to each subsequent step, plates were
washed three times with PBS-T (0.05% Tween 20). Unbound antigen was blocked
with 5 % FCS/ PBS at 37 ºC for 1h. 100 μl of diluted serum samples (diluted in PBS-
T; 1:8) were added to the wells. The plates were then incubated for 1 h at 37 ºC,
followed by three times of washing. Aliquots of 100 μl of rabbit anti-mouse IgG
horseradish peroxidase conjugate (1:1000) were added to each well. Plates were

Page | 58
further furnished to incubate for another hour at 37 ºC. After washing, the peroxidase
activity was assayed by adding 100 μL of substrate solution (10 mg of OPD). The
plates were incubated for 20 min at 37 ºC in the dark, and enzyme reaction was
terminated by adding 50 μL/well 2 N H2SO4. The O.D. was measured in ELISA reader
at 450 nm.
3.3 Statistics
Data were expressed as mean± S.E. and analyzed using ANOVA followed by
Student-Newman-Keuls test for multiple comparisons. Results were considered
significant at p<0.05.