matching heterogeneous skills demand and supply … · matching heterogeneous skills demand and...
TRANSCRIPT

Matching heterogeneous skills demand and
supply under limited rationality
David N. MARGOLIS∗ and Jaime MONTANA DONCEL†
July 16, 2015Preliminary, please do not cite
Abstract
This paper models the labor market matching process when skills are multidi-mensional and workers are naive about the strategic behavior of their competitors.Using supply and demand side data on multidimensional skills from Colombia,the paper numerically solves for the equilibrium allocation of workers to jobs thatsolves the naive worker problem and finds that the allocation is inefficient, in thatworkers over-weight job availability at the expense of matching to jobs for whichthey are over-qualified, leaving less qualified workers to match to jobs with higherskill demands. Two counterfactual simulations suggested that investment subsi-dies would be a more effective strategy for approaching the efficient allocationthan making training available to all unemployed workers.
Résumé
Ce papier modélise le processus d’appariement sur le marché du travail lorque lescompétences sont multidimensionnelles et les travailleurs sont naïfs vis-à-vis lecomportement stratégique des autres demandeurs d’emploi. En exploitant des don-nées colombiennes d’offre et de demande de compétences, on trouve numérique-ment l’allocation d’équilibre des travailleurs aux postes offerts. Cette allocationest inefficace, car les individus mettent trop de poids sur la possibilité á trouverun emploi au frais d’occuper un emploi pour lequel il est sur-qualifiés, laissant lesindividus moins qualifié occuper les emplois qui nécessitent plus de compétences.Deux simulations contrefactuelles sont étudiées, et on trouve qu’une subvention àl’investissement permettrait à mieux se rapprocher à une allocation efficace qu’uneaugmentation générale du niveau des compétences parmi les chômeurs.
JEL Codes / Codes JEL: J24, J64, D83, C63
Key Words: Multidimensional Skills, Limited Rationality, Matching, Colombia
Mots Clés: Compétences multiples, Rationalité limitée, Appariement, Colombie
∗Paris School of Economics, CNRS and IZA. Mailing address: Centre d’Economie de la Sorbonne,
106-112 boulevard de l’Hôpital, 75647 Paris Cedex 13, France. E-mail: [email protected].
Telephone: +33 (0)1 44 07 82 20. Fax: +33 (0)1 44 07 82 47.†Université Paris 1 Panthéon-Sorbonne. E-mail: [email protected].
1
1
Introduction
Under perfect competition with fully rational agents, and in the absence of frictions(information, transaction costs, or otherwise) and capital constraints, unemploymentdoes not exist. Wages adjust so that the supply and demand of jobs and skills equilibrate,and there are no unfilled vacancies and no unemployed workers. Unemployment occurswhen there is a deviation from the frictionless, fully rational and perfectly competitivemodel.
One particular manifestation of unemployment is skills mismatch. This occurs whenthe set of skills demanded by firms does not match the set of skills supplied by workers,a situation which arises when individuals and firms do not accurately anticipate theother’s actions. Both vacancies and unemployment can simultaneously exist. Modelslike Mortensen and Pissarides (1994) use a matching function that determines the shareof workers that get matched to vacancies at any point in time, but the mechanism is leftas a black box and skills differences are most often modeled as being associated withdistinct labor markets across which individuals and jobs cannot shift easily. Moreover,heterogeneity in skills, when considered, is often modeled as different levels of a singlehuman capital measure (high skilled versus low skilled workers, for example), and thedifferences are related to amounts of human capital needed or required in a job.
In the real world, skills are multidimensional, individuals possess different levels ofeach skill, and each job can require a different combination of skills, and in differentamounts (Lazear, 2009). In this context, search frictions on the worker side refer totrying to people trying to find the jobs that provide them with the highest utility giventheir skill set, while search on the employer side refers to firms trying to find the workerswhose skill sets most closely match the technological requirements of the post being of-fered. Even if workers accurately predict the skills that will be needed by the market andinvest accordingly (and thus the supply and demand of skills in the population match),workers and firms can fail to instantly optimally match when worker knowledge of thecharacteristics of their competition is imperfect, or the degree of sophistication of theirreasoning does not allow them to solve the full multidimensional matching equilibriumso that workers only apply to the jobs that will hire them in equilibrium.
This paper theoretically models the worker-side search process when workers have fullinformation about the jobs on offer and the skills available in the population, but whoselevel of sophistication in their reasoning is limited1. It then numerically solves for the
1Solving for the multidimensional matching equilibrium is only starting to attract attention in the eco-nomics literature (see Dupuy and Galichon (2014)), and the large literature demonstrating the importantsignificant role of job search assistance and placement for the unemployed (Card et al., 2010) suggeststhat the complexity of the decision problem is non-trivial.

2
equilibrium allocation of skills to jobs and the time to job finding using data on cogni-tive, non-cognitive and technical skills supplied and demanded (as announced in on-linejob postings) in Colombia. After establishing that this allocation of workers to jobs isinefficient, in the sense that there are over-qualified workers in medium-skilled jobsand under-qualified workers who require significant skill upgrading in high-skill jobs,the paper introduces a counterfactual simulation in which firm training is subsidized(thereby reducing the cost of hiring workers with skills below the minimum thresholdfor a job) and a simulation in which all unemployed receive training so that their skillscan increase to a level that makes them eligible for jobs that otherwise they would beunable to occupy. The policy of subsidizing firm training is found to do a better job ofapproaching an efficient allocation of labor than a policy of generalized skill upgrad-ing.
The rest of the paper is divided into four parts. The first part presents the motivationand the relevancy that this document might have for economics. It does so compilingthe relevant literature of occupational choice and hiring decision and explaining howthe approach presented may be an interesting contribution to the economic debate. Thesecond subsection presents the data used. The third part is devoted to the descriptionof the theoretical model and analyzes the economic implications of this approach. Thelast part presents the results, conclusions and further extensions to the presented work.An appendix complements the document with considerations on the use of the data anda guide for the implementation of the simulation.
1 Relevant Literature
One of the main concerns of policy makers is mismatch between the human capitalavailable in the labor force and the requirements of the firms. Many skilled workers donot possess the technical, cognitive, and socio-emotional skills to fill current vacanciesor create new jobs, and those that do possess these skills may not be able to find thejobs for which they are best suited. The World Bank report on skills (Almeida et al.,eds, 2012) notes that 45% of the current employers worldwide claim that they can notfill entry-level jobs, while a similar share of working youth state that their jobs do notuse their acquired skills.
The dominant equilibrium framework for explaining the matching of workers to vacan-cies was proposed by Mortensen and Pissarides (1994). One of the main assumptionsof this matching framework is that there exists a complete labor market, comprising ahomogeneous pool of unemployed and a homogeneous pool of vacancies. This homo-geneity does not allow for the introduction of different kind of jobs or workers. In order

3
to weaken this assumption, many studies focus their attention on different sectors orgroups of jobs, assuming each market as a separated market. One example of this isthe work of Stops and Mazzoni (2010), in which the authors analyze the Mortensen andPissarides model in different occupational groups, considering each occupational groupas a family of job types that share the same kind of qualification requirements.
This feature of the Mortensen and Pissarides model, in which is possible to calculatethe equilibrium only in a single, complete labor market or with rigidly segmented labormarkets, is a binding constraint, since one observes vertical and horizontal mobility ofworkers in the data. Moreover, the assumption of perfectly segmented markets brings anew challenge since is impossible to model as many unemployment pools for workers asthere are groups in the economy. A natural consequence of strictly segmented markets isdifferent prices, even for the same skill set, in different markets with different bargainingsettings. This idea is formalized by Moen (1997), in which the bargaining in submarketsof the economy generate different wages. One problem with this approach is that thenumber of submarkets is determined by the power of the firm to create submarkets,giving the firm the (unrealistic) unilateral ability to segment labor markets. Stops (2014)provide a theoretical and empirical demonstration for which the assumption of separatedpartial labor markets is not a realistic assumption. His approach is also relevant for thispaper since he bases his analysis in what he calls an “occupational topology” for whichthe proximity between the occupational requirements are take into consideration to formthe groups. This is similar to the approach adopted here, where multiple vacancies listedin a single job posting have common occupational requirements, yet these requirementscan differ from other vacancies and it is the requirements of the jobs that determine the“market”.
In these extensions of the Mortensen and Pissarides (1994) framework, workers are ei-ther assigned a sub-market based on exogenous characteristics or endogenously choosethe market in which they participate. Moen’s (1997) model, in particular, allows forex-ante posting wages resulting from a trembling hand equilibrium. The mechanismis based on the ability of unemployed workers to search only in a fraction of the jobsoffered, so they choose on the basis of the expected wage. In this sense the model canbe interpreted as a sort of occupational choice model for which agents choose the mar-ket in which they want to participate following an utility maximization approach, butall workers who participate in a particular market receive a given wage and match tojobs with a common probability. The model here presented is based under a similarconstruction, although in this paper it is the fact that different vacancies have differentskill requirements that leads to optimal posted wages that can be heterogeneous acrossvacancies.

4
A common thread in the Mortensen and Pissarides (1994) - based literature is that, oncea worker is assigned to a market, the probability of matching to a job no longer dependson the worker’s specific characteristics. Several authors have also tried to weaken thisaspect of the theory. For example, Albrecht et al. (2009) construct an extension ofthe model allowing for (continuous, unidimensional) heterogeneity across workers andmultiple submarkets (in their case, formal and informal employment). Margolis et al.(2012) further extend this model by introducing self employment, but retain the con-tinuous, unidimensional heterogeneity assumption of Albrecht et al. (2009). All theseextensions of the Mortensen and Pissarides (1994) framework allow one to explainmatching in labor market, but they require the assumption that the determinant of indi-vidual productivity is an observable, unidimensional characteristic.
In reality firms can not hire in base to this single measure, since each firm value differenthuman capital because it depends on the technology it has. This kind of approach hasbeen introduced previously by Lazear (2009) in which each firm weight different eachskill in the production function. Firm specific human capital, is opposed to the conven-tional view of general human capital, for which human capital augments productivity inthe same amount in all firms. Instead the firms valuate different characteristic of the in-dividual, valuating his skill endowment differently (i.e the requirement of job postingsin which a set of skills are required for filling the position). Firms valuate characteristicssuch as education, experience among other characteristics. The other characteristics arethe skill endowments that the person posses in order to perform the task of the occupa-tion, demographic characteristics and physical factors (Becker, 1962). In this documentwe are going to focus in the observable characteristics that the firm can observe in theworker: skill and demographic (age, education, experience).
Another separate, and much older, strand of literature in search models focused specifi-cally on the individual-level occupational choice problem (Miller, 1984) and generatesoutcomes that can vary across job-seekers. In this model, Bayesian job seekers com-bine prior beliefs about the characteristics of all jobs in the economy with informationabout jobs which they have previously experienced. Based on these posterior beliefs,the job seeker chooses the best option. The model is based on the construction of an in-dex which represents the expected present value (conditional on beliefs) of the return toeach job. This paper adopts a similar approach, basing the decision model on a compar-ison of the expected values of different jobs which are functions of and index. One keydifference in our approach is that the beliefs underlying the expected value calculationsare naive, and not Bayesian, and are based on the number of vacancies and the valueof each person’s index in each job separately, without considering strategic behavior ofother job seekers.

5
The construction of this index depends on the proximity of an individual’s skill set tothat required by the job. Lazear (2009) formalized this idea that different jobs requiredifferent skill sets by allowing heterogeneous skills to provide different levels of spe-cific human capital in different firms, through firm specific weights for each skill. ?’swork is an extension of Becker (1962), and allows for other characteristics that theperson possesses that are useful for performing job-related tasks, such as demographiccharacteristics and physical factors, to also influence an individual’s value to the firm.This paper adopts Lazear’s approach in considering a vector of characteristics whenbuilding the index that underlies the expected value calculation.
One important goal of this paper is use the Miller (1984) occupational choice literaturewith Lazear’s (2009) insight about firm-specific human capital to open the black boxof the matching function in the Mortensen and Pissarides (1994) literature. Whereasthe Miller (1984) and Lazear (2009) papers are strictly partial equilibrium models,Mortensen and Pissarides (1994) characterizes the full labor market, and this paperalso derives the equilibrium allocation of workers to jobs and unemployment.
2 The Model
This section details a model of occupational choice on the work side and hiring deci-sions on the firm side. The model is a sequential in that firms first post their offers(wage and number of vacancies), then workers decide the jobs to which they will apply,firms select among applicants, and unmatched vacancies and workers go back into thepool for another round of applications and hiring. As in Moen (1997), wages are postedand not bargained, but here the worker’s utility maximization problem conditions onthe skill endowments of each agent and the similarity between the individual’s skill setand the occupation requirements. Firms can train workers with inadequate skills, butthis cost enters into the firm’s profit maximization when making hiring decisions.
This section presents the model in several steps. First, the structure of the model and theobjective functions are presented. Then the firms wage posting decision is presented,followed by the worker’s occupational choice problem and the hiring mechanism. Thissection concludes with a presentation of the numerical approach for solving for theequilibrium of the model, as an analytical solutionis intractable.

6
2.1 Matching as a sequential game
The labor market matching process is model as a sequential game with agents who,although fully informed about the distribution of vacancies posted and of skills avail-able, maximize their expected income while (naively) ignoring strategic considerationssuch as which jobs they should apply to given the optimal application decisions of otheragents and the likelihood of their application being accepted given the competition. Theplayers of the game are:
• Job seekers. The number of job seekers in the economy is I ∈ {1, 2, .., I}. Eachjob seeker owns a set of non transferable endowments: they can not be exchangedamong job seekers, nor do they decrease or increase during the duration of thegame. The set of endowments for individual i is characterized by a skill vectorsi =
(s(1,i), .., s(K,i)
), whereK is the number of skills. Skills are heterogeneously
distributed among the job seekers, so the vector s is a multivariate random variables ∼ Fs(s1, .., sK) and Is represents the set of skills available in the economy.
• Occupations. The main assumption is that each occupation behaves like a firmand, for ease of exposition, we will refer to occupations in what follows as firms2.The number of firms in the economy is J ∈ {1, 2, .., J}, and each is characterizedby a production function of the form:
yj = f (s, rj, aj) (1)
where rj = (r(1,j), .., r(K,j)) is a vector of the specific requirements of the skill onthe production technology of the firm and aj = (a(1,j), .., a(K,j)) is a vector of theimportance of the skill in the technology of production.The vectors rj and aj arealso multivariate random variables. This specification is a generalization of thefirm specific human capital model of Lazear (2009) in which
qj =K∑k=1
a(k,j)
(skr(k,j)
)
with∑K
k=1 a(k,j) = 1. Each occupation is endowed with a fixed number of vacan-cies at the beginning of the game. The vector V = (V1, V2, .., VJ) characterizesthe distribution of vacancies in the economy and Iv represents the set of vacanciesavailable in the economy. This information is common knowledge.
The sequence of events is as follows.
2An alternative, equivalent interpretation could be that if multiple firms post vacancies for the sameoccupation, they behave in the same manner.

7
0. Each firm posts the wage that it will pay in exchange of the supply of one unitof labor (which represents the complete utilization of the skill endowments3).This happens only once in the beginning of the game. The wages offered by thefirms are common knowledge and are determined non-strategically, in that firmsdo not compete across occupations for workers through wage posting, but rathermaximize their own profits (subject to an output constraint). The vector of postedwages can be written as the vector W = (w1, w2, .., wJ).
1. In the first stage of the game, job seekers apply for the job that maximize theirexpected wage given the available information in the market. Each job seekerchoose only one vacancy in each iteration, so there is a cost associated in thesearch process in that individuals cannot diversify their risk by simultaneouslyapplying to several jobs4.
2. In the second stage of the game, each firm chooses among the applicants, with thefirm that posted the most vacancies choosing first5. The firm will select the jobseeker whose set of skills si that best matches its skill requirements and impor-tance vectors, rj and aj . Skills in excess of the minimum level of requirements donot generate additional profits for the firm, so other criteria will be used to breakties (see section 2.5). Note that this technological constraint and selection processimplies that some skills could go unused, which could be a source of inefficiencyfor the economy. Following this hiring strategy will maximize the profits of thefirm given the production function presented in equation 1 and the posted wagewj . Thus if the individual i applied to firm j (meaning that this firm gives himthe highest expected utility), and firm j chooses job seeker i (meaning that thisworker generates the highest profit among the pool of applicants), a match occurs.The new hiring decreases the number of vacancies available to fill in the firm byone, and takes the worker out of the pool of unemployed.
3. The second stage continues until each firm (in order by the number of posted va-cancies) has completed its hiring from its iteration-specific applicant pool. Firmsthat receive more applicants than vacancies will fill all of their vacancies in thefirst iteration. Other firms will only fill a portion of their vacancies, and the re-maining vacancies become available for the next iteration.
4. The game is repeated from step 1 until either all vacancies in the economy arefilled or all unemployed workers find jobs. We denote z as an iteration of theprocess.
3Individuals are assumed to be unable to split the use of their skill endowment across jobs.4Note, however, that the time between iterations is assumed to tend to zero, so individuals can appear
to have applied to multiple jobs, although the process is not, in fact, simultaneous.5This could reflect worker beliefs that the most visible firms are the ones in highest demand.

8
Figure 1: Structure of the game in iteration z
The game tree presented in figure 1 shows the sequence of events in iteration z.
2.2 Optimal unique wage setting in presence of heterogeneity
The wage posting problem for the firm is non trivial, since the firm does not know exante which workers will apply and it has specific technology (in this case representedby the importance and the requirement level) that can make the value of a hire changewith the characteristics of the person hired. Firms will target individuals whose skillsets at least meet the requirements of the posted job, so the problem is to find thewage that allows the firm to hire the selected individuals at the lowest cost, while stillmeeting production requirements for a given workforce size (the number of vacancies isexogenous). To find the unique wage posted, the firm proceeds as if it could compensateeach specific skill individually, solving the following cost minimization problem:
minK∑k=1
ωjksk
s.t.

9
q = f (s, rj, aj)
Where ωjk is the price of the k-th skill for the given technology. The associated La-
grangean of the problem is:
L(·) =K∑1
ωksk − λ(q − f (s, rj, aj))
The k + 1 first order conditions of the problem are:
F.O.C.
∂L(·)∂s1
= ωj1 = λf
′
s1(s, rj, aj))
(..)
∂L(·)∂sk
= ωjk = λf
′
sk(s, rj, aj))
∂L(·)∂λ
= ¯q = f (s, rj, aj)
Given that individuals whose skills exceed the required level do not produce additionaloutput, firms use the distance function d : Rk ×Rk → R to identify how far an individ-ual’s skill set is from that required to do the job well. Define the minimal skill set as ssuch that :
s = mins∈ {s : d(s, rj) = 0}
For the fixed level of output q and the optimal skill bundle s, the optimal wage thatensures the profit maximization is therefore given by6:
Wj =k∑1
ωjksk =
k∑1
λf′
sk(s, rj, aj)
6Note that λ is fixed since the restriction will not change given the fixed level of production.

10
The firm may, however, not receive any applicants whose available skill set meets therequired skill level. In this case, training will be required to bring the individual’s skilllevel up to the minimum requirements. The production function given in equation 1reflects this cost as a lower net output for individuals whose skill level s is less thanthe required amount rj . The firm anticipates this training cost and reduces the offeredwage so that, in expectation at the start of the game, the worker pays the full cost of thetraining. This implies that the final posted wage is reduced from the optimal wage byan amount reflecting the risk of having to make a suboptimal selection. The final wageposted ex-ante by firm j is thus defined as:
Wj = Wj −∆
where ∆ is defined by:
∆ = λk∑1
[∫ (f
′
sk(s, rj, aj)− f
′
sk(s, rj, aj)
)dFs(s)
]
Where the first part of the equation is the marginal product of skill sk evaluated at theoptimal skill level and the second part is the expected marginal product given the skilldistribution among job seekers7.
There are two important facts to remark to this solution:
• Each firm can value each skill differently. This can be seen in the fact that themarginal productivity for a given skill sk in two firms is going to be different whenthe technological parameters r and a differ. This implication is interesting sincetwo persons with the same endowments can have different wages in different jobs.
• Using this setup, even skill supply in the unemployed population was homoge-neous, there would be differences in income across jobs. Again, the differencescome from the heterogeneity in production technologies across jobs. This last facthas an implication for policy making and planning in that it suggests that train-ing alone cannot eliminate wage inequality, as technological differences woulddrive wage dispersion even if the skill level of the entire workforce could be in-creased to the maximum possible skills endowment (through education and train-ing). This is a direct implication of the wage posting assumption, in that firms areallowed to minimize cost through unilateral wage variation, as opposed to being
7Recall that firms do not set wages strategically so as to attract a specific set of workers, and thusthey assume ex ante that the skill distributiojn of applicants they will receive is the same as the skilldistribution in the overall unemployed population.

11
price takers on the labor market.
2.3 Occupational choice
Given that the wage was posted at the beginning of the game and job seekers know thewage and the associated number of vacancies for each posted job, each job seeker willmaximize his utility for his specific skill set by choosing to apply to the occupationwith the highest subjective expected wage. Assuming risk neutrality and that there isno savings, workers consume all their income and the utility maximization problemfor job seeker i at iteration z comes down to maximizing subjective expected laborincome:
maxjE(i,z)
{W 0
j | Iv, Is}
The vector(E(i,z) {W 0
1 | Iv, Is} , .., E(i,z)
{W 0
j | Iv, Is})
represents the payoff from eachpossible strategy for job seeker i at iteration z. Define the occupation j for iteration zas the one that maximizes utility:
E(i,z)
{W 0
j| Iv, Is
}> E(i,z)
{W 0
j | Iv, Is}∀ j 6= j
Note that the expectation is defined with respect to the individuals subjective beliefsabout the likelihood of getting a particular job if applying for it. As the worker isnaive, he does not consider the application behavior of other workers, and thus fromhis subjective point of view, the expected value of the job in occupation j in iteration z,given the posted wage Wj , is defined as:
E(i,z) {Wj | Iv, Is} = p(z, v, s)Wj
= Wjf (si, rj, aj)∑I
i f(si,rj ,aj)
I
vzj∑Jj′ v
zj′
The subjective expected wage as defined above reflects the the fact that the individualassumes his chances of receiving a particular job are related to his relative performancein jobj and the number of vacancies available in iteration z of type job type j. A higherposted wage also increases the value of job type j. The expected wage is thus composed

12
by three parts8:
• The wage posted by the firm Wj .
• f(si,rj ,aj)∑Iif(si,rj ,aj)
I
which is a measure of the productivity of individual i in job j relative
to the rest of the population, as measured by the average productivity in the job.It is important to note that this probability reflects the worker’s naiveté, in that hedoes not account for strategic behavior of other job seekers when considering theset of potential competitors for a job. Here, the individual assumes he potentiallyfaces all unemployed workers for each job to which he applies.
• The third part is the share of vacancies in occupation j with respect to the wholeeconomy. This reflects the idea that it is easier to find a job in an occupation withmore vacancies than in a particularly rare occupation.
2.4 Hiring decision
The objective of the firm is to maximize its profit level. Given the collection of appli-cants A ⊂ I for whom the job j maximizes their subjective expected utility, the firmwill select the most productive candidate, breaking ties by choosing among individualsusing other criteria besides skills. In this way, firm j ensures that profit is maximizedby hiring an individual i ∈ A from among the pool of most qualified indiduals suchthat.
i ∈ Aj =
{i | f (si, rj, aj) = sup
i′∈Af (si′ , rj, aj)
}
Under this process, a match is thus a stable coalition for which the job seeker i maxi-mizes his utility by choosing firm j and firm j maximize its profit by choosing the jobseeker i among the candidates in iteration z. This match is a stable coalition since nooccupation different that j can provide higher utility (and thus induce a deviation fromthe worker) and no other applicant beside i can generate higher profits (and thus inducea deviation from the firm).
The number of filled positions in occupation j in period z will be the number of appli-cants observed if their number is less or equal than the number of vacancies, meaning
8In the proposed simulation, the second part is considered in the form of :
γzif (si, rj , aj)∑Ii γ
zi f(si,rj ,aj)
I
where γzi is the number of people in the STEP survey of type i still unemployed in iteration z.

13
that firms would rather hire from the available applicant pool than forego productionand wait until the next iteration. When the number of applicants in A exceed the num-ber of vacancies in occupation j, all of the vacancies will be filled and job seekers inlater iterations will have to search for a job in a different occupation.
2.5 Numerical Resolution of the Equilibrium Allocation
Since the equilibrium of the model is analytically intractable, numerical techniques areused to solve for the equilibrium allocation of workers to jobs. What follows is a briefdescription of the algorithm used to solve the model.
• Construction a similarity matrix. Given the skill demand information of the va-cancy and O*NET database and the skill supply information on the STEP survey(see section 3), we define a measure of similarity for each observation and eachoccupation. The index synthesizes the value of each worker type in each occupa-tion, combining the different skill dimensions as specified by the rj and aj vectorsfor the occupation and the si vector for the worker type.
• Estimation of a tiebreaker index. In the case where multiple individuals haveequal values of the similarity index, other worker characteristics that can affectthe job search process and the firm’s selection decision are used to break the tie.This tiebreaking index is calculated by estimating a probit model of the proba-bility of employment as a function of the average skill-based similarity index forthe individual, the individual’s demographic characteristics and other job-relatedcharacteristics.
• Iteration. Match the individual maximizing the utility according to the behaviordescribed in the above model, using the probit index to break ties.
• Stopping. Stop the algorithm when the implied unemployment rate based onunmatched individuals is the same as that in the overall economy.
One of the main advantages of this model is that counterfactual policies can easily besimulated, in particular active labor policies that affect the level of skills. Currently,training in the firm, that in Colombia was part of the approved National Developmentplan of the second government of the former president of Colombia, has been imple-mented with the name UVAES. Under this plan, firms provide spaces for learning thetask of the company, and the national vocational education training institute - SENA -will certificate the competencies of the set of skills learned in the firm for future recog-nition. This is the reference situation.

14
Two main counterfactual policies are of interest:
• The first policy is a direct subsidy to firms for technological investment. This isformalized in the context of the model as a reduction in the minimal skill require-ments to perform a job well. The simulated policy lowers skill requirements forall firms, extrapolating from any firm decision to take up the policy.
• The second policy is an increase in spending on training for the unemployed.The model allows one to target training specifically to the unemployed, and thesimulation is implemented as a shift upward in all skills for those unemployed atthe start of the game.
3 Data
This paper uses data on the supply and demand sides of the labor market in Colombia.Beyond any intrinsic interest the Colombian labor might posses, it has a distinct advan-tage in terms of available data that are relevant for this analysis. Three different datasetsare used to characterize the Colombian labor market in terms of occupational structure,skill requirements by occupation and skill endowments by job seeker.
0. A vacancy database collected during 2014 in the Colombian Ministry of Labor isused to characterize the structure of job postings on the Colombian labor market.The sources of this data are the two major internet job search portals of Colombia,the data from the employment agency of the national Vocational Training Institu-tion (SENA - Servicio Nacional de Aprendizaje) and the data provided from theColombian employment service offices (UASPE - Unidad Administrativa espe-cial del Servicio Público de Empleo).
1. The World Bank collected a dataset in Colombia in 2012 using the STEP sur-vey9. This survey contains a standard labor force survey component, but has theadditional advantage of providing information at the individual level on educa-tion and training, health status, employment, job skill requirements, personality,behaviors, preferences, language and family background. In particular, the non-cognitive skills collected comprise the “Big 5” and the cognitive skills are bothself reported and directly measured on site.
2. O*NET provides a taxonomy of occupations, covering (among other dimensions)the skill content of occupations. The levels and importance of various skills for
9http://microdata.worldbank.org/index.php/catalog/step/about

15
each occupation of the O*NET classification are available, and the analysis un-dertaken here used 2010 revision of the data at the six-digit level of precisionof occupations (770 occupations). This , in order to have a decomposition levelthat was enough to give idea of a detailed structure of the economy. This data wascollected using the API, on-line information services and documentation. This in-formation was merged into the vacancy dataset to characterize job offers in termsof skills.
As the data analyzed here are drawn from multiple sources, coverage and representativ-ity are key concerns. In order for the analysis to be relevant for a sample broader thanthat covered by the data collected, the distributions of characteristics of jobs offered hasto be common across sampled and non-sampled jobs, and individuals must apply thesame decision process to the unsampled jobs as they would to the sampled jobs. In thatcase, one could treat the data as a random sample from the underlying distribution andconclude for an absence of bias in the estimated allocations of workers to job types. Un-fortunately, there exists no definitive reference for comparison. However, some indicesconcerning representativity can be drawn from available data, and the analysis data arereweighted to replicate employment shares for recent hires from a representative laborforce survey.
The first sign that the data might be representative is shown in table A.6 in the appendix.This table shows the channels used for job searching in the Colombian market drawnfrom the Household Income Survey (GEIH). The sources of data collected here covermore than the 50% of the channels used for job searching. The use of informal networksfor job finding is common, even in developed countries (Montgomery, 1991), but thereis no consensus as to whether the jobs found through networks are qualitatively differentfrom those found through formal channels (see also Mortensen and Vishwanath (1994),Margolis and Simonnet (2002)).
A second issue that arises in developing countries is the presence of informality. Infor-mality in Colombia represents a large share of overall employment, although much ofit is self-employment (Perry et al., 2007). For wage employment, it is unlikely that in-formal employers use the search channels collected in this data. Nevertheless, informalemployers tend to offer lower productivity jobs than formal employers (due to the needto cover payroll taxes), and thus the wages they propose are often lower (Perry et al.,2007). In this case, if informal opportunities are available with comparable frequencyto formal opportunities but pay less, they will be dominated in the naive individual’sdecision problem and their absence from the data will not affect the allocation foundhere.

16
Figure 2: Occupation by sector 2010 - 2014
Source: DANE - Household Survey (GEIH)
A final issue arises from the fact that the data collected do not all correspond to the sameyear. As figure 2 shows, however, the distribution of occupations in the Colombianeconomy was remarkably stable across the set of years from which the data are drawn,suggesting that there are unlikely to have been major shifts in the types of jobs offeredfrom year to year.
3.1 Colombian Vacancy Data
The Colombian vacancy dataset is a sample of the registries in 2014, collected by theColombian Ministry of Labor with the objective of monitoring jobs and job require-ments. The idea behind taking only a subsample for the year is to have the monthlyseasonality of job posting during the course of the year, while still maintaining a largenumber of job postings. The data contain information for 1,892,219 vacancies. Thesevacancies correspond to roughly 1 million registries, the difference being due to the factthan a single job posting can correspond to more than one vacancy opened. All of theanalysis undertaken here is done at the level of the vacancy, not the posting.
The structure of the data allows one to recover information on the characteristics of thejob offered by place, wage, sector, occupation, etc. Table 1 shows the variables and the

17
description of data.
Table 1: Database Content - Variables and description
Variable Description
IDNumber of the job vacancy (Requisition ID in the data warehouse.This number is unique and the role is to identify the vacancy withinthe warehouse
Title"Title" of the vacancy, i.e., the name given to the occupation. Thisprovides information for categorization, clustering and the basis forsplitting the identification of skills and competencies of occupations
Company Name Company nameSector Sector of the companyPosition Area where the person performsTotal years of experience Total experience requiredExperience in the position offered Total required experience in the positionCity Location of the vacancyProfessional title Title of the person requesting the vacancy i.e. economistWage Wage proposed for workLevel of education Degree (i.e. Technical, University, Bachelor)Type of contract Type of contractLanguage Language requirements for the positionNumber of vacancies per offer Number of vacancies that the job posting offers.Publication date Date of publication of the vacancyExpiring Date Expiration date of the vacancyDescription Description of the occupationOccupation CIUO ISCO 08 classification of occupationOccupation O*NET O*NET classification of occupation
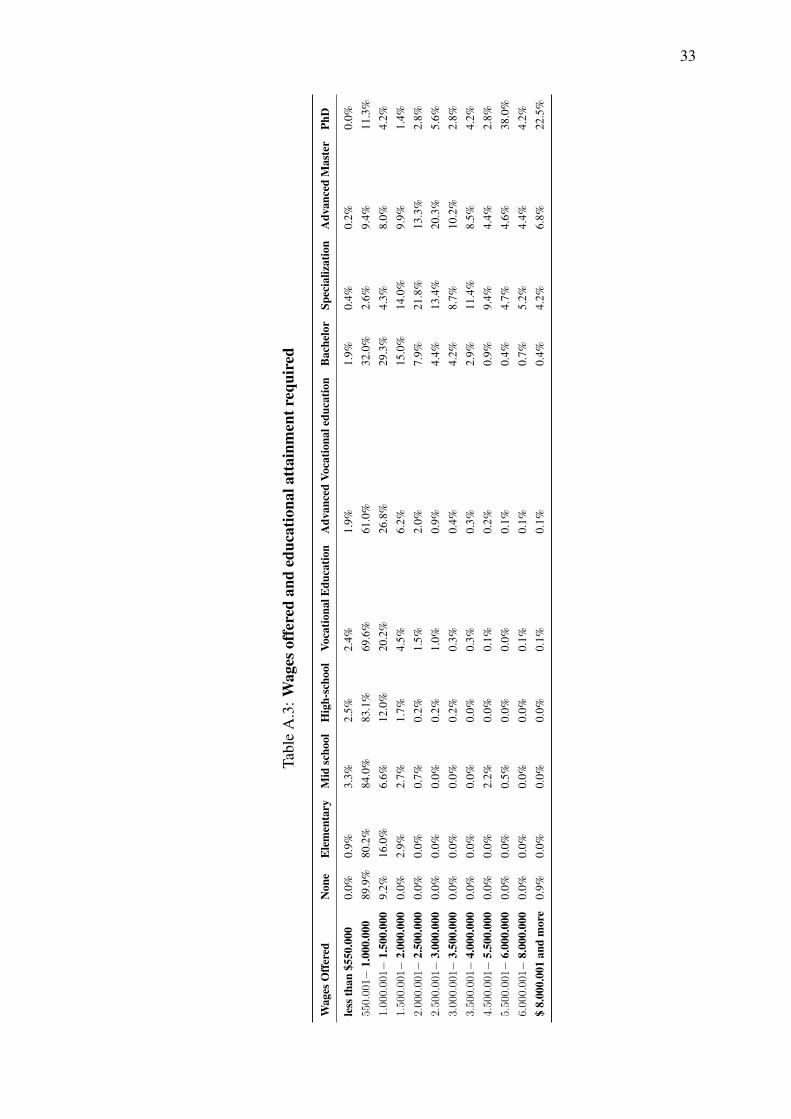
One of the main advantages of these newly-collected data is that they allow one toidentify the human capital needs of employers in Colombia. Importantly, descriptivestatistics calculated on these data fit many of the measures that are observed in othersurveys and previous studies. For example, the mode of the wage distribution is be-tween 500.000 pesos and 1.000.000 pesos, also observed in the household survey data(GEIH). The data also replicate specific characteristics of differences in the wage dis-tribution by schooling level required within occupation, in that they show more gradualwage increases with education for non-professional occupations relative to professionaloccupations10. This is especially true for specialized workers (one year post secondaryeducation), master and doctorate levels.
Is also relevant that the years of experience required for the job are concentrated inthe “one year or less” category. Along with the fact that the most common requiredlevel of education for the job is completed high school, this suggests that an important
10The wage distributions by level of education required are presented in table A.3.

18
Figure 3: Vacancy distribution in Colombia

19
share of job offers targets low skill occupations. Regarding the education level requiredto enter particular job, the data shows that 42.3% of jobs require at least completion ofhigh school, while 24.8% and 19.5% require technical and technological level educationrespectively. It is worth noting that levels below high school are not in high demand,in that overall demand for these levels represents 2.59% of jobs offered, while levels ofuniversity and postgraduate added 10.1%.
Regarding gender-specific job postings, the data shows that there is no gender prefer-ence specified in 81.18% of the vacancies . This is also in line with the Colombianlegislation11, for which there must be no gender discrimination at work and in wagelevels. However, 3.46% of the vacancies target women only while 8.83% of the jobvacancies are targeted exclusively to men. Only the 6.53% indicate that the firm andoccupation are indifferent considering gender.12.
Under the assumptions about the comparability of sampled and unsampled jobs pre-sented at the start of this section, a reweighting scheme was designed so as to renderthe distribution of sampled job offers across occupations representative of recent hires.A table describing the occupational structure of labor demand for the Colombian Econ-omy was built, based on the O*NET Code at the 6-digit level, the number of vacanciesper occupation, the mean wage offered by occupation and a vector that assigns a weightto each occupation to match the number of recent hires in the STEP survey. The weightwas calculated so that the occupational distribution of vacancies matched the share ofpeople with one year of seniority or less in the STEP survey. Differences between thedistribution of posted vacancies and the weights reflect differences in the probability ofa given occupation being filled. Table 2 presents the top 10 most frequent occupationsby number of posted vacancies, their wages and the associated weights.
3.2 STEP Survey 2012 - Colombia
The World Bank STEP survey for Colombia is used to capture the supply side of thelabor market. The Skills Towards Employability and Productivity (STEP) program in-cludes a household survey which is a tool designed to generated internationally compa-rable, quantitative data on employment skills. The main objective of the STEP surveyis to provide measures of the human capital stock of the country, including cognitive,non-cognitive and technical measures, in order to provide a baseline for policy imple-mentation and international comparison. The choice of specific skills measured is basedon the relevance on the skill for employers and employability, as determined by refer-
11See Law 1496 of 2011.12See table A.1.

20
Table 2: Structure of the Vacancy Final Database
O*NET Occupation Title Wages Number of vacancies Weight
41-2031 Retail Salespersons 843525.8 324494 4.55240943-4051 Customer Service Representatives 856134.3 130709 4.7757841-9011 Demonstrators and Product Promoters 734387.8 92029 5.39269943-5081 Stock Clerks 749143 63231 5.57352151-9198 Helpers - Production Workers 745251.9 47480 4.9672415-1152 Computer Network Support Specialists 1246871 33200 4.88215641-2011 Cashiers 821517.2 32066 3.64831315-1131 Computer Programmers 1121887 30627 4.59495243-3031 Bookkeeping, Accounting, and Auditing Clerks 922857.4 24903 4.93530643-5021 Couriers and Messengers 743303.8 18867 5.92456451-6052 Tailors, Dressmakers, and Custom Sewers 720115.6 17817 4.733252
ring to the academic literature (see for example Felstead et al. (2007); Heckman et al.(2006); John and Srivastava (1999)).
The specific skills that are measured include cognitive skills (reading, writing and nu-meracy), socioemotional skills (personality, behavior and preferences) and certain skillsrelated to work (a subset of transversal skills). The survey samples the working agepopulation (between the ages of 15 and 64), active and inactive. Data collection forthe survey began on March 2012, the results were processed and cleaned, and the finaldatabase was published officially in February 2013.
The survey instrument is comprised of several different modules. The first part of thefirst module collects household level information, including basic roster informationfor all household members such as relationship to the household head, characteristics(academical and level of literacy) and labor market status (employed, unemployed orinactive). The second part of the first module contains information about householdassets such as household size, materials, facilities, appliances, number of books andincome sources for the household. The later modules gather information on a randomly-selected individual respondent and covers education and training (quantity and type ofeducation), health status, employment status, job skill requirements, personality andbehavior measures, family background, and test to directly measure cognitive skills(reading and numeracy).
The methodology for collecting the data of the survey is based on a random represen-tative sample of households in rural and urban areas of the country. The informationof the first module is collected by asking questions to the main household respondent(a proxy for other household members at this step), and collects the income, size andcharacteristic situation of the household. The second step of the data collection is based

21
on direct questioning of a randomly selected household member, and thus the detailedinformation, in particular concerning skills, is not the result of proxy response.
This paper does not exploit the proxy responses from module 1, and focuses on theactive population13. The main descriptive statistics for the underlying data are shown intable 3. The results show that most variables are have reasonable variation when codedon a 4-point scale, although these variables were rescaled to be between 0 and 100 forcomparability. Survey weights are used in all calculations.
3.3 O*NET Occupations: minimum skill level requirements andimportance
The O*NET taxonomy of occupations is used to quantify the demand for specific skillsin each occupational job posting. O*NET is a database that contains detailed infor-mation for 965 occupations in the United States14 and was developed to replace theDictionary of Occupational Titles (DOT). The project started in 1991 and the idea wasto collect detailed information on the different aspects of occupations, in order to beable to describe and analyze them with a quantitative approach. The methodology forcollecting the information is based on continuous surveys to employers, research stud-ies by sector and occupation, continuous revision of the estimates and updating of theinformation and occupational analysis. The database has information on many occupa-tional dimensions including: tasks, generalized work activities, knowledge, educationand training, work styles, work context, skills and abilities.
O*NET is a publicly-accessible on-line database, so all the available dimensions ofoccupations can be accessed trough the web. The data for the analysis was obtainedthrough systematically structured queries of the database, which allowed for the col-lection of the information on the skills in table 4 for each occupation. The skills inthe O*NET database are grouped into two broad categories, basic skills and cross-functional skills. The basic skills are the ones that facilitate the acquisition of knowl-edge, while the cross-functional skills are the ones that facilitate the performance in ac-tivities, and thereby the performance of specific tasks inherent to each occupation.
13Labor force participation decisions are not modeled here, and are thus treated as exogenous withrespect to the worker’s decision problem.
14There is no comparable taxonomy relating skill requirements to occupations for Colombia. Usingthis data for the analysis undertaken here requires the additional assumption that the relative skill contentof occupations is comparable between Colombia and the United States. This does not imply that thesame technologies are necessarily used in each country, which would be particularly unrealistic given thedifferent levels of development. It does, however, require that technological differences across countriesresult in a homogeneous shift in skill requirements between countries, and that the relative importance ofeach skill type for each occupation is preserved.

22
Table 3: Descriptive Statistics for skills of STEP survey - Active Population
Variable Mean Std. Dev. Min Max
Read 1.889447 1.005517 0 3Write 1.223411 0.838479 0 3Numeric 1.779516 0.830061 0 3Interpersonal 2.05339 1.174125 0 3Presentation 0.233002 0.422858 0 1Supervise 0.338616 0.473367 0 1Computer 1.340207 1.354008 0 3Computer type 0.559322 0.850601 0 2Drive 0.106101 0.308051 0 1Repair 0.053435 0.224959 0 1Operate 0.100263 0.300431 0 1Think 1.289892 1.176287 0 3Learn 1.820946 1.207189 0 3Cognitive Challenge 1.557281 0.940956 0 3Autonomy 2.015327 0.86067 0 3Physical 1.901545 1.013278 0 3Extroversion 3.047863 0.640609 1 4Conscientiousness 3.326227 0.498628 1.666667 4Openness 3.238473 0.513277 1 4Emotional Stability 2.543818 0.726405 1 4Agreeableness 3.176563 0.554637 1.333333 4Grit 2.990806 0.613184 1 4Decision making 3.118844 0.599811 1.25 4Hostile bias 1.710988 0.603815 1 4Risk 1.640442 1.080305 1 4DiscountGender 0.543931 0.498192 0 1Age 34.96111 13.16419 15 64
Source: WB STEP Survey Colombia 2012

23
The O*NET skill content of the broad categories is divided in 35 skills. The basicskills are subdivided in content skills (reading comprehension, active listening, writ-ing, speaking, mathematics and science) and process skills (critical thinking, activelearning, learning strategies, monitoring). The cross-functional skills are subdivided insocial skills (social perceptiveness, coordination, persuasion, instructing, service ori-entation), complex problem solving, technical skills (operation analysis, technologydesign, equipment selection, installation, programming, operations monitoring, opera-tions and control, equipment maintenance, troubleshooting, repairing, quality control),system skills (judgment and decision making, system analysis, system evaluation) andresource management skills (time management, management of financial resources,management of material resources, management of personnel resources).
The skill taxonomy of O*NET presupposes that skills are the characteristics that anindividual has to have in order to perform a task well, and thus the presence of a cer-tain skill level in an individual can make him able to perform the different activitiesassociated with a particular occupation. An important implication of this assumption isthat employers value skills in the hiring decision: they do not decide solely on whethera worker can already perform a particular set of tasks, but rather whether the personpossesses the skills needed to perform those tasks.
The O*NET occupations were aggregated to the 6-digit level, in order to match thevacancy data. The values of each different occupation at the 8-digit level were aver-aged, reducing the dimension to 770 titles. The O*NET database characterizes skillrequirements along two dimensions: the level, referring to the minimum amount of theskill level required by the employer to perform the tasks associated with a specific oc-cupation, and the importance, referring to the relative mix of skills needed in order toperform an occupation well. The analysis undertaken here only uses 29 of the 35 listedskills, since these were the only skills present in both the STEP survey and the O*NETtaxonomy15.
4 Results
Numerical resolution of the equilibrium for the model was attained after 120 iterations(see figure 4) Table 5 summarizes the results in terms of the average skill index valueof individuals and of the average productivity of workers in occupations. Clearly, themodel generates an equilibrium allocation of workers to jobs that, although individuallyoptimal at the point in time the match occurs, id socially inefficient. Workers whose av-
15The unused skills were related to resource management, a skill type not quantified by the STEPsurvey.

24
Table 4: Skill Requirements: Descriptive Statistics
Variable Mean Std. Dev. Min Max
Active Learning Importance 50.83777 12.53559 19 78Level 44.0941 11.09776 16 80
Active Listening Importance 64.34634 11.05332 35 97Level 49.09316 9.422747 29 84
Critical Thinking Importance 61.95727 10.81199 31 94Level 49.8022 9.003765 29 80
Learning Strategies Importance 42.46033 14.45521 3 85Level 39.17115 12.08091 0 77
Mathematics Importance 36.97865 14.25698 0 100Level 34.6804 13.40057 0 87
Monitoring Importance 57.17222 8.987114 31 85Level 47.40881 8.207129 27 70
Reading Comprehension Importance 59.54293 13.79717 25 97Level 50.38899 12.08755 20 86
Science Importance 23.13736 21.57817 0 91Level 19.71977 19.99701 0 84
Speaking Importance 62.90062 12.26975 31 94Level 47.85948 10.49566 25 77
Writing Importance 52.37814 15.2853 10 97Level 45.54867 12.31633 7 75
Coordination Importance 53.01419 9.221817 25 81Level 44.71346 7.161652 27 68
Instructing Others Importance 44.86891 15.03995 0 91Level 40.71048 11.30251 0 70
Negotiation Importance 40.20755 11.79493 13 91Level 35.91504 9.609598 12 71
Persuasion Importance 43.46775 11.7508 16 81Level 39.0232 9.774566 14 68
Service Orientation Importance 47.74338 13.21695 0 91Level 40.089 9.048359 2 73
Source: O*NET

25
Table 4 (continued)
Variable Mean Std. Dev. Min Max
Social Perception Importance 54.30171 10.96683 0 94Level 43.31731 9.596944 5 84
Complex problem Solving Importance 53.91795 11.38924 22 81Level 43.72311 8.949525 21 73
Equipment Maintenance Importance 18.32409 21.64172 0 81Level 15.28671 18.32055 0 68
Equipment Selection Importance 18.45868 17.77134 0 75Level 14.67052 15.38731 0 57
Installation Importance 6.146651 12.17319 0 78Level 4.656793 10.86593 0 60
Operations and control Importance 30.94551 22.46198 0 97Level 25.40269 18.22881 0 80
Operations and monitoring Importance 39.58697 19.1671 0 94Level 32.42439 14.51982 0 70
Operation Analysis Importance 27.12225 15.9832 0 75Level 24.67528 16.02521 0 73
Programming Importance 12.34139 11.81543 0 88Level 9.484008 11.4184 0 68
Quality control Importance 35.28261 17.34819 0 78Level 30.56915 14.99334 0 57
Repairing Importance 17.49324 21.80392 0 85Level 14.75675 18.47062 0 61
Tech Design Importance 15.93318 9.947358 0 60Level 12.72916 10.517 0 60
Troubleshooting Importance 26.1647 19.6714 0 81Level 22.34657 16.78092 0 75
Judgment Decision Making Importance 55.50743 10.28359 25 85Level 44.5131 9.250787 23 71
Source: O*NET

26
erage skill level is high can be found allocated to jobs that only need a low level skills,while some high-skilled occupations undertake costly investment to increase the skillsof their low-skilled recruits. The main reason for this result comes from the means bywhich workers calculate the subjective probability of obtaining a job. Although beingmore skilled than average increases the likelihood of hiring in any job and occupationswith higher skill requirements pay more, it appears that the availability of vacanciesis a more dominant factor in determining an individual’s occupational choice. If theamount of vacancies for a particular occupation is really large in comparison to otheroccupations, the results suggest that the choice will be towards that occupation regard-less of variation in wages or any job-specific productivity advantage an individual mighthave. In this data analyzed here, nearly the 10% of all vacancies are in retail or relatedoccupations. The easy availability of such jobs make these occupations particularlyappealing.
Figure 4: Convergence of the simulation to the Colombian 2014 unemployment rate -9.6%
Another interesting aspect of the model is its ability to produce a declining hazard injob finding rates (figure 5). This effect is due in part to the fact that the most commonvacancies are the ones to which there are more applications, leading many workersto match to jobs quite rapidly. Once those vacancies are filled, the opportunities foremployment in the remaining occupations are more homogeneous, in which case wagevariation and relative productivity advantages both have the potential to become moreimportant. The fact that workers still find jobs at a relatively high rate from iterations

27
Table 5: Results for the base scenario and policy impact evaluation
Baseline simulationTraining in the firm Technological change Training for unemployed
High Skill Job High skill worker 33.1 37.5 33Medium Skill worker 54.4 13.7 45.7Low Skill Worker 12.5 48.8 21.3
Medium Skill Job High skill worker 58.3 46.6 58.3Medium Skill worker 35.5 43 29.4Low Skill Worker 6.2 10.4 12.3
Low skill Job High skill worker 44.3 41.3 44.3Medium Skill worker 30.1 29.7 29.1Low Skill Worker 25.6 29 26.6
10-30 may suggest that, once the easy-to-find jobs are gone, workers do sort to thetypes of jobs where they have a productivity advantage. As the number of simulationsincreases, however, wage variation becomes more important. The relatively high payingremaining jobs have few vacancies but will be oversubscribed, leading to even lowerhazard rates into employment.
Figure 5: Variation of the hazard into employment rate
Analyzing the actual matching process, the most skilled individuals have the shortedunemployment spells, while low skilled workers have the longest spells. High skilledworkers apply to, and are matched with, the very common medium and low skilled

28
vacancies first. Medium and low skilled individuals match in the middle and latteriterations of the game, once the competition from high-skilled workers clears out. Thisis a direct implication of job seekers behaving non-strategically. If high skilled workersconsidered that they would beat all other workers whose skill sets are less well adaptedfor the high productivity jobs, then they would not apply for the medium skilled jobs.Likewise, medium skilled workers would see the competition from high skilled workersevaporate for medium productivity jobs, and would thus apply there, leaving the lowproductivity jobs to the low skilled workers.
Among the two policy evaluated, the technological change counterfactual does a betterjob at reducing the allocative inefficiency of the labor market. This is mainly becausethe effect opens up the more common occupation to a larger set of individuals, makingthe more skilled individuals compete along dimensions other than skills for the mediumproductivity jobs. As they lose out on these jobs they are more likely to apply forhigher skill jobs, for which they have a comparative advantage. This suggests thatalthough technological change can improve the efficiency of the allocation, it does soat the expense of longer unemployment spells for high skilled workers.
The second policy simulation is less effective at inducing reallocation, since the highskilled workers already have enough skills to meet the criteria for high-productivityjobs, while training allows low skilled workers to be competitive for the better-paidhigh productivity jobs that were previously inaccessible. This highlights the role ofdispersion in skills for the matching process. When the lower tail of the distributionshifts upward, workers become more similar and it becomes less likely that workersendogenously match in an assortative manner with firms. However, although sorting isless present, total output increases as less output is wasted in training underqualified in-dividuals to reach a skill level sufficient to perform higher productivity jobs well.
5 Conclusion
This paper has presented a model in which skills are multidimensional and skills mis-match occurs as a result of optimizing behaviors of workers and firms. Workers applyfor jobs in a way that maximizes their subjective expected utility, although they behavein a naive manner by not taking into account the strategic job application decisions oftheir competitors. Firms post wages for a given number of vacancies and select amongapplicants based (initially) on the appropriateness of their skill sets for the job on offerin a manner that maximizes profits. Numerically solving for the equilibrium allocationshows that although each agent behaves optimally, the socially optimal allocation ofworkers to jobs is not reached, primarily due to the naive behavior of workers. This re-

29
sult helps explain why job search assistance is among the most effective type of activelabor market program, as it allow workers to better assess their chances of finding a joband to better target vacancies for job applications.
Although the model studied here relies on limited rationality and relatively straight-forward behavior on behalf of all labor market participants, it does a reasonably goodjob of reproducing certain stylized facts (higher wages for more skill-intensive occupa-tions, decreasing hazard rates into employment, longer unemployment durations for lessskilled workers). Moreover, the model specification makes implementation of skills-based policy simulations straightforward. The main drawback of the model, however,is the lack of an analytical solution to the equilibrium allocation of workers to firms.Introducing fully rational agents could also extend the model, although it is less clearwhether such an extension would render the model more realistic. On the data side,estimating the model for Colombia has some major advantages (availability of data),but also so disadvantages (coverage of job offers). Nevertheless, this paper has shownthat one can gain interesting insights into labor market behavior and outcomes evenwhen introducing the complexity of multidimensional skills, and many extensions ofthe model can be envisioned to both make it more realistic and more easy to solveanalytically.

30
References
Albrecht, James, Lucas Navarro, and Susan Vroman, “The Effects of Labour Mar-ket Policies in an Economy with an Informal Sector,” Economic Journal, 07 2009,119 (539), 1105–1129.
Almeida, Rita, Jere Behrman, and David Robalino, eds, The Right Skills for the Job?
Rethinking Training Policies for Workers, Washington, DC: The World Bank, 2012.
Becker, Gary S., “Investment in Human Capital: A Theoretical Analysis,” Journal of
Political Economy, 1962, 70, 9.
Card, David, Jochen Kluve, and Andrea Weber, “Active Labour Market Policy Eval-uations: A Meta-Analysis,” Economic Journal, November 2010, 120 (548), F452–F477.
Dupuy, Arnaud and Alfred Galichon, “Personality Traits and the Marriage Market,”Journal of Political Economy, 2014, 122 (6), 1271 – 1319.
Felstead, Alan, Duncan Gallie, Francis Green, and Ying Zhou, “Skills at Work,1986 to 2006,” 2007.
Heckman, James J., Jora Stixrud, and Sergio Urzua, “The Effects of Cognitive andNoncognitive Abilities on Labor Market Outcomes and Social Behavior,” Journal of
Labor Economics, July 2006, 24 (3), 411–482.
John, Oliver P and Sanjay Srivastava, “The Big Five trait taxonomy: History, mea-surement, and theoretical perspectives,” Handbook of personality: Theory and re-
search, 1999, 2 (1999), 102–138.
Lazear, Edward P., “Firm-Specific Human Capital: A Skill-Weights Approach,” Jour-
nal of Political Economy, October 2009, 117 (5), 914–940.
Margolis, David, Lucas Navarro, and David A Robalino, Unemployment Insurance,
Job Search, and Informal Employment, June, 2012.
Margolis, David N. and Véronique Simonnet, “Technical/professional versus generaleducation, labor market networks and labor market outcomes,” International Journal
of Manpower, August 2002, 23 (5), 471 – 492.
Miller, Robert A, “Job Matching and Occupational Choice,” Technical Report 6 De-cember 1984.
Moen, Espen R, “Competitive search equilibrium,” Journal of Political Economy,1997, 105 (2), 385–411.

31
Montgomery, James D, “Social Networks and Labor-Market Outcomes: Toward anEconomic Analysis,” American Economic Review, December 1991, 81 (5), 1407–18.
Mortensen, Dale T and Christopher A Pissarides, “Job Creation and Job Destructionin the Theory of Unemployment,” Review of Economic Studies, July 1994, 61 (3),397–415.
Mortensen, Dale T. and Tara Vishwanath, “Personal contacts and earnings : It is whoyou know!,” Labour Economics, March 1994, 1 (2), 187–201.
Perry, Guillermo, William Maloney, Omar Arias, Pablo Fajnzylber, Andrew Ma-son, and Jaime Saavedra-Chanduvi, Informality: Exit and Exclusion, Washington,DC: The World Bank, 2007.
Stops, Michael, “Job matching across occupational labour markets,” Oxford Economic
Papers, 2014, p. gpu018.
and Thomas Mazzoni, “Matchingprozesse auf beruflichen Teilarbeitsmärkten/JobMatching on Occupational Labour Markets,” Jahrbücher für Nationalökonomie und
Statistik, 2010, pp. 287–312.

32
A Tables and figures
Table A.1: Gender Preferences by Colombian Firms
Gender %
Female 3.46%Both Genders 6.53%Male 8.83%Does not specify 81.18%
Table A.2: Experienced required by vacancies
Experience required %
Less than a year 48.34%At least 1 year 37.23%At least 2 year 7.94%At least 3 year 2.49At least 4 year 60.0%At least 5 year 135.0%At least 6 year 166.0%At least 7 year 10.0%At least 8 year 9.0%At least 9 year 1.0%At least 10 year 16.0%More than ten years 3.0%
33
Tabl
eA
.3:W
ages
offe
red
and
educ
atio
nala
ttai
nmen
treq
uire
d
Wag
esO
ffer
edN
one
Ele
men
tary
Mid
scho
olH
igh-
scho
olVo
catio
nalE
duca
tion
Adv
ance
dVo
catio
nale
duca
tion
Bac
helo
rSp
ecia
lizat
ion
Adv
ance
dM
aste
rPh
D
less
than
$550
.000
0.0%
0.9%
3.3%
2.5%
2.4%
1.9%
1.9%
0.4%
0.2%
0.0%
550.
001−
1.00
0.00
089
.9%
80.2
%84
.0%
83.1
%69
.6%
61.0
%32
.0%
2.6%
9.4%
11.3
%1.
000.
001−
1.50
0.00
09.
2%16
.0%
6.6%
12.0
%20
.2%
26.8
%29
.3%
4.3%
8.0%
4.2%
1.50
0.00
1−2.
000.
000
0.0%
2.9%
2.7%
1.7%
4.5%
6.2%
15.0
%14
.0%
9.9%
1.4%
2.00
0.00
1−2.
500.
000
0.0%
0.0%
0.7%
0.2%
1.5%
2.0%
7.9%
21.8
%13
.3%
2.8%
2.50
0.00
1−3.
000.
000
0.0%
0.0%
0.0%
0.2%
1.0%
0.9%
4.4%
13.4
%20
.3%
5.6%
3.00
0.00
1−3.
500.
000
0.0%
0.0%
0.0%
0.2%
0.3%
0.4%
4.2%
8.7%
10.2
%2.
8%3.
500.
001−
4.00
0.00
00.
0%0.
0%0.
0%0.
0%0.
3%0.
3%2.
9%11
.4%
8.5%
4.2%
4.50
0.00
1−5.
500.
000
0.0%
0.0%
2.2%
0.0%
0.1%
0.2%
0.9%
9.4%
4.4%
2.8%
5.50
0.00
1−6.
000.
000
0.0%
0.0%
0.5%
0.0%
0.0%
0.1%
0.4%
4.7%
4.6%
38.0
%6.
000.
001−
8.00
0.00
00.
0%0.
0%0.
0%0.
0%0.
1%0.
1%0.
7%5.
2%4.
4%4.
2%$
8.00
0.00
1an
dm
ore
0.9%
0.0%
0.0%
0.0%
0.1%
0.1%
0.4%
4.2%
6.8%
22.5
%

34
Tabl
eA
.4:W
ages
offe
red
and
year
sofe
xper
ienc
ere
quir
ed
[htb
p]
Wag
esL
esst
han
1ye
arof
expe
rien
ceA
tlea
st1
year
ofex
peri
ence
Atl
east
2ye
arso
fexp
erie
nce
Atl
east
3ye
arso
fexp
erie
nce
Atl
east
4ye
arso
fexp
erie
nce
5ye
arso
fexp
erie
nce
orm
ore
Les
stha
n$5
50.0
001.
5%0.
5%0.
0%0.
0%0.
0%0.
0%55
0.00
1−1.
000.
000
38.6
%25
.7%
2.4%
0.4%
0.1%
1.9%
1.00
0.00
1−1.
500.
000
7.7%
7.4%
1.9%
0.5%
0.1%
0.3%
1.50
0.00
1−2.
000.
000
1.3%
2.2%
1.1%
0.4%
0.1%
0.1%
2.00
0.00
1−2.
500.
000
0.4%
0.7%
0.7%
0.4%
0.1%
0.1%
2.50
0.00
1−3.
000.
000
0.2%
0.4%
0.4%
0.2%
0.0%
0.1%
3.00
0.00
1−3.
500.
000
0.1%
0.5%
0.2%
0.1%
0.1%
0.1%
3.50
0.00
1−4.
000.
000
0.0%
0.2%
0.1%
0.1%
0.1%
0.1%
4.50
0.00
1−5.
500.
000
0.0%
0.1%
0.0%
0.0%
0.0%
0.1%
5.50
0.00
1−6.
000.
000
0.0%
0.0%
0.0%
0.0%
0.0%
0.0%
6.00
0.00
1−8.
000.
000
0.0%
0.0%
0.0%
0.0%
0.0%
0.1%
$8.
000.
001
and
mor
e0.
0%0.
0%0.
0%0.
0%0.
0%0.
1%

35
Table A.5: Share of working population by activity
2012 2013 2014
Agriculture 0.92% 0.88% 0.80%Mining 0.32% 0.32% 0.33%Manufacturing 16.98% 16.28% 16.10%Energy 0.51% 0.53% 0.55%Construction 6.59% 6.19% 6.29%Comerce 30.55% 30.69% 30.58%Transport 9.69% 9.48% 9.29%Finance Intermediation 2.02% 2.21% 2.18%House rent and otheractivities
10.29% 10.79% 11.17%
Services (personal and social) 22.15% 22.61% 22.71%
Souurce: DANE household Income Survey (GEIH)
Table A.6: Channels for job searching
Means for searchingpersonal
Industry Trade Services
Informal networks 23.80% 26.90% 18.00%Databases / own records 17.40% 18.30% 18.70%Web job boards 16.70% 13.70% 20.20%
National Apprenticeship Service (SENA ) -Public Employment Service
12.30% 13.70% 10.40%
Advertising on media 12.20% 10.80% 10.40%
Job Boards of Universities and otherorganizations
8.40% 6.90% 10.80%
Headhunters / Job boards 6.70% 6.50% 6.70%
Contact with other educationalinstitutions
2.10% 2.70% 4.00%
Job Fairs 0.50% 0.50% 0.80%
Source: Households Income Survey. DANE (2014)