managing quality under heterogeneous consumer demand...
TRANSCRIPT

Managing Quality under Heterogeneous Consumer Demand and Product Quality
Miguel Carriquiry and Bruce A. Babcock
Working Paper 05-WP 410 October 2005
Center for Agricultural and Rural Development Iowa State University
Ames, Iowa 50011-1070 www.card.iastate.edu
Miguel Carriquiry is a postdoctoral research associate and Bruce Babcock is director and professor of economics at the Center for Agricultural and Rural Development, Iowa State University. This paper is available online on the CARD Web site: www.card.iastate.edu. Permission is granted to reproduce this information with appropriate attribution to the authors. Questions or comments about the contents of this paper should be directed to Bruce Babcock, 578 Heady Hall, Iowa State University, Ames, IA 50011-1070; Ph: (515) 294-6785; Fax: (515) 294-6336; e-mail: [email protected]. Supported in part by the Agricultural Marketing Resource Center, Iowa State University. The U.S. Department of Agriculture (USDA) prohibits discrimination in all its programs and activities on the basis of race, color, national origin, gender, religion, age, disability, political beliefs, sexual orientation, and marital or family status. (Not all prohibited bases apply to all programs.) Persons with disabilities who require alternative means for communication of program information (Braille, large print, audiotape, etc.) should contact USDA’s TARGET Center at (202) 720-2600 (voice and TDD). To file a complaint of discrimination, write USDA, Director, Office of Civil Rights, Room 326-W, Whitten Building, 14th and Independence Avenue, SW, Washington, DC 20250-9410 or call (202) 720-5964 (voice and TDD). USDA is an equal opportunity provider and employer. Iowa State University does not discriminate on the basis of race, color, age, religion, national origin, sexual orientation, gender identity, sex, marital status, disability, or status as a U.S. veteran. Inquiries can be directed to the Director of Equal Opportunity and Diversity, 3680 Beardshear Hall, (515) 294-7612.
Abstract
Based on accepted advances in the marketing, economics, consumer behavior, and
satisfaction literatures, we develop a micro-foundations model of a firm that needs to
manage the quality of a product that is inherently heterogeneous in the presence of
varying customer tastes or expectations for quality. Our model blends elements of the
returns to quality, customer lifetime value, and service profit chain approaches to
marketing. The model is then used to explain several empirical results pertaining to the
marketing literature by explicitly articulating the trade-offs between customer satisfaction
and costs (including opportunity costs) of quality. In this environment firms will find it
optimal to allow some customers to go unsatisfied. We show that the relationship
between the expected number of repeated purchases by an individual customer is
endogenous to the choice of quality by the firm, indicating that the number of purchases
cannot be chosen freely to estimate a customer’s lifetime value.
Keywords: consumer satisfaction, heterogeneous customers, quality expectations, quality
heterogeneity, quality management, repeated purchases
MANAGING QUALITY UNDER HETEROGENEOUS CONSUMER DEMAND AND PRODUCT QUALITY
That maximizing product quality and consumer satisfaction does not lead to
maximum profits is now widely recognized (Rust, Zahorik, and Keiningham 1995;
Zeithaml 2000; Spence 1975). However, managing and linking quality and profitability
presents several challenges (Zeithaml 2000), especially when quality cannot be easily
measured or communicated and a firm’s customers are heterogeneous in their tastes for
quality. The marketing literature asserts that quality deviations in mature industries,
where suppliers’ quality is better known, will have less impact on profits than will
variations in quality for new firms’ industries (e.g. Anderson, Fornell, and Lehmann
1994; Bolton 1998). The success or failure of new firms is often dependent on whether
they are seen as dependable and trustworthy.
One way that firms can build their reputation is to avoid disappointing their
customers. However, firms have incomplete control over whether any particular customer
is disappointed because different customers have different disappointment thresholds.
And for many products, quality variability is an inherent trait that cannot be completely
controlled. Incomplete knowledge of customer tastes and incomplete control over quality
means that firms need to carefully consider how best to manage customer expectations
and control of quality.
The role of customer perception of quality, satisfaction, and repurchase behavior
and their impact on firm success has been the focus of a large amount of work in the
marketing, psychology, and economics literatures. Several models have been proposed to
2
infer how customers form expectations and perceptions of quality and how these interact
to affect overall satisfaction and repurchase intentions (Anderson and Sullivan 1993;
Zeithaml, Berry, and Parasuraman 1996). It is commonly accepted that satisfaction is a
precursor of repurchase intentions and behavior (Oliver 1997). It is also asserted (Rust
and Oliver 2000; Oliver 1997; Anderson and Sullivan 1993) that satisfaction is driven by
disconfirmation of expectations, in what is known as the expectancy disconfirmation
model.
The link between service quality and profits is neither straightforward nor simple
because benefits from higher quality do not generally accrue in the short run, and many
steps and variables (pricing, competition, expectations, and intentions) can mediate them
(Zeithaml 2000). Several studies show that satisfaction with a firm’s products increases
the probability that a customer will repeat a purchase with the firm (Anderson, Fornell,
and Lehmann 1994; Bolton 1998; Bolton, Kannan, and Bramlett 2000), and that small
changes in the retention rate of a company can have a large effect on its profitability (e.g.,
Reichheld and Sasser 1990; Anderson, Fornell, and Lehmann 1994). Firms with higher
retention rates will likely increase their volume of customers, and some authors
(Reichheld 1996) argue that the per-period profitability of customers is higher than that
of newly acquired ones. This latter assertion has been challenged as an oversimplification
(Dowling and Uncles 1997; Reinartz and Kumar 2000).
Quality expectations are formed based on the interactions of myriad factors, both
internal and external (Oliver 1997). The external sources on which expectations are
formed include word of mouth, third-party information, and product cues such as price
and scarcity. Oliver (1997) notes that consumers will, at least for many products, analyze
3
the cues available and form different expectations about how the product ought to
perform. Hence, it is possible that a unit of the product is satisfactory for some but not all
consumers. This is especially true for customized as opposed to standardized services
(Anderson, Fornell, and Rust 1997).
Food companies, in particular, are vulnerable to unexpected quality deviations
and customer expectations. Quality attributes of raw crop and animal ingredients vary by
year, region, and farmer. And a wide customer base means that food companies face a
wide distribution of expectations about product quality. As new companies and products
are developing to take advantage of this quality and taste variability, a better
understanding of the relationship between quality control, customer disappointment, and
profits is needed. Our contribution to improved understanding is the development of an
analytical framework based on microeconomic foundations that can be used to examine
the trade-offs involved in trying to balance the costs and benefits of quality control with
the costs of disappointing customers.
In this paper, we analyze how quality improvement and classification can be used
as defensive marketing strategies (Fornell and Wernerfelt 1988) to manage the number of
dissatisfied customers. As such the paper is related to the returns on quality (ROQ)
framework proposed by Rust, Zahorik, and Keiningham (1995). The ROQ framework
was proposed as a method of objectively evaluating the rate of return to quality
improvement efforts. The ROQ method and the one set forth by Rust and Zahorik (1993)
link perceived quality to customer retention through a regression equation. Our approach
differs in that we are explicit in the micro-foundation of the quality management problem
and incorporate consumers and quality heterogeneity inherent in production. We
4
recognize that investment can change the distribution of product quality, which in turn
interacts with the distribution of customer expectations. In our approach, the optimal
distribution of quality is solved for in terms of firm choice of quality control or
classification, and only products that meet a chosen standard are marketed under the
firm’s brand.
The framework is developed in the context of a differentiated food product, the
quality of which depends on quality attributes of raw ingredients supplied by an upstream
farmer or alliance of farmers. Such alliances are developing as farmers attempt to move
closer to the final consumer by producing ingredients that are differentiated by some
experience or credence attributes.1,2 The model developed is useful not only as the basis
for a tool for managers to optimally select the quality of the product that they will sell
under the firm’s name in the market, but also to predict how the optimal choice of quality
should change in response to variations in the economic environment. As we will see,
many of the predictions of the model are supported by previous empirical work. Our
model also can be used to explain many of the difficulties encountered in linking quality
and profitability.
We also build on the customer lifetime value (CLV) literature by making the
expected lifetime value of an individual customer dependent on firms’ decisions. In that
line, the choice of the firm affects the probability that a customer is disappointed, which
in turn is the foundation (through the retention rates) of the aggregate measures of CLV
or customer equity proposed by Blattberg and Deighton (1996) and by Berger and Nasr
1 The terms “search” and “experience” were introduced by Nelson (1970). The term “credence attributes” was coined by Darby and Karni (1973). For search and experience attributes, consumers can gain information about product quality before or after consumption respectively. Quality cannot be learned by consumers (even after consumption) for credence attributes. 2 A partial list is organic, natural, tender beef, and free range.
5
(1998). Hence, we partially tackle the challenge posed by the latter authors, who called
for analytical models that incorporate factors underlying the repeat purchase probability
and level of customer satisfaction.
The Model
We model the interaction of endogenous product quality and consumer
expectations to determine the probability of future purchases, which in turn affects the
profitability of the firm. A firm purchases an input of heterogeneous quality that can be
processed into a product that commands a price-premium over the commodity alternative.
The quality of output is influenced by that of the input, leading to heterogeneous output
quality. Output quality can be learned, say, through testing, at a cost of C per unit.
Results of the tests are then used to decide whether the product should be sold as a
premium product or sold as a commodity product at the prevailing price. We assume that
the results of the test cannot be released in a meaningful manner to consumers. That is,
the test cannot be used to signal quality other than by claiming that it is performed and
that only high-quality inputs are used in processing. The impact of the claim depends
then on the processor’s reputation.
The desired trait is an experience good. Hence, to ascertain product quality,
consumers have to purchase and use the product. Consumers are heterogeneous with
regard to their tastes in that they differ on the level of quality that they deem acceptable
given their purchase decision.3 Qualities higher than that level will induce a repeat
purchase from that consumer, whereas qualities that fall short of that consumer’s
3 An alternative interpretation is that all consumers agree on what quality should be delivered by that given premium, but they differ in their tolerance to quality deviations or have a different zone of tolerance (Parasuraman, Berry, and Zeithaml 1991; and Zeithaml, Berry, and Parasuraman 1993).
6
expectations will lead the consumer to stop purchasing the product.4 We assume as in
Rust and Oliver (2000) that satisfaction is driven by disconfirmation, where negative
disconfirmations result in larger changes of customer behavior than do positive
disconfirmations (Anderson and Sullivan 1993). A satisfied customer will keep
purchasing, whereas a negative disconfirmation will lead to dissatisfaction and no future
purchase.
Suppose that measurements of output quality can be condensed into an index q ,
where higher values represent higher quality. As in Fornell and Wernerflet (1988) we
assume a constant and exogenous5 premium of p per unit over a non-differentiated
substitute (commodity) product. If after purchasing and consuming the product a
consumer disagrees with the statement of the seller, that is, the product falls short of the
expected quality, then the consumer imposes a punishment on the producer of δ
(interpreted below) per certified unit. Assume also that news does not spread throughout
the market instantaneously (as in Klein and Leffler 1981; and Shapiro 1983). Only buyers
whose expectations were not met leave the firm (Fornell and Wernerflet 1988).
If the expectations of consumers are equal and known by the producer, then with
repeated purchases there is an equilibrium where high quality is provided to the market at
a price above marginal production costs (Klein and Leffler 1981; Shapiro 1983;
4 Thus, customers would be lost-for-good (Jackson 1985). Jackson categorized industrial buyers into lost-for-good, and always-a-share. In the former category, customers are assumed to be committed to the seller until they are lost, whereas in the latter category, buyers adjust the share of business they do with different sellers. 5 Abstracting from price competition allows us to keep the model simple and analyze the choice of quality for markets that differ in their profit margins. The price can be easily endogeneized if required by assuming a demand function.
7
Grossman 1981).6 One could argue that once the processor learns q , it can just reveal the
results of the test, set a premium for each product ( )p q , and allow buyers to self-select.
This would imply that the producer knows the consumer willingness to pay for each
available quality, and that consumers can determine the value of q they expect. The two
assumptions are highly problematic in many practical situations.7 In the same line, the
optimal number of classes is an open question that we discuss in the extensions at the end
of this article. Here we focus on the problem of selecting a certification threshold q̂ for
only two classes. Either the product is certified or it is not.
A given q can be rated as either satisfactory or not satisfactory for different
consumers and/or circumstances, based on consumers’ expectations for quality. Many
factors can affect the expectations and experience that is rated as acceptable both within
and across consumers. If consumers who are willing to pay a premium are homogeneous
with respect to the (known) quality that meets their expectations, the problem of the firm
is very simple: It can just certify products known to be satisfactory, and compare the
revenues (given by the premiums and proportion of product certified) against certification
costs, to see whether a niche marketing venture is warranted.8 We delay a formal proof of
this claim until the relevant notation has been introduced.
6 Relaxing this, Antle (2001) argued that when preferences are tightly concentrated around a central value of a distribution, and producing a variety of products is costly, firms will concentrate in qualities around that central value. Rob and Sekiguchi (2001) provide a model where producers can only affect the distribution of quality, but the acceptable quality level is known. 7 An example is beef tenderness measurement. Researchers are just starting to uncover consumers’ willingness to pay for tenderness, focusing mostly on the premiums for guaranteed tenderness and not on levels of it (an exception is Miller et al., 2001). 8 This is true if the loss from cheating is higher than the premium obtained in a single period (more on this below). See for example Klein and Leffler (1981), or Shapiro (1983).
8
In general, however, consumers in the target population differ in the quality that
meets their expectations. This heterogeneity is captured by jy , which represents
consumer j ’s tastes, minimum tolerance level for performance, expected quality
perception, or “type.” Consumer i will be less demanding in terms of quality than
consumer j whenever i jy y< . The producer does not know the type of any particular
consumer. He/she only knows that the distribution of types can be represented by
( )g y p ,9 where we condition to reflect our assumption that the performances that will be
considered acceptable depend on the premium charged. The distribution of types may
also be conditioned on demographic characteristics of the targeted customers, if the
information is available. Any consumer who buys a particular certified product is seen as
a random draw from that probability distribution.
The unconditional (ex ante to testing) distribution of q is ( )f q . A certified
product that tests q will meet the expectations of a consumer approaching the firm if
y q≤ . If y q> , he/she will be disappointed and will not repeat the purchase. For a unit
that tests q , the probability that it satisfies a random customer is given by
( ) ( )PrY y q p G q p≤ = , where ( )G pi is the cumulative distribution function of quality
acceptability levels for premium p . The problem of the firm is to choose a threshold for
certification q̂ . Since higher values of q are associated with higher probability of
acceptability by consumers, every product with ˆq q≥ will be certified. This leads to the
distribution of qualities of certified products ( )ˆf q q q≥ .
9 A similar description of heterogeneity, but in a food safety setting where households make decisions under the belief that health risks follow a given distribution, is presented in Antle (2001).
9
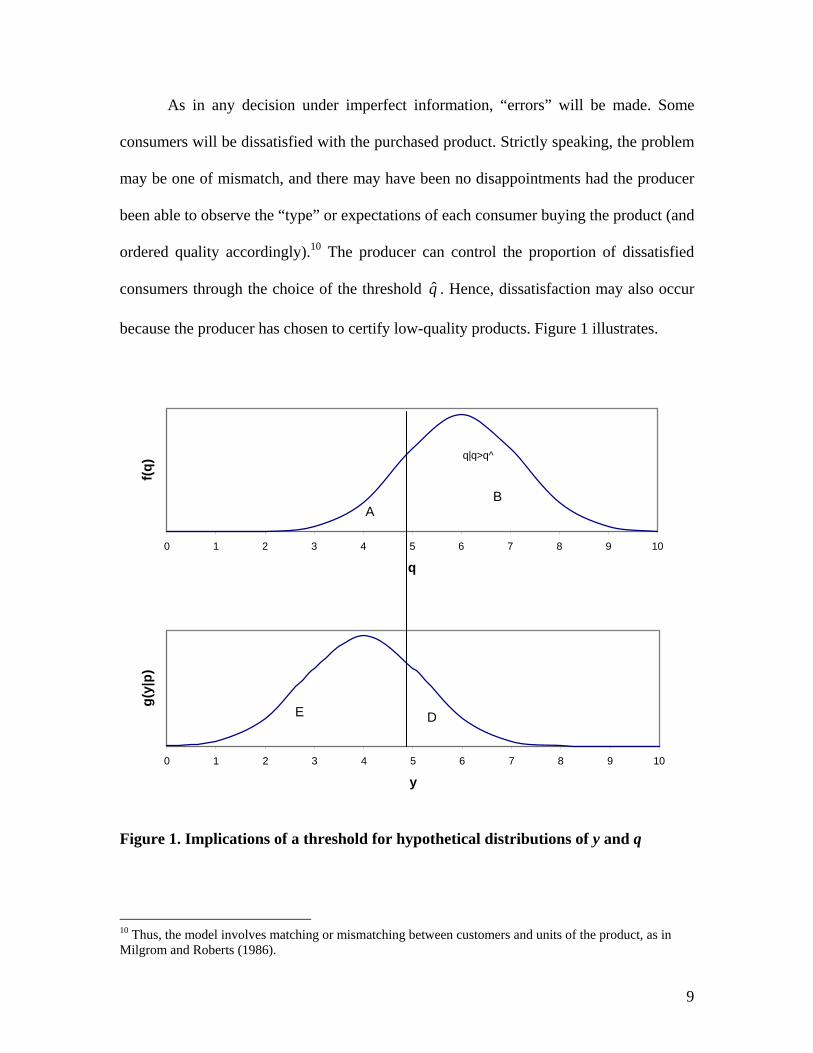
As in any decision under imperfect information, “errors” will be made. Some
consumers will be dissatisfied with the purchased product. Strictly speaking, the problem
may be one of mismatch, and there may have been no disappointments had the producer
been able to observe the “type” or expectations of each consumer buying the product (and
ordered quality accordingly).10 The producer can control the proportion of dissatisfied
consumers through the choice of the threshold q̂ . Hence, dissatisfaction may also occur
because the producer has chosen to certify low-quality products. Figure 1 illustrates.
0 1 2 3 4 5 6 7 8 9 10
q
f(q)
AB
q|q>q^
0 1 2 3 4 5 6 7 8 9 10
y
g(y|
p)
E D
Figure 1. Implications of a threshold for hypothetical distributions of y and q
10 Thus, the model involves matching or mismatching between customers and units of the product, as in Milgrom and Roberts (1986).
10
The vertical line in Figure 1 represents a hypothetical threshold, and region B
represents the product that will be certified as high quality. Whereas consumers whose
tastes belong to region E will be assured 100% satisfaction, some consumers from region
D will be disappointed. Also, some of the non-certified product (region A) would have
been found acceptable by some consumers with tastes falling in region E.
When a certified product fails to meet the expectations of a consumer, this leads
to a punishment of δ if purchased by that consumer, and thus profits of p C δ− − . This
punishment could represent the net present value (NPV) of the consumer’s future
purchases or it could represent restitutions or replacements to the consumer such as
would occur with a money-back guarantee.11 It could also represent the cost of replacing
a disappointed consumer.12 Denial of certification entails only testing costs, whereas
correct certification (in the sense that the consumer is satisfied with the purchased
product) brings a net benefit of p C− . When the producer observes a given ˆq q≥ (and
hence certifies the product), he/she obtains expected profits per unit given by
( ) ( ) ( ) ( ) ( )Pr PrY Y Y YE q E p C y q y q E p C y q y qπ δ= − ≤ ≤ + − − > > ,
where YE is the mathematical expectations operator with respect to the variable y .
Using the notation introduced above, expected profits can be rewritten as
( ) ( ) ( ) ( )( ) ( )( )1YE q p C G q p p C E y q G q pπ δ= − + − − > − . (1)
11 Note, however, that for most foods, a money-back guarantee is not likely to be profitable (Davis, Gerstner, and Hagerty 1995). The NPV interpretation is common in the customer satisfaction literature (Oliver 1997). It is also the basis for the CLV literature (e.g., Jain and Singh 2002; Berger and Nasr 1998) 12 Caswell and Henson (1997) argued that the losses associated with customer dissatisfaction (e.g., market share, bad reputation) are costlier for firms than those resulting from legal action under the current tort law.
11
This is the average of the profits obtained from sales of certified product
measuring q to an ex post satisfied or dissatisfied consumer, respectively, weighted by
the probability of each event. Averaging over the acceptance region, expected profits are
( ) ( )( ) ( )( )ˆ ˆ1Q YE q q E p G q p E y q C q qπ δ≥ = − − > − ≥ .
For a product yielding ˆq q< , certification is denied and expected profits (losses)
per unit over the denial of certification region are ( )ˆE q q Cπ < = − , the costs of
conducting the test. This equation assumes that the commodity market price just covers
the producer’s production and processing costs (we ignore fixed costs).
Now we have all the elements needed to write the per unit profit function of a
firm that implements a quality-guaranteed certification system with threshold q̂ :
( ) ( ) ( ) ( ) ( )
( )( ) ( )( ) ( )
ˆ ˆ ˆ ˆ ˆPr Pr
ˆ ˆ1 Pr .
Q Q
Q Y Q
E q E q q q q E q q q q
E p G q p E y q q q q q C
π π π
δ
= ≥ ≥ + < <
= − − > ≥ ≥ − (2)
Equation (2) shows that, in general, the optimal threshold will depend on the
objective of the producer, the price premium and punishments, the distribution of types
(or quality expectation) in the target population of consumers, and the distribution of
quality of the output produced and/or marketed. The costs of testing and certification play
no role in determining the optimal threshold but determine whether the enterprise is
profitable. Equation (2), together with Figure 1, also makes clear the trade-offs involved.
Ceteris paribus, more stringent certification levels lead to higher profits from each
certified product because of a reduction in expected punishments. This can be seen by
noting the reduction in area D in Figure 1 or the increase in the ( )ˆQE q qπ ≥ term in
equation (2). But the proportion of product certified given by ( )ˆPrQ q q≥ or area B is
12
reduced, and the number of units of products that were not certified but would have
satisfied some customers is increased. The latter can be seen as an increase of areas A and
E in Figure 1.
We assume that consumers are homogeneous in tastes, but the way in which they
form their expectations about quality interacts with other factors that can vary with each
consumption situation (Oliver 1997). An example is the expectation about a meal eaten at
a restaurant interacting with the dining environment or the entrée served. This leads to
heterogeneity in acceptability levels (or acceptable perceptions) among consumers.
Distinct y ’s are the result of different shocks that affect the level of quality that different
consumers will rate acceptable in any time period. Shocks are independent within and
across time periods. In this situation, each customer is valued the same in expectations,
because someone very demanding in the current period may be easy to please in the next
period. We show how to relax this assumption in the extensions section. When the cost of
losing any consumer is the same across consumers, equation (1) simplifies to
( ) ( )( ) ( )( )( ) ( )( )1 1E q G q p p C G q p p C p G q p Cπ δ δ= − + − − − = − − − .
Suppose first that the producer is striving to maximize profits. In this case, the
optimal threshold for certification is defined as the level that maximizes expected profit
( )ˆE qπ from testing and certification, which is given by
( ) ( )( )( ) ( )
( )( ) ( )( ) ( )ˆ
ˆ ˆ ˆ1 Pr
ˆ1 1 .
Q
q
E q E p G q p q q q q C
p F q G q p dF q C
π δ
δ∞
= − − ≥ ≥ − =
− − − −∫ (3)
In this expression, ( )F i is the cumulative distribution function of q , and the
integral represents the costs associated with not being able to match the results of the test
with consumers’ expectations. Those mismatches could be used to quantify how much
13
could be gained if the producer’s customers were targeted more effectively. Notice that
whereas costs are paid over all units tested, premiums are only obtained over certified
output. The relevance of this is that a certification program would only be feasible if
certification costs can be spread over a relatively large proportion of the output
(especially when premiums are not large).13
We now turn to the choice of the optimal threshold. We claimed that if
consumers’ acceptability perceptions were fixed and known ( )y , the optimal threshold
entails choosing a value such that no customer will be disappointed (i.e., *q̂ y= ). The
next result (proved in the appendix) states this formally for both profit maximization and
minimization of expected costs of misclassification objectives.14
Result 1: If y y= is fixed, and pδ > , then setting the threshold at *q̂ y= is
optimal both under a profit maximization and expected cost of miclassification
minimization objectives. Only product known to be satisfactory will be certified.15
The current analysis helps to explain why research on the direct relationship
between customer satisfaction and profits has yielded both positive and no effects in
previous studies (Zeithaml 2000). In the case just presented, expected profits for the firm
are ( ) ( )( )ˆ 1E q p F y Cπ = − − . All customers of the firm will be satisfied, but the
profitability of the firm depends on the distribution of its output quality and on
customers’ expectations. While all customers will be satisfied with quality in this case,
13 As an example from the beef industry (Shackelford et al. 2001), if only 1/5 of the tested carcasses can be certified, and testing costs are $4 per animal, each certified carcass has to obtain a $20 premium for the system to break even. On the other hand, if 4/5 of the carcasses can be certified, the premium needed is reduced to $5 per carcass. 14 Since acceptable quality is known, the problem of minimizing errors in classification is trivial. 15 A similar result was found by Shapiro (1983) and Klein and Leffler (1981). However, these authors modeled a situation where product quality was homogeneous. Producers just needed to choose its level.
14
firms who can produce a higher portion of high-quality product will be more profitable.
Also, ceteris paribus, firms with a customer base that has lower quality expectations will
also be more profitable (note ( ) ( )
ˆ0
E qpf y
yπ∂
= − ≤∂
).
When there is heterogeneity in acceptable perceptions, the optimal threshold is
contingent on the distribution of perceptions and the objective pursued. In this case, the
necessary condition for maximizing profits is
( ) ( ) ( )( ) ( )
ˆˆ ˆ ˆ1 0
ˆE q
pf q G q p f qqπ
δ∂
= − + − =∂
. (4)
Sufficient conditions are ( )*ˆ 0g q p ≥ . The benefits obtained by marginally
increasing the threshold are due to a reduction in the proportion of customers that will
find the certified product unacceptable (also shown by the reduction of area D in Figure
1). Marginally increasing the thresholds also entails costs, since a smaller proportion of
the output will be sold in the high-value market (area B in Figure 1 is reduced).
Equation (4) indicates that the profit-maximizing threshold is implicitly defined
by ( )*ˆ pG q p δδ−
= . Hence, if any effort is to be put in sorting, the costs associated with
losing the business of a customer will be at least as large as the premium in a given
purchase. The formula also implies that it will be optimal for the producer to allow some
dissatisfaction for any finite punishment.
It is worth noting that the profit-maximizing threshold will no longer coincide
with the one that minimizes classification costs or mismatches. Equation (3) shows that
expected cash punishments are decreasing in the threshold, which implies that to
minimize this quantity, only output that will be found acceptable by every consumer
15
should be certified, which would only be profit maximizing for very large punishments
relative to the premium. More generally, there are two types of misclassification costs
associated with the two decisions certify and do not certify. For the certified output, we
already argued that the costs of misclassification arise because of consumer
dissatisfaction. For the non-certified product, the expected (opportunity) cost arises
because the product could have been sold for a premium to some consumers (recall
region A in Figure 1). The expected costs of misclassification (ECM) for threshold q̂ are
( )( )( ) ( ) ( )( ) ( )ˆ ˆ ˆ ˆ1 Pr PrQ QECM E G q p q q q q E pG q p q q q qδ= − ≤ ≤ + > > . (5)
It is straightforward to show that the threshold ( *ˆ Cq ) that minimizes equation (5)
is implicitly defined by the rule ( )*ˆ CG q pp
δδ
=+
, which differs from the threshold
obtained through profit maximization. Anderson, Fornell, and Lehmann (1994) reached a
similar conclusion by regressing measures of financial performance of Swedish firms (in
a variety of product and service industries) on customer-based measures such as quality,
expectations, and overall customer satisfaction. Errors in matching minimization in this
context are equivalent to assuming that both mistakes are equally costly, and
( )* 1ˆ 2EG q p = obtains.
The probabilities of product acceptance for the first two thresholds can be ranked
for arbitrary combinations of δ and p such that 0 p δ< ≤ as follows
( ) ( )* *ˆ ˆ 1CG q p G q p< < , which translates into * *ˆ ˆ Cq q< , implying that a more stringent
system will result if the objective is to minimize the expected costs of misclassifications.
The place in the ranking for threshold that minimizes the number of mismatches cannot
16
be determined in general. We can only say that ( ) ( )* *ˆ ˆE CG q p G q p≤ , and hence that
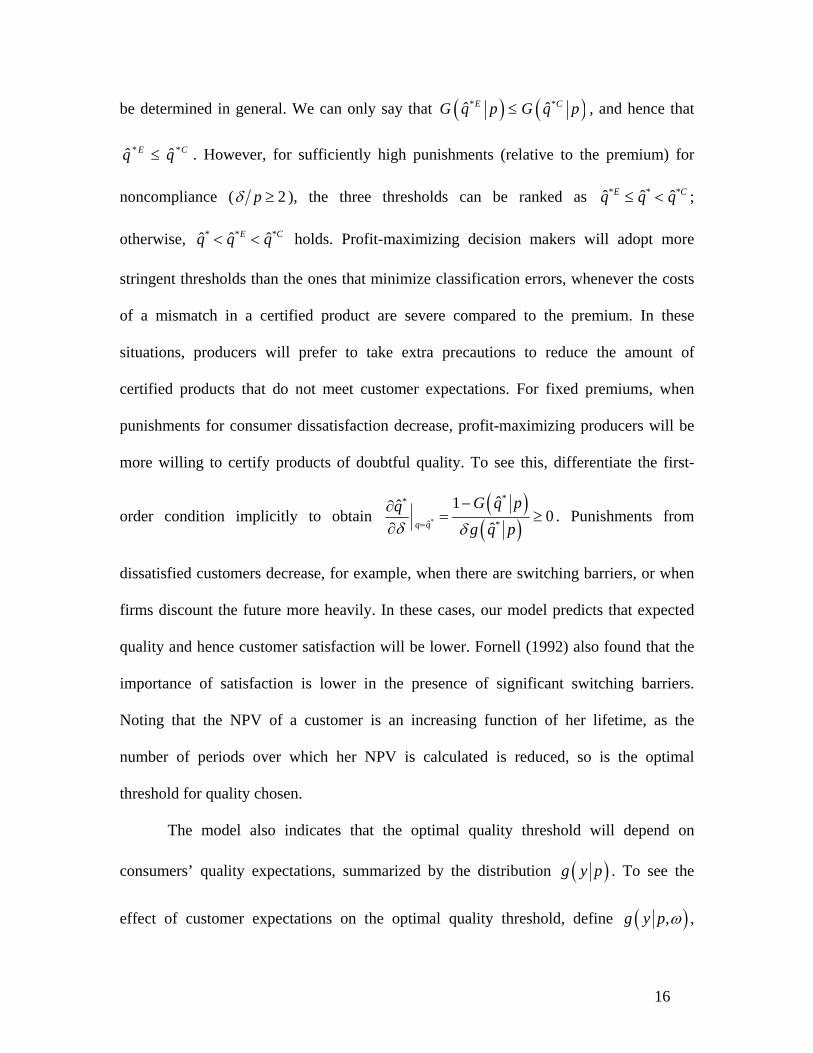
* *ˆ ˆE Cq q≤ . However, for sufficiently high punishments (relative to the premium) for
noncompliance ( 2pδ ≥ ), the three thresholds can be ranked as * * *ˆ ˆ ˆE Cq q q≤ < ;
otherwise, * * *ˆ ˆ ˆE Cq q q< < holds. Profit-maximizing decision makers will adopt more
stringent thresholds than the ones that minimize classification errors, whenever the costs
of a mismatch in a certified product are severe compared to the premium. In these
situations, producers will prefer to take extra precautions to reduce the amount of
certified products that do not meet customer expectations. For fixed premiums, when
punishments for consumer dissatisfaction decrease, profit-maximizing producers will be
more willing to certify products of doubtful quality. To see this, differentiate the first-
order condition implicitly to obtain ( )( )*
**
ˆ *
ˆ1ˆ0
ˆq q
G q pqg q pδ δ=
−∂= ≥
∂. Punishments from
dissatisfied customers decrease, for example, when there are switching barriers, or when
firms discount the future more heavily. In these cases, our model predicts that expected
quality and hence customer satisfaction will be lower. Fornell (1992) also found that the
importance of satisfaction is lower in the presence of significant switching barriers.
Noting that the NPV of a customer is an increasing function of her lifetime, as the
number of periods over which her NPV is calculated is reduced, so is the optimal
threshold for quality chosen.
The model also indicates that the optimal quality threshold will depend on
consumers’ quality expectations, summarized by the distribution ( )g y p . To see the
effect of customer expectations on the optimal quality threshold, define ( ),g y p ω ,
17
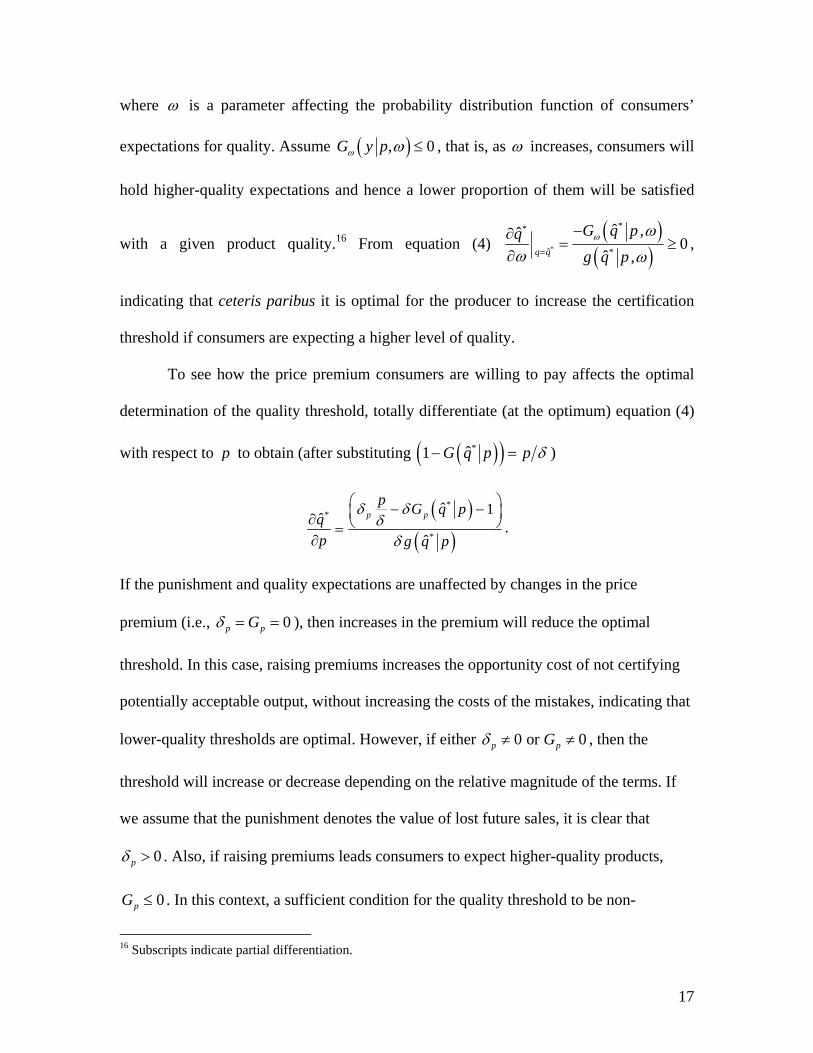
where ω is a parameter affecting the probability distribution function of consumers’
expectations for quality. Assume ( ), 0G y pω ω ≤ , that is, as ω increases, consumers will
hold higher-quality expectations and hence a lower proportion of them will be satisfied
with a given product quality.16 From equation (4) ( )
( )*
**
ˆ *
ˆ ,ˆ0
ˆ ,q q
G q pqg q pω ω
ω ω=
−∂= ≥
∂,
indicating that ceteris paribus it is optimal for the producer to increase the certification
threshold if consumers are expecting a higher level of quality.
To see how the price premium consumers are willing to pay affects the optimal
determination of the quality threshold, totally differentiate (at the optimum) equation (4)
with respect to p to obtain (after substituting ( )( )*ˆ1 G q p p δ− = )
( )
( )
**
*
ˆ 1ˆˆ
p pp G q p
qp g q p
δ δδ
δ
⎛ ⎞− −⎜ ⎟∂ ⎝ ⎠=∂
.
If the punishment and quality expectations are unaffected by changes in the price
premium (i.e., 0p pGδ = = ), then increases in the premium will reduce the optimal
threshold. In this case, raising premiums increases the opportunity cost of not certifying
potentially acceptable output, without increasing the costs of the mistakes, indicating that
lower-quality thresholds are optimal. However, if either 0 or 0p pGδ ≠ ≠ , then the
threshold will increase or decrease depending on the relative magnitude of the terms. If
we assume that the punishment denotes the value of lost future sales, it is clear that
0pδ > . Also, if raising premiums leads consumers to expect higher-quality products,
0pG ≤ . In this context, a sufficient condition for the quality threshold to be non-
16 Subscripts indicate partial differentiation.
18
decreasing in the premium is that the punishment is not inelastic with respect to the price
premium (i.e., 1ppδδ≥ ).17 Even if the size of the punishment does not change much in
response to a change in price, producers may be led to improve quality if they believe
consumers’ expectations of quality rise sufficiently fast with the premium.
The model just presented captures analytically the trade-off between market share
and customer satisfaction (in the short run) suggested by Anderson, Fornell, and
Lehmann (1994) through plots of measures of market share versus consumer satisfaction.
These authors suggested that increasing market share may require a dilution of effort to
serve a larger number of consumers. They argue that heterogeneous customers’
preferences and dilution of efforts may lead to lower satisfaction levels. In our model, the
firm would have to lower the quality threshold if it is going to increase the amount of
product certified and sold (market share) in the market. It is straightforward to show that
as the threshold is lowered, both the average quality market and the expected proportion
of satisfied consumers decrease (i.e., ( )ˆ ˆ 0E q q q q∂ ≥ ∂ ≥ , and
( )( )ˆ ˆ 0E G q p q q q∂ ≥ ∂ ≥ ).
Interestingly, when heterogeneity in acceptable perceptions is introduced, neither
of the possible objectives considered leads to satisfaction of all consumers (under finite
punishments). Hence, consistent with the empirical findings of Anderson, Fornell, and
Lehmann (1994), we find that strategies seeking to maximize customer satisfaction will
in general be inappropriate if the firm’s objective is to maximize profits. Anderson,
17 If punishments are proportional to the price premium, e.g., ( )p kpδ = , with 0k > , then 1
p
p
δ
δ
∂=
∂ and
quality will only be adjusted if quality expectations are affected by the price premium.
19
Fornell, and Rust (1997) also concluded that profit-maximizing firms may offer relatively
low customer satisfaction if that allows them to increase their productivity by
standardizing their product.
The equilibrium price will be dependent on the market in which the firm is
participating. If the market is perfectly competitive, the equilibrium price will be
determined by the intersection of the market supply and demand curves.18 If the firm is
acting as a monopolist, it can also choose the price at which the product will be sold. In
that situation, the firm chooses a price and quality threshold such that equation (4) holds
and ( )ˆ 0E q pπ∂ ∂ = .19
Extensions
Value of a Customer is Endogenous
It is common in CLV models to assume an arbitrary number of periods on which to base
the lifetime value estimate. That number has been argued to depend on the industry
(Berger and Nasr 1998). This is a crucial (unless discounting is heavy) parameter that
will strongly affect the CLV and hence the optimal managerial decisions. In this section
we show that in the presence of taste uncertainty the number of periods under
consideration affects the optimal choice of the producer, and that in fact the lifetime of a
consumer is endogenous to the firm’s decisions. That is, once the firm makes its choices
regarding quality, it determines the expected number of repurchases.
If the number of periods is fixed at T , the CLV of a customer after a purchase is
( )11
1
11
TT tt
pp p
γ γδ γ
γ
−−
=
−= − =
−∑ , where ( )0,1γ ∈ represents the appropriate discount
18 Of course, the number (if any) of competitive equilibrium in this market will depend on the probability distributions of product quality, quality expectations, and consumer willingness to pay for the product. 19 This assumes that the second-order conditions for a maximum hold.
20
factor. When there will be no repeated purchases, i.e., when 1T = , the producer cannot
be punished for noncompliance in any given period. In these situations, it has been shown
that markets for experience attributes will fail to develop (Klein and Leffler 1981;
Grossman 1981; Antle 2001; Marette, Bureau, and Gozlan 2000). Since the quality that
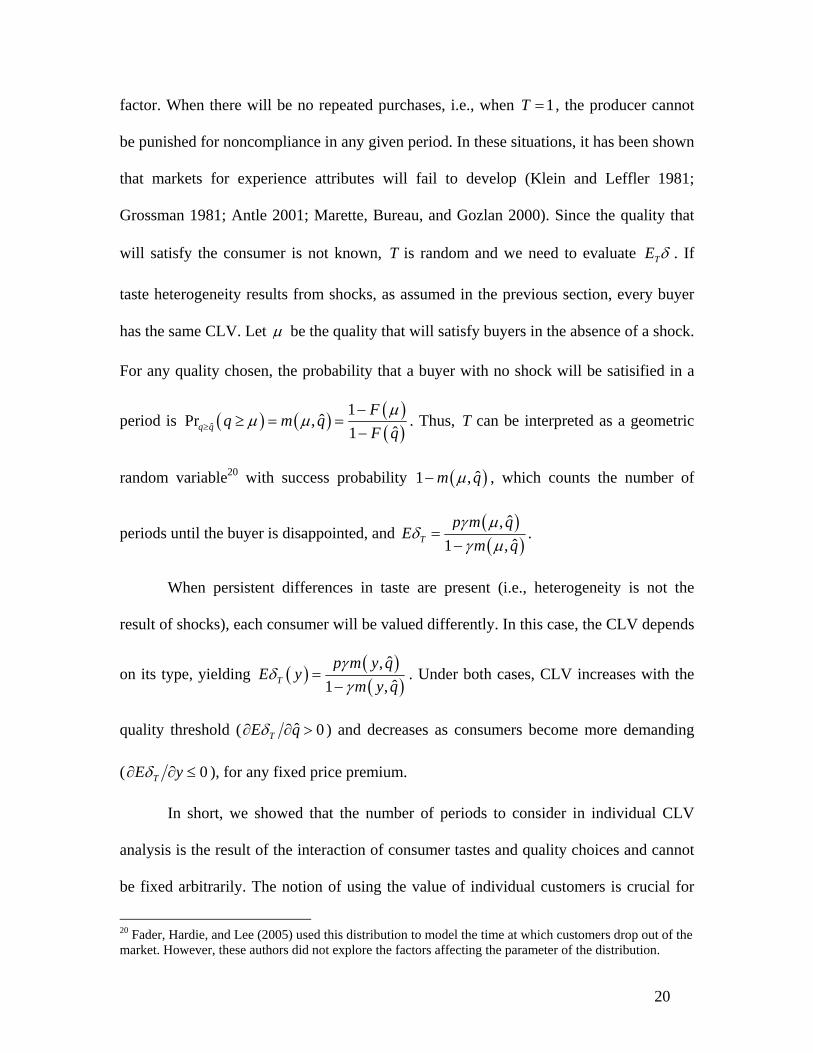
will satisfy the consumer is not known, T is random and we need to evaluate TE δ . If
taste heterogeneity results from shocks, as assumed in the previous section, every buyer
has the same CLV. Let μ be the quality that will satisfy buyers in the absence of a shock.
For any quality chosen, the probability that a buyer with no shock will be satisified in a
period is ( ) ( ) ( )( )ˆ
1ˆPr ,
ˆ1q qF
q m qF q
μμ μ≥
−≥ = =
−. Thus, T can be interpreted as a geometric
random variable20 with success probability ( )ˆ1 ,m qμ− , which counts the number of
periods until the buyer is disappointed, and ( )( )
ˆ,ˆ1 ,T
p m qE
m qγ μ
δγ μ
=−
.
When persistent differences in taste are present (i.e., heterogeneity is not the
result of shocks), each consumer will be valued differently. In this case, the CLV depends
on its type, yielding ( ) ( )( )
ˆ,ˆ1 ,T
p m y qE y
m y qγ
δγ
=−
. Under both cases, CLV increases with the
quality threshold ( ˆ 0TE qδ∂ ∂ > ) and decreases as consumers become more demanding
( 0TE yδ∂ ∂ ≤ ), for any fixed price premium.
In short, we showed that the number of periods to consider in individual CLV
analysis is the result of the interaction of consumer tastes and quality choices and cannot
be fixed arbitrarily. The notion of using the value of individual customers is crucial for
20 Fader, Hardie, and Lee (2005) used this distribution to model the time at which customers drop out of the market. However, these authors did not explore the factors affecting the parameter of the distribution.
21
relationship marketing and the customer equity views of marketing (Blattberg, Getz, and
Thomas 2001). These views contend that to increase profits, firms should first identify
the most profitable customers and allocate larger marketing resources to retain them.21
Although these approaches are intuitively obvious, recent research (Malthouse and
Blattberg 2005) has shown that it is difficult to predict future customer profitability of a
given customer, based only on past purchases. The authors conclude that the feasibility of
the mentioned strategy hinges on the probabilities and costs of misclassifying customers,
and that better understanding of the factors affecting the CLV of individual customers is
needed. Research (Mittal and Kamakura 2001) has shown that consumer demographic
characteristics affect their satisfaction and quality tolerance. The model presented
provides a framework for combining the distribution of product quality with the
characteristics of a customer to obtain a better estimate of his/her repurchase probability
and associated CLV.
What Is the Optimal Number of Classes?
The sorting of quality can be seen as a classification problem. In this article, the firm uses
the results of the measurement to separate output into two populations: acceptable or
unacceptable. However, having the results of the test for each unit of the product may
provide sufficient incentives for the processor to differentiate more finely its product or
to create more brands. In this way, the processor may be able to obtain premiums for a
higher proportion of its output. The optimal number of classes will hinge critically on the
precision of the technology, on the consumers’ ability to distinguish subtle quality
differences, and on their willingness to pay for them. At some point consumers will have
21 According to Mulhern (1999), a small percentage of customers usually make up for a large percentage of profits
22
problems finding meaningful differences among classes, become confounded or tired,
and further efforts will not be compensated.
Decomposing Management of Quality into Production and Control
Previous sections dealt with the quality control side of quality management. The problem
was to control which of the already produced units of output were marketed under the
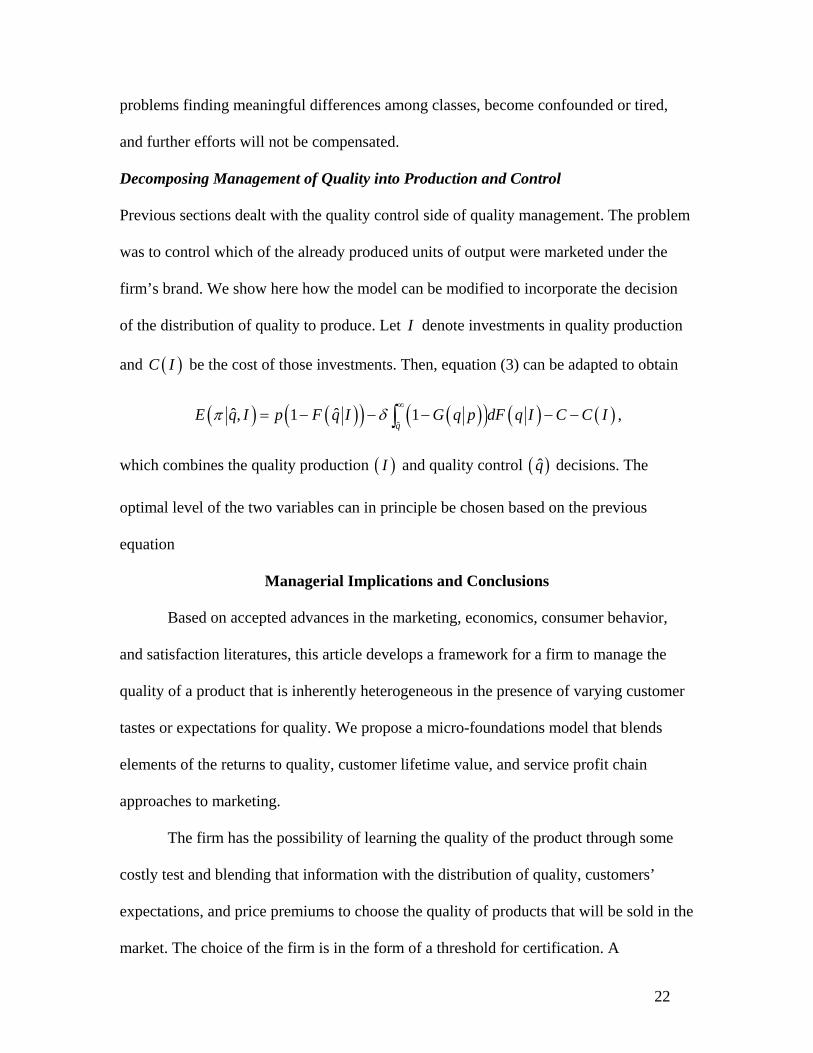
firm’s brand. We show here how the model can be modified to incorporate the decision
of the distribution of quality to produce. Let I denote investments in quality production
and ( )C I be the cost of those investments. Then, equation (3) can be adapted to obtain
( ) ( )( ) ( )( ) ( ) ( )ˆ
ˆ ˆ, 1 1q
E q I p F q I G q p dF q I C C Iπ δ∞
= − − − − −∫ ,
which combines the quality production ( )I and quality control ( )q̂ decisions. The
optimal level of the two variables can in principle be chosen based on the previous
equation
Managerial Implications and Conclusions
Based on accepted advances in the marketing, economics, consumer behavior,
and satisfaction literatures, this article develops a framework for a firm to manage the
quality of a product that is inherently heterogeneous in the presence of varying customer
tastes or expectations for quality. We propose a micro-foundations model that blends
elements of the returns to quality, customer lifetime value, and service profit chain
approaches to marketing.
The firm has the possibility of learning the quality of the product through some
costly test and blending that information with the distribution of quality, customers’
expectations, and price premiums to choose the quality of products that will be sold in the
market. The choice of the firm is in the form of a threshold for certification. A
23
complicating factor is that we consider the choice of the level of some attribute that is not
observable by customers prior to consumption. We also argue that (and sketch how) the
model can be used to decompose quality management into quality production and quality
control. The quality production step may be seen as a longer-term strategy of selecting
the technology to employ, whereas quality control involves the shorter-term choice of
which units of produced output to ship to the market under the firm’s name.
Our findings indicate that managing quality to maximize customer satisfaction (or
minimize the number of dissatisfied customers) or to minimize the costs of mismatching
quality with customers is generally not consistent with profit maximization. If the
objective is to maximize profits, we show that it is optimal to disappoint a proportion of
customers. There is a trade-off between the level of customer satisfaction and the
opportunity costs associated with not certifying potentially acceptable product. We also
provide insight into why the link between quality and profitability has been difficult to
demonstrate, based on levels and heterogeneity of product quality and differing
expectations.
The model indicates that the optimal threshold for quality depends on the
distribution of customers’ expectations, and their ability to impose a cost on or to punish
the firm when a quality deviation occurs. When each customer is valued differently, the
optimal threshold depends also on the distribution of product quality. We find that when
customers can impose stiffer penalties, the firm will be more vigilant of quality
deviations. An implication for managers is that they may want to exert greater control
over quality they procure from suppliers for which they are marginal buyers. In the same
line, comparative statics indicate that the optimal threshold, and hence expected quality,
24
can either increase or decrease in the price premium or margin of contribution of a
customer. If the expected punishment increases sufficiently fast with price, the firm
should react to a price increase by increasing the threshold for quality.
We showed how to incorporate the tenet of the customer equity and customer
lifetime values approaches to marketing that not every customer is worth the same for the
firm. In particular, we show that for a given price, a customer whose expectations for
quality are lower is more valuable to the firm. This is the result of higher retention rates
associated with lower-quality expectations. Hence, consistent with the recommendations
of Anderson, Fornell, and Lehmann (1994), we find that it is important for firms to avoid
raising customers’ expectations by over-promising quality. Another direct implication of
these findings is that firms should make efforts to identify customers whose expectations
are more aligned with the quality of the product available. To operationalize this
recommendation, firms should collect information about their customers’ demographics,
habits, or some other observable variable that is related to customer retention. A way in
which this information may be elicited is through focus groups, though it would be better
to collect it from actual observed behavior (Zeithaml 2000). Once these relations are
estimated, marketing efforts, and thus the product, will be better targeted. Additionally it
may be possible to identify different market segments or niches with respect to
customers’ expectations for quality and tailor the level of the quality certified to them in a
way that allows a larger proportion of the heterogeneous product to be sold. A related
point is that estimating a CLV based on an arbitrary time horizon is a questionable
practice. We show that the lifetime of an individual customer is endogenous to the choice
of quality.

25
Appendix
Proof of Result 1: From the definition of ( )G q p we have that ( ) 1G q p = for all q y≥
and hence ( ) 0G q p = for all q y< . When q̂ y≥ , the per unit profit function can be
written as ( ) ( )( ) ( )( )ˆ
ˆ ˆ1 ( ) 1q
E q p G q p dF q C p F q Cπ δ∞
= − − − = − −∫ , which is clearly
maximized by setting *q̂ y= . Expected punishments are zero for all q̂ y≥ . However,
there will be opportunity costs for any q̂ y> since product known to be acceptable will
not be certified. For our purposes, *q̂ y= minimizes expected punishments (as any other
q̂ y≥ ). When q̂ y≤ , the profit function is given by
( ) ( )( ) ( )( )ˆ
ˆ 1 ( ) 1 ( )y
y qE q p G q p dF q p G q p dF qπ δ δ
∞= − − + − −∫ ∫ , which simplifies to
( ) ( )( ) ( ) ( ) ( )( )ˆ ˆ1E q p F y p F y F qπ δ= − + − − . The second term in the previous
equation represents the expected punishments. Since pδ > , profits are maximized when
costs of misclassification are minimized at *q̂ y= .
26
References
Anderson, E. W., and M. W. Sullivan. 1993. “The Antecedents and Consequences of
Customer Satisfaction for Firms.” Marketing Science 12, (2): 125-143.
Anderson, E. W., C. Fornell, and D. R. Lehmann. 1994. “Customer Satisfaction, Market
Share, and Profitability: Findings From Sweden.” Journal of Marketing 58: 53-66.
Anderson, E. W., C. Fornell, and R. T. Rust. 1997. “Customer Satisfaction, Productivity,
and Profitability: Differences Between Goods and Services.” Marketing Science 16,
(2): 129-145.
Antle, J. M. 2001. “Economic Analysis of Food Safety.” In Handbook of Agricultural
Economics, vol. 2. Ed. by B. Gardner and G. Rausser. Amsterdam: North-Holland.
Berger, P. D., and N. I. Nasr. 1998. “Customer Lifetime Value: Marketing Models and
Applications.” Journal of Interactive Marketing, 12, 1 (Winter): 17-30.
Blattberg, R. C., and J. Deighton. 1996. “Manage Marketing by the Customer Equity
Test.” Harvard Business Review, July-August, 136-144.
Blattberg, R. C., G. Getz, and J. S. Thomas. 2001. Customer Equity: Building and
Managing Relationships as Valuable Assets. Boston: Harvard Business School Press.
Bolton, R. N. 1998. “A Dynamic Model of the Duration of the Customer’s Relationship
with a Continuous Service Provider: The Role of Satisfaction.” Marketing Science,
17, 45-65.
Bolton, R. N., P. K. Kannan, and M. D. Bramlett. 2000. “Implications of Loyalty
Program Membership and Service Experiences for Customer Retention and Value.”
Journal of the Academy of Marketing Science, 28: 95-108.
Caswell, J. A., and S. J. Henson. 1997. “Interaction of Private and Public Food Quality
Control Systems in Global Markets.” In Globalization of the Food Industry: Policy
Implications. Ed. R. J. Loader, S. J. Henson, and W. B. Trail. Reading, UK: Center
for Food Economics Research, The University of Reading, pp. 217-236.
Davis, S., E. Gerstner, and M. Hagerty. 1995. “Money Back Guarantees in Retailing:
Matching Products to Consumer Tastes.” Journal of Retailing, 71, (1): 7-22.
Dowling, G. R., and M. Uncles. 1997. “Do Customer Loyalty Programs Really Work?”
Sloan Management Review, 38: 71-82
27
Fader, P. S., B. G. S. Hardie, and K. L. Lee. 2005. “Counting Your Customers the Easy
Way: An Alternative to the Pareto/NBD Model.” Marketing Science, 24, (2): 275-84.
Fornell, C., and B. Wernerfelt. 1988. “A Model of Customer Complaint Management.”
Marketing Science, 7, (3): 287-98.
Fornell, C. 1992. “A National Customer Satisfaction Barometer: The Swedish
Experience.” Journal of Marketing: 1-21.
Grossman, S. J. 1981. “The Informational Role of Warranties in Private Disclosures
About Product Quality.” Journal of Law and Economics, 24: 461-489.
Jackson, B. B. 1985. Winning and Keeping Industrial Customers. Lexington, MA:
Lexington Books.
Jain, D., and S. S. Singh. 2002. “Customer Lifetime Value Research in Marketing: A
Review and Future Directions.” Journal of Interactive Marketing 16, (2): 34-46.
Klein, B., and K. B. Leffler. 1981. “The Role of Market Forces in Assuring Contractual
Performance.” Journal of Political Economy, 89: 615-41.
Malthouse, E. C., and R. C. Blattberg. 2005. “Can We Predict Customer Lifetime
Value?” Journal of Interactive Marketing, 19, (1): 2-16.
Marette, S., J. N. Bureau, and E. Gozlan. 2000. “Product Safety Provision and Consumers
Information.” Australian Economic Papers, 39: 426-441.
Milgrom, P., and J. Roberts. 1986. “Price and Advertising Signals of Product Quality.”
Journal of Political Economy, 94, (4): 796-821.
Miller, M. F., Carr, M. F., Ramsey, C. B., Crockett, K. L., and L. C. Hoover. 2001.
Consumer Thresholds for Establishing the Value of Beef Tenderness.” Journal of
Animal Science, (79): 362-68.
Oliver, R. L. 1997. Satisfaction: A Behavioral Perspective on the Consumer. The
McGraw-Hill Companies, Inc.
Parasuraman, A., L. L. Berry, and V. A. Zeithaml. 1991. “Understanding Customer
Expectations of Service.” Sloan Management Review, 32: 39-48.
Reichheld, F. F., and W. E. Sasser. 1990. “Zero Defections: Quality Comes to Services.”
Harvard Business Review, (September-October): 105-111.
Reichheld, F. F. 1996. The Loyalty Effect. Boston: Harvard Business School Press.
28
Reinartz, W. J., and V. Kumar. 2000. “On the Profitability of Long-Life Customers in a
Noncontractual Setting: An Empirical Investigation and Implications for Marketing.”
Journal of Marketing, 64: 17-35.
Rob, R., and T. Sekiguchi. 2001. “Product Quality, Reputation and Turnover.” Working
Paper 01-11. Center for Analytical Research in Economics and the Social Sciences.
University of Pennsylvania.
Rust, R. T., and R. L. Oliver. 2000. “Should We Delight the Customer?” Journal of the
Academy of Marketing Science 28 (1): 86-94.
Rust, R. T., and A. J. Zahorik. 1993. “Customer Satisfaction, Customer Retention, and
Market Share.” Journal of Retailing, 69, (2): 193-215.
Rust, R. T., A. J. Zahorik, and T. L. Keiningham. 1995. “Return on Quality (ROQ):
Making Service Quality Financially Accountable.” Journal of Marketing, 59: 58-70.
Shackelford, S. D., T. L. Wheeler, M. K. Meade, J. O. Reagan, B. L. Byrnes, and M.
Koohmaraie. 2001. “Consumer Impressions of Tender Select Beef.” Journal of
Animal Science, (79): 2605-2614.
Shapiro, C. 1983. “Premiums for High Quality Products and Returns to Reputations.”
Quarterly Journal of Economics, (4): 659-80.
Spence, M. 1975. “Monopoly, Quality and Regulation.” Bell Journal of Economics 6, (2):
417-429.
Zeithaml, V. A. 2000. “Service Quality, Profitability, and the Economic Worth of
Customers: What We Know and What We Need to Learn.” Journal of the Academy
of Marketing Science, 28, (1): 67-85.
Zeithaml, V. A., L. L. Berry, and A. Parasuraman. 1993. “The Nature and Determinants
of Customer Expectations of Service.” Journal of the Academy of Marketing Science,
21: 1-12.
Zeithaml, V. A., L. L. Berry, and A. Parasuraman. 1996. “The Behavioral Consequences
of Service Quality.” Journal of Marketing, 60: 31-46.