mat 2377 probability and statistics for engineers
TRANSCRIPT

MAT 2377Probability and Statistics for Engineers
Practice Set
P. Boily (uOttawa)
Winter 2021
Based on course notes by Rafa l Kulik

MAT 2377 – Probability and Statistics for Engineers Practice Set
Q1. Two events each have probability 0.2 of occurring and are independent.The probability that neither occur is:
0.64a) 0.04b) 0.2c) 0.4d) none ofthe preceding
e)
Based on course notes by Rafa l Kulik 1

MAT 2377 – Probability and Statistics for Engineers Practice Set
Q2. Two events each have probability 0.2 and are mutually exclusive. Theprobability that neither occurs is:
0.36a) 0.04b) 0.2c) 0.6d) none ofthe preceding
e)
Based on course notes by Rafa l Kulik 2

MAT 2377 – Probability and Statistics for Engineers Practice Set
Q3. A smoke-detector system consists of two parts A and B. If smokeoccurs then the item A detects it with probability 0.95, the item B detectsit with probability 0.98 whereas both of them detect it with probability 0.94.What is the probability that the smoke will not be detected?
0.01a) 0.99b) 0.04c) 0.96d) none ofthe preceding
e)
Based on course notes by Rafa l Kulik 3
MAT 2377 – Probability and Statistics for Engineers Practice Set
Q4. Three football players will attempt to kick a field goal. Let A1, A2, A3
denote the events that the field goal is made by player 1, 2, 3, respectively.Assume that A1, A2, A3 are independent and P (A1) = 0.5, P (A2) = 0.7,P (A3) = 0.6. Compute the probability that exactly one player is successful.
0.29a) 0.21b) 0.71c) 0.79d) none ofthe preceding
e)
Based on course notes by Rafa l Kulik 4

MAT 2377 – Probability and Statistics for Engineers Practice Set
Q5. In a group of 16 candidates for laboratory research positions, 7 arechemists and 9 are physicists. In how many ways can one choose a groupof 5 candidates with 2 chemists and 3 physicists?
Based on course notes by Rafa l Kulik 5
MAT 2377 – Probability and Statistics for Engineers Practice Set
Q6. There is a theorem of combinatorics that states that the number ofpermutations of n objects in which n1 are alike of kind 1, n2 are alike ofkind 2, ..., and nr are alike of kind r (that is, n = n1 + n2 + · · ·+ nr) is
n!
n1! · n2! · · · · · nr!.
Find the number of different words that can be formed by rearranging theletters in the following words (include the given word in the count):
NORMALa) HHTTTTb) ILLINIc) MISSISSIPPId)
Based on course notes by Rafa l Kulik 6

MAT 2377 – Probability and Statistics for Engineers Practice Set
Q7. A class consists of 490 engineering students and 510 science students.The students are divided according to their marks:
Passed FailedEng. 430 60Sci. 410 100
If one person is selected randomly, the probability that it failed if it was anengineering student?
0.06a) 0.12b) 0.41c) 0.81d) none ofthe preceding
e)
Based on course notes by Rafa l Kulik 7

MAT 2377 – Probability and Statistics for Engineers Practice Set
Q8. A company which produces a particular drug has two factories, A andB. 30% of the drug are made in factory A, 70% in factory B. Supposethat 95% of the drugs produced by factory A meet specifications while only75% of the drugs produced by factory B meet specifications. If I buy a doseof the company’s drug, what is the probability that it meets specifications?
0.81a) 0.95b) 0.75c) 0.7d) none ofthe preceding
e)
Based on course notes by Rafa l Kulik 8

MAT 2377 – Probability and Statistics for Engineers Practice Set
Q9. A medical research team wished to evaluate a proposed screening testfor Alzheimer’s disease. The test was given to a random sample of 450patients with Alzheimer’s disease; in 436 cases the test result was positive.The test was also given to a random sample of 500 patients without thedisease; only in 5 cases was the result was positive. It is known that inCanada 11.3% of the population aged 65+ have Alzheimer’s disease. Findthe probability that a person has the disease given that their test waspositive (choose the closest answer).
0.97a) 0.93b) 0.99c) 0.07d) none ofthe preceding
e)
Based on course notes by Rafa l Kulik 9
MAT 2377 – Probability and Statistics for Engineers Practice Set
Q10. Twelve items are independently sampled from a production line. Ifthe probability that any given item is defective is 0.1, the probability of atmost two defectives in the sample is closest to ...
0.38748a) 0.9872b) 0.7361c) 0.8891d) none ofthe preceding
e)
Based on course notes by Rafa l Kulik 10

MAT 2377 – Probability and Statistics for Engineers Practice Set
Q11. A student can solve 6 problems from a list of 10. For an exam 8questions are selected at random from the list. What is the probability thatthe student will solve exactly 5 problems?
0.98a) 0.02b) 0.28c) 0.53d) none ofthe preceding
e)
Based on course notes by Rafa l Kulik 11
MAT 2377 – Probability and Statistics for Engineers Practice Set
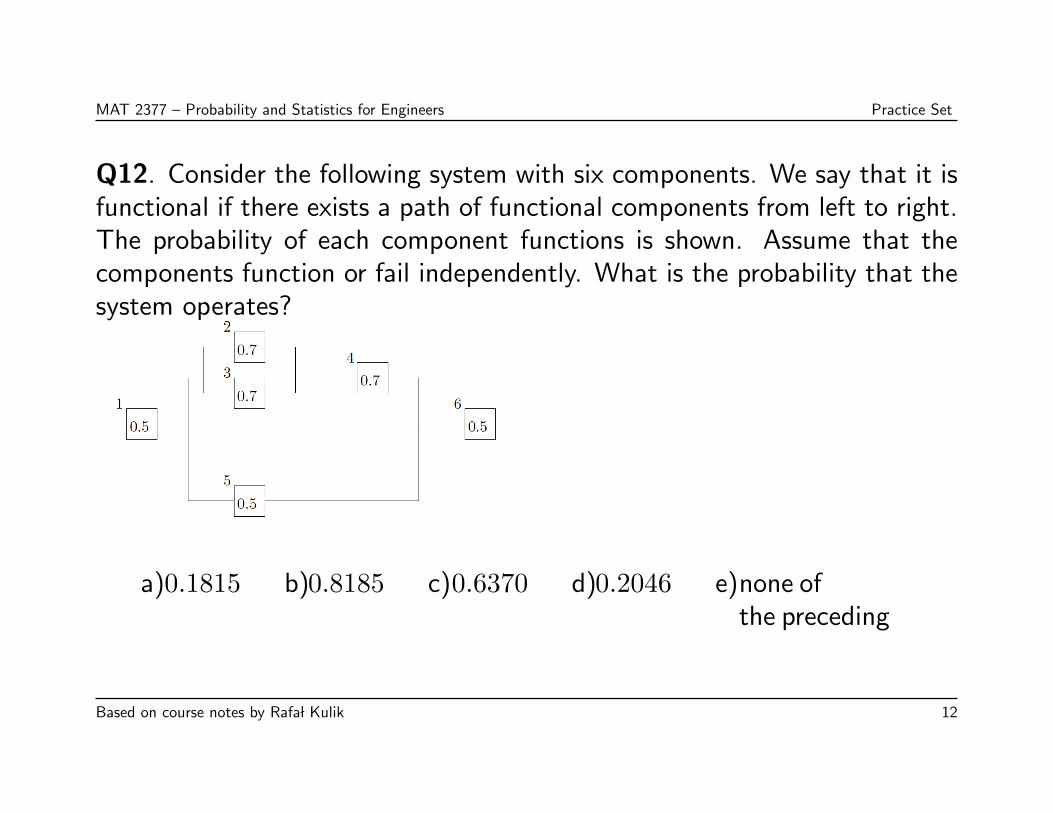
Q12. Consider the following system with six components. We say that it isfunctional if there exists a path of functional components from left to right.The probability of each component functions is shown. Assume that thecomponents function or fail independently. What is the probability that thesystem operates?
0.1815a) 0.8185b) 0.6370c) 0.2046d) none ofthe preceding
e)
Based on course notes by Rafa l Kulik 12

MAT 2377 – Probability and Statistics for Engineers Practice Set
Q13. Three events are shown in the Venn diagram below.
Shade the region corresponding to the following events:
Aca) (A ∩B) ∪ (A ∩Bc)b)
(A ∩B) ∪ Cc) (B ∪ C)cd)
(A ∩B)c ∪ Ce)
Based on course notes by Rafa l Kulik 13

MAT 2377 – Probability and Statistics for Engineers Practice Set
Q14. Pieces of aluminum are classified according to the finishing of thesurface and according to the finishing of edge. The results from 85 samplesare summarized as follows:
EdgeSurface excellent goodexcellent 60 5
good 16 4
Let A denote the event that a selected piece has ”excellent” surface, and letB denote the event that a selected piece has “excellent” edge. If samplesare elected randomly, determine the following probabilities:
P (A)a) P (B)b) P (Ac)c)
P (A ∩B)d) P (A ∪B)e) P (Ac ∪B)f)
Based on course notes by Rafa l Kulik 14

MAT 2377 – Probability and Statistics for Engineers Practice Set
Q15. If P (A) = 0.1, P (B) = 0.3, P (C) = 0.3, and events A,B,C aremutually exclusive, determine the following probabilities:
P (A ∪B ∪ C)a) P (A ∩B ∩ C)b) P (A ∩B)c)
P ((A ∪B) ∩ C)d) P (Ac ∩Bc ∩ Cc)e) P [(A ∪B ∪ C)c]f)
Based on course notes by Rafa l Kulik 15

MAT 2377 – Probability and Statistics for Engineers Practice Set
Q16. The probability that an electrical switch, which is kept in dryness,fails during the guarantee period, is 1%. If the switch is humid, the failureprobability is 8%. Assume that 90% of switches are kept in dry conditions,whereas remaining 10% are kept in humid conditions.
a) What is the probability that the switch fails during the guarantee period?
b) If the switch failed during the guarantee period, what is the probabilitythat it was kept in humid conditions?
Based on course notes by Rafa l Kulik 16

MAT 2377 – Probability and Statistics for Engineers Practice Set
Q17. The following system operates only if there is a path of functionaldevice from left to the right. The probability that each device functionsis as shown. What is the probability that the circuit operates? Assumeindependence.
0.98
0.90
1
2
0.97
0.90
3
4
0.95
0.90
5
6
0.99
7
Based on course notes by Rafa l Kulik 17
MAT 2377 – Probability and Statistics for Engineers Practice Set
Q18. An inspector working for a manufacturing company has a 95%chance of correctly identifying defective items and 2% chance of incorrectlyclassifying a good item as defective. The company has evidence that 1% ofthe items it produces are nonconforming (defective).
1. What is the probability that an item selected for inspection is classifiedas defective?
2. If an item selected at random is classified as non defective, what is theprobability that it is indeed good?
Based on course notes by Rafa l Kulik 18

MAT 2377 – Probability and Statistics for Engineers Practice Set
Q19. Consider an ordinary 52-card North American playing deck (4 suits,13 cards in each suit).
a) How many different 5−card poker hands can be drawn from the deck?
b) How many different 13−card bridge hands can be drawn from the deck?
c) What is the probability of an all-spade 5−card poker hand?
d) What is the probability of a flush (5−cards from the same suit)?
e) What is the probability that a 5−card poker hand contains exactly 3Kings and 2 Queens?
f) What is the probability that a 5−card poker hand contains exactly 2Kings, 2 Queens, and 1 Jack?
Based on course notes by Rafa l Kulik 19

MAT 2377 – Probability and Statistics for Engineers Practice Set
Q20. Students on a boat send messages back to shore by arranging sevencoloured flags on a vertical flagpole.
a) If they have 4 orange flags and 3 blue flags, how many messages canthey send?
b) If they have 7 flags of different colours, how many messages can theysend?
c) If they have 3 purple flags, 2 red flags, and 4 yellow flags, how manymessages can they send?
Based on course notes by Rafa l Kulik 20

MAT 2377 – Probability and Statistics for Engineers Practice Set
Q21. The Stanley Cup Finals of hockey or the NBA Finals in basketballcontinue until either the representative team form the Western Conferenceor from the Eastern Conference wins 4 games. How many different ordersare possible (WWEEEE means that the Eastern team won in 6 games) ifthe series goes
4 games?a) 5 games?b) 6 games?c) 7 games?d)
Based on course notes by Rafa l Kulik 21

MAT 2377 – Probability and Statistics for Engineers Practice Set
Q22. Consider an ordinary 52-card North American playing deck (4 suits,13 cards in each suit), from which cards are drawn at random and withoutreplacement, until 3 spades are drawn.
a) What is the probability that there are 2 spades in the first 5 draws?
b) What is the probability that a spade is drawn on the 6th draw given thatthere were 2 spades in the first 5 draws?
c) What is the probability that 6 cards need to be drawn in order to obtain3 spades?
d) All the cards are placed back into the deck, and the deck is shuffled.4 cards are then drawn from. What is the probability of having drawn aspade, a heart, a diamond, and a club, in that order?
Based on course notes by Rafa l Kulik 22
MAT 2377 – Probability and Statistics for Engineers Practice Set
Q23. A student has 5 blue marbles and 4 white marbles in his left pocket,and 4 blue marbles and 5 white marbles in his right pocket. If they transferone marble at random from their left pocket to his right pocket, what is theprobability of them then drawing a blue marble from their right pocket?
Based on course notes by Rafa l Kulik 23
MAT 2377 – Probability and Statistics for Engineers Practice Set
Q24. An insurance company sells a number of different policies; amongthese, 60% are for cars, 40% are for homes, and 20% are for both. LetA1, A2, A3, A4 represent people with only a car policy, only a home policy,both, or neither, respectively. Let B represent the event that a policyholderrenews at least one of the car or home policies.
a) Compute P (A1), P (A2), P (A3), and P (A4).
b) From past data, we know that P (B|A1) = 0.6, P (B|A2) = 0.7,P (B|A3) = 0.8. Given that a client selected at random has a caror a home policy, what is the probability that they will renew one ofthese policies?
Based on course notes by Rafa l Kulik 24
MAT 2377 – Probability and Statistics for Engineers Practice Set
Q25. An urn contains four balls numbered 1 through 4. The balls areselected one at a time, without replacement. A match occurs if ball m isthe mth ball selected. Let the event Ai denote a match on the ith draw,i = 1, 2, 3, 4.
a) Compute P (Ai), i = 1, 2, 3, 4.
b) Compute P (Ai ∩Aj), i, j = 1, 2, 3, 4, i 6= j.
c) Compute P (Ai ∩Aj ∩Ak), i, j, k = 1, 2, 3, 4, i 6= j, i 6= k, j 6= k.
d) What is the probability of at least 1 match?
Based on course notes by Rafa l Kulik 25

MAT 2377 – Probability and Statistics for Engineers Practice Set
Q26. The probability that a company’s workforce has at least one accidentin a given month is (0.01)k, where k is the number of days in the month.Assume that the number of accidents is independent from month to month.If the company’s year starts on January 1, what is the probability that thefirst accident occurs in April?
Based on course notes by Rafa l Kulik 26

MAT 2377 – Probability and Statistics for Engineers Practice Set
Q27. A Pap smear is a screening procedure used to detect cervical cancer.Let T− and T+ represent the events that the test is negative and positive,respectively, and let C represent the event that the person tested has cancer.
The false negative rate for this test when the patient has the cancer is 16%;the false positive test for this test when the patient does not have canceris 19%.
In North America, the rate of incidence for this cancer is roughly 8 out of100,000 women. Based on these numbers, do you think that the Pap smearis an effective procedure? What factors influence your conclusion?
Based on course notes by Rafa l Kulik 27

MAT 2377 – Probability and Statistics for Engineers Practice Set
Q28. Of three different fair dice, one each is given to Elowyn, Llewellyn,and Gwynneth. They each roll the die they received.
Let E = {Elowyn rolls a 1 or a 2}, LL = {Llewellyn rolls a 3 or a 4}, andG = {Gwynneth rolls a 5 or a 6} be 3 events of interest.
a) What are the probabilities of each of E, LL, and G occurring?
b) What are the probabilities of any two of E, LL, and G occurringsimultaneously?
c) What is the probability of all three of the events occurring simultaneously?
d) What is the probability of at least one of E, LL, or G occurring?
Based on course notes by Rafa l Kulik 28

MAT 2377 – Probability and Statistics for Engineers Practice Set
Q29. Over the course of two baseball seasons, player A obtained 126 hitsin 500 at-bats in Season 1, and 90 hits in 300 at-bats in Season 2; playerB, on the other hand, obtained 75 hits in 300 at-bats in Season 1, and 145hits in 500 at-bats in Season 2. A player’s batting average is the number ofhits they obtain divided by the number of at-bats.
a) Which player has the best batting average in Season 1? In Season 2?
b) Which player has the best batting average over the 2-year period?
c) What is happening here?
Based on course notes by Rafa l Kulik 29

MAT 2377 – Probability and Statistics for Engineers Practice Set
Q30. A stranger comes to you and shows you what appears to be a normalcoin, with two distinct sides: Heads (H) and Tails (T ). They flip the coin4 times and record the following sequence of tosses: HHHH.
a) What is the probability of obtaining this specific sequence of tosses?What assumptions do you make along the way in order to compute theprobability? What is the probability that the next toss will be a T .
b) The stranger offers you a bet: they will toss the coin another time; if thetoss is T , they give you 100$, but if it is H, you give them 10$. Wouldyou accept the bet (if you are not morally opposed to gambling)?
c) Now the stranger tosses the coin 60 times and records 60×H in a row:H · · ·H. They offer you the same bet. Do you accept it?
d) What if they offered 1000$ instead? 1, 000, 000$?
Based on course notes by Rafa l Kulik 30

MAT 2377 – Probability and Statistics for Engineers Practice Set
Q31. The sample space of a random experiment is {a, b, c, d, e, f} andeach outcome is equally likely. A random variable is defined as follows
outcome a b c d e fX 0 0 1.5 1.5 2 3
Determine the probability mass function of X. Determine the followingprobabilities:
P (X = 1.5)a) P (0.5 < X < 2.7)b) P (X > 3)c)
P (0 ≤ X < 2)d) P (X = 0 or 2)e)
Based on course notes by Rafa l Kulik 31

MAT 2377 – Probability and Statistics for Engineers Practice Set
Q32. Determine the mean and the variance of the random variable definedin Q1.
Based on course notes by Rafa l Kulik 32

MAT 2377 – Probability and Statistics for Engineers Practice Set
Q33. We say that X has uniform distribution on a set of values{X1, . . . , Xk} if
P (X = Xi) =1
k, i = 1, . . . , k.
The thickness measurements of a coating process are uniformly distributedwith values 0.15, 0.16, 0.17, 0.18, 0.19. Determine the mean and varianceof the thickness measurements.
Is this result compatible with a uniform distribution?
Based on course notes by Rafa l Kulik 33
MAT 2377 – Probability and Statistics for Engineers Practice Set
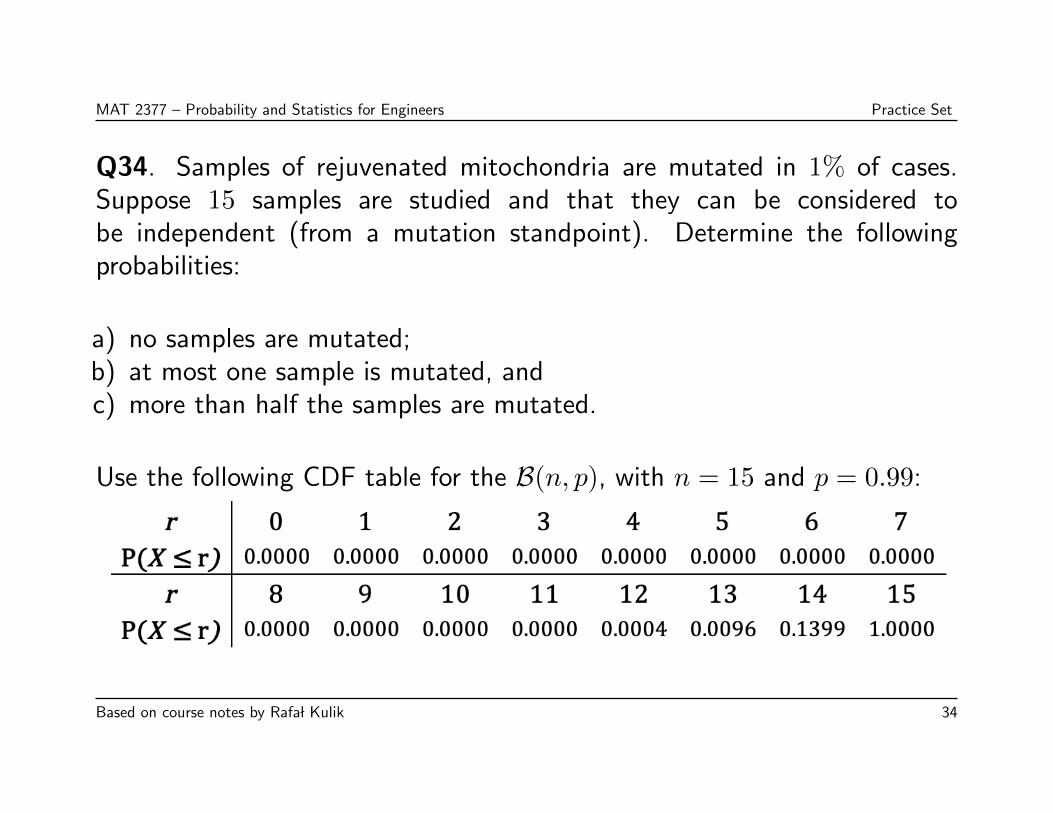
Q34. Samples of rejuvenated mitochondria are mutated in 1% of cases.Suppose 15 samples are studied and that they can be considered tobe independent (from a mutation standpoint). Determine the followingprobabilities:
a) no samples are mutated;b) at most one sample is mutated, andc) more than half the samples are mutated.
Use the following CDF table for the B(n, p), with n = 15 and p = 0.99:
Based on course notes by Rafa l Kulik 34

MAT 2377 – Probability and Statistics for Engineers Practice Set
Q35. Samples of 20 parts from a metal punching process are selected everyhour. Typically, 1% of the parts require re-work. Let X denote the numberof parts in the sample that require re-work. A process problem is suspectedif X exceeds its mean by more than three standard deviations.
a) What is the probability that there is a process problem?
b) If the re-work percentage increases to 4%, what is the probability thatX exceeds 1?
c) If the re-work percentage increases to 4%, what is the probability thatX exceeds 1 in at least one of the next five sampling hours?
Based on course notes by Rafa l Kulik 35

MAT 2377 – Probability and Statistics for Engineers Practice Set
Q36. In a clinical study, volunteers are tested for a gene that has beenfound to increase the risk for a particular disease. The probability that theperson carries a gene is 0.1.
a) What is the probability that 4 or more people will have to be tested inorder to detect 1 person with the gene?
b) How many people are expected to be tested in order to detect 1 personwith the gene?
c) How many people are expected to be tested before 2 with the gene aredetected?
Based on course notes by Rafa l Kulik 36

MAT 2377 – Probability and Statistics for Engineers Practice Set
Q37. The number of failures of a testing instrument from contaminatedparticles on the product is a Poisson random variable with a mean of 0.02failure per hour.
a) What is the probability that the instrument does not fail in an 8−hourshift?
b) What is the probability of at least 1 failure in a 24−hour day?
Based on course notes by Rafa l Kulik 37

MAT 2377 – Probability and Statistics for Engineers Practice Set
Q38. Use R to generate a sample from a binomial distribution and from aPoisson distribution (select parameters as you wish).
Use R to compute the sample means and sample variances. Compare thesevalues to population means and population variances.
Based on course notes by Rafa l Kulik 38

MAT 2377 – Probability and Statistics for Engineers Practice Set
Q39. A container of 100 light bulbs contains 5 bad bulbs. We draw10 bulbs without replacement. Find the probability of drawing at least 1defective bulb.
0.4164a) 0.584b) 0.1c) 0.9d) none ofthe preceding
e)
Based on course notes by Rafa l Kulik 39

MAT 2377 – Probability and Statistics for Engineers Practice Set
Q40. Let X be a disrete random variable with range {0, 1, 2} and probabilitymass function (p.m.f.) given by f(0) = 0.5, f(1) = 0.3, and f(2) = 0.2.The expected value and variance of X are, respectively,
0.7, 0.61a) 0.7, 1.1b) 0.5, 0.61c) 0.5, 1.1d) none ofthe preceding
e)
Based on course notes by Rafa l Kulik 40

MAT 2377 – Probability and Statistics for Engineers Practice Set
Q41. A factory employs several thousand workers, of whom 30% are notfrom an English-speaking background. If 15 members of the union executivecommittee were chosen from the workers at random, evaluate the probabilitythat exactly 3 members of the committee are not from an English-speakingbackground.
0.17a) 0.83b) 0.98c) 0.51d) none ofthe preceding
e)
Use the following CDF table for the B(n, p), with n = 15 and p = 0.30 ifneeded:
Based on course notes by Rafa l Kulik 41

MAT 2377 – Probability and Statistics for Engineers Practice Set
Q42. Assuming the context of Q11, what is the probability that amajority of the committee members do not come from an English-speakingbackground?
Based on course notes by Rafa l Kulik 42

MAT 2377 – Probability and Statistics for Engineers Practice Set
Q43. In a video game, a player is confronted with a series of opponents andhas an 80% probability of defeating each one. Success with any opponent(that is, defeating the opponent) is independent of previous encounters.The player continues until defeated. What is the probability that the playerencounters at least three opponents?
0.8a) 0.64b) 0.5c) 0.36d) none ofthe preceding
e)
Based on course notes by Rafa l Kulik 43

MAT 2377 – Probability and Statistics for Engineers Practice Set
Q44. Assuming the context of Q13, how many encounters is the playerexpected to have?
5a) 4b) 8c) 10d) none ofthe preceding
e)
Based on course notes by Rafa l Kulik 44
MAT 2377 – Probability and Statistics for Engineers Practice Set
Q45. From past experience it is known that 3% of accounts in a largeaccounting company are in error. The probability that exactly 5 accountsare audited before an account in error is found, is:
0.242a) 0.011b) 0.030c) 0.026d) none ofthe preceding
e)
Based on course notes by Rafa l Kulik 45

MAT 2377 – Probability and Statistics for Engineers Practice Set
Q46. A receptionist receives on average 2 phone calls per minute. Assumethat the number of calls can be modeled using a Poisson random variable.What is the probability that he does not receive a call within a 3−minuteinterval?
e−2a) e−1/2b) e−6c) e−1d) none ofthe preceding
e)
Based on course notes by Rafa l Kulik 46

MAT 2377 – Probability and Statistics for Engineers Practice Set
Q47. Consider a random variable X with probability density function(p.d.f.) given by
f(x) =
0 if x ≤ −1
0.75(1− x2) if −1 ≤ x < 1
0 if x ≥ 1
What is the expected value and the standard deviation of X?
0, 3a) 0, 0.447b) 1, 0.2c) 1, 3d) none ofthe preceding
e)
Based on course notes by Rafa l Kulik 47
MAT 2377 – Probability and Statistics for Engineers Practice Set
Q48. A random variable X has a cumulative distribution function (c.d.f.)
F (x) =
0 if x ≤ 0
x/2 if 0 < x < 2
1 if x ≥ 2
What is the mean value of X?
1a) 2b) 0c) 0.5d) none ofthe preceding
e)
Based on course notes by Rafa l Kulik 48
MAT 2377 – Probability and Statistics for Engineers Practice Set
Q49. Let X be a random variable with p.d.f. given by f(x) = 32x
2 for−1 ≤ x ≤ 1, and f(x) = 0 otherwise. Find P (X2 ≤ 0.25).
0.250a) 0.125b) 0.500c) 0.061d) none ofthe preceding
e)
Based on course notes by Rafa l Kulik 49

MAT 2377 – Probability and Statistics for Engineers Practice Set
Q50. In the inspection of tin plate produced by a continuous electrolyticprocess, 0.2 imperfections are spotted per minute, on average. Find theprobability of spotting at least 2 imperfections in 5 minutes. Assume thatwe can model the occurrences of imperfections as a Poisson process.
0.736a) 0.264b) 0.632c) 0.368d) none ofthe preceding
e)
Based on course notes by Rafa l Kulik 50
MAT 2377 – Probability and Statistics for Engineers Practice Set
Q51. If X ∼ N (0, 4), the value of P (|X| ≥ 2.2) is (using the normaltable):
0.2321a) 0.8438b) 0.2527c) 0.2713d) 0.7286e) none ofthe preceding
f)
Based on course notes by Rafa l Kulik 51

MAT 2377 – Probability and Statistics for Engineers Practice Set
Q52. If X ∼ N (10, 1), the value of k such that P (X ≤ k) = 0.701944 isclosest to
0.59a) 0.30b) 0.53c) 10.53d) 10.30e) 10.59f)
Based on course notes by Rafa l Kulik 52

MAT 2377 – Probability and Statistics for Engineers Practice Set
Q53. The time it takes a supercomputer to perform a task is normallydistributed with mean 10 milliseconds and standard deviation 4 milliseconds.What is the probability that it takes more than 18.2 milliseconds to performthe task? (use the normal table or R).
0.9798a) 0.8456b) 0.0202c) 0.2236d) 0.5456e) none ofthe preceding
f)
Based on course notes by Rafa l Kulik 53
MAT 2377 – Probability and Statistics for Engineers Practice Set
Q54. Roll a 4−sided die twice, and let X equal the larger of the twooutcomes if they are different and the common value if they are the same.Find the p.m.f. and the c.d.f. of X.
Based on course notes by Rafa l Kulik 54

MAT 2377 – Probability and Statistics for Engineers Practice Set
Q55. Compute the mean and the variance of X as defined in Q24, as wellas E[X(5−X)].
Based on course notes by Rafa l Kulik 55

MAT 2377 – Probability and Statistics for Engineers Practice Set
Q56. In 80% of cases when a basketball player attempts a free throw,they are successful. Assume that each of the free throw attempts areindependent. Let X be the minimum number of attempts in order tosucceed 10 times. Find the p.m.f. of X and the probability that X = 12.
Based on course notes by Rafa l Kulik 56

MAT 2377 – Probability and Statistics for Engineers Practice Set
Q57. Let X be the minimum number of independent trials (each withprobability of success p) that are needed to observe r successes. The p.m.f.of X is
f(x) = P (X = x) =
(x− 1
r − 1
)pr(1− p)x−1, x = r, r + 1, . . .
The mean and variance of X are E[X] = rp and Var[X] = r(1−p)
p2. Compute
the mean minimum number of independent free throw attempts requiredto observe 10 successful free throws if the probability of success at the freethrown line is 80%. What about the standard deviation of X?
Based on course notes by Rafa l Kulik 57
MAT 2377 – Probability and Statistics for Engineers Practice Set
Q58. If n ≥ 20 and p ≤ 0.05, it can be shown that the binomialdistribution with n trials and an independent probability of success p canbe approximated by a Poisson distribution with parameter λ = np. This iscalled the Poisson approximation:
(np)xe−np
x!≈(n
x
)px(1− p)n−x.
A manufacturer of light bulbs knows that 2% of its bulbs are defective.What is the probability that a box of 100 bulbs contains exactly at most 3defective bulbs? Use the Poisson approximation to estimate the probability.
Based on course notes by Rafa l Kulik 58

MAT 2377 – Probability and Statistics for Engineers Practice Set
Q59. Consider a discrete random variable X which has a uniformdistribution over the first positive m integers, i.e.
f(x) = P (X = x) =1
m, x = 1, . . . ,m,
and f(x) = 0 otherwise. Compute the mean and the variance of X. Forwhat values of m is E[X] > Var[X]?
Based on course notes by Rafa l Kulik 59

MAT 2377 – Probability and Statistics for Engineers Practice Set
Q60. Let X be a random variable. What is the value of b (where b is nota function of X) which minimizes E[(X − b)2]?
Based on course notes by Rafa l Kulik 60

MAT 2377 – Probability and Statistics for Engineers Practice Set
Q61. An experiment consists in selecting a bowl, and then drawing a ballfrom that bowl. Bowl B1 contains two red balls and four white balls; bowlB2 contains one red ball and two white balls; and bowl B3 contains five redballs and four white balls. The probabilities for selecting the bowls are notuniform: P (B1) = 1/3, P (B2) = 1/6, and P (B3) = 1/2, respectively.
a) What is the probability of drawing a red ball P (R)?
b) If the experiment is conducted and a red ball is drawn, what is theprobability that the ball was drawn from bowl B1? B2? B3?
Based on course notes by Rafa l Kulik 61

MAT 2377 – Probability and Statistics for Engineers Practice Set
Q62. The time to reaction to a visual signal follows a normal distributionwith mean 0.5 seconds and standard deviation 0.035 seconds.
a) What is the probability that time to react exceeds 1 second?
b) What is the probability that time to react is between 0.4 and 0.5 seconds?
c) What is the time to reaction that is exceeded with probability of 0.9?
Based on course notes by Rafa l Kulik 62

MAT 2377 – Probability and Statistics for Engineers Practice Set
Q63. Suppose that the random variable X has the following cumulativedistribution function:
FX(x) =
0, x ≤ 0x3, 0 ≤ x ≤ 11, x ≥ 1.
a) Compute P (X > 0.5).
b) Compute P (0.2 < X < 0.8).
c) Find the probability density function of X.
d) Find E[X] and Var[X].
Based on course notes by Rafa l Kulik 63

MAT 2377 – Probability and Statistics for Engineers Practice Set
Q64. Assume that arrivals of small aircrafts at an airport can be modeledby a Poisson random variable with an average of 1 aircraft per hour.
a) What is the probability that more than 3 aircrafts arrive within an hour?
b) Consider 15 consecutive and disjoint 1−hour intervals. What is theprobability that in none of these intervals we have more than 3 aircraftarrivals?
c) What is the probability that exactly 3 aircrafts arrive within 2 hours?
Based on course notes by Rafa l Kulik 64

MAT 2377 – Probability and Statistics for Engineers Practice Set
Q65. Refer to the situation described in Q3.
d) What is the length of the interval such that the probability of having noarrival within this interval is 0.1?
e) What is the probability that one has to wait at least 3 hours for thearrival of 3 aircrafts?
f) What is the mean and variance of the waiting time for 3 aircrafts?
Based on course notes by Rafa l Kulik 65

MAT 2377 – Probability and Statistics for Engineers Practice Set
Q66. Assume that X is normally distributed with mean 10 and standarddeviation 3. In each case, find the value x such that:
a) P (X > x) = 0.5
b) P (X > x) = 0.95
c) P (x < X < 10) = 0.2
d) P (−x < X − 10 < x) = 0.95
e) P (−x < X − 10 < x) = 0.99
Based on course notes by Rafa l Kulik 66

MAT 2377 – Probability and Statistics for Engineers Practice Set
Q67. Let X ∼ Exp(λ) with mean 10. What is P (X > 30|X > 10) equalto?
1− exp(−2)a) exp(−2)b) exp(−3)c)
1/10d) exp(−200)e) none of the precedingf)
Based on course notes by Rafa l Kulik 67

MAT 2377 – Probability and Statistics for Engineers Practice Set
Q68. Let X denote a number of failures of a particular machine within amonth. Its probability mass function is given by
x 0 1 2 3 4 5P (X = x) 0.17 0.23 0.19 0.13 0.08 0.2
The probability that there are fewer than 3 failures within a month, and theexpected number of failures within a month are, respectively,
0.28; 2.50a) 0.72; 2.32b) 0.59; 2.32c)
0.80; 2.50d) none of the precedinge)
Based on course notes by Rafa l Kulik 68

MAT 2377 – Probability and Statistics for Engineers Practice Set
Q69. A company’s warranty document states that the probability that anew swimming pool requires some repairs within the first year is 20%. Whatis the probability, that the sixth sold pool is the first one which requiressome repairs within the first year?
0.6068a) 0.3932b) 0.9345c) 0.0655d) none ofthe preceding
e)
Based on course notes by Rafa l Kulik 69

MAT 2377 – Probability and Statistics for Engineers Practice Set
Q70. In a group of ten students, each student has a probability of 0.7 ofpassing the exam. What is the probability that exactly 7 of them will passan exam?
0.9829a) 0.2668b) 0.0480c) 0.9520d) none ofthe preceding
e)
Based on course notes by Rafa l Kulik 70
MAT 2377 – Probability and Statistics for Engineers Practice Set
Q71. Two companies A and B consider making an offer for roadconstruction. The company A makes the submission. The probabilitythat B submits the proposal is 1/3. If B does not submit the proposal,the probability that A gets the job is 3/5. If B submits the proposal, theprobability that A gets the job is 1/3. What is the probability that A willget the job?
0.6667a) 0.5111b) 0.7500c) 0.3333d) none ofthe preceding
e)
Based on course notes by Rafa l Kulik 71

MAT 2377 – Probability and Statistics for Engineers Practice Set
Q72. In a box of 50 fuses there are 8 defective ones. We choose 5 fusesrandomly (without replacement). What is the probability that all 5 fusesare not defective?
0.4015a) 0.84b) 0.3725c) 0.4275d) none ofthe preceding
e)
Based on course notes by Rafa l Kulik 72
MAT 2377 – Probability and Statistics for Engineers Practice Set
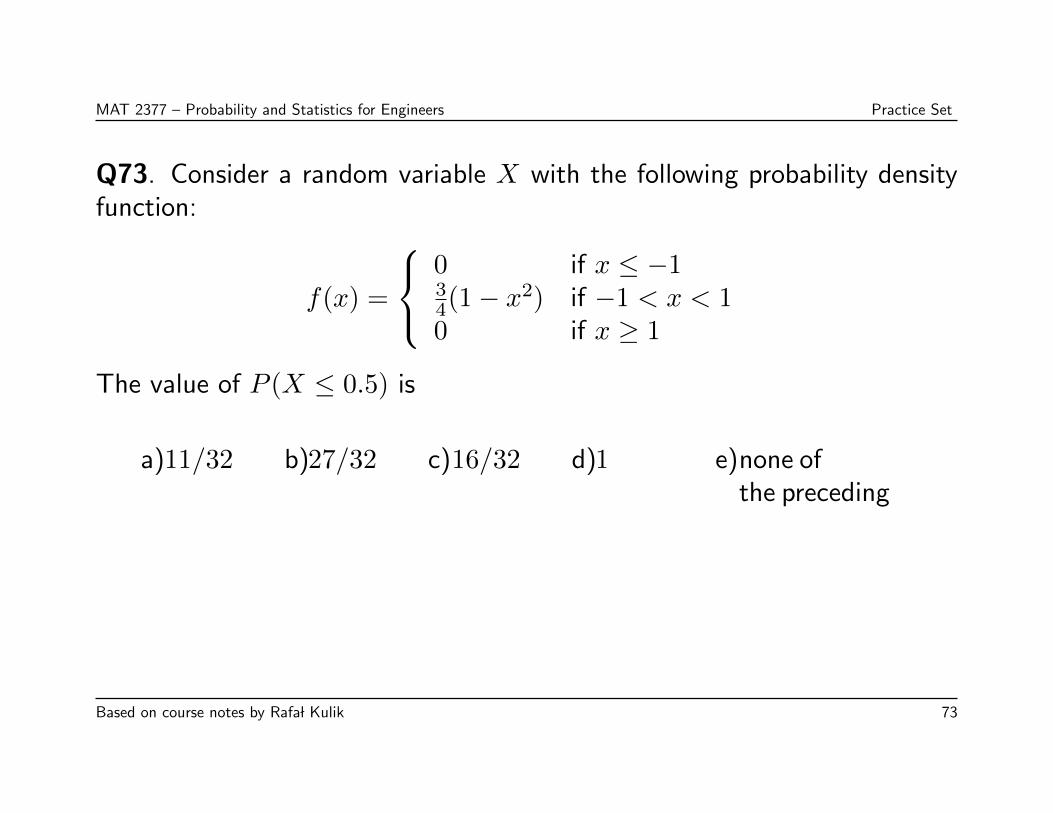
Q73. Consider a random variable X with the following probability densityfunction:
f(x) =
0 if x ≤ −134(1− x2) if −1 < x < 10 if x ≥ 1
The value of P (X ≤ 0.5) is
11/32a) 27/32b) 16/32c) 1d) none ofthe preceding
e)
Based on course notes by Rafa l Kulik 73
MAT 2377 – Probability and Statistics for Engineers Practice Set
Q74. A receptionist receives on average 2 phone calls per minute. If thenumber of calls follows a Poisson process, what is the probability that thewaiting time for call will be greater than 1 minute?
e−1/15a) e−1/30b) e−2c) e−1d) none ofthe preceding
e)
Based on course notes by Rafa l Kulik 74
MAT 2377 – Probability and Statistics for Engineers Practice Set
Q75. A company manufactures hockey pucks. It is known that their weightis normally distributed with mean 1 and standard deviation 0.05. The pucksused by the NHL must weigh between 0.9 and 1.1. What is the probabilitythat a randomly chosen puck can be used by NHL?
1a) 0.9545b) 0.4560c) 0.9772d) none ofthe preceding
e)
Based on course notes by Rafa l Kulik 75

MAT 2377 – Probability and Statistics for Engineers Practice Set
Q76. Consider the following dataset:
12 14 6 10 1 20 4 8
The median and the first quartile of the dataset are, respectively:
9, 5a) 5.5, 6b) 10, 5c) 5, 10d) none ofthe preceding
e)
Based on course notes by Rafa l Kulik 76

MAT 2377 – Probability and Statistics for Engineers Practice Set
Q77. Let X denote a number of failures of a particular machine within amonth. Its probability mass function is given by
x 0 1 2 3 4 5P (X = x) 0.17 0.23 0.19 0.13 0.08 0.2
The probability that there are less than 3 failures within a month, and
the expected number of failures within a month
are, respectively:
0.28; 2.50a) 0.72; 2.32b) 0.59; 2.32c) 0.80; 2.50d) none ofthe preceding
e)
Based on course notes by Rafa l Kulik 77

MAT 2377 – Probability and Statistics for Engineers Practice Set
Q78. Consider the following R output:
> pbinom(15,100,0.25) > pbinom(16,100,0.25)
[1] 0.01108327 [1] 0.02111062
> pbinom(17,100,0.25) > pbinom(30,100,0.25)
[1] 0.03762626 [1] 0.8962128
> pbinom(31,100,0.25) > pbinom(32,100,0.25)
[1] 0.9306511 [1] 0.9554037
Let X be a binomial random variable with n = 100 and p = 0.25. Usingthe R output above, calculate P (16 ≤ X ≤ 31).
0.9196a) 0.9095b) 0.9348c) 0.9443d) none ofthe preceding
e)
Based on course notes by Rafa l Kulik 78
MAT 2377 – Probability and Statistics for Engineers Practice Set
Q79. Suppose that samples of size n = 25 are selected at random from anormal population with mean 100 and standard deviation 10. What is theprobability that sample mean falls in the interval
(µX − 1.8σX, µX + 1.0σX)?
Based on course notes by Rafa l Kulik 79

MAT 2377 – Probability and Statistics for Engineers Practice Set
Q80. The compressive strength of concrete is normally distributed withmean µ = 2500 and standard deviation σ = 50. A random sample of size 5is taken. What is the standard error of the sample mean?
Based on course notes by Rafa l Kulik 80
MAT 2377 – Probability and Statistics for Engineers Practice Set
Q81. Suppose that X1 ∼ N (3, 4) and X2 ∼ NN(3, 45). Given that X1
and X2 are independent random variables, what is a good approximation toP (X1 +X2 > 9.5)?
0.3085a) 0.6915b) 0.5279c) 0.4271d) none ofthe preceding
e)
Based on course notes by Rafa l Kulik 81

MAT 2377 – Probability and Statistics for Engineers Practice Set
Q82. The amount of time that a customer spends waiting at an airportcheck-in counter is a random variable with mean µ = 8.2 minutes andstandard deviation σ = 1.5 minutes. Suppose that a random sample ofn = 49 customers is taken. Compute the approximate probability that theaverage waiting time for these customers is:
Less than 10 min.a) Between 5 and 10min.
b) Less than 6 min.c)
Based on course notes by Rafa l Kulik 82

MAT 2377 – Probability and Statistics for Engineers Practice Set
Q83. A random sample of size n1 = 16 is selected from a normal populationwith a mean of 75 and standard deviation of 8. A second random sampleof size n2 = 9 is taken independently from another normal population withmean 70 and standard deviation of 12. Let X1 and X2 be the two samplemeans. Find
a) The probability that X1 −X2 exceeds 4.
b) The probability that 3.5 < X1 −X2 < 5.5.
Based on course notes by Rafa l Kulik 83

MAT 2377 – Probability and Statistics for Engineers Practice Set
Q84. Discuss the normality of the following dataset:
170,295,200,165,140,190,195,142,138,148,110,140,103,176,125,
126,204,196,98,123,124,152,177,168,175,186,140,147,174,155,195
Based on course notes by Rafa l Kulik 84

MAT 2377 – Probability and Statistics for Engineers Practice Set
Q85. Using R, illustrate the central limit theorem by generating M = 300samples of size n = 30 from:
a normal random variable with mean 10 and variance 0.75;
a binomial random variable with 3 trials and probability of success 0.3.
Repeat the same procedure for samples of size n = 200. What do youobserve?
Hint: In each case, assess the normality using a histogram and a QQ plot.
Based on course notes by Rafa l Kulik 85
MAT 2377 – Probability and Statistics for Engineers Practice Set
Q86. Suppose that the weight in pounds of a North American adult can berepresented by a normal random variable with mean 150 lbs and variance900 lbs2. An elevator containing a sign “Maximum 12 people” can safelycarry 2000 lbs. The probability that 12 North American adults will notoverload the elevator is closest to
0.9729a) 0.4501b) 0.0271c) 0.0001d) 1.3e) none ofthe preceding
f)
Based on course notes by Rafa l Kulik 86
MAT 2377 – Probability and Statistics for Engineers Practice Set
Q87. Let X1, · · · , X50 be an independent random sample from a Poissondistribution with mean 1. Set Y = X1 + · · · + X50. The approximateprobability P (48 ≤ Y ≤ 52) is closest to:
0.6368a) 0.4534b) 0.2227c) 0.9988d) 0.5000e) none ofthe preceding
f)
Based on course notes by Rafa l Kulik 87

MAT 2377 – Probability and Statistics for Engineers Practice Set
Q88. A new type of electronic flash for cameras will last an average of 5000hours with a standard deviation of 500 hours. A quality control engineerintends to select a random sample of 100 of these flashes and use themuntil they fail. What is the probability that the mean life time of the sampleof 100 flashes will be less than 4928 hours?
0.0749a) 0.9251b) 0.0002c) 0.4532d) none ofthe preceding
e)
Based on course notes by Rafa l Kulik 88

MAT 2377 – Probability and Statistics for Engineers Practice Set
Q89. A manufacturer of fluoride toothpaste regularly measures theconcentration of of fluoride in the toothpaste to make sure that it iswithin the specifications of 0.85− 1.10 mg/g. The table on the next pagelists 100 such measurements. Build a relative frequency histogram of thedata (a histogram with area = 1).
Based on course notes by Rafa l Kulik 89

MAT 2377 – Probability and Statistics for Engineers Practice Set
Based on course notes by Rafa l Kulik 90

MAT 2377 – Probability and Statistics for Engineers Practice Set
Q90. Use the data from Q89.
a) Compute the data’s mean x and it’s standard deviation sx (use acomputer program, for goodness’ sake!)
b) Using the frequency table of fluoride concentrations (Table 6.1-4), youcan also approximate the mean and variance. Let ui be the class markfor each of the histogram’s 8 classes (the midpoint along the rectangles’widths), n be the total number of observations, and k be the number ofclasses. Then
u =1
n
k∑i=1
fiui and s2u =1
n− 1fi(ui − u)2.
Compute u and su. How do they compare with x and sx?
Based on course notes by Rafa l Kulik 91

MAT 2377 – Probability and Statistics for Engineers Practice Set
Q91. Use the data from Q89.
a) Provide a the 5−number summary of the data (q0, q1, q2, q3, q4), as wellas the interquartile range IQR.
b) Display the 5−number summary as a boxplot chart.
Based on course notes by Rafa l Kulik 92
MAT 2377 – Probability and Statistics for Engineers Practice Set
Q92. Use the data from Q89. Compute the midrange 12(Q0 + Q4), the
trimean 14(Q1 + 2Q2 +Q3), and the range Q4 −Q0 for the fluoride data.
Based on course notes by Rafa l Kulik 93

MAT 2377 – Probability and Statistics for Engineers Practice Set
Q93. A new cure has been developed for a certain type of cement thatshould change its mean compressive strength. It is known that the standarddeviation of the compressive strength is 130 kg/cm2 and that we mayassume that it follows a normal distribution. 9 chunks of cement havebeen tested and the observed sample mean is X = 4970. Find the 95%confidence interval for the mean of the compressive strength.
[4858.37, 5081.63]a) [4885.07, 5054.93]b) [4858.37, 5054.93]c)
[4944.52, 4995.48]d) none of the precedinge)
Based on course notes by Rafa l Kulik 94

MAT 2377 – Probability and Statistics for Engineers Practice Set
Q94. Consider the same set-up as in Q93, but now 100 chunks of cementhave been tested and the observed sample mean is X = 4970. Find the95% confidence interval for the mean of the compressive strength.
[4858.37, 5081.63]a) [4885.07, 5054.93]b) [4858.37, 5054.93]c)
[4944.52, 4995.48]d) none of the precedinge)
Based on course notes by Rafa l Kulik 95

MAT 2377 – Probability and Statistics for Engineers Practice Set
Q95. Consider the same set-up as in Q93, but now we do not know thestandard deviation of the normal distribution. 9 chunks of cement havebeen tested, and the measurements are
5001, 4945, 5008, 5018, 4991, 4990, 4968, 5020, 5003.
Find the 95% confidence interval for the mean of the compressive strength.
[4858.37, 5081.63]a) [4885.07, 5054.93]b) [4858.37, 5054.93]c)
[4944.52, 4995.48]d) none of the precedinge)
Based on course notes by Rafa l Kulik 96
MAT 2377 – Probability and Statistics for Engineers Practice Set
Q96. A steel bar is measured with a device which a known precision ofσ = 0.5mm. Suppose we want to estimate the mean measurement with anerror of at most 0.2mm at a level of significance α = 0.05. What samplesize is required? Assume normality.
25a) 24b) 6c) 7d) none ofthe preceding
e)
Based on course notes by Rafa l Kulik 97
MAT 2377 – Probability and Statistics for Engineers Practice Set
Q97. In a random sample of 1000 houses in the city, it is found that 228are heated by oil. Find a 99% C.I. for the proportion of homes in the citythat are heated by oil.
[0.202, 0.254]a) [0.197, 0.259]b) [0.194, 0.262]c)
[0.185, 0.247]d) none of the precedinge)
Based on course notes by Rafa l Kulik 98

MAT 2377 – Probability and Statistics for Engineers Practice Set
Q98. Past experience indicates that the breaking strength of yarn usedin manufacturing drapery material is normally distributed and that σ = 2psi. A random sample of 15 specimens is tested and the average breakingstrength is found to be x = 97.5 psi.
a) Find a 95% confidence interval on the true mean breaking strength.
b) Find a 99% confidence interval on the true mean breaking strength.
Based on course notes by Rafa l Kulik 99

MAT 2377 – Probability and Statistics for Engineers Practice Set
Q99. The diameter holes for a cable harness follow a normal distributionwith σ = 0.01 inch. For a sample of size 10, the average diameter is 1.5045inches.
a) Find a 99% confidence interval on the mean hole diameter.
b) Repeat this for n = 100.
Based on course notes by Rafa l Kulik 100

MAT 2377 – Probability and Statistics for Engineers Practice Set
Q100. A journal article describes the effect of delamination on the naturalfrequency of beams made from composite laminates. The observations areas follows:
230.66, 233.05, 232.58, 229.48, 232.58, 235.22.
Assuming that the population is normal, find a 95% confidence interval onthe mean natural frequency.
Based on course notes by Rafa l Kulik 101
MAT 2377 – Probability and Statistics for Engineers Practice Set
Q101. A textile fiber manufacturer is investigating a new drapery yarn,which the company claims has a mean thread elongation of µ = 12 kilogramswith standard deviation of σ = 0.5 kilograms.
a) What should be the sample size so that with probability 0.95 we willestimate the mean thread elongation with error at most 0.15 kg?
b) What should be the sample size so that with probability 0.95 we willestimate the mean thread elongation with error at most 0.05 kg?
Based on course notes by Rafa l Kulik 102

MAT 2377 – Probability and Statistics for Engineers Practice Set
Q102. The brightness of television picture tube can be evaluated bymeasuring the amount of current required to achieve a particular brightnesslevel. An engineer thinks that one has to use 300 microamps of current toachieve the required brightness level. A sample of size n = 20 has beentaken to verify the engineer’s hypotheses.
a) Formulate the null and the alternative hypotheses. Use a two-sided testalternative.
b) For the sample of size n = 20 we obtain x = 319.2 and s = 18.6. Testthe hypotheses from part a) with α = 5% by computing a critical region.Calculate the p-value.
c) Use the data from part b) to construct a 95% confidence interval for themean required current.
Based on course notes by Rafa l Kulik 103

MAT 2377 – Probability and Statistics for Engineers Practice Set
Q103. We say that a particular production process is stable if it producesat most 2% defective items. Let p be the true proportion of defective items.
a) We sample n = 200 items at random and consider hypotheses testingabout p. Formulate null and alternative hypotheses.
b) What is your conclusion of the above test, if one observes 3 defectiveitems out of 200? Note: you have to choose an appropriate level α.
Based on course notes by Rafa l Kulik 104

MAT 2377 – Probability and Statistics for Engineers Practice Set
Q104. Ten engineers’ knowledge of basic statistical concepts was measuredon a scale of 0 − 100, before and after a short course in statistical qualitycontrol. The result are as follows:
Engineer 1 2 3 4 5 6 7 8 9 10Before X1i 43 82 77 39 51 66 55 61 79 43After X2i 51 84 74 48 53 61 59 75 82 53
Let µ1 and µ2 be the mean mean score before and after the course. Performthe test H0 : µ1 = µ2 against HA : µ1 < µ2. Use α = 0.05.
Based on course notes by Rafa l Kulik 105

MAT 2377 – Probability and Statistics for Engineers Practice Set
105. A company is currently using titanium alloy rods it purchases fromsupplier A. A new supplier (supplier B) approaches the company and offersthe same quality (at least according to supplier B’s claim) rods at a lowerprice. The company is certainly interested in the offer. At the same time,the company wants to make sure that the safety of their product is notcompromised. The company randomly selects ten rods from each of thelots shipped by suppliers A and B and measures the yield strengths of theselected rods. The observed sample mean and sample standard deviationare 651 MPa and 2 MPa for supplier’s A rods, respectively, and the sameparameters are 657 MPa and 3 MPa for supplier B’s rods. Perform the testH0 : µA = µB against µA 6= µB. Use α = 0.05. Assume that the variancesare equal but unknown.
Based on course notes by Rafa l Kulik 106

MAT 2377 – Probability and Statistics for Engineers Practice Set
106. The deflection temperature under load for two different types of plasticpipe is being investigated. Two random samples of 15 pipe specimens aretested, and the deflection temperatures observed are as follows:
Type 1: 206, 188, 205, 187, 194, 193, 207, 185, 189, 213, 192, 210, 194, 178, 205.
Type 2: 177, 197, 206, 201, 180, 176, 185, 200, 197, 192, 198, 188, 189, 203, 192.
Does the data support the claim that the deflection temperature underload for type 1 pipes exceeds that of type 2? Calculate the p-value, usingα = 0.05, and state your conclusion.
Based on course notes by Rafa l Kulik 107

MAT 2377 – Probability and Statistics for Engineers Practice Set
Q107. It is claimed that 15% of a certain population is left-handed,but a researcher doubts this claim. They decide to randomly sample 200people and use the anticipated small number to provide evidence againstthe claim of 15%. Suppose 22 of the 200 are left-handed. Compute thep−value associated with the hypothesis (assuming a binomial distribution),and provide an interpretation.
Based on course notes by Rafa l Kulik 108
MAT 2377 – Probability and Statistics for Engineers Practice Set
Q108. A child psychologist believes that nursery school attendance improveschildren’s social perceptiveness (SP). They use 8 pairs of twins, randomlychoosing one to attend nursery school and the other to stay at home, andthen obtains scores for all 16. In 6 of the 8 pairs, the twin attending nurseryschool scored better on the SP test. Compute the p−value associatedwith the hypothesis (assuming a binomial distribution), and provide aninterpretation.
Based on course notes by Rafa l Kulik 109

MAT 2377 – Probability and Statistics for Engineers Practice Set
Q109. It is claimed that the breaking strength of yarn used in manufacturingdrapery material is normally distributed with mean 97 and σ = 2 psi. Arandom sample of nine specimens is tested and the average breaking strengthis found to be X = 98 psi. Formulate a test for this situation. Should it be1−sided or 2−sided? What value of α should you use? What conclusiondoes the test and the sample yield?
Based on course notes by Rafa l Kulik 110

MAT 2377 – Probability and Statistics for Engineers Practice Set
Q110. A civil engineer is analyzing the compressive strength of concrete.It is claimed that its mean is 80 and variance is known to be 2. A randomsample of size 60 yields the sample mean 59. Formulate a test for thissituation. Should it be 1−sided or 2−sided? What value of α should youuse? What conclusion does the test and the sample yield?
Based on course notes by Rafa l Kulik 111

MAT 2377 – Probability and Statistics for Engineers Practice Set
Q111. The sugar content of the syrup in canned peaches is claimed to benormally distributed with mean 10 and variance 2. A random sample ofn = 10 cans yields a sample mean 11. Another random sample of n = 10cans yields a sample mean 9. Formulate a test for this situation. Should itbe 1−sided or 2−sided? What value of α should you use? What conclusiondoes the test and the sample yield?
Based on course notes by Rafa l Kulik 112

MAT 2377 – Probability and Statistics for Engineers Practice Set
Q112. A certain power supply is stated to provide a constant voltageoutput of 10kV. Ten measurements are taken and yield the sample mean of11kV. Formulate a test for this situation. Should it be 1−sided or 2−sided?What value of α should you use? What conclusion does the test and thesample yield?
Based on course notes by Rafa l Kulik 113

MAT 2377 – Probability and Statistics for Engineers Practice Set
Q113. The mean water temperature downstream from a power water plantcooling tower discharge pipe should be no more than 100F. Past experiencehas indicated that that the standard deviation is 2F. The water temperatureis measured on nine randomly chosen days, and the average temperature isfound to be 98F. Formulate a test for this situation. Should it be 1−sidedor 2−sided? What value of α should you use? What conclusion does thetest and the sample yield?
Based on course notes by Rafa l Kulik 114

MAT 2377 – Probability and Statistics for Engineers Practice Set
Q114. We are interested in the mean burning rate of a solid propellantused to power aircrew escape systems. We want to determine whether ornot the mean burning rate is 50 cm/second. A sample of 10 specimens istested and we observe X = 48.5. Assume normality with σ = 2.5.
Based on course notes by Rafa l Kulik 115

MAT 2377 – Probability and Statistics for Engineers Practice Set
Q115. Ten individuals have participated in a diet modification program tostimulate weight loss. Their weight both before and after participation inthe program is shown below:
Before 195, 213, 247, 201, 187, 210, 215, 246, 294, 310After 187, 195, 221, 190, 175, 197, 199, 221, 278, 285
Is there evidence to support the claim that this particular diet-modificationprogram is effective in producing mean weight reduction? Use α = 0.05.Compute the associated p−value.
Based on course notes by Rafa l Kulik 116

MAT 2377 – Probability and Statistics for Engineers Practice Set
Q116. We want to test the hypothesis that the average content ofcontainers of a particular lubricant equals 10L against the two-sidedalternative. The contents of a random sample of 10 containers are
10.2 9.7 10.1 10.3 10.19.8 9.9 10.4 10.3 9.5
Find the p−value of this two-sided test. Assume that the distribution ofcontents is normal. Note that
∑10i=1 x
2i = 1006.79, if xi represent the
measurements.
0.05 < p < 0.10a) 0.10 < p < 0.20b) 0.25 < p < 0.40c)
0.50 < p < 0.80d) none of the precedinge)
Based on course notes by Rafa l Kulik 117

MAT 2377 – Probability and Statistics for Engineers Practice Set
Q117. An engineer measures the weight of n = 25 pieces of steel, whichfollows a normal distribution with variance 16. The average weight for thesample is X = 6. They want to test for H0 : µ = 5 against H1 : µ > 5.What is the p−value for the test?
0.05000a) 0.10565b) 0.89435c) 1.0000d) none ofthe preceding
e)
Based on course notes by Rafa l Kulik 118
MAT 2377 – Probability and Statistics for Engineers Practice Set
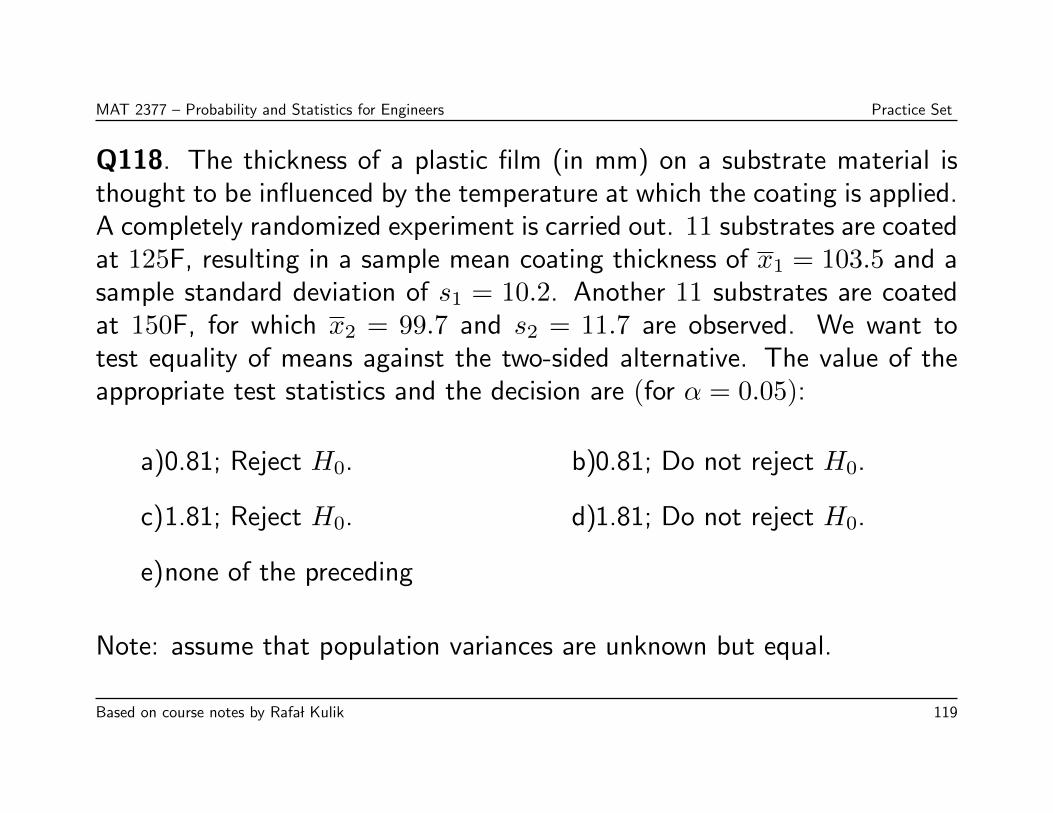
Q118. The thickness of a plastic film (in mm) on a substrate material isthought to be influenced by the temperature at which the coating is applied.A completely randomized experiment is carried out. 11 substrates are coatedat 125F, resulting in a sample mean coating thickness of x1 = 103.5 and asample standard deviation of s1 = 10.2. Another 11 substrates are coatedat 150F, for which x2 = 99.7 and s2 = 11.7 are observed. We want totest equality of means against the two-sided alternative. The value of theappropriate test statistics and the decision are (for α = 0.05):
0.81; Reject H0.a) 0.81; Do not reject H0.b)
1.81; Reject H0.c) 1.81; Do not reject H0.d)
none of the precedinge)
Note: assume that population variances are unknown but equal.
Based on course notes by Rafa l Kulik 119
MAT 2377 – Probability and Statistics for Engineers Practice Set
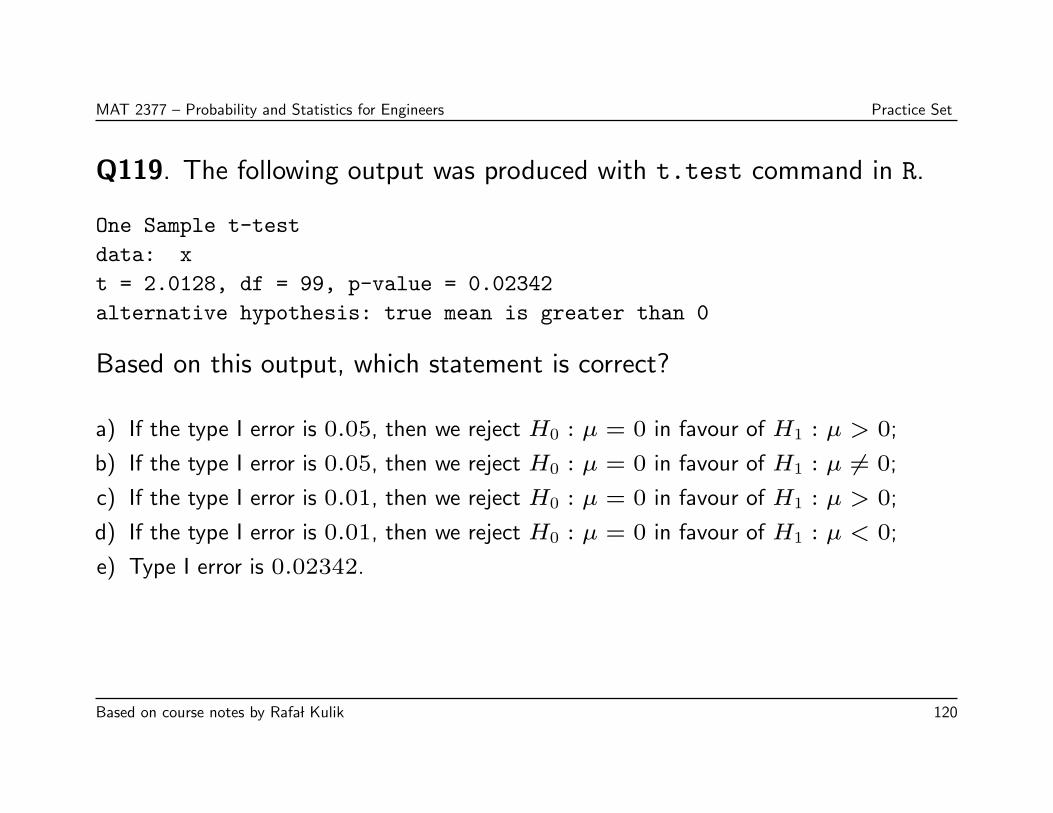
Q119. The following output was produced with t.test command in R.
One Sample t-test
data: x
t = 2.0128, df = 99, p-value = 0.02342
alternative hypothesis: true mean is greater than 0
Based on this output, which statement is correct?
a) If the type I error is 0.05, then we reject H0 : µ = 0 in favour of H1 : µ > 0;
b) If the type I error is 0.05, then we reject H0 : µ = 0 in favour of H1 : µ 6= 0;
c) If the type I error is 0.01, then we reject H0 : µ = 0 in favour of H1 : µ > 0;
d) If the type I error is 0.01, then we reject H0 : µ = 0 in favour of H1 : µ < 0;
e) Type I error is 0.02342.
Based on course notes by Rafa l Kulik 120

MAT 2377 – Probability and Statistics for Engineers Practice Set
Q120. A pharmaceutical company claims that a drug decreases a blood pressure. A
physician doubts this claim. They test 10 patients and records results before and after the
drug treatment:
> Before=c(140,135,122,150,126,138,141,155,128,130)
> After=c(135,136,120,148,122,136,140,153,120,128)
At the R command prompt, they type:
> test.t(Before,After,alternative="greater")
data: Before and After
t = 0.5499, p-value = 0.2946
alternative hypothesis: true difference in means is greater than 0
sample estimates: mean of x mean of y
136.5 133.8
Their assistant claims that the command should instead be:
> test.t(Before,After,paired=TRUE,alternative="greater")
Based on course notes by Rafa l Kulik 121

MAT 2377 – Probability and Statistics for Engineers Practice Set
data: Before and After t = 3.4825, df = 9, p-value = 0.003456
alternative hypothesis: true difference in means is greater than 0
sample estimates: mean of the differences
2.7
Which answer is best?
a) The assistant uses the correct command. There is not enough evidence to justify that
the new drug decreases blood pressure;
b) The assistant uses the correct command. There is enough evidence to justify that the
new drug decreases blood pressure for any reasonable choice of α;
c) The physician uses the correct command. There is not enough evidence to justify that
the new drug decreases blood pressure;
d) The physician uses the correct command. There is enough evidence to justify that the
new drug decreases blood pressure for any reasonable choice of α;
e) Nobody is correct, t−tests should not be used here.
Based on course notes by Rafa l Kulik 122

MAT 2377 – Probability and Statistics for Engineers Practice Set
Q121. A company claims that the mean deflection of a piece of steel whichis 10ft long is equal to 0.012ft. A buyer suspects that it is bigger than0.012ft. The following data xi has been collected:
0.0132 0.0138 0.0108 0.0126 0.0136 0.0112 0.0124 0.0116 0.0127 0.0131
Assuming normality and that∑10i=1 x
2i = 0.0016, what are the p−value for
the appropriate one-sided test and the corresponding decision?
p ∈ (0.05, 0.1) and reject H0 at α = 0.05.a)
p ∈ (0.05, 0.1) and do not reject H0 at α = 0.05.b)
p ∈ (0.1, 0.25) and reject H0 at α = 0.05.c)
p ∈ (0.1, 0.25) and do not reject H0 at α = 0.05.d)
none of the precedinge)
Based on course notes by Rafa l Kulik 123
MAT 2377 – Probability and Statistics for Engineers Practice Set
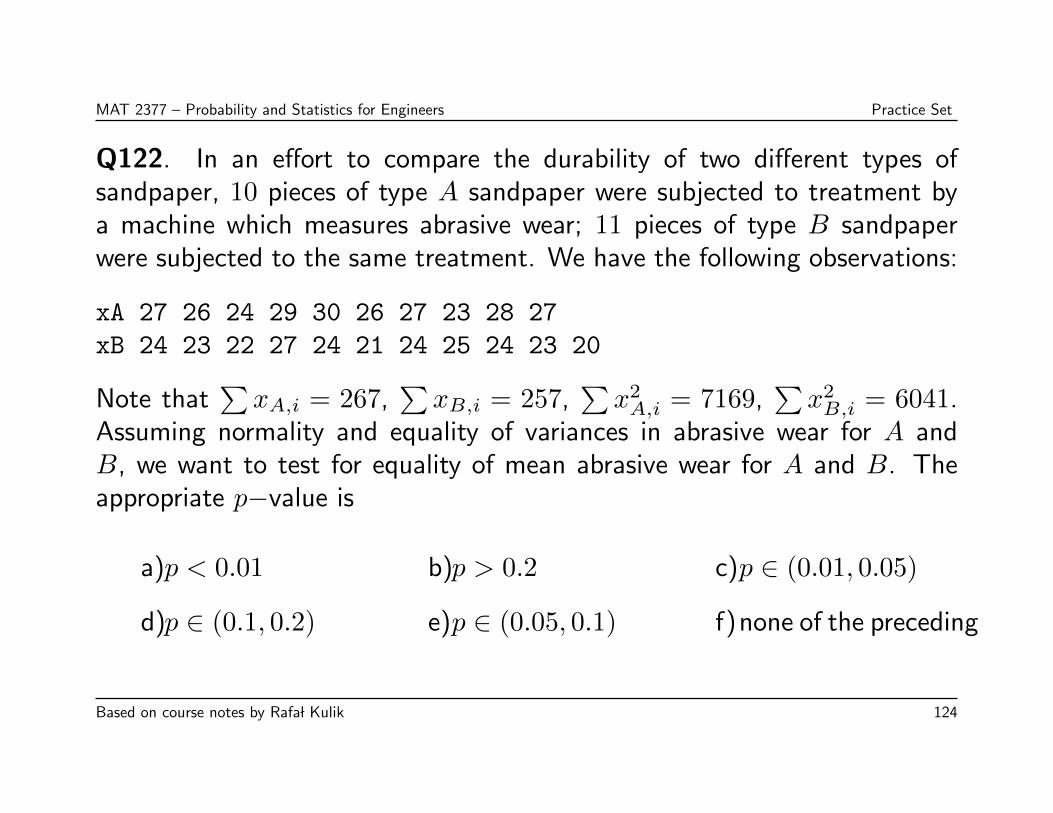
Q122. In an effort to compare the durability of two different types ofsandpaper, 10 pieces of type A sandpaper were subjected to treatment bya machine which measures abrasive wear; 11 pieces of type B sandpaperwere subjected to the same treatment. We have the following observations:
xA 27 26 24 29 30 26 27 23 28 27
xB 24 23 22 27 24 21 24 25 24 23 20
Note that∑xA,i = 267,
∑xB,i = 257,
∑x2A,i = 7169,
∑x2B,i = 6041.
Assuming normality and equality of variances in abrasive wear for A andB, we want to test for equality of mean abrasive wear for A and B. Theappropriate p−value is
p < 0.01a) p > 0.2b) p ∈ (0.01, 0.05)c)
p ∈ (0.1, 0.2)d) p ∈ (0.05, 0.1)e) none of the precedingf)
Based on course notes by Rafa l Kulik 124

MAT 2377 – Probability and Statistics for Engineers Practice Set
Q123. The following output was produced with t.test command in R.
One Sample t-test
data: x
t = 32.9198, df = 999, p-value < 2.2e-16
alternative hypothesis: true mean is not equal to 0
Based on this output, which statement is correct?
a) If the type I error is 0.05, then we reject H0 : µ = 0 in favour of H1 : µ > 0;
b) If the type I error is 0.05, then we reject H0 : µ = 0 in favour of H1 : µ 6= 0;
c) If the type I error is 0.01, then we reject H0 : µ = 0 in favour of H1 : µ > 0;
d) If the type I error is 0.01, then we reject H0 : µ = 0 in favour of H1 : µ < 0;
e) None of the preceding.
Based on course notes by Rafa l Kulik 125

MAT 2377 – Probability and Statistics for Engineers Practice Set
Q124. Consider a sample {X1, . . . , X10} from a normal population Xi ∼N (4, 9). Denote by X and S2 the sample mean and the sample variance,respectively. Find c such that
P
(X − 4
S/√
10≤ c)
= 0.99
1.833a) 2.326b) 1.645c) 2.821d) none ofthe preceding
e)
Based on course notes by Rafa l Kulik 126

MAT 2377 – Probability and Statistics for Engineers Practice Set
Q125. Consider the following dataset:
2.6 3.7 0.8 9.6 5.8 -0.8 0.7 0.6
4.8 1.2 3.3 5.0 3.7 0.1 -3.1 0.3
The median and the interquartile range of the sample are, respectively:
2.4, 3.3a) 1.9, 3.8b) 1.9, 1.8c) 2.9, 12.2d) none ofthe preceding
e)
Based on course notes by Rafa l Kulik 127

MAT 2377 – Probability and Statistics for Engineers Practice Set
Q126. An article in Computers and Electrical Engineering considered thespeed-up of cellular neural networks (CNN) for a parallel general-purposecomputing architecture. Various speed-ups are observed:
3.77 3.35 4.21 4.03 4.03 4.63
4.63 4.13 4.39 4.84 4.26 4.60
Assume that the population is normally distributed. The 99% C.I. for themean speed-up is:
[4.155, 4.323]a) [3.863, 4.615]b) [4.040, 4.438]c)
[3.77, 4.60]d) none of the precedinge)
Based on course notes by Rafa l Kulik 128

MAT 2377 – Probability and Statistics for Engineers Practice Set
Q127. An engineer measures the weight of n = 25 pieces of steel, whichfollows a normal distribution with variance 16. The average observed weightfor the sample is x = 6. The two-sided 95% C.I. for the mean µ is:
[−0.272, 12.272]a) [4.432, 7.568]b) [3.250, 8.750]c)
[4.120, 7.522]d) none of the precedinge)
Based on course notes by Rafa l Kulik 129

MAT 2377 – Probability and Statistics for Engineers Practice Set
Q128. Assume that random variables {X1, . . . , X8} follow a normaldistribution with mean 2 and variance 24. Independently, assume thatrandom variables {Y1, . . . , X16} follow a normal distribution with mean 1and variance 16. Let X and Y be the corresponding sample means. ThenP (X + Y > 4) is:
0.7721a) 0.30855b) 0.69165c) 0.9883d) none ofthe preceding
e)
Based on course notes by Rafa l Kulik 130

MAT 2377 – Probability and Statistics for Engineers Practice Set
Q129. A medical team wants to test whether a particular drug decreasesdiastolic blood pressure. Nine people have been tested. The teammeasured blood pressure before (X) and after (Y ) applying the drug.The corresponding means were X = 91, Y = 87. The sample variance ofthe differences was S2
D = 25. The p−value for the appropriate one-sidedtest is between:
0 and 0.025a) 0.025 and 0.05b) 0.05 and 0.1c)
0.1 and 0.25d) 0.25 and 1e) none of the precedingf)
Based on course notes by Rafa l Kulik 131

MAT 2377 – Probability and Statistics for Engineers Practice Set
Q130. A researcher studies a difference between two programminglanguages. Twelve experts familiar with both languages were asked towrite a code for a particular function using both languages and the time forwriting those codes was registered. The observations are as follows.
Expert 01 02 03 04 05 06 07 08 09 10 11 12
Lang 1 17 16 21 14 18 24 16 14 21 23 13 18
Lang 2 18 14 19 11 23 21 10 13 19 24 15 29
Construct a 95% C.I. for the mean difference between the first and thesecond language. Do we have any evidence that one of the languages ispreferable to the other (i.e. the average time to write a function is shorter)?
[−1.217, 2.550], indication thatlanguage 2 is better
a) [−1.217, 2.550], no evidencethat any of them is better
b)
[−1.217, 2.550], indication thatlanguage 1 is better
c) [−2.86, 4.19], no evidence thatany of them is better
d)
Based on course notes by Rafa l Kulik 132

MAT 2377 – Probability and Statistics for Engineers Practice Set
Q131. For a set of 12 pairs of observations on (xi, yi) from an experiment,the following summary for x and y is obtained:
12∑i=1
xi = 25,
12∑i=1
yi = 432,
12∑i=1
x2i = 59,
12∑i=1
xiyi = 880.5,
12∑i=1
y2i = 15648.
The estimated value of y at x = 5 from the least squares regression line is:
27.78a) 47.77b) 41.87c) 55.97d) none ofthe preceding
e)
Based on course notes by Rafa l Kulik 133

MAT 2377 – Probability and Statistics for Engineers Practice Set
Q132. Assuming that the simple linear regression model y = β0 + β1x+ εis appropriate for n = 14 observations, the estimated regression line iscomputed to be
y = 0.66490 + 0.83075x.
Given that Syy = 4.1289 and Sxy = 4.49094, compute the estimatedstandard error for the slope.
0.3176a) 0.0783b) 0.0855c) 0.0073d) none ofthe preceding
e)
Based on course notes by Rafa l Kulik 134

MAT 2377 – Probability and Statistics for Engineers Practice Set
Q133. An engineer wants to study the variability of the production process.A sample of size n = 10 was taken every 2 hours. After m = 25 preliminarysamples, one obtains x = 30.2 and r = 7.695. Determine the lower and theupper control limits for an R chart.
LCL= 1.69 and UCL= 13.70a) LCL= 27.81 and UCL= 32.59b)
LCL= 26.90 and UCL= 33.51c) LCL= 28.69 and UCL= 31.71d)
none of the precedinge)
Based on course notes by Rafa l Kulik 135

MAT 2377 – Probability and Statistics for Engineers Practice Set
Q134. Consider the same set-up as in Q133. Determine the lower and theupper control limits for an X chart from R.
LCL= 1.69 and UCL= 13.70a) LCL= 27.81 and UCL= 32.59b)
LCL= 26.90 and UCL= 33.51c) LCL= 28.69 and UCL= 31.71d)
none of the precedinge)
Based on course notes by Rafa l Kulik 136

MAT 2377 – Probability and Statistics for Engineers Practice Set
Q135. A company manufactures computers. To control their quality, 50computers are tested every day. The number of defectives for 15 consecutivedays are:
Sample 1 2 3 4 5 6 7 8 9 10 11 12 13 14 15
Xi 3 2 5 1 4 1 6 3 5 0 6 2 4 1 7
What are the lower and upper control limits for the mean number ofdefectives?
Based on course notes by Rafa l Kulik 137

MAT 2377 – Probability and Statistics for Engineers Practice Set
Q136. The following charts show a histogram and a boxplot for twosamples, A and B. Based on these charts, we may conclude that
only A arises from a normal populationa)
only B arises from a normal populationb)
both A and B arise from a normal populationc)
Based on course notes by Rafa l Kulik 138
MAT 2377 – Probability and Statistics for Engineers Practice Set
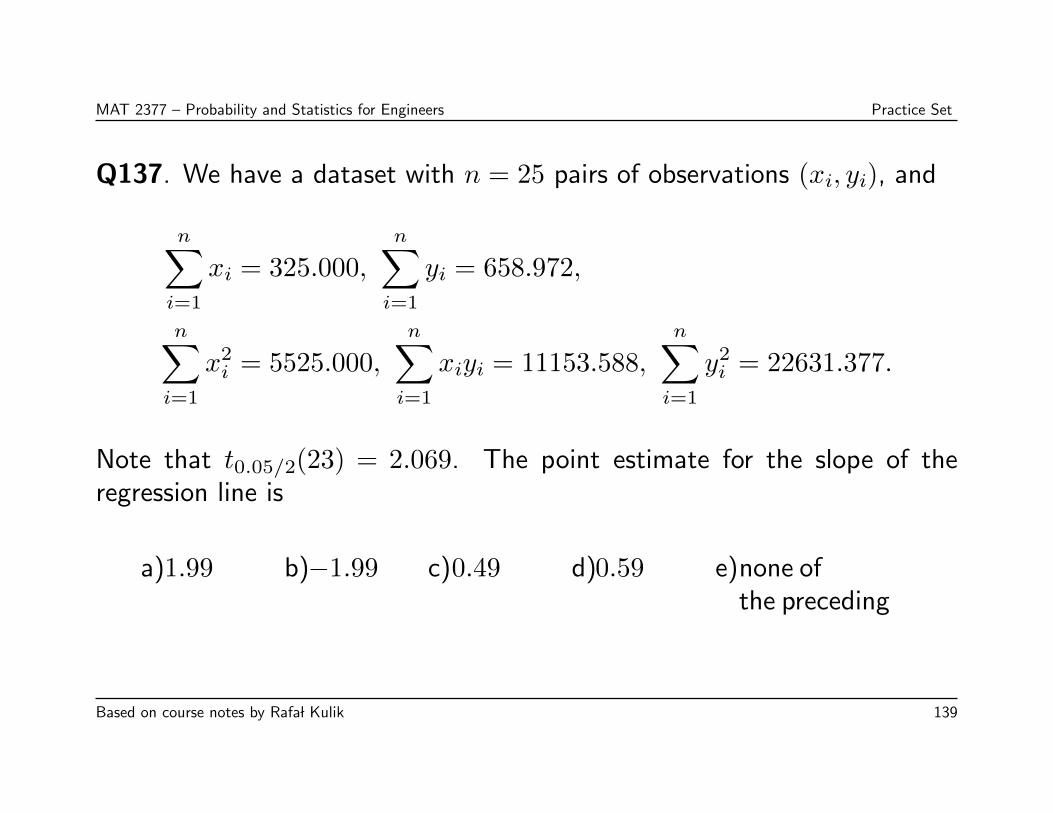
Q137. We have a dataset with n = 25 pairs of observations (xi, yi), and
n∑i=1
xi = 325.000,
n∑i=1
yi = 658.972,
n∑i=1
x2i = 5525.000,
n∑i=1
xiyi = 11153.588,
n∑i=1
y2i = 22631.377.
Note that t0.05/2(23) = 2.069. The point estimate for the slope of theregression line is
1.99a) −1.99b) 0.49c) 0.59d) none ofthe preceding
e)
Based on course notes by Rafa l Kulik 139

MAT 2377 – Probability and Statistics for Engineers Practice Set
Q138. We have a dataset with n = 25 pairs of observations (xi, yi), and
n∑i=1
xi = 325.000,
n∑i=1
yi = 658.972,
n∑i=1
x2i = 5525.000,
n∑i=1
xiyi = 11153.588,
n∑i=1
y2i = 22631.377.
Note that t0.05/2(23) = 2.069. The point estimate for the intercept of theregression line is
1.99a) −1.99b) 0.49c) 0.59d) none ofthe preceding
e)
Based on course notes by Rafa l Kulik 140

MAT 2377 – Probability and Statistics for Engineers Practice Set
Q139. We have a dataset with n = 25 pairs of observations (xi, yi), and
n∑i=1
xi = 325.000,
n∑i=1
yi = 658.972,
n∑i=1
x2i = 5525.000,
n∑i=1
xiyi = 11153.588,
n∑i=1
y2i = 22631.377.
Note that t0.05/2(23) = 2.069. What is the prediction of y for x = 30?
60.19a) 16.67b) 30c) 30.54d) none ofthe preceding
e)
Based on course notes by Rafa l Kulik 141

MAT 2377 – Probability and Statistics for Engineers Practice Set
Q140. We have a dataset with n = 25 pairs of observations (xi, yi), and
n∑i=1
xi = 325.000,
n∑i=1
yi = 658.972,
n∑i=1
x2i = 5525.000,
n∑i=1
xiyi = 11153.588,
n∑i=1
y2i = 22631.377.
Note that t0.05/2(23) = 2.069. Is the linear regression significant?
Based on course notes by Rafa l Kulik 142

MAT 2377 – Probability and Statistics for Engineers Practice Set
Q141. For the following data the correlation coefficient is most likely to be
0.01a) 0.98b) −0.5c) −0.98d)
Based on course notes by Rafa l Kulik 143

MAT 2377 – Probability and Statistics for Engineers Practice Set
Q142. For the following data the correlation coefficient is most likely to be
0.01a) 0.98b) −0.5c) −0.98d)
Based on course notes by Rafa l Kulik 144

MAT 2377 – Probability and Statistics for Engineers Practice Set
Q143. A company employs 10 part-time drivers for its fleet of trucks. Itsmanager wants to find a relationship between number of km driven (X)and number of working days (Y ) in a typical week. The drivers are hired todrive half-day shifts, so that 3.5 stands for 7 half-day shifts.
The manager wants to use the linear regression model Y = β0 +β1x+ ε onthe following data:
1 2 3 4 5 6 7 8 9 10
x 825 215 1070 550 480 920 1350 325 670 1215
y 3.5 1.0 4.0 2.0 1.0 3.0 4.5 1.5 3.0 5.0
Note that∑x2i = 7104300,
∑y2i = 99.75, and
∑xiyi = 26370. What is
the fitted regression line?
Based on course notes by Rafa l Kulik 145

MAT 2377 – Probability and Statistics for Engineers Practice Set
Q144. Using the data from question Q143, what value is the correlationcoefficient of x and y closest to?
0.437a) 0.949b) 0.113c) 1.123d) none ofthe preceding
e)
Based on course notes by Rafa l Kulik 146

MAT 2377 – Probability and Statistics for Engineers Practice Set
Q145. We want to test significance of regression, i.e. H0 : β1 = 0 againstH1 : β1 6= 0. The value of the appropriate statistic and the decision forα = 0.05 is:
8.55; do not reject H0a) 2.31; reject H0b)
8.55; reject H0c) 2.31; do not reject H0d)
none of the precedinge)
Based on course notes by Rafa l Kulik 147

MAT 2377 – Probability and Statistics for Engineers Practice Set
Q146. Regression methods were used to analyze the data from a studyinvestigating the relationship between roadway surface temperature in F (x)and pavement defection (y). Summary quantities were n = 20,∑
yi = 12.75,∑
y2i = 8.86,
∑xi = 1478
∑x2i = 143, 215.8
∑xiyi = 1083.67.
Calculate the least squares estimates of the slope and intercept.Estimate σ2.
a)
Use the equation of the fitted line to predict what pavement deflectionwould be observed when the surface temperature is 90F.
b)
Give a point estimate of the mean pavement deflection when thesurface is 85F.
c)
What change in mean pavement deflection would be expected for a1F change in surface temperature?
d)
Based on course notes by Rafa l Kulik 148

MAT 2377 – Probability and Statistics for Engineers Practice Set
Q147. Consider the data from Q146.
a) Test for significance of regression using α = 0.05. Find the p-value forthis test. What conclusion can you draw?
b) Estimate the standard errors of the slope and intercept.
Based on course notes by Rafa l Kulik 149
MAT 2377 – Probability and Statistics for Engineers Practice Set
Q148. Solve this question using R.
a) Generate a sample x of size n = 100 from a normal distribution;
b) Define y=1+2*x+rnorm(100);
c) Plot scatter plot;
d) Find the estimators of the regression parameters and add the line to thescatter plot;
f) Compute the correlation coefficient
g) Plot the residuals;
h) Comment on your results.
Based on course notes by Rafa l Kulik 150

MAT 2377 – Probability and Statistics for Engineers Practice Set
Q149. We have m = 5 preliminary samples of size n = 3 (some numbershave unfortunately been erased by accident by a clumsy co-op student):
i xi,1 xi,2 xi,3 xi ri si1 27.1 29.4 27.9 1.32 30.6 32.5 32.4 31.83 1.9 1.073 25.7 35.5 30 30.4 4.914 31.1 23.2 25 26.43 7.95 24.1 34.2 27.4 28.57 10.1 5.15
total: 145.13 32 16.57
What is the control chart (give the interval) for X from R?
Based on course notes by Rafa l Kulik 151

MAT 2377 – Probability and Statistics for Engineers Practice Set
Q150. We have m = 5 preliminary samples of size n = 3 (some numbershave unfortunately been erased by accident by a clumsy co-op student):
i xi,1 xi,2 xi,3 xi ri si1 27.1 29.4 27.9 1.32 30.6 32.5 32.4 31.83 1.9 1.073 25.7 35.5 30 30.4 4.914 31.1 23.2 25 26.43 7.95 24.1 34.2 27.4 28.57 10.1 5.15
total: 145.13 32 16.57
What is the control chart (give the interval) for X from S?
Based on course notes by Rafa l Kulik 152