massachusetts water resources authority comprehensive
TRANSCRIPT

Prepared by:Finance Division
Massachusetts Water Resources AuthorityCOMPREHENSIVE ANNUAL
FINANCIAL REPORTFor the Fiscal Years Ended June 30, 2019 and 2018


Massachusetts Water Resources Authority
Comprehensive Annual Financial Report
For the Fiscal Years Ended June 30, 2019 and 2018
Frederick A. LaskeyExecutive Director
Prepared byThomas J. Durkin, Director, Finance
Robert M. Belkin, Controller, Finance
This document is available at the MWRA website: www.mwra.com

IV
Nut Island Headworks and Surrounding Area

1
Table of ContentsINTRODUCTORY SECTIONLetter of Transmittal 3Organizational Chart 10Principal Officials 11
FINANCIAL SECTIONIndependent Auditors’ Report 13Management’s Discussion and Analysis (Unaudited) 16
Financial Statements as of and for the Years Ended June 30, 2019 and 2018 24Statements of Net Position 24Statements of Revenues, Expenses, and Changes in Net Position 25Statements of Cash Flows 26Notes to Financial Statements 27
Required Supplementary Information (Unaudited) 65Schedules of Employer Contributions – Last Ten Years – GASB No. 68 65Schedules of Changes in the Employer’s Net Pension Liability and Related Ratios – Last Ten Years – GASB No. 68 66Schedules of Changes in the Employer’s Net OPEB Liability and Related Ratios – Last Ten Years – GASB No. 75 67Schedules of Employer Contributions – Last Ten Years – GASB No. 75 68
Supplemental Statements and Schedules 69Accounts Established by the General Revenue Bond Resolution 69Combining Statements of Net Position 70Combining Statements of Revenues, Expenses, and Changes in Net Position 72
STATISICAL SECTIONContents 75Financial Trends 76Revenue Capacity 80Debt Capacity 84Demographic and Economic Information 88Operating Information 94

2
Quabbin Reservoir Spillway
Introductory Section

3
September 19, 2019
To the members of the MWRA Board of Directors
We are pleased to submit to you this Comprehensive Annual Financial Report (CAFR) of the Massachusetts Water Resources Authority (MWRA) for the years ended June 30, 2019 and 2018. This document has been submitted to the Government Finance Officers Association to be awarded a Certificate of Achievement for Excellence in Financial Reporting. The financial section of this CAFR includes management’s discussion and analysis, the basic financial statements and the combining financial statements and schedules, as well as the independent auditors’ report on these financial statements.
As required by generally accepted accounting principles (GAAP), MWRA management is responsible for the accuracy, completeness, and fairness of the presentation, including all disclosures. Management’s discussion and analysis provides an overview of the MWRA’s financial results. This letter of transmittal is designed to complement management’s discussion and analysis and should be read in conjunction with it. Management’s discussion and analysis can be found immediately following the Independent Auditors’ Report.
Management assumes full responsibility for the completeness and reliability of the information contained in this report, based upon a comprehensive framework of internal control that it has established for this purpose. Because the cost of internal control should not exceed anticipated benefits, the objective is to provide reasonable, rather than absolute assurance that the financial statements are free of any material misstatements.
MISSIONThe Massachusetts Water Resources Authority is an independent authority that provides wholesale water and sewer services to its member communities and funds its operations primarily through member community assessments and charges. MWRA’s mission is to provide reliable, cost-effective, high-quality water and sewer services that protect public health, promote environmental stewardship, maintain customer confidence, and support a prosperous economy.
HISTORYCreated by the Massachusetts legislature in 1985 (Chapter 372 of the Acts of 1984, as amended, “the Enabling Act”), MWRA assumed control of the water and sewer systems, including facilities, properties, and the right to utilize water withdrawn from system reservoirs that had formerly been the Sewerage and Waterworks Divisions of the Commonwealth of Massachusetts ("the Commonwealth") Metropolitan District Commission (MDC). The Commonwealth, under the management of the MDC Watershed Management Division (now the Department of Conservation and Recreation – Division of Watershed Management), retained ownership of all real property comprising the water and sewer systems, including the reservoirs and watersheds, the maintenance of which are included in MWRA’s operating budget.
In 1985, responsibility for water distribution for 46 municipalities and sewage collection and treatment for 43 municipalities was transferred to the MWRA. In 1987, the legislature also transferred responsibility to operate and maintain the Clinton Wastewater Treatment Plant from the Commonwealth to the MWRA. New communities have the opportunity to join the MWRA water and sewer systems, and over the years, the number of member communities has increased. MWRA’s facilities span from the Quabbin Reservoir in western Massachusetts to the Deer Island Treatment Plant in Boston Harbor. In Fiscal Year 2019, the systems served approximately 3.0 million people and more than 5,500 businesses.
The Enabling Act also established the MWRA Advisory Board to represent the cities and towns in the service area. The Advisory Board appoints three members of the MWRA Board of Directors, approves the extension of water and sewer services to additional communities, and reviews and makes recommendations on MWRA’s annual Current Expense Budget and Capital Improvement Program.
Frederick A. LaskeyExecutive Director
Telephone: (617) 242·6000Fax: (617) 788-4899TTY: (617) 788-4971
MASSACHUSETTS WATER RESOURCES AUTHORITYCharlestown Navy Yard
100 First Avenue, Building 39Boston, MA 02129

4
WATER SYSTEM
MWRA’s water comes from the Quabbin Reservoir, 65 miles west of Boston, and the Wachusett Reservoir, 35 miles west of Boston. The Quabbin alone holds a four-year supply of water.
The Quabbin and Wachusett Reservoirs are well protected. Over 85% of the watershed lands that surround the reservoirs are covered in forest and wetlands. About 75% of the total watershed land cannot be built on. The natural undeveloped watersheds help to keep MWRA water clean and clear. Because the watersheds are well-protected, the water in the Quabbin and Wachusett Reservoirs is of very high quality. MWRA has won numerous awards for quality, taste, and sustainability.
Water for most MWRA communities is treated at the John J. Carroll Water Treatment Plant in Marlborough with two state-of-the-art methods – ozone and UV light. The treated water leaves the plant through the MetroWest Water Supply Tunnel and the Hultman Aqueduct. Along the way, it is stored in covered tanks. From there it is drawn into distribution mains and many smaller community pipes. Three member communities receive water directly from the Quabbin Reservoir: Chicopee, South Hadley Fire District #1 and Wilbraham. That water is treated at the Brutsch Water Treatment Facility in Ware and leaves the plant through the Chicopee Valley Aqueduct.
Meters installed by the member communities measure the amount of water delivered to each home or business.
Over 85% of the water delivered is via gravity, and, as the water travels through the system, electricity is generated at four hydroelectric facilities.
To maintain and ensure water quality, MWRA tests over 1,600 water samples per month, from the reservoirs all the way to household taps. In addition, MWRA uses real-time water quality monitoring throughout the system to immediately identify any issues with water quality.
Since its inception, MWRA has promoted water conservation among its member communities, requiring each to perform bi-annual leak detection surveys and providing educational materials to residents and students. Since 1985, the average annual water demand in the MWRA service area has decreased by over 130 million gallons.
Ozone And UV Generators at the John J. Carroll Water Treatment Plant

5
WASTEWATER SYSTEM
Wastewater is flushed through a building’s pipes into the community's sewers. More than 5,300 miles of local sewers transport the flows from 43 communities into 226 miles of MWRA interceptor sewers. The interceptor sewers carry the region’s wastewater to two MWRA treatment plants. Most communities’ wastewater flows to the Deer Island Treatment Plant.
Before the flows reach the plant, they receive preliminary treatment at five headworks facilities that screen out larger objects, such as bricks and logs. These flows are then pumped through tunnels to the plant and receive Primary Treatment in settling tanks where up to 60% of the solids settle out as a mixture of sludge and water.
During Secondary Treatment, oxygen is added to the wastewater to speed up the growth of microorganisms. These microbes then consume the wastes and settle to the bottom of the secondary settling tanks. After secondary treatment, 80-90% of human waste and other solids have been removed.
The treated wastewater, or effluent, is disinfected and discharged through a 9.5-mile underwater tunnel into Massachusetts Bay. The effluent is dispersed over the last mile and a quarter of the tunnel through 55 “diffusers.” With water depths up to 120 feet, the outfall provides a much higher rate of mixing and dilution than was possible with discharges into the shallow waters of Boston Harbor prior to construction of the new Deer Island Plant.
The remaining sludge from primary and secondary treatment is processed further in sludge digesters, where it is mixed and heated to reduce its volume and stabilize biosolids. It is then transported through the Inter-Island Tunnel to the pelletizing plant in Quincy where it is dewatered, heat-dried, killing disease-causing bacteria, and reused as a pellet fertilizer for use in agriculture, forestry and land reclamation.
Clinton Wastewater Treatment Plant

6
MWRA also utilizes renewable energy at the Deer Island Treatment Plant, with wind, solar, hydroelectric and biogas systems. The plant currently generates over 50% of its total heat and electricity needs. Because of inadequate sewage treatment facilities, Boston Harbor was known as the dirtiest harbor in the country in the 1980s. The Deer Island Treatment Plant was constructed in the 1990s as part of the federal court mandated Boston Harbor Clean-up Project, which is widely recognized as a national environmental success story. The Charles River, once the inspiration for the song “Love that Dirty Water” now receives high marks for water quality, and Boston’s beaches are among the cleanest urban beaches in the nation.
MWRA also operates the smaller Clinton Wastewater Treatment Plant, which serves the Town of Clinton and the Lancaster Sewer District.
RATES AND CHARGESOver 95% of MWRA’s budgeted revenues are derived from wholesale rates and charges assessed to member communities. The Enabling Act requires MWRA to set its rates and charges at levels sufficient to pay, among other things, its current expenses and its debt service, and to provide debt service coverage required by MWRA’s General Bond Resolution ("the Resolution").
In accordance with the Enabling Act, MWRA’s rate setting is exercised independently by its Board of Directors without being subject to the approval of any department, agency or other instrumentality of the Commonwealth of Massachusetts or any other governing body. MWRA establishes charges of general application separately for the services provided by the Waterworks System and the Sewer System. Rates and charges are adopted annually in June, after notice and public hearing, and review of non-binding recommendations by the MWRA Advisory Board. MWRA’s charges for services are billed directly to the member communities on a wholesale basis. Member committees include cities, towns, and other governmental entities tasked with providing retail water and/or sewer services.
In setting water rates, the total amount of revenue that must be raised through water rates in a given fiscal year is identified through a budgeting process, net of other sources of anticipated revenue, such as investment income, receipts from water supply contracts and other special arrangements. Generally, charges for water services are computed on the basis of the proportioned metered water use of each member community for the immediately preceding calendar year.
Sewer charges are computed on a proportional allocation basis utilizing, among other things, total flow, contributing population and census population for each member community. Consistent with the initial step in setting water rates, MWRA first determines the total amount of revenue required to be raised from sewer charges. The total amount of required revenue for the Sewer System is allocated either to operating costs or capital costs, based on a three-year average of total flows for operating costs and total flows, census information and other factors for capital costs.
MWRA has adopted policies to enforce collection of member community assessments, including use of local aid intercept. Local aid intercept would allow MWRA, after certification to the State Treasurer of any unpaid assessment, to instruct the State Treasurer to deduct unpaid assessment amounts from any state reimbursement, grant or local aid to cities and towns that are member communities and remit that amount to the MWRA. The local aid intercept is not available, however, for any non-municipal member community. Fortunately, MWRA has not needed to use local aid intercept in more than 20 years.
Wind turbines and solar panels at the Deer Island Wastewater Treatment Plant
Pleasure Bay Beach, South Boston

7
CAPITAL IMPROVEMENT PROGRAMSince its establishment, MWRA has invested over $8.4 billion to improve the wastewater and waterworks systems serving its 61 member communities. MWRA was created in response to and has been subject for most of its existence to a Clean Water Act enforcement action (Clean Water Act Case) to end years of wastewater pollution of Boston Harbor and its tributaries from the old Deer Island and Nut Island treatment plants and combined sewer overflows (CSOs). In 1982 and 1983, civil suits were filed against the MDC and other state agencies claiming that the Massachusetts Clean Waters Act had been violated as a result of discharges of untreated and partially treated sewage from Nut and Deer Islands. The Commonwealth, the Boston Water and Sewer Commission that provides retail water and sewer services within the city of Boston, the City of Quincy and the Town of Winthrop are also parties to the case.
The order of the federal court in the Clean Water Act Case (Court Order) set forth the schedules of activities to be undertaken to achieve compliance with the law. Since 1985, MWRA has complied with 420 milestones which included the completion of extensive new wastewater treatment facilities at Deer Island in Boston and Nut Island in Quincy, a residuals processing facility in Quincy, and 35 separate CSO control projects in Boston, Brookline, Cambridge, Chelsea and Somerville which comprise the long-term CSO control plan, the last of which was completed in December 2015, in compliance with the Court Ordered milestone.
Under the Court Order, MWRA was required to file monthly compliance and progress reports on its ongoing activities through December 15, 2000 and quarterly compliance and progress reports through December 2016. MWRA was then required to submit bi-annual compliance and progress reports through December 2020. The Court has further extended the assessment period through 2021.
During the same time, MWRA also complied with regulatory mandates to improve and modernize the waterworks facilities, including the MetroWest Water Supply Tunnel, the Carroll Water Treatment Plant, and several covered water storage facilities.
The mandated projects account for most of the Capital Improvement Program (CIP) spending to date.The five initiatives below account for over $6.0 billion, or 72% of spending to date:
• Boston Harbor Clean-up Project - $3.8 billion• CSO Control Plan - $911 million• MetroWest Water Supply Tunnel - $697 million• Carroll Water Treatment Plant - $423 million• Covered Storage Facilities - $239 million
As MWRA matures as an agency, the infrastructure modernization and new facilities construction phase is nearing completion, and, barring new mandates, most of the future capital budget will be designated for Asset Protection, Water System Redundancy, Pipeline Replacement and Rehabilitation, and Business System Support. Asset Protection focuses on the preservation of capital assets. Water System Redundancy aims to reduce the risks of service interruption and allow for planned maintenance of the water system assets.
Long-term water redundancy is expected to be the largest future CIP initiative and includes two new tunnels with estimated spending in excess of $1.4 billion over 17 years. Pipeline Replacement and Rehabilitation focuses on the maintenance and replacement of water and sewer pipelines. Business System Support provides for the continuing improvement and modernization of technology and security systems.
Norumbega Covered Storage

8
Capital initiatives to date have been primarily funded through long-term borrowings in the form of tax-exempt bonds, and the debt service on these outstanding bonds represents a significant and growing portion of the MWRA’s operating budget. As of June 30, 2019, MWRA’s total debt was $5.4 billion. The capital finance obligation as a percent of total expenses has increased from 36% in 1990 to 62.8% in the Final FY2019 Current Expense Budget.
MWRA’s senior credit ratings of Aa1 from Moody’s, AA+ from S&P, and AA+ from Fitch, reflect strong management of financial performance, application of operating surpluses to early debt defeasance, satisfactory debt service coverage ratios, well maintained facilities, comprehensive long-term planning of both operating and capital needs, and the strong credit quality of its member service communities.
The long-term strategy for capital work is identified in the MWRA’s Water and Wastewater Master Plans, which were published in 2006, updated in 2013, and again in 2019. Spending projections are the result of prioritizing the projects, establishing realistic estimates based on the latest information, striking a balance between maintenance and infrastructure improvements, and ensuring that there is adequate support for MWRA’s core operations to meet all regulatory operating permit requirements.
AWARDS AND ACKNOWLEDGMENTSThe Government Finance Officers Association of the United States and Canada awarded a Certificate of Achievement for Excellence in Financial Reporting to MWRA for its comprehensive annual financial report (CAFR) for the fiscal year ended June 30, 2018. This was the first year that MWRA applied for and received this prestigious award. In order to be awarded a Certificate of Achievement, MWRA had to publish an easily readable and efficiently organized CAFR that satisfied both generally accepted accounting principles and applicable program requirements.
A Certificate of Achievement for Excellence in Financial Reporting is valid for a period of one year only. However, we believe that our current CAFR continues to meet the Certificate of Achievement for Excellence in Financial Reporting Program's requirements, and we are submitting it to the GFOA to determine its eligibility for another certificate. MWRA also received the Government Finance Officers Association’s Distinguished Budget Presentation Award for its annual budget document dated September 2018. To qualify for the Distinguished Budget Presentation Award, the government’s budget document had to be judged proficient as a policy document, a financial plan, and operations guide, and communications devise. The preparation of this report would not have been possible without the skill, effort, and dedication of the entire staff of MWRA's Finance Division. We wish to thank all MWRA departments for their assistance in providing the data necessary to prepare this report. Credit is also due to the MWRA Board of Directors for their unfailing support for maintaining the highest standards of professionalism in the management of the MWRA’s finances.
INDEPENDENT AUDITThe Enabling Act requires that the MWRA's financial statements be audited annually by an independent certified public accounting firm. The MWRA General Bond Resolution and certain loan agreements, by reference, specify that the audit be conducted by independent accountants of nationally recognized standing and be satisfactory to the Trustee. The financial section of the 2019 Comprehensive Annual Financial Report begins with the report of our independent auditors, CliftonLarsonAllen LLP. This report expresses an unmodified opinion as to the fairness of the presentation of our financial statements.
Respectfully submitted,
Frederick A. Laskey Thomas J. DurkinExecutive Director Director of Finance
Robert M. Belkin, CPA Controller

9

10
MWRA Organizational Chart

11
Principal Officials
BOARD OF DIRECTORSKathleen A. Theoharides, ChairJohn J. Carroll, Vice Chair Andrew M. Pappastergion, SecretaryChristopher CookKevin L. CotterPaul E. FlanaganJoseph C. FotiBrian PeñaHenry F. VitaleJohn J. WalshJennifer L. Wolowicz
Executive OfficersFrederick A. Laskey, Executive DirectorDavid W. Coppes, Chief Operating OfficerThomas J. Durkin, Director, FinanceMichele S. Gillen, Director, AdministrationCarolyn Francisco Murphy, General Counsel
Controller DepartmentRobert Belkin, CPA, ControllerElizabeth Feloni, CPA, Accounting ManagerJune Kwan, Senior Staff AccountantGaby DeLeon, Senior Staff AccountantSamantha Wilson, Senior Staff Accountant
Wachusett Aqueduct Pumping Station

12
Bellevue Water Storage Tank next to the historic Bellevue Standpipe
Financial Section

13

14

15

16
MASSACHUSETTS WATER RESOURCES AUTHORITY
Management’s Discussion and Analysis – Required Supplementary Information
June 30, 2019 and 2018
(Unaudited)
4
This section of the Authority’s annual financial report presents our discussion and analysis of the Authority’s financial performance during the fiscal years ended June 30, 2019 and 2018. Please read it in conjunction with the Authority’s financial statements, which immediately follow this section.
Financial Highlights – Fiscal Year 2019
The fiscal year 2019 customer service revenues were approximately $750.7 million. Of this amount, rate revenues represent approximately 98.4%, or $739 million, and were $22 million higher than fiscal year 2018. This was due to an increase in assessments.
Total operating expenses, excluding depreciation, were approximately $305.1 million in fiscal year 2019. The 9.8% increase in total operating expenses over fiscal year 2018 is the result of increases in pension expense of $17.7 million, increases in utility costs of $2.5 million, increases in personnel costs of $2.6 million, increases in maintenance costs of $1.6 million, increases in chemical costs of $1.2 million and increases in sludge pelletization costs of $1.2 million.
Net nonoperating expenses decreased $29.5 million, or 14.9%, primarily due to a $23.2 million increase in investment income and a $6.3 million reduction in interest expense. Interest income increased due to an increase in the unrealized gain on investments. Lower long-term interest rates have caused the market values of investments to increase. Interest expense decreased due to a combination of principal repayments and refunding/defeasance of outstanding debt.
Total assets at June 30, 2019 were approximately $7.4 billion, a $57.5 million, or 0.8%, decrease over total assets at June 30, 2018.
During fiscal year 2019 the Authority issued General Revenue Bonds, 2019 Series B for $125 million and General Revenue Refunding Bonds, 2019 Series C for $19.2 million. The proceeds from these bonds were used finance new construction projects and refund bonds outstanding. The interest rate on these bonds is 5%.
Total capital assets (net of depreciation) were approximately $5.8 billion at June 30, 2019, a $107.9 million, or 1.8%, decrease over June 30, 2018. The decrease was primarily due to the rate of depreciation being higher than the rate of capitalization.
Financial Highlights – Fiscal Year 2018
The fiscal year 2018 customer service revenues were approximately $728.3 million. Of this amount, rate revenues represent approximately 98.5%, or $717.1 million, and were $22.2 million higher than fiscal year 2017. This was due to an increase in assessments.
Total operating expenses, excluding depreciation, were approximately $277.9 million in fiscal year 2018. The 2.9% decrease in total operating expenses over fiscal year 2017 is the result of decreases in pension and pollution remediation expenses totaling $10.3 million and a decrease in maintenance costs of $1.7 million, offset by increases in personnel costs of $2 million and utility costs of $1.7 million.
Net nonoperating expenses decreased $16 million, or 7.4%, due to a $14.5 million decrease in interest expense. Interest expense decreased due to a combination of principal repayments and refunding/defeasance of outstanding debt.

17
MASSACHUSETTS WATER RESOURCES AUTHORITY
Management’s Discussion and Analysis – Required Supplementary Information
June 30, 2019 and 2018
(Unaudited)
5
Total assets at June 30, 2018 were approximately $7.5 billion, a $160.2 million, or 2.1%, decrease over total assets at June 30, 2017.
During fiscal year 2018 the Authority issued direct-purchase General Revenue Refunding Bonds, 2018 Series A for $50.6 million, General Revenue Bonds, 2018 Series B for $107.6 million, General Revenue Refunding Bonds, 2018 Series C for $21.9 million and direct-purchase General Revenue Refunding Bonds, 2018 Series D for $50 million. The proceeds from these bonds were used to retire commercial paper notes, retire a portion of the revolving loan, refund bonds outstanding and finance new construction projects. The interest rate on these bonds range from 3% to 5%.
Total capital assets (net of depreciation) were approximately $5.9 billion at June 30, 2018, a $75.1 million, or 1.2%, decrease over June 30, 2017. The decrease was primarily due to the rate of depreciation being higher than the rate of capitalization.
Overview of the Financial Statements
The financial section of this annual report consists of four parts: management’s discussion and analysis (this section), the financial statements and related notes to the financial statements, required supplementary information, and other supplementary information.
The financial statements provide both long-term and short-term information about the Authority’s overall financial status. The financial statements also include notes that explain some of the information in the financial statements and provide more detailed data. The statements are followed by a section of required supplementary information and other supplementary information that further explains and supports the information in the financial statements.
Financial Analysis of the Authority
Net PositionThe Authority’s total net position at June 30, 2019 was approximately $1.6 billion, a $39.3 million decrease from June 30, 2018. Total assets decreased $57.5 million, or 0.8%, to $7.4 billion, and total liabilities increased $48 million, or 0.8%, to $5.9 billion.
The Authority’s total net position at June 30, 2018 was approximately $1.6 billion, a $60.9 million decrease from June 30, 2017. Total assets decreased $160.2 million, or 2.1%, to $7.5 billion, and total liabilities decreased $168.2 million, or 2.8%, to $5.9 billion.

18
MASSACHUSETTS WATER RESOURCES AUTHORITY
Management’s Discussion and Analysis – Required Supplementary Information
June 30, 2019 and 2018
(Unaudited)
6
Net Position(Dollars in thousands)
Percentage Percentagechange change
2019 2018 2017 * 2019–2018 2018–2017Current assets 100,271$ 95,963$ 93,210$ 4.5% 3.0% Restricted assets 837,850 727,104 707,255 15.2 2.8 Capital assets 5,840,416 5,948,350 6,023,414 (1.8) (1.2) Other assets 651,769 716,378 824,142 (9.0) (13.1)
Total assets 7,430,306 7,487,795 7,648,021 (0.8) (2.1)
Deferred outflows of resources from pension 64,041 17,154 47,910 273.3 (64.2) Deferred outflows of resources from OPEB 333 - - 100.0 -Deferred outflows of resources from derivative instruments 31,640 20,988 35,755 50.8 (41.3) Deferred outflows of resources from refunded debt 28,842 47,597 68,344 (39.4) (30.4)
Current liabilities 362,949 350,382 349,139 3.6 0.4 Payable from restricted assets 156,048 157,721 154,597 (1.1) 2.0 Long-term debt 5,139,816 5,192,316 5,337,619 (1.0) (2.7) Long-term lease 26,093 27,219 28,261 (4.1) (3.7) Other liabilities 263,506 172,784 199,032 52.5 (13.2)
Total liabilities 5,948,412 5,900,422 6,068,648 0.8 (2.8)
Deferred inflows of resources from pension 6,066 14,963 11,810 (59.5) 26.7 Deferred inflows of resources from OPEB 7,907 10,032 - (21.2) -Deferred inflows of resources from regulated activities 26,690 42,718 53,275 (37.5) (19.8)
Net position:Net investment in capital assets 827,050 759,757 729,903 8.9 4.1 Restricted Construction 189,293 105,802 117,813 78.9 (10.2) Debt Service 98,251 173,098 140,344 (43.2) 23.3 Operating 50,862 48,915 47,544 4.0 2.9 Revenue 30,126 29,952 33,372 0.6 (10.2) Unrestricted 370,505 487,875 597,321 (24.1) (18.3)
Total net position 1,566,087$ 1,605,399$ 1,666,297$ (2.4%) (3.7%)
*Certain amounts were reclassified to conform to the fiscal year 2018 presentation

19
MASSACHUSETTS WATER RESOURCES AUTHORITY
Management’s Discussion and Analysis – Required Supplementary Information
June 30, 2019 and 2018
(Unaudited)
7
Changes in Net PositionThe decrease in net position at June 30, 2019 was $39.3 million, or 2.4%, as compared with June 30, 2018. The Authority’s total operating revenues increased by 2.3% to $755.3 million and total operating expenses increased 9.8% to $305.1 million.
The decrease in net position at June 30, 2018 (including the restatement to comply with GASB 75) was $60.9 million, or 3.7%, as compared with June 30, 2017. The Authority’s total operating revenues increased by 3.0% to $738.3 million and total operating expenses decreased 2.9% to $277.9 million.
Changes in Net Position(Dollars in thousands)
Percentage Percentagechange change
2019 2018 2017 2019–2018 2018–2017Operating revenues:
Customer service revenues 750,742$ 728,281$ 705,933$ 3.1% 3.2% Other revenues 4,594 10,023 10,843 (54.2) (7.6)
Total operating revenues 755,336 738,304 716,776 2.3 3.0
Operating expenses:Operations 113,878 106,943 106,844 6.5 0.1 Maintenance 30,651 29,067 30,799 5.4 (5.6) Payments in lieu of taxes 8,230 8,220 8,191 0.1 0.4 Engineering, general, and administrative 152,351 133,627 140,435 14.0 (4.8)
Total operating expenses 305,110 277,857 286,269 9.8 (2.9)
Depreciation and amortization 207,127 202,799 201,481 2.1 0.7 Operating income 243,099 257,648 229,026 (5.6) 12.5
Nonoperating items:Regulatory accounting provisions (121,739) (106,777) (62,714) 14.0 70.3 Net nonoperating expenses (168,861) (198,327) (214,288) (14.9) (7.4) Changes in derivative related accounts 2,940 2,940 2,940 - -
Total nonoperating items (287,660) (302,164) (274,062) (4.8) 10.3
Capital grants and contributions 5,249 4,715 7,224 11.3 (34.7)
Change in net position (39,312) (39,801) (37,812) (1.2) 5.3
Total net position – beginning of year 1,605,399 1,666,297 1,704,109 (3.7) (2.2) Restatement to comply with GASB 75 - (21,097) - (100.0) -
Total net position – end of year 1,566,087$ 1,605,399$ 1,666,297$ (2.4%) (3.7%)
During fiscal year 2019, the increases in customer service revenues were primarily due to the 3.07% increase in the rate revenue requirement ($22 million).
During fiscal year 2018, the increases in customer service revenues were primarily due to the 3.19% increase in the rate revenue requirement ($22.2 million).

20
MASSACHUSETTS WATER RESOURCES AUTHORITY
Management’s Discussion and Analysis – Required Supplementary Information
June 30, 2019 and 2018
(Unaudited)
8
Operating Costs by Functionality(Dollars in thousands)
Percentage Percentagechange change
2019 2018 2017 2019–2018 2018–2017Wastewater treatment and transport 102,732$ 98,070$ 95,636$ 4.8% 2.5% Water treatment and transport 38,731 37,144 37,110 4.3 0.1 Water and wastewater quality 9,734 9,600 9,068 1.4 5.9 Metering and monitoring 6,516 5,059 5,079 28.8 (0.4) Facilities planning, design, and construction 11,362 11,515 11,188 (1.3) 2.9 Management information systems 12,617 11,785 11,991 7.1 (1.7) Administration and support 51,989 51,573 50,650 0.8 1.8
Total direct operating costs 233,681 224,746 220,722 4.0 1.8 Indirect operating costs 71,429 53,111 65,547 34.5 (19.0)
Total operating costs 305,110$ 277,857$ 286,269$ 9.8% (2.9%)
Increases in wastewater treatment and transport expenses were due primarily to a $1.5 million increase in electricity costs and $1.5 million increase in maintenance expenses at Deer Island as well as $1.2 million increase in sludge pelletization costs of the residuals operations department. Increases in water treatment and transport are attributable to increases in wages & salaries ($0.3 million), utilities ($0.4 million), chemicals ($0.3 million) and maintenance expenses ($0.5 million). Increases in metering and monitoring are the result of reclassification of a cost center from operations to metering and monitoring. Increases in management information systems is due primarily to the roll-out of new PCs ($0.8 million).
Other Post-Employment Benefits (OPEB) Irrevocable Trust
In April 2015, the Authority established the MWRA Other Post-Employment Benefits (OPEB) Irrevocable Trust. The Trust was established for the sole purpose of providing for the advance funding of future costs of retired employee health insurance and other benefits provided to retirees. It is intended that the Trust shall constitute a “Qualified OPEB Trust” according to the standards set forth in GASB Statement No. 45, Accounting and Financial Reporting by Employers for Postemployment Benefits Other Than Pensions and the standards of GASB Statement No. 75, Accounting and Financial Reporting for Postemployment Benefits Other Than Pensions. The Authority’s Board of Directors appointed a five-member Board of Trustees, made up of Authority senior managers, to control and manage the trust.
An initial deposit of $10.8 million was made to the trust upon establishment of the trust. The balance of the trust at June 30, 2019 and 2018 was $37.1 million and $29.8 million, respectively.

21
MASSACHUSETTS WATER RESOURCES AUTHORITY
Management’s Discussion and Analysis – Required Supplementary Information
June 30, 2019 and 2018
(Unaudited)
9
Capital Assets and Debt Administration
Capital Assets
As of June 30, 2019 and 2018, the Authority had $5.8 billion and $5.9 billion of capital assets (net of depreciation), respectively. This includes land, construction in progress, plant and equipment for the water and sewer systems, furniture and fixtures, leasehold improvements, and motor vehicles and equipment. The Authority’s net capital assets decreased approximately $107.9 million, or 1.8%, during fiscal year 2019, primarily due to the rate of depreciation being higher than the rate of capitalization.
Capital Assets(Net of depreciation, dollars in thousands)
Percentage Percentagechange change
2019 2018 2017 2019–2018 2018–2017Land 29,885$ 29,878$ 29,873$ 0.0% 0.0% Construction in progress 149,794 180,525 127,423 (17.0) 41.7 Plant and equipment, water, and sewer systems 5,653,489 5,730,797 5,859,216 (1.3) (2.2) Furniture and fixtures 68 132 213 (48.5) (38.0) Leasehold improvements 267 279 291 (4.3) (4.1) Motor vehicles and equipment 6,913 6,739 6,398 2.6 5.3
Total 5,840,416$ 5,948,350$ 6,023,414$ (1.8%) (1.2%)
Additional information on the Authority’s capital assets can be found in Note 8 of this financial report.
Debt Administration
The Authority’s bond sales must be approved by its board of directors (the Board) and must comply with rules and regulations of the United States Treasury Department. Neither the Commonwealth of Massachusetts (the Commonwealth) nor any political subdivision thereof shall be obligated to pay the principal of, or premium or interest on, any debt outstanding and neither the faith and credit nor the taxing power of the Commonwealth or any political subdivision thereof is pledged to such payment.
Bond Resolutions
Pursuant to its general bond resolution, the Authority must comply with a rate covenant that requires it to set rates to maintain revenues sufficient to pay: current expenses; debt service on indebtedness; required deposits to reserves; costs of maintenance, replacement, and/or improvements to the wastewater and water systems that are considered current expenses and any additional amounts the Authority may be required to pay by any law or contract.
In addition to the rate covenant, the Authority is required to meet two covenants with respect to debt service coverage. The primary debt service coverage requires that the Authority fix and adjust rates and charges to provide revenues available for bond debt service in an amount equal to 1.2 times that is required for debt service on all outstanding bonds, not including subordinated bonds. The subordinated debt service coverage requires that the Authority fix and adjust rates and charges to provide revenues available for bond debt service in an amount equal to 1.1 times that is required for debt service on all outstanding bonds, including subordinated bonds.
Additional information on the Authority’s long-term debt can be found in Note 6 of this financial report.

22
MASSACHUSETTS WATER RESOURCES AUTHORITY
Management’s Discussion and Analysis – Required Supplementary Information
June 30, 2019 and 2018
(Unaudited)
10
Credit Rating
The Authority’s $3.1 billion Senior Lien General Revenue Bonds are rated Aa1 from Moody’s Investors Service, AA+ by S&P Global Ratings and AA+ from FitchRatings. The $782 million Subordinate Lien General Revenue Bonds are rated Aa2 from Moody’s Investors Service, AA by S&P Global Ratings and AA from FitchRatings. Some of the Authority’s revenue bonds are enhanced by bond insurance. The credit ratings of these bond series will be the higher rating of either the Authority or the firm providing the enhancement. In the case of bonds enhanced by a letter of credit, the rating will be the highest of the Authority’s, the provider or, if available, a joint rating. The subordinated debt of $980 million with the Massachusetts Clean Water Trust is not rated as the Authority’s debt.
Economic Factors and Next Year’s Budget
In June 2019, the Board approved the fiscal year 2020 Current Expense Budget (CEB), which totals $792.2 million in expenses.
The $792.2 million expense total is comprised of $493.1 million (62.2%) in capital financing costs and $299.1 million (37.8%) in operating expenses, of which $248.2 million (83.0%) is for direct expenses and $50.9 million (17.0%) is for indirect expenses. The total represents an increase of $33.4 million from fiscal year 2019 spending, which is comprised of $22.1 million in higher operating costs and $11.3 million in higher debt service costs.
The fiscal year 2020 rate revenue requirement approved by the Board is $761.7 million; an increase of 3.07% compared with the fiscal year 2019 budget.
Fiscal year 2020 budgeted nonrate revenue totals $30.5 million, a decrease of $2.8 million from actual fiscal year2019 nonrate revenue. The nonrate revenue budget is comprised of $15.5 million in investment income, $14.4 million in other user charges and other revenue and $.6 million in entrance fees.
CIP 10 Year Plan
The Authority’s planned spending for capital improvements in future years reflects the Authority’s ongoing efforts to upgrade and maintain the system and to align its project prioritization process with the Master Plan.
Major planned and ongoing projects include:
• Commitment to long-term redundancy plan for the metropolitan water tunnel system.
• Improvement and replacement of equipment on Deer Island and at major headworks facilities to ensure continued efficient and effective operations.
• Continued asset protection projects for both wastewater and water systems (pump stations and pipelines).
• Dedication to using resources efficiently, responding to climate change and reducing the environmental impacts of the Authority’s daily operations by installing alternative energy sources and promotion of improved self-generation.

23
MASSACHUSETTS WATER RESOURCES AUTHORITY
Management’s Discussion and Analysis – Required Supplementary Information
June 30, 2019 and 2018
(Unaudited)
11
• Enhanced commitment to the community assistance programs for both the sewer and water systems to improve local infrastructure, including a new initiative to provide interest-free loans to assist communities in replacing lead service lines.
• Continued investment for the upgrade of Management Information Systems to ensure the availability, integrity and security of data.
• Continue the Residuals Asset Protection program for maintaining and improving the operations and infrastructure of the biosolids processing in the long term.
Contacting the Authority’s Financial Management
This report is designed to provide our bondholders, member communities and other interested parties with a general overview of the Authority’s finances and to demonstrate the Authority’s accountability for the revenue it receives. If you have questions about this report or need additional information, contact the Massachusetts Water Resources Authority, Finance Division, 100 First Avenue, Boston, MA 02129.

24
MASSACHUSETTS WATER RESOURCES AUTHORITYStatements of Net Position
June 30, 2019 and 2018
(Dollars in thousands)
See accompanying Notes to Financial Statements12
Assets 2019 2018Unrestricted current assets:
Cash and cash equivalents (note 4) 54,810$ 52,614$Investments (note 4) 11,661 11,252Intergovernmental loans (note 7) 32,732 31,254Accounts receivable 1,068 843
Total unrestricted current assets 100,271 95,963
Restricted assets:Investments (note 4) 836,348 724,428Interest receivable 1,502 1,731Grants receivable - 945
Total restricted assets 837,850 727,104
Capital assets:Capital assets – not being depreciated (note 8) 179,679 210,403Capital assets – being depreciated – net (note 8) 5,660,737 5,737,947
Total capital assets 5,840,416 5,948,350
Regulatory assets (note 3) 370,030 505,915Other assets, net (note 7) 281,739 210,463
Total assets 7,430,306 7,487,795
Deferred Outflows of ResourcesDeferred outflows from pension (note 10) 64,041 17,154Deferred outflows from OPEB (note 11) 333 -Deferred outflows from derivative instruments (note 6) 31,640 20,988Deferred outflows from refunding debt 28,842 47,597
LiabilitiesCurrent liabilities:
Accounts payable and accrued expenses 50,031 49,465Commercial paper notes (note 6) 75,000 75,000Current portion of long-term debt (note 6) 237,918 225,917
Total current liabilities 362,949 350,382
Payable from restricted assets:Accounts payable for construction 15,588 19,656Accrued interest on bonds payable 80,504 79,991Reserves (note 5) 59,956 58,074
Total payable from restricted assets 156,048 157,721
Retainage on construction in progress 7,918 9,567Long-term debt – less current portion (note 6) 5,139,816 5,192,316Long-term capital lease (note 9) 26,093 27,219Net pension liability (note 10) 99,956 21,025Net OPEB liability (note 11) 123,992 121,204Liability for derivative instruments (note 6) 31,640 20,988
Total liabilities 5,948,412 5,900,422
Deferred Inflows of ResourcesDeferred inflows from pension (note 10) 6,066 14,963Deferred inflows from OPEB (note 11) 7,907 10,032Deferred inflows from regulated activities (note 3) 26,690 42,718
Net PositionNet investment in capital assets 827,050 759,757Restricted Construction 189,293 105,802 Debt Service 98,251 173,098 Operating 50,862 48,915 Revenue 30,126 29,952Unrestricted 370,505 487,875
Total net position 1,566,087$ 1,605,399$
Commitments and contingencies (notes 9,10,11,12 and 13)

25
MASSACHUSETTS WATER RESOURCES AUTHORITY
Statements of Revenues, Expenses, and Changes in Net Position
Years ended June 30, 2019 and 2018
(Dollars in thousands)
See accompanying Notes to Financial Statements13
2019 2018Operating revenues (note 2):
Customer services 750,742$ 728,281$Other 4,594 10,023
Total operating revenues 755,336 738,304
Operating Expenses:Operations 113,878 106,943Maintenance 30,651 29,067Payments in lieu of taxes 8,230 8,220Engineering, general, and administrative 152,351 133,627
Total operating expenses 305,110 277,857
Income from operations before depreciation 450,226 460,447
Depreciation and amortization 207,127 202,799
Operating income 243,099 257,648
Regulatory accounting provisions:Change in reserves (note 5) (1,882) (821)Change in regulatory provisions, net (note 3) (119,857) (105,956)
Total regulatory accounting provisions (121,739) (106,777)
Nonoperating revenues (expenses):Debt service grant 890 945Investment income 27,210 3,995Interest expense (196,961) (203,267)Changes in derivative related accounts 2,940 2,940
Total nonoperating expenses (165,921) (195,387)
Net loss before capital grants and contributions (44,561) (44,516)
Capital grants and contributions 5,249 4,715
Decrease in net position (39,312) (39,801)
Total net position - beginning of year 1,605,399 1,666,297
Restatement to comply with GASB Statement No. 75 (note 2a) - (21,097)
Total net position - end of year 1,566,087$ 1,605,399$

26
MASSACHUSETTS WATER RESOURCES AUTHORITY
Statements of Cash Flows
Years ended June 30, 2019 and 2018
(Dollars in thousands)
See accompanying Notes to Financial Statements14
2019 2018Cash flows from operating activities:
Cash received from customers 750,509$ 728,207$Cash paid to suppliers for goods and services (159,098) (121,879)Cash paid to employees for services (142,878) (131,123)Cash paid in lieu of taxes (8,230) (8,220)Other operating receipts 4,595 9,949
Net cash provided by operating activities 444,898 476,934
Cash flows from capital and related financing activities:Proceeds from sale of revenue bonds, loans, and notes 256,134 151,604Capital grants for construction 5,249 4,715Debt service grant 1,835 -Capital lease principal payments (1,125) (1,041)Capital lease interest payments (2,091) (2,175)Repayment of debt (265,380) (261,177)Interest paid on debt (204,241) (203,971)Plant expenditures (148,192) (147,981)
Net cash used for capital and related financing activities (357,811) (460,026)
Cash flows from investing activities:Purchases of short-term investments (9,763) (9,910)Changes in restricted money market investments (92,297) (17,400)Interest received 17,169 12,750
Net cash used for investing activities (84,891) (14,560)
Net increase in cash and cash equivalents 2,196 2,348
Cash and cash equivalents - beginning of year 52,614 50,266
Cash and cash equivalents - end of year 54,810$ 52,614$
Reconciliation of operating income to net cash provided by operatingactivities:
Operating income 243,099$ 257,648$Adjustments to reconcile operating income to net cash provided by operating activities:
Depreciation and amortization 207,127 202,799Change in net pension liability 78,931 (24,779)Change in deferred outflows from pension (46,887) 30,756Changed in deferred inflows from pension (8,897) 3,153Change in net OPEB liability 2,788 (10,268)Change in deferred outflows from OPEB (333) -Change in deferred inflows from OPEB (2,125) 10,032Change in other accounts (29,699) 5,059Change in accounts payable 894 2,534
Net cash provided by operating activities 444,898$ 476,934$
NONCASH CAPITAL AND RELATED FINANCING ACTIVITIES
of $19,190 were issued to defease $20,340 of bonds outstanding.
of $122,510 were issued to defease $75,545 of bonds outstanding and retire $50,000 of commercial paper notes.In fiscal 2018, general revenue refunding bonds in the aggregate principal amount
In fiscal 2019, general revenue refunding bonds in the aggregate principal amount

27
MASSACHUSETTS WATER RESOURCES AUTHORITY
Notes to Financial Statements
June 30, 2019 and 2018
(Dollars in thousands)
15
(1) Organization
The Massachusetts Water Resources Authority (the Authority) was established in January 1985 pursuant to Chapter 372 (the Enabling Act) of the Act of 1984 of the Commonwealth of Massachusetts (the Commonwealth). The Authority, a successor agency to certain functions of the Metropolitan District Commission (the MDC) (which became part of the Department of Conservation and Recreation (the DCR) in July 2003), is a public instrumentality and, effective July 1, 1985, provides water supply services and sewage collection, treatment, and disposal services to areas of the Commonwealth.
The Authority is governed by an 11-member board of directors (the Board) chaired by the Secretary of Energy and Environmental Affairs for the Commonwealth. The Secretary and two other members are appointed by the Governor. Three members of the Board are appointed by the Mayor of Boston and three are appointed by the Authority’s Advisory Board. One member is appointed by the Mayor of Quincy and one by the Winthrop Council President.
(2) Summary of Significant Accounting Policies
The accounting policies of the Authority conform to U.S. generally accepted accounting principles as applicable to government enterprises. The following is a summary of the Authority’s significant accounting policies:
(a) Basis of PresentationThe Authority is required by the Enabling Act to establish user rates for its water and sewer services which provide sufficient funds to recover the costs of operations (excluding depreciation), debt service, maintenance, replacements, improvements to its facilities, and appropriate reserves. The Authority’s financial statements are reported on the accrual basis of accounting and the economic measurement focus as specified by the Governmental Accounting Standards Board’s (GASB) requirements for an enterprise fund.
The Authority distinguishes operating revenues and expenses from nonoperating items. Operating revenues and expenses generally result from providing water and sewer services to its member communities. All revenues and expenses not meeting this definition are reported as nonoperating revenues and expenses. All operating revenues are pledged for repayment of outstanding debt service.
In addition, the Authority applies the provisions of GASB Statement No. 62, Codification of Accounting and Financial Reporting Guidance Contained in Pre-November 30, 1989 FASB and AICPA Pronouncements, to provide a better matching of revenues and expenses. The effect of this policy has been to defer certain outflows of resources, which will be recovered through future revenues in accordance with the Authority’s rate model, and to record deferred inflows of resources for revenue collected through current rates for costs expected to be incurred in the future. The effects of the Authority’s accounting policies are discussed further in Note 3.

28
MASSACHUSETTS WATER RESOURCES AUTHORITY
Notes to Financial Statements
June 30, 2019 and 2018
(Dollars in thousands)
16
The Authority has implemented GASB Statement No. 75, Accounting and Financial Reporting of Postemployment Benefits Other Than Pensions. This Statement requires that the net OPEB liability be reflected on the Statements of Net Position, as well as the deferred inflows and outflows of resources from OPEB activities. In accordance with the Statement, the Authority restated its Net Position at July 1, 2017.
The Authority has implemented GASB Statement No. 88, Certain Disclosures Related to Debt, Including Direct Borrowings and Direct Placements. This statement resulted in expanded disclosures related to debt.
(b) Capital AssetsOn July 1, 1985, ownership of the MDC’s sewer and waterworks personal property was transferred to the Authority. Pursuant to the Enabling Act, ownership of the real property of the MDC sewer and waterworks systems was not transferred from the Commonwealth to the Authority; however, the Authority has the right to use, improve, maintain, and manage that property. In addition, ownership of the real and personal property of the watershed system remains with the Commonwealth; however, the Authority has the right to utilize the water therefrom for water supply purposes.
The personal property, together with the rights to the real property and watershed system, was recorded at its estimated fair value of $2,331,465 (including certain construction projects which were in progress as of July 1, 1985), based upon an appraisal performed by valuation specialists. Property, plant, and equipment acquired or constructed since July 1, 1985, is stated at acquisition cost, and includes the expenditure of capital grants in aid of construction.
Betterments and major renewals are capitalized and included in capital asset accounts, while expenditures for maintenance and repairs are charged to expense when incurred. The cost of depreciable assets and related accumulated depreciation is eliminated from the accounts when such items are disposed of or otherwise retired.
The Authority’s capitalization threshold is $100.
(c) Interest Cost and Principal Payments on ConstructionDuring fiscal years 2019 and 2018, none of the Authority’s interest expense was capitalized to construction in progress in accordance with its current policy of recovering such costs through rates as incurred. Rates collected for principal payments on debt related to assets under construction are deferred until the related asset is completed and depreciation commences.
(d) DepreciationThe Authority provides for depreciation by use of the straight-line method. Depreciation is intended to distribute the cost of depreciable properties, including those financed by capital grants in aid of construction, over the following estimated average useful lives:
Years
Plant and Equipment, Water and Sewerage Systems 5–100Motor Vehicles and Equipment 5Furniture and Fixtures 7Leasehold Improvements 3–5

29
MASSACHUSETTS WATER RESOURCES AUTHORITY
Notes to Financial Statements
June 30, 2019 and 2018
(Dollars in thousands)
17
(e) Revenue RecognitionThe Authority recognizes revenue as amounts become collectible from its customers for water and sewer services provided. The majority of the Authority’s billings to cities and towns are subject to, in the event of nonpayment, the local aid intercept allowed by the Enabling Act.
(f) Net PositionWhen both restricted and unrestricted resources are available for use, it is the Authority’s policy to use the restricted resources first, then unrestricted as they are needed.
(g) Cash and Cash EquivalentsThe Authority’s policy is to treat unrestricted investments with a maturity date of three months or less when purchased as cash equivalents for purposes of the statements of cash flows. Restricted cash and cash equivalents are combined with investments on the statements of net position, and shown separately on the statements of cash flows as an investing activity.
(h) Payments in Lieu of TaxesThe Enabling Act authorizes and directs the Authority to pay to the DCR (formerly the MDC) Division of Watershed Management, who in turn remits payment to each city or town in which land of the Quabbin watershed and Ware River watershed is located. Each such payment is equal to the amount which the respective city or town would receive in property taxes, based upon the fair value of such land if such land were not tax exempt.
(i) InvestmentsInvestments are recorded at fair value, other than certain investments that are recorded at net asset value (NAV). The Authority uses an independent pricing source to determine the fair value of investments at quoted market prices. Changes in fair value are included in nonoperating investment income in the Statements of Revenues, Expenses, and Changes in Net Position. Investments that are measured at NAV are the investments in the Massachusetts Municipal Depository Trust (MMDT) which is a 2a7-like external investment pool that is overseen by the Massachusetts State Treasurer and whose fair value of each share is equal to the number of shares; thus NAV is equal to $1.00 per share.
(j) Compensated AbsencesEmployees of the Authority may accumulate unused sick time of which 30% will be paid in cash upon retirement from the Authority. The liability for vacation leave is based on the amount earned but not used; for sick leave, it is based on a percentage of the amount accumulated at the statement of net position dates. The liability for both amounts is calculated based on the pay or salary rates in effect at the statements of net position dates.
(k) PensionsFor purposes of measuring the net pension liability, deferred outflows of resources and deferred inflows of resources related to pensions, and pension expense, information about the fiduciary net position of the Plan and additions to/deductions from the Plan’s fiduciary net position have been determined on the same basis as they are reported by the Authority. For this purpose, benefit payments (including refunds of employee contributions) are recognized when due and payable in accordance with the benefit terms. Investments are reported at fair value.

30
MASSACHUSETTS WATER RESOURCES AUTHORITY
Notes to Financial Statements
June 30, 2019 and 2018
(Dollars in thousands)
18
(l) Postemployment Benefits Other Than Pensions (OPEB)For purposes of measuring the net OPEB liability, deferred outflows of resources and deferred inflows of resources related to OPEB, and OPEB expense, information about the fiduciary net position of the MWRA and additions to/deductions from the MWRA’s fiduciary net position have been determined on the same basis as they are reported by the MWRA. For this purpose, the MWRA recognizes benefit payments when due and payable in accordance with the benefit terms. Investments are reported at fair value, except for money market investments and participating interest-earning investment contracts that have a maturity at the time of purchase of one year or less, which are reported at cost.
(m) Use of EstimatesThe preparation of financial statements in conformity with U.S. generally accepted accounting principles requires management to make estimates and assumptions that affect the reported amounts of assets and liabilities, and disclosure of contingent assets and liabilities at the date of the financial statements, and the reported amounts of revenues and expenditures during the reporting period. Actual results could differ from those estimates.
(3) Regulatory Assets and Deferred Inflows from Regulatory Activities
In accordance with GASB Statement No. 62, Codification of Accounting and Financial Reporting Guidance Contained in Pre-November 30, 1989 FASB and AICPA Pronouncements, regulatory assets and deferred inflows from regulatory activities that result primarily from differences between depreciation on property, plant, and equipment not financed by grants or capital contributions, which is recovered through rates as principal payments on debt service, and from amounts determined by the Board to be utilized in a subsequent year to reduce customer billings (rate stabilization).
A summary of the activity of regulatory assets and deferred inflows for fiscal years 2019 and 2018 is as follows:
Sewer Water Total
Balance - June 30, 2017 - net 489,621$ 79,532$ 569,153$Difference Between Depreciation of Capital
Assets Not Financed by Grants or CapitalContributions, and Debt Service in Excessof Interest Expense (70,597) (37,394) (107,991)
Rate Stabilization, Net (6,532) - (6,532)Other, Net (157) 8,724 8,567
Balance - June 30, 2018 - net 412,335 50,862 463,197Difference Between Depreciation of Capital
Assets Not Financed by Grants or CapitalContributions, and Debt Service in Excessof Interest Expense (87,547) (39,125) (126,672)
Other, Net 3,340 3,475 6,815
Balance - June 30, 2019 - net 328,128$ 15,212$ 343,340$

31
MASSACHUSETTS WATER RESOURCES AUTHORITY
Notes to Financial Statements
June 30, 2019 and 2018
(Dollars in thousands)
19
The net balance at June 30, 2019 and 2018 is presented on the statements of net position as follows:
Current year2019 2018 change
Regulatory Assets 370,030$ 505,915$ (135,885)$Deferred Inflows from Regulatory Activities (26,690) (42,718) 16,028
Net Change 343,340$ 463,197$ (119,857)$
The balance in the rate stabilization reserve was $43,044 at June 30, 2019 and 2018, respectively.
(4) Deposits and Investments
The following represents essential risk information about the Authority’s deposits and investments:
(a) Custodial Credit Risk – DepositsThe custodial credit risk for deposits and certificates of deposit is the risk that, in the event of a bank failure, the Authority’s deposits may not be recovered.
The bank deposits at June 30, 2019 and 2018 were $52,267 and $40,521, respectively. Of these amounts, $52,017 and $40,271, were exposed to custodial credit risks as uninsured and uncollateralized.
(b) InvestmentsThe Authority is authorized by its general bond resolution to invest in obligations of the U.S. Treasury, its agencies and instrumentalities, bonds, or notes of public agencies or municipalities, bank time deposits, guaranteed interest contracts, Massachusetts Municipal Depository Trust (MMDT) accounts, interest rate swap agreements, and repurchase agreements. All investments are held by a third-party in the Authority’s name. These investments are recorded at fair value.
(c) Credit RatingsAll debt securities purchased, such as FNMA, FHLMC, and FHLB issues have historically had a credit rating of AAA or they have been collateralized to AAA. On August 8, 2011, Standard & Poor’s reduced the credit rating for these agencies to AA+. The reduction in credit rating did not affect the Authority’s bond covenants or escrow requirements.
The Massachusetts Municipal Depository Trust funds are not rated.
The general bond resolution limits the Authority to investing in securities that are rated in the three highest rating categories as defined by S&P and Moody’s or other rating agencies.

32
MASSACHUSETTS WATER RESOURCES AUTHORITY
Notes to Financial Statements
June 30, 2019 and 2018
(Dollars in thousands)
20
(d) Concentration RiskAt June 30, 2019 and 2018, the Authority had no investments, at fair value, which exceeded 5% of the Authority’s total investments.
(e) Interest Rate RiskThe following is a listing of the Authority’s fixed income investments and related maturity schedule as of June 30, 2019 and 2018:
Investment Type Fair Value <1 1–3 4–8 >9
Mass Municipal Depository Trust 599,315$ 599,315$ -$ -$ -$U.S. Agency Obligations 238,857 - 52,787 186,070 -U.S. Treasury Bills 9,837 9,837 - - -
Total 848,009$ 609,152$ 52,787$ 186,070$ -$
Investment Type Fair Value <1 1–3 4–8 >9
Mass Municipal Depository Trust 479,319$ 479,319$ -$ -$ -$U.S. Agency Obligations 246,403 17,995 23,207 197,386 7,815U.S. Treasury Bills 9,958 9,958 - - -
Total 735,680$ 507,272$ 23,207$ 197,386$ 7,815$
June 30, 2019Investment maturities (in years)
June 30, 2018Investment maturities (in years)
The majority of the Authority’s investments are held in short-term money market funds and long-term investments in U.S. agency obligations that are held in the debt service reserve funds where the intent is to hold until maturity.
(f) Investment ValuesThe Authority categorizes its fair value measurements within the fair value hierarchy established by generally accepted accounting principles. Debt securities classified in Level 1 of the fair value hierarchy are valued using prices quoted in active markets for those securities. Debt securities classified in Level 2 of the fair value hierarchy are valued using a matrix pricing technique. Matrix pricing is used to value securities based on the securities’ relationship to benchmark quoted prices. The Authority has no securities classified in Level 3. The investment in MMDT, an external investment pool, is measured at $1.00 per share – the net asset value determined by the pool.
The Authority has the following recurring fair value measurements as of June 30, 2019 and 2018: U.S. Government agency obligations $238,857 and $246,403 (Level 2), respectively, U.S Treasury Bills $9,837 and $9,958 (Level 2), respectively, and MMDT $599,315 and $479,319 (NAV), respectively. There are no withdrawal restrictions or unfunded commitments related to the MMDT investment.

33
MASSACHUSETTS WATER RESOURCES AUTHORITY
Notes to Financial Statements
June 30, 2019 and 2018
(Dollars in thousands)
21
(g) Restricted Investments by FundThe following summarizes restricted investments as of June 30, 2019 and 2018 by various funds and accounts established by the Authority for debt covenants and other purposes:
2019 2018Restricted Investments:
Construction 189,293$ 105,802$Debt Service Reserves 156,687 149,933Debt Service Principal and Interest 318,545 302,690Debt Service - Revenue Redemption 26,134 25,075Operating Reserve 41,952 40,070Rate Stabilization Reserve 43,044 43,044Revenue 30,126 29,952Combined Reserves - Renewal and Replacement Reserve 9,158 6,747Combined Reserves - Insurance Reserve 14,000 14,000Insurance Related Escrow Deposits 7,409 7,115
Total Restricted Investments 836,348$ 724,428$
(5) Bond Resolution Reserves
The components of the reserves funded from revenues and required by the general and supplemental bond resolutions at June 30, 2019 and 2018 are as follows:
Reserves Sewer Water 2019 2018Renewal and Replacement 2,544$ 1,457$ 4,001$ 4,001$Insurance 7,000 7,000 14,000 14,000Operating 27,326 14,629 41,955 40,073
Total 36,870$ 23,086$ 59,956$ 58,074$
Total
A renewal and replacement reserve of $6,000 was established through grant receipts transferred from the Commonwealth in 1985 and is included in restricted net position at June 30, 2019 and 2018.

34
MASSACHUSETTS WATER RESOURCES AUTHORITY
Notes to Financial Statements
June 30, 2019 and 2018
(Dollars in thousands)
22
(6) Notes Payable and Long-Term Debt
Long-term debt at June 30, 2019 and 2018 consisted of the following:
2019 2018General Revenue Bonds:
2002 Series J, 5 1/4% to 5 1/2%, issued December 18, 2002, due 2019 to 2022 140,895$ 189,020$2011 Series B, 4 1/8% to 5%, issued May 19, 2011, due 2019 to 2031 6,255 7,8502012 Series A, 3 1/4% to 5%, issued April 19, 2012, due 2022 to 2042 72,655 74,5902014 Series D, 5%, issued November 19, 2014, due 2021 to 2044 60,165 60,1652016 Series B, 3% to 5%, issued May 12, 2016, due 2019 to 2040 62,090 63,3702017 Series B, 5%, issued May 18, 2017, due 2019 to 2042 66,980 68,2402018 Series B, 3% to 5%, issued May 16, 2018, due 2019 to 2043 107,580 107,5802019 Series B, 5%, issued May 22, 2019, due 2023 to 2044 125,000 -
Total 641,620 570,815
General Revenue Refunding Bonds:2007 Series B, 5 1/4%, issued February 1, 2007, due 2023 to 2038 647,950 647,9502009 Series B, 5%, issued February 19, 2009, due 2019 to 2022 65,480 126,4152010 Series B, 5%, issued May 6, 2010, due 2019 to 2027 85,760 95,9452011 Series C, 3 1/8% to 5 1/4%, issued December 8, 2011, due 2022 to 2042 291,160 321,1602012 Series B, 4 1/4% to 5%, issued April 19, 2012, due 2026 to 2029 86,775 86,7752013 Series A, 4% to 5%, issued March 27, 2013, due 2022 to 2036 102,515 102,5152014 Series E, 5%, issued November 19, 2014, due 2019 to 2020 5,245 15,6052014 Series F, 4% to 5%, issued November 19, 2014, due 2021 to 2041 141,410 141,4102016 Series C, 4% to 5%, issued May 12, 2016, due 2022 to 2040 678,185 678,1852016 Series D, 3% to 5%, issued August 24, 2016, due 2024 to 2042 104,260 104,2602017 Series C, 4% to 5%, issued May 18, 2017, due 2021 to 2032 245,500 249,5002018 Series C, 5%, issued May 16, 2018, due 2023 to 2026 21,900 21,9002019 Series C, 5%, issued May 22, 2019, due 2021 to 2022 19,190 -
Total 2,495,330 2,591,620

35
MASSACHUSETTS WATER RESOURCES AUTHORITY
Notes to Financial Statements
June 30, 2019 and 2018
(Dollars in thousands)
23
2019 2018General Revenue Bonds with the Massachusetts Clean Water Trust:
1998 Series C, 4 3/4%, issued July 9, 1998 -$ 420$1999 Series E Sewer, 4 3/4%, issued October 6, 1999, due 2019 to 2029 5,198 5,5831999 Series E Water, 4 3/4%, issued October 6, 1999, due 2019 800 1,5801999 Series F, 5 3/4% to 6%, issued November 3, 1999, due 2019 to 2029 162,905 181,0302000 Series E Sewer, 5 1/4% to 5 1/2%, issued November 1, 2000, due 2019 to 2030 41,020 43,5112000 Series E Water, 5 1/4%, issued November 1, 2000, due 2019 to 2020 1,670 2,4702001 Series C Water, 5% , issued July 26, 2001, due 2020 to 2021 720 1,0652001 Series D Sewer, 5 3/8% to 5 1/2%, issued July 26, 2001, due 2019 to 2029 1,015 1,5322001 Series D Water, 5 1/2%, issued July 26, 2001, due 2019 113 2242002 Series H Sewer, 5% to 5 1/4%, issued October 31, 2002, due 2019 to 2032 54,125 57,0952002 Series H Water, 5% to 5 1/4%, issued October 31, 2002, due 2019 to 2022 8,475 10,4152002 Series I Sewer, 5 1/4% to 5 1/2%, issued October 31, 2002, due 2019 to 2030 1,445 1,5392002 Series I Water, 5 1/4%, issued October 31, 2002, due 2019 to 2020 4 62003 Series A Water, 5%, issued October 31, 2002, due 2019 to 2022 386 4752003 Series B Water, 5%, issued July 24, 2003, due 2020 to 2021 652 9652003 Series C Sewer, 5% to 5 1/4%, issued November 6, 2003, due 2019 to 2033 20,015 21,0102003 Series C Water, 4 3/4% to 5%, issued November 6, 2003, due 2019 to 2023 6,680 7,8852004 Series C Sewer, 5% to 5 1/4%, issued October 26, 2004, due 2019 to 2033 6,787 7,1232004 Series C Water, 5%, issued October 26, 2004, due 2019 to 2022 295 4162004 Series D Sewer, 4 1/2% to 5%, issued November 29, 2004, due 2019 to 2034 36,980 38,6052004 Series D Water, 5%, issued November 29, 2004, due 2019 to 2024 5,220 5,9352005 Series C Sewer, 5% to 5 1/4%, issued November 3, 2005, due 2019 to 2033 4,118 4,4152005 Series C Water, 5%, issued November 3, 2005, due 2019 to 2023 350 412

36
MASSACHUSETTS WATER RESOURCES AUTHORITY
Notes to Financial Statements
June 30, 2019 and 2018
(Dollars in thousands)
24
2019 2018General Revenue Bonds with the Massachusetts Clean Water Trust (Continued):
2005 Series D Sewer, 2 3/10%, issued November 16, 2005, due 2019 to 2035 41,552$ 43,526$2005 Series D Water, 0% to 2%, issued November 16, 2005, due 2019 to 2025 5,413 6,1682005 Series E Sewer, 2%, issued November 16, 2005, due 2019 to 2025 161 1822005 Series E Water, 2%, issued November 16, 2005, due 2019 to 2025 36 412006 Series C Sewer, 5%, issued October 26, 2006, due 2019 to 2034 5,244 5,5902006 Series D Sewer, 2 3/10%, issued December 14, 2006, due 2019 to 2036 39,981 41,7452006 Series D Water, 0% to 2%, issued December 14, 2006, due 2019 to 2026 12,356 13,8622006 Series E Sewer, 2%, issued December 14, 2006, due 2019 to 2026 168 1872006 Series E Water, 2%, issued December 14, 2006, due 2019 to 2026 75 842007 Series C Sewer, 2% to 2 3/10%, issued November 9, 2007, due 2019 to 2035 2,057 2,3112007 Series C Water, 2%, issued November 9, 2007, due 2019 to 2025 1,077 1,2292007 Series D Sewer, 2 3/10%, issued November 9, 2007, due 2019 to 2036 16,407 17,1342007 Series E Sewer, 2 2/5%, issued December 18, 2007, due 2019 to 2037 39,926 41,5622007 Series E Water, 2%, issuedDecember 18, 2007, due 2019 to 2027 9,995 10,9982008 Series G Sewer, 2%, issued December 9, 2008, due 2019 to 2026 2,757 3,0922008 Series G Water, 2%, issued December 9, 2008, due 2019 to 2026 588 6562009 Series C Sewer, 2% to 2 2/5%, issued March 18, 2009, due 2019 to 2038 52,200 56,5042009 Series C Water, 2%, issued March 18, 2009, due 2019 to 2028 16,689 18,1812009 Series D Sewer, 2% to 2 2/5%, issued December 15, 2009, due 2019 to 2037 7,163 7,6262009 Series D Water, 2%, issued December 15, 2009, due 2019 to 2027 690 7592010 Series D Sewer, 2% to 2 2/5%, issued July 8, 2010, due 2019 to 2040 19,613 20,5212010 Series D Water, 2%, issued July 8, 2010, due 2019 to 2030 14,943 16,0342011 Series A Sewer, 2% to 2 2/5%, issued March 15, 2011, due 2019 to 2038 3,847 4,130

37
MASSACHUSETTS WATER RESOURCES AUTHORITY
Notes to Financial Statements
June 30, 2019 and 2018
(Dollars in thousands)
25
2019 2018General Revenue Bonds with the Massachusetts Clean Water Trust (Continued):
2011 Series A Water, 2%, issued March 15, 2011, due 2019 to 2028 3,213$ 3,505$2012 Series C Sewer, 2% to 2 2/5%, issued June 6, 2012, due 2019 to 2040 5,428 5,8282012 Series C Water, 2%, issued June 6, 2012, due 2019 to 2030 2,673 2,8662012 Series D Sewer, 2% to 2 2/5%, issued June 13, 2012, due 2019 to 2042 32,484 34,5222012 Series D Water, 2%, issued June 13, 2012, due 2019 to 2032 6,387 6,7742013 Series B Sewer, 2% to 2 2/5%, issued May 22, 2013, due 2020 to 2043 22,610 24,2552013 Series B Water, 2%, issued May 22, 2013, due 2020 to 2033 6,404 6,7922014 Series C Sewer, 2% to 2 2/5%, issued May 30, 2014, due 2019 to 2042 4,031 4,2152014 Series C Water, 2%, issued May 30, 2014, due 2019 to 2032 4,396 4,6812015 Series A Sewer, 2% to 2 2/5%, issued January 7, 2015, due 2020 to 2045 41,819 43,4022015 Series A Water, 2%, issued January 7, 2015, due 2020 to 2035 13,165 13,8472015 Series B Sewer, 2% to 2 2/5%, issued May 14, 2015, due 2019 to 2043 2,617 2,8162015 Series B Water, 2%, issued May 14, 2015, due 2019 to 2033 1,722 1,8352016 Series A Sewer, 2% to 2 2/5%, issued March 11, 2016, due 2020 to 2046 35,731 36,9432016 Series A Water, 2%, issued March 11, 2016, due 2020 to 2036 11,987 12,5652017 Series A Sewer, 2%, issued April 13, 2017, due 2020 to 2036 8,028 8,3892017 Series A Water, 2%, issued April 13, 2017, due 2020 to 2037 22,787 23,8122018 Series E Sewer, 2%, issued September 12, 2018, due 2019 to 2038 17,386 -2018 Series E Water, 2%, issued September 12, 2018, due 2019 to 2038 32,614 -2019 Series A Sewer, Interim loan, issued January 28, 2019 32,770 -2019 Series A Water, Interim loan, issued January 28, 2019 19,720 -
Total 979,883 942,880
General Revenue Bonds (Variable Rates):1999 Series B, 1.02% to 2.51%, issued January 29, 1999, due 2019 to 2028 50,700 54,700
Total 50,700 54,700

38
MASSACHUSETTS WATER RESOURCES AUTHORITY
Notes to Financial Statements
June 30, 2019 and 2018
(Dollars in thousands)
26
2019 2018General Revenue Refunding Bonds (Variable Rates):
2002 Series C, 0.53% to 2.18%, issued August 15, 2002, due 2020 35,120$ 35,120$2008 Series A, 0.94% to 2.33%, issued May 29, 2008, due 2019 to 2037 203,940 209,4252008 Series C, 0.87% to 2.16%, issued May 29, 2008, due 2019 to 2026 70,700 86,3002008 Series E, 0.94% to 2.32%, issued May 29, 2008, due 2020 to 2037 133,640 133,6402012 Series E, 1.39% to 2.75%, issued November 15, 2012, due 2019 to 2031 (Direct Borrowing) 58,435 59,9502012 Series G, 1.34% to 2.70%, issued November 15, 2012, due 2019 to 2023 (Direct Borrowing) 26,500 36,9002014 Series A, 1.93% to 2.36%, issued May 20, 2014, due 2022 to 2025 (Direct Borrowing) 50,000 50,0002014 Series B, 2.01% to 2.44%, issued May 20, 2014, due 2019 to 2022 (Direct Borrowing) 54,095 64,7552018 Series A, 2.00% to 2.36%, issued March 26, 2018, due 2019 to 2031 (Direct Borrowing) 49,095 50,6102018 Series D, 1.34% to 2.70%, issued May 31, 2018, due 2025 to 2029 (Direct Borrowing) 50,000 50,000
Total 731,525 776,700
Revolving Loan:2015 Series C, issued November 1, 2015, due 2021 53,000 53,000
Total 4,952,058 4,989,715
Less:Unamortized Bond Premiums and Discounts 391,722 391,624Current Portion of Long-Term Debt (237,918) (225,917)
Total 153,804 165,707
Long-Term Debt, Net 5,105,862$ 5,155,422$

39
MASSACHUSETTS WATER RESOURCES AUTHORITY
Notes to Financial Statements
June 30, 2019 and 2018
(Dollars in thousands)
27
Long-term obligations at June 30, 2019 and 2018 consisted of the following:
2019 2019 DueBeginning Ending WithinBalance Additions Reductions Balance One Year
General Revenue Bonds 625,515$ 125,000$ 58,195$ 692,320$ 33,615$ General Revenue Refunding Bonds 3,056,105 19,190 136,565 2,938,730 112,230Refunding from Direct Borrowings 312,215 - 24,090 288,125 24,990General Revenue Bonds with the Massachusetts Clean Water Trust 942,880 102,490 65,487 979,883 67,083Borrowings Associated with Derivative Instruments 36,894 - 2,940 33,954 -Revolving Loan 53,000 - - 53,000 -
Total 5,026,609$ 246,680$ 287,277$ 4,986,012$ 237,918$
2018 2018 DueBeginning Ending WithinBalance Additions Reductions Balance One Year
General Revenue Bonds 580,035$ 107,580$ 62,100$ 625,515$ 52,665$ General Revenue Refunding Bonds 3,152,800 21,900 118,595 3,056,105 83,675Refunding from Direct Borrowings 275,145 100,610 63,540 312,215 24,090General Revenue Bonds with the Massachusetts Clean Water Trust 1,006,451 565 64,136 942,880 65,487Borrowings Associated with Derivative Instruments 39,834 - 2,940 36,894 -Revolving Loan 79,000 - 26,000 53,000 -
Total 5,133,265$ 230,655$ 337,311$ 5,026,609$ 225,917$
The Authority is required to establish water and sewer rates and charges at a level sufficient to provide, among other things, primary and subordinated debt service coverage ratios of 120% and 110%, respectively. For the year ended June 30, 2019, the Authority had primary and subordinated debt service coverage ratios of 192% and 118%, respectively.
Under the Authority’s General Revenue Bond Resolution, all revenues, together with the investment earnings thereon, except to the extent that such earnings are required to be deposited in the Rebate Fund pursuant to a Supplemental Resolution, are pledged for payment of the Bonds.
The Act of 1984 imposes a limitation of $600,000 on the total amount of bonds and notes which may be outstanding at any one time. The Authority has requested increases in its debt limit as necessary to allow for issuances of bonds in amounts required to finance the capital program. The state legislature increased the debt limit to $6,450,000.
On May 22, 2019, the Authority issued General Revenue Bonds, 2019 Series B for $125,000 and General Revenue Refunding Bonds, 2019 Series C for $19,190.
The proceeds from the Series B bonds were used to finance new construction projects. The interest rate on these bonds is 5%.

40
MASSACHUSETTS WATER RESOURCES AUTHORITY
Notes to Financial Statements
June 30, 2019 and 2018
(Dollars in thousands)
28
The proceeds from the Series C bonds were used to refund $20,340 of General Revenue Refunding Bonds 2009 Series B. The interest rate on these bonds is 5%. The cash flow required to make principal and interest payments on the refunding bonds is approximately $1,619 less than the debt service requirements of the refunded bonds. The economic gain (the difference between the present values of the debt service payments on the old and new debt) obtained from this refunding is $1,551.
On May 31, 2018, the Authority issued direct-purchase General Revenue Refunding Bonds, 2018 Series D for $50,000. The proceeds from these bonds were used to retire commercial paper notes.
On May 16, 2018, the Authority issued General Revenue Bonds, 2018 Series B for $107,580 and General Revenue Refunding Bonds, 2018 Series C for $21,900.
The proceeds from the Series B bonds were used to finance new construction projects and to retire commercial paper notes ($25,000) and a portion of the 2015 Series C Revolving Loan ($26,000). The interest rate on these bonds is 3% to 5%.
The proceeds from the Series C bonds were used to refund $24,935 of General Revenue Refunding Bonds 2006 Series B. The interest rate on these bonds is 5%. The cash flow required to make principal and interest payments on the refunding bonds is approximately $4,426 less than the debt service requirements of the refunded bonds. The economic gain (the difference between the present values of the debt service payments on the old and new debt) obtained from this refunding is $3,808.
On March 26, 2018, the Authority issued direct-purchase General Revenue Refunding Bonds, 2018 Series A for $50,610. The proceeds from these bonds were used to refund in full the General Revenue Refunding Bonds, 2012 Series F.
The variable interest rate on these bonds will be based on 81.5% of LIBOR set on the first business day of each month. The monthly payment will be a combination of this variable interest and a fixed component of 37 basis points for 2018 Series A.
On November 1, 2015, the Authority entered into a revolving credit agreement with a bank. The Authority shall repay the loan at the Commitment Termination Date, November 17, 2021, at which point the Authority can elect to convert the revolving loan into a term loan. Interest is payable at 80% of the 1 month LIBOR rate, 2.40% and 2.09% at June 30, 2019 and 2018, respectively. Initial drawdown was $100,000, which was reduced to $79,000 at June 30, 2016. The balance was further reduced in fiscal year 2018 to $53,000 using the proceeds from the General Revenue Bonds, 2018 Series B.

41
MASSACHUSETTS WATER RESOURCES AUTHORITY
Notes to Financial Statements
June 30, 2019 and 2018
(Dollars in thousands)
29
Synthetic Fixed Rate Swap TransactionsIn connection with several of its bond issues, the Authority has entered into various interest rate swap agreements to reduce the impact of changes in interest rates on its variable rate debt. Under these agreements, the Authority pays a fixed interest rate (ranging from 4.0% to 5.5%) and receives interest from the swap counterparties at a variable rate (either Securities Industry and Financial Markets Association (SIFMA) rate or a percentage of LIBOR). The SIFMA rate is based on the seven-day high-grade market index of tax-exempt variable rate demand obligations.
FixedCurrent Payable Variable
Effective Notional Termination Swap ReceivableItem Objective Date Amount Date Rate Swap Rate 2019 2018
A Hedge changes in cash flows on the 2008 Series A Bonds April 4, 2011 133,300$ August 1, 2030 5.144% 67% LIBOR (8,747)$ (4,764)$
Plus 0.13%B Hedge changes in cash flows
on the 2008 Series E Bonds October 28, 2008 133,300 August 1, 2030 5.494 SIFMA (15,272) (11,284)
C Hedge changes in cash flows on the 2008 Series A and 2008 Series E Bonds August 1, 2030 70,400 August 1, 2037 6.585 67% LIBOR (3,434) (2,186)
Plus 0.13%D Hedge changes in cash flows
on the 2008 Series C Bonds May 29, 2008 58,015 November 1, 2026 3.994 SIFMA (3,860) (3,380)
E Hedge changes in cash flows on the 2008 Series C and 2012 Series G Bonds May 29, 2008 38,680 November 1, 2026 4.033 SIFMA (327) 626
Total (31,640)$ (20,988)$
Fair Valueat June 30,
All of the above are pay-fixed interest rate swap agreements. Under these interest rate swap agreements, the Authority incurred net interest expense of $12,290 and $14,676 in fiscal year 2019 and fiscal year 2018, respectively.
For the swap effective on April 4, 2011, with a current notional amount of $133,300, the fixed rate paid by the Authority is as follows: 4.120% from execution until August 2013, 5.144% from August 2013 until August 2019, and 6.585% from August 2019 until August 2030.
For the swap execution on October 28, 2008, with a current notional amount of $133,300, the fixed rate paid by the Authority is as follows: 4.470% from execution until August 2013, 5.494% from August 2013 until August 2019, and 6.935% from August 2019 until August 2030.
The aggregate fair value balance of the derivative instruments at June 30, 2019 and 2018 is $(31,640) and $(20,988), respectively, and is reflected on the Authority’s statements of net position as a liability for derivative instruments. This liability is offset by deferred outflows from derivative instruments. The original notional amounts of the interest rate swaps totaled $535,895.

42
MASSACHUSETTS WATER RESOURCES AUTHORITY
Notes to Financial Statements
June 30, 2019 and 2018
(Dollars in thousands)
30
The fair values of the interest rate swaps were estimated using the zero-coupon method. This method calculates the future net settlement payments required by the swap, assuming that the current forward rates implied by the yield curve correctly anticipate future spot interest rates. These payments are then discounted using the spot rates implied by the current yield curve for hypothetical zero-coupon bonds due on the date of each future net settlement on the swaps. The interest rate swaps are classified in Level 2 of the fair value hierarchy, as outlined in Government Accounting Standards Board Statement No. 72, Fair Value Measurement and Application, as valued using a market approach that considers benchmark interest rates.
Risk DisclosureCredit Risk - Because all of the Authority’s swaps rely upon the performance of the third parties who serve as swap counterparties, the Authority is exposed to credit risk, or the risk that a swap counterparty fails to perform according to its contractual obligations. The appropriate measurement of this risk at the reporting date is the fair value of the swaps, as shown in the columns labeled Fair Value in the tables above. To mitigate credit risk, the Authority maintains strict credit standards for swap counterparties. The Authority monitors swap counterparties’ credit ratings by the three rating agencies (FitchRatings, Moody’s Investors Service, and S&P Global Ratings). Collateral may be obtained from any counterparty that does not maintain a set credit rating. Since all derivatives are in a liability position, there is no amount exposed to credit risk.
The following represents the credit ratings of the counterparties as of June 30, 2019:
CounterpartyDerivative instrument credit rating
Derivative A A+Derivative B AA-Derivative C A+Derivative D ADerivative E A
Basis Risk - The Authority is exposed to basis risk because the floating index the Authority receives on the swaps (SIFMA or 67% of LIBOR) may be different than the basis of the variable rate on the associated bonds. Should this occur, the expected savings may not be realized.
Termination Risk - The Authority or its counterparties may terminate a derivative instrument if the other party fails to perform under the terms of the contract. If, at the time of termination, a derivative is in a liability position, the Authority would be liable to the counterparty for a payment equal to the liability, subject to netting arrangements.

43
MASSACHUSETTS WATER RESOURCES AUTHORITY
Notes to Financial Statements
June 30, 2019 and 2018
(Dollars in thousands)
31
Rollover Risk - The Authority can be exposed to rollover risk on hedging derivative instruments that are hedges of debt that terminate prior to the maturity of the debt. The Authority currently has no rollover risk. When derivative instruments A and B terminate in 2030, those bond series will then be hedged by derivative instrument C.
Swap Payments and Associated Bonds OutstandingBonds outstanding include certain variable rate bonds where the Authority pays a fixed interest rate and receives interest at a variable rate from the counterparty. The table below presents the debt service requirements and related net swap payments for these bonds. As rates vary, variable rate interest payments will vary.
Using rates as of June 30, 2019, debt service requirements of the hedged variable rate bonds and net swap payments, assuming current interest rates remain constant, were as follows:
Variable-rate Interest RateFiscal Year Ending June 30: Principal Interest Swaps, Net Total
2020 27,000$ 5,219$ 14,155$ 46,374$2021 70,400 4,201 14,685 89,2862022 32,230 3,285 12,360 47,8752023 67,345 2,655 9,482 79,4822024 15,025 2,422 7,265 24,712
2025–2029 80,895 7,301 22,445 110,6412030–2034 16,800 5,115 12,833 34,7482035–2038 53,600 1,337 3,829 58,766
Total 363,295$ 31,535$ 97,054$ 491,884$
Demand BondsIncluded in variable rate long-term debt of $782,225 is $494,100 of subordinated variable rate demand obligations (VRDOs). The bonds were issued on various dates from 1999 through 2008. Subordinated VRDOs are subject to purchase on the demand of the holder at a price equal to principal plus accrued interest. The ability of the Authority to purchase such bonds, if not remarketed, is secured through letters of credit and standby bond purchase agreements with various nationally recognized financial institutions that expire between May 2020 and August 2022. The VRDOs are classified as long-term debt because the liquidity agreement for each series contains term out provisions that, if demand is made to repurchase the bonds, calls for a two to three year amortization to repay the bonds.
In 2014, $114,755 of 2014 Series A and B General Revenue Refunding Bonds were issued as direct-purchase bonds, to be held by the purchaser for a specific period of time and are not subject to purchase or remarketing at the demand of the holder and therefore do not require a letter of credit or standby bond purchase agreement. The $50,000 of Series A and $64,755 of Series B have been purchased through May 2020 and August 2022, respectively. These bonds, with a current total of $104,095, in addition to 2012 Series E & G General Revenue Refunding Bonds, totaling $84,935, have two to three year term out provisions beginning at the expiration date.

44
MASSACHUSETTS WATER RESOURCES AUTHORITY
Notes to Financial Statements
June 30, 2019 and 2018
(Dollars in thousands)
32
At June 30, 2019, the following bonds outstanding are considered defeased in-substance:
OutstandingRedemption Redemption principal
Description date price amount
1992 Series A 2019 100 18,515$2002 Series J 2020 100 7,6302009 Series A 2019 100 76,4452009 Series B 2019 100 186,0602010 Series A 2019-2020 100 95,2652010 Series B 2019-2020 100 51,0952011 Series B 2019-2021 100 124,2852012 Series A 2020 and 2022 100 54,8002013 Series A 2019-2022 100 4,1852014 Series D 2019-2020, 2024 100 8,2952014 Series E 2019 100 2,9502014 Series F 2020 100 1152016 Series B 2020 100 1,3602017 Series C 2020 100 5,245
The proceeds and available funds were deposited in irrevocable trusts with escrow agents in an amount which will provide for payment of interest due to the redemption date and redemption of the defeased bonds outstanding on such date. The defeased portion of such debt, accrued interest thereon, and related unamortized issuance and discount costs were removed from the statements of net position in an in-substance defeasance transaction.
In June 2019, the Authority used funds on hand to defease $4,150 of the 2002 Series J General Revenue Bonds and $20,000 of the 2009 Series B General Revenue Refunding Bonds outstanding.
In September 2018, the Authority used funds on hand to defease $1,380 of the 2002 Series J General Revenue Bonds and $12,550 of the 2009 Series B General Revenue Refunding Bonds outstanding.
In June 2018, the Authority used funds on hand to defease $2,100 of the 2002 Series J, and $1,380 of the 2014 Series D General Revenue Bonds and $5,495 of the 2006 Series B, $15,200 of the 2009 Series B and $5,245 of the 2017 Series C General Revenue Refunding Bonds outstanding.
In October 2017, the Authority used funds on hand to defease $1,390 of the 2010 Series A, $510 of the 2011 Series B and $1,360 of the 2016 Series B General Revenue Bonds and $3,610 of the 2009 Series B and $2,700 of the 2010 Series B General Revenue Refunding Bonds outstanding.

45
MASSACHUSETTS WATER RESOURCES AUTHORITY
Notes to Financial Statements
June 30, 2019 and 2018
(Dollars in thousands)
33
At June 30, 2019, outstanding bonds that are redeemable before their scheduled due dates are as follows:
OutstandingRedemption Redemption principal
Description date price amount
2010 Series B August 2020 100 66,870$2011 Series B August 2021 100 8402011 Series C August 2021 100 291,1602012 Series A August 2022 100 69,1502012 Series B August 2022 100 86,7752013 Series A August 2023 100 46,5152014 Series D August 2024 100 53,8852014 Series F August 2024 100 93,6552016 Series B August 2026 100 54,7752016 Series C August 2026 100 610,6502016 Series D August 2026 100 98,4252017 Series B August 2020 100 2,8452017 Series B August 2027 100 55,7752017 Series C August 2027 100 114,7952018 Series B August 2025 100 23,9402018 Series B August 2028 100 75,9402019 Series B August 2029 100 70,265
The variable rate General Revenue Bonds are subject to redemption prior to maturity at the option of the Authority in whole or in part, on any interest payment date for bond Series 1999B and 2002C and on any business day for bond Series 2008A, 2008C, 2008E, 2012G, 2014A, 2014B, 2018A and 2018D, respectively. Series 2012E is subject to redemption prior to maturity on any interest payment date after November 15, 2014.
During fiscal year 2019, the Authority executed loan agreements with the Massachusetts Clean Water Trust providing for 2018 Series E Sewer and Water loans in the principal amounts of $17,386 and $32,614, respectively. The Authority also executed interim loan agreements with the Massachusetts Clean Water Trust providing for 2019 Series A Sewer and Water loans in the principal amounts of $32,770 and $19,720, respectively. All proceeds for these loans were received by June 30, 2019.
Federal and Commonwealth subsidies for purposes of offsetting principal payments aggregating $29,340 will be recognized as capital grants in aid of construction over the term of the loans.
Interest is payable semiannually on all debt, except on the commercial paper, on which interest is payable upon maturity and the General Revenue Bonds and General Revenue Refunding Bonds with variable interest rates on which interest is payable monthly. The Senior General Revenue Bonds and the General Revenue Refunding Bonds are collateralized equally and ratably by a lien and pledge on substantially all of the Authority’s cash and revenues, except the operating fund.

46
MASSACHUSETTS WATER RESOURCES AUTHORITY
Notes to Financial Statements
June 30, 2019 and 2018
(Dollars in thousands)
34
The subordinated debt series, including the commercial paper interest are collateralized equally and ratably by a subordinated pledge on substantially all of the Authority’s revenues and cash and investments, except the operating, senior debt service, and debt service reserve funds. Premiums, discounts, issuance costs, and the excess of reacquisition price over the carrying amount of the defeased debt are being amortized over the lives of the respective issues.
The amounts of long-term debt, principal, and interest payable in future fiscal years are as follows:
Year Ending June 30: Principal Interest Total2020 237,918$ 207,755$ 445,673$2021 245,512 198,517 444,0292022 295,807 188,943 484,7502023 273,192 176,217 449,4092024 299,389 165,639 465,028
2025–2029 1,404,053 636,522 2,040,5752030–2034 992,883 368,114 1,360,9972035–2039 814,936 176,362 991,2982040–2044 375,430 32,481 407,9112045–2046 12,938 365 13,303
Total 4,952,058$ 2,150,915$ 7,102,973$
In fiscal year 2019 the Authority had $75,000 of commercial paper notes outstanding. In fiscal year 2018 the Authority issued commercial paper notes of $51,000 to finance capital expenditures.
These notes are secured by $100,000 and $150,000 irrevocable direct-pay letters of credit which expire on December 8, 2021, and April 12, 2023, respectively. These letters of credit carry a fee of 0.45% and 0.265% per annum, respectively, on the amount available. The maximum aggregate principal amount of commercial paper which may be outstanding at any one time is $250,000.
Commercial paper at June 30, 2019 and 2018 consisted of the following:
2019 2019Beginning Ending
balance Additions Reductions balance0.94% Commercial Paper 75,000$ -$ 75,000$ -$1.86% Commercial Paper - 75,000 - 75,000
Total 75,000$ 75,000$ 75,000$ 75,000$
2018 2018Beginning Ending
balance Additions Reductions balance0.90% Commercial Paper 50,000$ -$ 50,000$ -$0.94% Commercial Paper 49,000 51,000 25,000 75,000
Total 99,000$ 51,000$ 75,000$ 75,000$

47
MASSACHUSETTS WATER RESOURCES AUTHORITY
Notes to Financial Statements
June 30, 2019 and 2018
(Dollars in thousands)
35
(7) Accounts Receivable/Intergovernmental Loans
The Authority has entered into various interest-free loan agreements with certain member communities. Under these agreements, the Authority loaned these communities $50,641 and $41,317 in fiscal years 2019 and 2018, respectively, to be received in five or ten equal annual installments.
The long-term portion of these loans at June 30, 2019 and 2018 is $151,756 and $133,871, respectively, and is included in other assets. The loans due within one year total $32,732 and $31,254 at June 30, 2019 and 2018, respectively. This program is designed to assist member communities with sewer and water systems rehabilitation.
(8) Capital Assets
Capital assets at June 30, 2019 and 2018 consisted of the following:
Disposals/2018 Additions transfers 2019
Capital assets not being depreciated:Land 29,878$ 7$ -$ 29,885$Construction in progress 180,525 86,441 (117,172) 149,794
Total capital assets not being depreciated 210,403 86,448 (117,172) 179,679
Capital assets being depreciated:Plant and equipment – waterand sewage system 9,730,790 116,200 - 9,846,990Furniture and fixtures 17,543 18 - 17,561Leasehold improvements 2,423 - - 2,423Motor vehicles and equipment 9,933 947 - 10,880
Total capital assets being depreciated 9,760,689 117,165 - 9,877,854
Less: accumulated depreciation for:plant and equipment – water and sewage system 3,999,993 193,508 - 4,193,501
Furniture and fixtures 17,411 82 - 17,493Leasehold improvements 2,144 12 - 2,156Motor vehicles and equipment 3,194 773 - 3,967
Total accumulated depreciation 4,022,742 194,375 - 4,217,117
Total capital assets being depreciated, net 5,737,947 (77,210) - 5,660,737
Total capital assets, net 5,948,350$ 9,238$ (117,172)$ 5,840,416$

48
MASSACHUSETTS WATER RESOURCES AUTHORITY
Notes to Financial Statements
June 30, 2019 and 2018
(Dollars in thousands)
36
Capital assets at June 30, 2018 and 2017 consisted of the following:
Disposals/2017 Additions transfers 2018
Capital assets not being depreciated:Land 29,873$ 5$ -$ 29,878$Construction in progress 127,423 110,252 (57,150) 180,525
Total capital assets not being depreciated 157,296 110,257 (57,150) 210,403
Capital assets being depreciated:Plant and equipment – waterand sewage system 9,668,357 62,433 - 9,730,790Furniture and fixtures 17,543 - - 17,543Leasehold improvements 2,423 - - 2,423Motor vehicles and equipment 8,898 1,035 - 9,933
Total capital assets being depreciated 9,697,221 63,468 - 9,760,689
Less: accumulated depreciation for:plant and equipment – water and sewage system 3,809,141 190,852 - 3,999,993
Furniture and fixtures 17,330 81 - 17,411Leasehold improvements 2,132 12 - 2,144Motor vehicles and equipment 2,500 694 - 3,194
Total accumulated depreciation 3,831,103 191,639 - 4,022,742
Total capital assets being depreciated, net 5,866,118 (128,171) - 5,737,947
Total capital assets, net 6,023,414$ (17,914)$ (57,150)$ 5,948,350$
Depreciation and amortization for fiscal years 2019 and 2018 was $207,127 and $202,799, respectively.
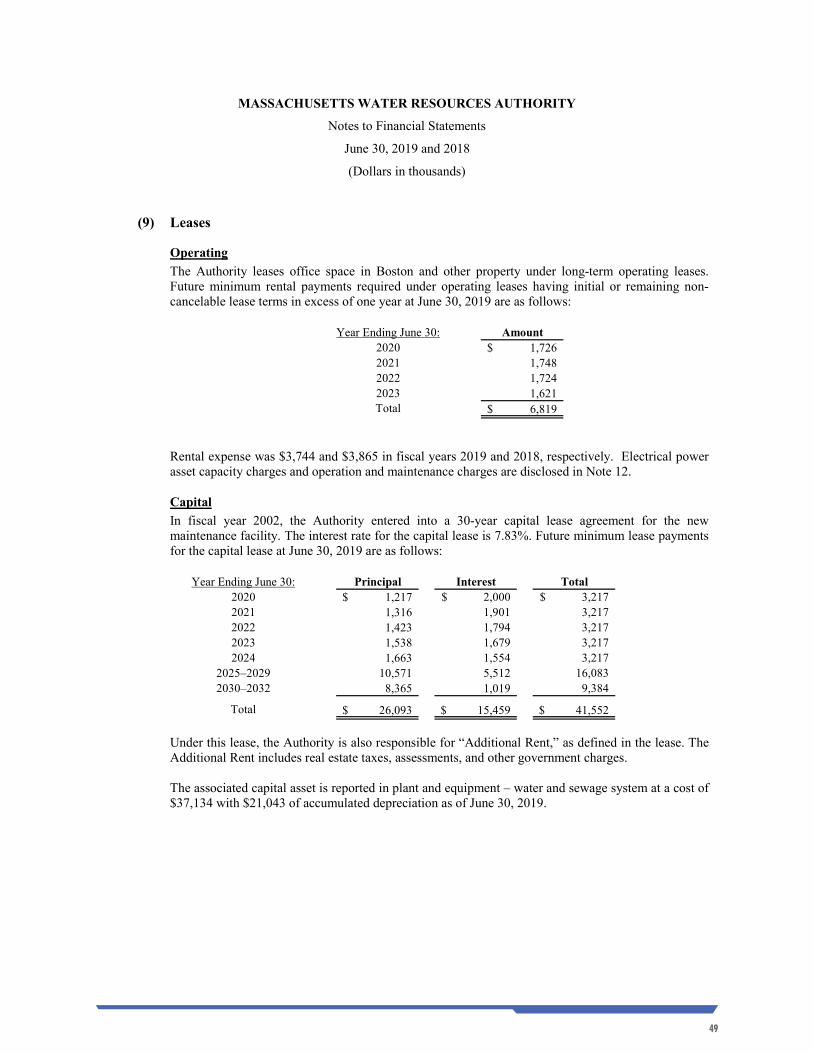
49
MASSACHUSETTS WATER RESOURCES AUTHORITY
Notes to Financial Statements
June 30, 2019 and 2018
(Dollars in thousands)
37
(9) Leases
OperatingThe Authority leases office space in Boston and other property under long-term operating leases. Future minimum rental payments required under operating leases having initial or remaining non-cancelable lease terms in excess of one year at June 30, 2019 are as follows:
Year Ending June 30: Amount2020 1,726$2021 1,7482022 1,7242023 1,621Total 6,819$
Rental expense was $3,744 and $3,865 in fiscal years 2019 and 2018, respectively. Electrical power asset capacity charges and operation and maintenance charges are disclosed in Note 12.
CapitalIn fiscal year 2002, the Authority entered into a 30-year capital lease agreement for the new maintenance facility. The interest rate for the capital lease is 7.83%. Future minimum lease payments for the capital lease at June 30, 2019 are as follows:
Year Ending June 30: Principal Interest Total2020 1,217$ 2,000$ 3,217$2021 1,316 1,901 3,2172022 1,423 1,794 3,2172023 1,538 1,679 3,2172024 1,663 1,554 3,217
2025–2029 10,571 5,512 16,0832030–2032 8,365 1,019 9,384
Total 26,093$ 15,459$ 41,552$
Under this lease, the Authority is also responsible for “Additional Rent,” as defined in the lease. The Additional Rent includes real estate taxes, assessments, and other government charges.
The associated capital asset is reported in plant and equipment – water and sewage system at a cost of $37,134 with $21,043 of accumulated depreciation as of June 30, 2019.

50
MASSACHUSETTS WATER RESOURCES AUTHORITY
Notes to Financial Statements
June 30, 2019 and 2018
(Dollars in thousands)
38
(10) Retirement Benefits
(a) Plan DescriptionThe Enabling Act provided for the establishment of the Massachusetts Water Resources Authority Employees’ Retirement System (the Plan), a contributory single-employer retirement system that is separate from the State Employees Retirement System. The Plan is a defined benefit pension plan covering those employees not employed by the MDC prior to July 1, 1985. Complete financial statements for the Plan can be obtained from the Authority’s administrative offices at Charlestown Navy Yard, 100 First Avenue, Boston, MA 02129.
(b) Benefits ProvidedThe Plan provides retirement, disability and death benefits. For employees hired prior to April 2,2012, the annual amount of the retirement allowance is based on the member’s final three-year average salary multiplied by (1) the number of years and full months of creditable service at the time of retirement and (2) a percentage based on age at retirement in accordance with a schedule provided by state law. Assuming normal retirement at age 65, this percentage is 2.5%, which is reduced for individuals who retire prior to age 65 to reflect the longer pay out period.
For employees hired on or after April 2, 2012, the annual amount of the retirement allowance is based on the member’s final five-year average salary multiplied by (1) the number of years and full months of creditable service at the time of retirement and (2) a percentage based on age at retirement in accordance with a schedule provided by state law. Assuming normal retirement at age 67, this percentage is 2.5%.
Employees hired prior to April 2, 2012, may elect early retirement after 20 years of service or at any time after attaining age 55 with 10 years of eligible service. Plan members who become permanently and totally disabled may be eligible to receive a disability retirement allowance. The amount of benefits to be received depends on several factors, including the member’s age, compensation, veteran status, years of service and whether or not the disability is work-related. In addition, certain death benefits exist for beneficiaries of employees who die in active service.
All MDC personnel who became employees of the Authority on July 1, 1985, and were members of the State Employees Retirement System, retained their membership in that system. The Authority is not liable for retirement allowances paid to or on account of these employees. Funding of the pension liability of the State Employees Retirement System is the obligation of the Commonwealth. Employees covered by this plan become 100% vested after 10 years of service.

51
MASSACHUSETTS WATER RESOURCES AUTHORITY
Notes to Financial Statements
June 30, 2019 and 2018
(Dollars in thousands)
39
(c) Employees Covered by Benefit TermsAt December 31, 2018 (the date of the Plan’s latest actuarial valuation), the following employees were covered by the benefit terms:
Retired Participants and Beneficiaries Receiving Benefits 625
Inactive Participants Entitled to a Return of their Employee Contributions 69
Inactive Participants with a Vested Right to a Deferred or Immediate Benefit 36
Active Participants 1,109
Total 1,839
(d) ContributionsContributions made by employees are based upon a percentage of employee base pay (5% for employees hired before December 31, 1974, 7% for employees hired between January 1, 1975 and December 31, 1983, 8% for employees hired between December 31, 1983, and June 30, 1996, and 9% for employees hired after July 1, 1996). Additionally, certain employees earning in excess of $30 contribute an extra 2% of their salary effective January 1, 1979. Employees receive full payment of contributions upon withdrawal from the Plan and 50% of interest earned for employees with five to nine years of service or 100% of interest earned for employees with 10 or more years of service.
The Authority’s 2019 and 2018 contributions to the plan were based on an amount approved by the Retirement Board and the Authority’s board of directors, which is based on an actuarially determined amount. The Authority’s Enabling Act requires funding to be made in accordance with the Retirement Board’s recommendation. In fiscal year 2019 the Authority made a $7.0 million required contribution. In fiscal year 2018 the Authority made a $3.3 million required contribution.
(e) Net Pension LiabilityThe Plan’s net pension liability was measured as of December 31, 2018 and 2017. The total pension liability was determined by an actuarial valuations as of January 1, 2019 and January 1, 2018, respectively.

52
MASSACHUSETTS WATER RESOURCES AUTHORITY
Notes to Financial Statements
June 30, 2019 and 2018
(Dollars in thousands)
40
Actuarial assumptions: The total pension liability in the January 1, 2019 and January 1, 2018 actuarial valuations were determined using the following actuarial assumptions, applied to all periods included in the measurement:
Inflation 3%
Salary Increases Based on years of service, starting at 5.75% at 0 years of service decreasing to 4% after 9 years of service
Investment Rate of Return 7.25% at December 31, 2018; 7.5% at December 31, 2017
Cost of Living Adjustments 3% of first $13,000, increasing to 3% of first $14,000 as of July 1, 2020 and to 3% of first $15,000 as of July 1, 2021 at December 31, 2018; 3% of the first $13,000 at December 31, 2017
Mortality Rates:
Pre-Retirement: RP-2014 Blue Collar Employee Mortality Table projected generationally with Scale MP-2017
Healthy Retiree: RP-2014 Blue Collar Healthy Annuitant Mortality Table projected generationally with Scale MP-2017
Disabled Retiree: RP-2014 Blue Collar Healthy Annuitant Mortality Table set forward one year projected generationally with Scale MP-2017

53
MASSACHUSETTS WATER RESOURCES AUTHORITY
Notes to Financial Statements
June 30, 2019 and 2018
(Dollars in thousands)
41
Rates of returns on investments: The long-term expected rate of return on pension plan investments was determined using a building-block method in which best-estimate ranges of expected future real rates of return (expected returns, net of pension plan investment expense and inflation) are developed for each major asset class. These ranges are combined to produce the long-term expected rate of return by weighting the expected future real rates of return by the target asset allocation percentage and by adding expected inflation. Best estimates of arithmetic real rates of return for each major asset class included in the Plan’s target asset allocation are summarized as follows:
TargetAllocation
Asset Class (%) December 31, 2018 December 31, 2017
Domestic Equity 22% 6.16 6.15
International Equity 20 6.69 - 9.47 7.11 - 9.41
Real Estate 10 4.58 4.9
Private Equity 10 10 10.28
Hedge Funds 17 3.68 3.94
Fixed Income 21 1.89 - 4.0 1.68 - 4.13
Total 100%
Long-Term Expected Rate of Return (%)
(f) Discount RateThe discount rate used to measure the total pension liability was 7.25% and 7.50% for December 31, 2018 and 2017, respectively. The projection of cash flows used to determine the discount rate assumed that Plan member contributions will be made at the current contribution rate and that the Authority contributions will be made at rates equal to the actuarially determined contribution rates. Based on those assumptions, the Plan’s fiduciary net position was projected to be available to make all projected future benefit payments of current Plan members. Therefore, the long-term expected rate of return on pension plan investments was applied to all periods of projected benefit payments to determine the total pension liability.

54
MASSACHUSETTS WATER RESOURCES AUTHORITY
Notes to Financial Statements
June 30, 2019 and 2018
(Dollars in thousands)
42
(g) Changes in the Net Pension Liability
Total Pension Plan Fiduciary Net PensionLiability Net Position Liability
(a) (b) (a) - (b)Balances at June 30, 2017 511,406$ 465,602$ 45,804$
Changes for the Year:Service Cost 11,308 - 11,308Interest 38,520 - 38,520Differences Between Expected and actual experience (146) - (146)Contributions - employer - 3,277 (3,277)Contributions - employee - 9,091 (9,091)Net investment income - 70,517 (70,517)Benefit payments (18,222) (18,222) -Administrative expenses - (447) 447Changes of assumptions 7,977 - 7,977
Net changes 39,437 64,216 (24,779)
Balances at June 30, 2018 550,843 529,818 21,025
Changes for the year:Service cost 11,762 - 11,762Interest 41,392 - 41,392Differences between expected and actual experience 3,250 - 3,250Contributions - employer - 7,000 (7,000)Contributions - employee - 9,484 (9,484)Net investment income - (17,114) 17,114Benefit payments (21,428) (21,428) -Administrative expenses - (469) 469Change of benefit terms 5,027 - 5,027Changes of assumptions 16,401 - 16,401
Net changes 56,404 (22,527) 78,931
Balances at June 30, 2019 607,247$ 507,291$ 99,956$
Increase (Decrease)

55
MASSACHUSETTS WATER RESOURCES AUTHORITY
Notes to Financial Statements
June 30, 2019 and 2018
(Dollars in thousands)
43
(h) Sensitivity of the Net Pension Liability (Asset) to Changes in the Discount RateThe following presents the net pension liability (asset), calculated using the discount rate of 7.25% and 7.50%, as well as what the net pension liability (asset) would be if it were calculated using a discount rate that is 1-percentage-point lower (6.25% and 6.50%) or 1-percentage-point higher (8.25% and 8.50%) than the current rate:
Current1% Decrease Discount 1% Increase
(6.25%) (7.25%) (8.25%)Net pension liability as of June 30, 2019 175,471$ 99,956$ 35,953$
Current1% Decrease Discount 1% Increase
(6.50%) (7.50%) (8.50%)Net pension liability (asset) as of June 30, 2018 89,971$ 21,025$ (37,437)$
(i) Pension Expense and Deferred Outflows of Resources and Deferred Inflows of Resources Related to PensionsFor the years ended June 30, 2019 and 2018, the Authority recognized pension expense of $30,146 and $12,408, respectively, and reported deferred outflows of resources and deferred inflows of resources related to pensions from the following sources:
Deferred Outflow Deferred Inflow Deferred Outflow Deferred Inflow of Resources of Resources of Resources of Resources
Differences between expected and actual experience 2,709$ 6,066$ -$ 9,010$
Changes of assumptions 26,455 - 17,154 -
Net difference between projected and actual earnings on pension plan investments 34,877 - - 5,953
Total 64,041$ 6,066$ 17,154$ 14,963$
June 30, 2018June 30, 2019
Amounts reported as deferred outflows of resources and deferred inflows of resources related to pensions will be recognized in pension expense as follows:
Year Ending June 30: Amount2020 17,888$2021 11,4662022 9,4362023 15,9102024 3,275Total 57,975$

56
MASSACHUSETTS WATER RESOURCES AUTHORITY
Notes to Financial Statements
June 30, 2019 and 2018
(Dollars in thousands)
44
(11) Other Postemployment Benefits (OPEB)
(a) Plan DescriptionIn addition to providing the pension benefits described, the Authority provides postemployment health care and life insurance benefits for retired employees through the Group Insurance Commission (GIC). The GIC is a quasi-independent state agency that administers an agent multi-employer defined benefit OPEB plan. The benefits, benefit levels, employee contributions and employer contributions are governed by the Authority and can be amended by the Authority. The plan does issue a separate financial report that can be obtained by contacting the Massachusetts Water Resources Authority, Finance Division, 100 First Avenue, Boston, MA 02129.
In April, 2015, the Authority established the MWRA Other Post-Employment Benefits (OPEB) Irrevocable Trust. The Trust was established for the sole purpose of providing for the advance funding of future costs of retired employee health insurance and other benefits provided to retirees. An initial deposit of $10.8 million was made to the trust upon establishment of the trust. The balance of the trust was $37.1 million and $29.8 million at June 30, 2019 and June 30, 2018, respectively.
(b) Plan Membership
At June 30, 2019 plan membership consisted of the following:
Inactive plan members or beneficiaries currently receiving benefits 833
Inactive plan members entitled to but not yet receiving benefits 36
Active plan members 950
Total 1,819
(c) Benefits ProvidedThe Authority provides medical, prescription drug, mental health/substance abuse and life insurance to retirees and their covered dependents. All active employees who retire from the Authority and meet the eligibility criteria will receive these benefits.
(d) ContributionsRetirees who retired on or before July 1, 1994 contribute 10% of the cost of the health plans, as determined by the GIC. Those who retired after July 1, 1994 contribute 15% of the cost of the health plan and those who retired after October 1, 2009 contribute 20% of the cost of the health plan, as determined by the GIC. The Authority contributes the remainder of the health plan costs on a pay-as-you-go basis.

57
MASSACHUSETTS WATER RESOURCES AUTHORITY
Notes to Financial Statements
June 30, 2019 and 2018
(Dollars in thousands)
45
(e) InvestmentsInvestment policy. The assets are invested by the Trust with the Commonwealth of Massachusetts Pension Reserves Investment Trust (PRIT) fund. The Trust’s Board of Trustees may vote to approve a different investment vehicle, at its discretion. The following was the PRIT fund’s asset allocation at June 30, 2019:
Target AllocationAsset Class (%)
Global Equity 39%
Fixed Income 23
Private Equity 13
Real Estate 10
Other 15
Total 100 %
Concentrations. No investment in any one organization represented 5% or more of the Trust’s investments.
Rate of return. For the year ended June 30, 2019 and 2018, the annual money-weighted rate of return on investments, net of investment expense was 5.80% and 8.58%, respectively. The money-weighted rate of return expresses investment performance, net of investment expense, adjusted for changing amounts actually invested.

58
MASSACHUSETTS WATER RESOURCES AUTHORITY
Notes to Financial Statements
June 30, 2019 and 2018
(Dollars in thousands)
46
(f) Changes in the Net OPEB Liability
Total OPEB Plan Fiduciary Net OPEBLiability Net Position Liability
(a) (b) (a) - (b)Balances at June 30, 2017 154,254$ 22,782$ 131,472$
Changes for the year:Service cost 2,820 - 2,820Interest 10,821 - 10,821Differences between expected and actual experience (11,860) - (11,860)Contributions - employer - 10,093 (10,093)Net investment income - 1,956 (1,956)Benefit payments (5,057) (5,057) -
Net changes (3,276) 6,992 (10,268)
Balances at June 30, 2018 150,978 29,774 121,204
Changes for the year:Service cost 4,463 - 4,463Interest 10,705 - 10,705Differences between expected and actual experience - - -Contributions - employer - 10,656 (10,656)Net investment income - 1,724 (1,724)Benefit payments (5,082) (5,082) -
Net changes 10,086 7,298 2,788
Balances at June 30, 2019 161,064$ 37,072$ 123,992$
Increase (Decrease)
Actuarial assumptions. The total OPEB liability was determined by an actuarial valuation as of December 31, 2017, and update procedures were used to roll forward the total OPEB liability to June 30, 2019 and 2018. The following actuarial assumptions, applied to all periods included in the measurement, unless otherwise specified:
Inflation 3.0%
Salary increases 5.75%, decreasing over 9 years to an ultimate of 4.0%
Investment rate of return 7.0%, net of OPEB plan investment expense, including inflation
Healthcare cost trend rates 8.0% for 2018, decreasing 0.5% per year to an ultimate rate of 5.0%

59
MASSACHUSETTS WATER RESOURCES AUTHORITY
Notes to Financial Statements
June 30, 2019 and 2018
(Dollars in thousands)
47
Mortality rates were based on the RP-2014 Blue Collar Mortality Table for Employees projected using generational mortality and scale MP-2017 for active employees, the RP-2014 Blue Collar Mortality Tables for Healthy Annuitants projected using generational mortality and scale MP-2017 for retirees and the RP-2014 Blue Collar Mortality Tables for Healthy Annuitants projected using generational mortality and scale MP-2017 set forward one year for the disabled.
The long-term expected rate of return on OPEB plan investments was determined using a building-block method in which best-estimate ranges of expected future real rates of return (expected returns, net of investment expense and inflation) are developed for each major asset class. These ranges are combined to produce the long-term expected rate of return by weighting the expected future real rates of return by the target asset allocation percentage and by adding expected inflation. Best estimates of arithmetic real rates of return for each major asset class included in the target asset allocation as of June 30, 2019 and 2018 (see discussion of the Trust’s investment policy) are summarized in the following table:
Asset Class June 30, 2019 June 30, 2018
Global Equity 6.16 - 9.47% 6.15 - 9.41%
Fixed Income 1.89 - 4.00 1.68 - 4.13
Private Equity 10.00 10.28
Real Estate 4.58 4.90
Other 3.68 - 4.77 3.94 - 4.71
Long-Term Expected Rate of Return (%)
Discount rate. The discount rate used to measure the total OPEB liability was 7.0% for both June 30, 2019 and 2018. The projection of cash flows used to determine the discount rate assumed that Authority contributions will be made at rates equal to the actuarially determined contribution rates. Based on those assumptions, the OPEB plan’s fiduciary net position was projected to be available to make all projected future benefit payments of current plan members. Therefore, thelong-term expected rate of return on OPEB plan investments was applied to all periods of projected benefit payments to determine the total OPEB liability. The discount rate used in the prior actuarial valuation was 7.0%.
Sensitivity of the net OPEB liability to changes in the discount rate. The following presents the net OPEB liability of the Authority, as well as what the Authority’s net OPEB liability would be if it were calculated using a discount rate that is 1-percentage-point lower (6.0%) or 1-percentage-point higher (8.0%) than the current discount rate:
1% Decrease Discount Rate 1% Increase(6.0%) (7.0%) (8.0%)
Net OPEB Liability as of June 30, 2019 146,464$ 123,992$ 105,452$

60
MASSACHUSETTS WATER RESOURCES AUTHORITY
Notes to Financial Statements
June 30, 2019 and 2018
(Dollars in thousands)
48
1% Decrease Discount Rate 1% Increase(6.0%) (7.0%) (8.0%)
Net OPEB Liability as of June 30, 2018 142,517$ 121,204$ 103,608$
Sensitivity of the net OPEB liability to changes in the healthcare cost trend rates. The following presents the net OPEB liability of the Authority, as well as what the Authority’s net OPEB liability would be if it were calculated using healthcare cost trend rates that are 1-percentage-point lower (7.0%) or 1-percentage-point higher (9.0%) than the current healthcare cost trend rates:
1% Decrease Base Rate 1% Increase(7.0% - 4.0%) (8.0% - 5.0%) (9.0% - 6.0%)
Net OPEB Liability as of June 30, 2019 99,237$ 123,992$ 152,589$
1% Decrease Base Rate 1% Increase(7.0% - 4.0%) (8.0% - 5.0%) (9.0% - 6.0%)
Net OPEB Liability as of June 30, 2018 98,898$ 121,204$ 146,968$
(g) OPEB Expense and Deferred Outflows of Resources and Deferred Inflows of Resources Related to OPEBFor the years ended June 30, 2019 and 2018, the Authority recognized OPEB expense of $10,987 and $9,856, respectively, and reported deferred outflows of resources and deferred inflows of resources related to OPEB from the following sources:
Deferred Outflow Deferred Inflow Deferred Outflow Deferred Inflow of Resources of Resources of Resources of Resources
Differences between expected and actual experience -$ 7,907$ -$ 9,884$
Net difference between projected and actual earnings on OPEB Trust investments 333 - - 148
Total 333$ 7,907$ -$ 10,032$
June 30, 2019 June 30, 2018
Amounts reported as deferred outflows of resources and deferred inflows of resources related to OPEB will be recognized in OPEB expense as follows:
Year Ending June 30: Amount2020 (1,903)$2021 (1,903)2022 (1,903)2023 (1,865)
Total (7,574)$

61
MASSACHUSETTS WATER RESOURCES AUTHORITY
Notes to Financial Statements
June 30, 2019 and 2018
(Dollars in thousands)
49
(12) Commitments and Contingencies
(a) GeneralThe Authority’s capital improvement program continues to proceed. As part of this program, the Authority has entered into a number of contracts for the design and construction of infrastructure and improvements to its facilities. Commitments under these contracts aggregated approximately $898,950 at June 30, 2019.
The Authority’s operating and construction plans are designed to comply with the Federal District Court’s schedule of actions. The Authority has incurred capital expenditures of approximately $8,500,000 from fiscal years 1986 through 2019, including those projects required to comply with the Federal District Court’s schedule. The Authority anticipates spending an additional $2,316,915 on these projects through fiscal year 2023. These capital expenditures have been forecasted based upon certain preliminary assumptions and estimates, which may change significantly as design and construction of the necessary facilities proceed. Funding is expected to come from various federal and state grants, as available and approved, and from the Authority’s debt proceeds. To date, federal appropriations for the Boston Harbor Project have aggregated $810,000.
(b) Boston Harbor CaseThe Authority continues to be a defendant, along with Boston Water and Sewer Commission (BWSC) and the Commonwealth, in the federal Boston Harbor Case. The federal action was originally brought in 1985 by the United States on behalf of the United States Environmental Protection Agency (EPA) and by certain citizens’ groups for Clean Water Act violations. As part of the Boston Harbor Case, the Authority was required to undertake certain corrective actions to meet wastewater treatment, discharge and combined sewer overflow (CSO) requirements, including the completion of new and improved primary and secondary treatment facilities at Deer Island. Beyond these major improvements to its wastewater treatment capabilities, the Authority also was required to improve water quality in the Alewife Brook and Charles and Mystic Rivers by its adoption of a Long Term CSO Control Plan which was comprised of 35 projects, the last three of which were completed on time by the close of calendar year 2015. In March 2016 the federal district court formally received the Authority’s 2015 annual CSO project report, officially noting completion of all Plan projects.
In March 2006, the Authority reached agreement with the United States and the Massachusetts Department of Environmental Protection (DEP) on the scope and schedule for the remaining CSO projects which was filed with the Court as part of a joint motion to amend the Court Schedule. In April 2006, the Court allowed the joint motion and issued an Order with a schedule. Under the Order, the Authority had a three-year performance assessment period, from 2018 through 2020, to conduct analyses which will compare project benefits of the CSO program against actual performance results and to report those findings to the district court. The Court has further extended the assessment period through 2021.

62
MASSACHUSETTS WATER RESOURCES AUTHORITY
Notes to Financial Statements
June 30, 2019 and 2018
(Dollars in thousands)
50
As part of the agreement, DEP agreed to reissue and EPA agreed to approve five (5) consecutive variances of no more than three years duration each, through the year 2020, for the Charles River and Alewife Brook/Upper Mystic River that are consistent with and limited to the requirements in the Authority’s revised Long Term CSO Control Plan. Variances have most recently been issued by DEP in or about August 2019. The variances will respectively remain in place for the Charles River until August 31, 2024 and for the Alewife/Upper Mystic until August 31, 2024. In addition, the United States and the Authority agreed to withdraw the February 27, 1987 Stipulation of the United States and the Massachusetts Water Resources Authority on Responsibility and Legal Liability for Combined Sewer Overflows and replace it with a Second Stipulation that requires the Authority to implement the CSO requirements set forth in the Court Schedule and to meet the levels of control described in the Authority’s long term CSO Control Plan. Once these performance parameters have been reached, the Second Stipulation makes the Authority responsible for only those CSO outfalls which it owns and operates.
There has been no imposition of penalties by the Court against MWRA on the merits of the claims originally asserted in the Boston Harbor Case to date. The Court always retains the right to order remedial action and to assess penalties.
(c) Deer Island Submarine Power CableIn 2004, the United States Army Corps of Engineers (Corps) notified Boston Edison Co. (NStar), its subsidiary Harbor Energy Electric Company (HEEC), and the Authority of allegations that each, as permittees, were in violation of certain depth requirements contained in a permit (MA BOSS 198900530, dated August 31, 1989) which authorized the installation of a submarine electric power cable running under the channel bed of Boston Harbor extending from South Boston to Deer Island, used to provide electric power for Deer Island operations. The Corps alleges that the power cable, in places, has been installed at depths less than those required by the permit and would eventually interfere with a project of harbor dredging known as the Boston Harbor Deep Draft Navigation Improvement Project (the “Project”) which will allow deep-draft cargo vessels to dock in Boston Harbor.
MWRA’s position is that it is not the owner of the cable, that it was not involved in the planning, design, location or installation of the cable, that it had no meaningful knowledge, participation in or control over the misplacement of the cable and therefore should have no legal responsibility to move it or relocate it. MWRA has also maintained that its status as a “permittee” in the Corps’ permit differs substantially from that of NSTAR and HEEC as the former merely lent its name to an application for the permit solely because it would allow permit review by the Corps to be expedited. The cable is vitally important to MWRA as it provides the primary means by which electricity is delivered to Deer Island to power its wastewater operations.
Settlement Efforts
Efforts to resolve the dispute concerning compliance with the permit and responsibility for the cable protection costs date back to approximately 2005. Discussions during these prior years among the interested parties over the years produced only a proposed method intended by NSTAR and HEEC for protection of the cable from the Project which would have entailed carefully exposing the cable, placing concrete mats over it followed by backfilling of sediments over both the cable and mats without either moving it or burying the cable deeper in the channel. The Authority has consistently advised NSTAR and HEEC that it has and will accept no financial responsibility whatsoever for the costs of either protecting or relocating the cable.

63
MASSACHUSETTS WATER RESOURCES AUTHORITY
Notes to Financial Statements
June 30, 2019 and 2018
(Dollars in thousands)
51
Litigation and Conditional Settlement
United States of America v. NSTAR Electric Company d/b/a Eversource Energy, Harbor Electric Energy Co., and Massachusetts Water Resources Authority, U.S. District Court, District of Massachusetts, C.A. No. 16-11470-RGS As a result of the need to achieve even deeper dredging depths than the Army Corps had initially recommended in 2016 and the likelihood that those depths might not be practicably reachable especially in light of the addition of the proposal to add protective concrete mats, the United States, acting on behalf of the Corps, commenced a lawsuit in July 2016 in the federal district court in Boston against MWRA, NSTAR and HEEC under the Rivers and Harbors Act and under the Clean Water Act asking the federal district court to determine the permittees’ non-compliance with the 1990 permit and to assess penalties for the obstruction caused by the mis-located cable in two shipping channels of Boston Harbor. In that lawsuit, the Corps also asked that MWRA, NSTAR and HEEC, each named as permittees under the permit, be enjoined from further maintaining the cable in its present location. MWRA filed its Answer to the Complaint, including cross claims against co-defendants NSTAR and HEEC, in August 2016. Following a failed motion to dismiss both the Complaint and MWRA’s cross-claims, NSTAR and HEEC eventually filed their Answer to the Complaint and cross-claimed against MWRA upon a theory of indemnification that MWRA had the primary obligation as the sole customer of the cable to pay any and all expenses necessary to correct the location of the cable improperly installed by HEEC.
Resolution of the federal court litigation was conditionally accomplished over the period of May through July 2017 when it became imperative that the Corps be able to determine whether it would be able to save the federal appropriation dollars for the Project without the aid of or reliance upon the federal court’s enforcement powers. The first component of this recent resolution was the negotiation and execution of an agreement among MWRA, NSTAR and HEEC of an agreement whereby HEEC will provide MWRA with a new 115 kV power cable over a different cross-harbor route by December 31, 2019.
The agreement stipulates that the Authority will pay 50% of the cost of the cable, total estimated at $114,000 less a credit of $17,500, at the in-service date of the new cable or earlier if the parties mutually agree to such advance payment. The remainder of the total cost of the cable will be paid by the Authority to HEEC in accordance with the provisions for electric service set forth in the tariff established by the Massachusetts Department of Public Utilities. The credit of $17,500 will be provided by HEEC to the Authority if the cable is placed in service by December 31, 2019. The credit will be applied at a rate of $2,500 over a period of seven years, commencing in 2020. In Fiscal Year 2019 the Authority, upon agreement by HEEC, prepaid $35,000 its estimated share of the cost of the cable.
The agreement is for a term of thirty years, at least the useful life of the cable. Annual tariff cost of the cable is estimated between $4,500 and $7,300 in the next ten years. In addition to the tariff cost, operating and maintenance costs will also be charged.
In August 2019 the cable was placed in service.

64
MASSACHUSETTS WATER RESOURCES AUTHORITY
Notes to Financial Statements
June 30, 2019 and 2018
(Dollars in thousands)
52
The second component of the conditional resolution of the federal court lawsuit involves the entry of a Stipulation and Order in the federal lawsuit by the parties and the Court in July 2017 which, inter alia, compels NSTAR and HEEC, but not MWRA, to be responsible for all costs and efforts toward the design and installation, by the end of calendar year 2019 inclusive of all permitting, of the new 115 kV power cable along a new route to serve MWRA’s power distribution needs at its Deer Island facility. NSTAR and HEEC, but not MWRA, have further agreed to de-energize and decommission the existing non-compliant power cable by February 2020 and remove from the harbor channels portions of the old cable by May 2020. The Order includes the potential assessment of stipulated penalties and/or actual delay damages against NSTAR and HEEC, but not MWRA, for failure without good cause to meet those milestones, the completion of which are necessary to allow the harbor and shipping channel-deepening Project to move forward. MWRA will not be a permittee with respect to the new Corps permit and satisfaction of HEEC and NSTAR’s obligations regarding the installation of the new cable will preclude the Corps from any further enforcement of its 1990 permit against MWRA. All claims of all parties to the federal court lawsuit have been stayed pending satisfaction of the obligations of HEEC and NSTAR under the Stipulation and Order. Completion of all obligations under the Stipulation and Order will result in the eventual dismissal with prejudice of all such claims.
(d) MiscellaneousThe Authority is also a defendant in several legal actions and administrative proceedings arising out of its operation, maintenance, and improvement of the water and sewer systems under its care. It is the opinion of management that any judgments or settlements that may result from these actions will not have a materially adverse effect upon the Authority.
(13) Risk Management
The Authority is exposed to various risks of loss. The risk management program involves insurance and self insurance related to property, general liability (including automobile, marine and employers’ liability), excess liability, public officials’ liability, workers’ compensation, unemployment liability, and employee health care and life insurance.
Buildings, plants, and equipment are fully insured on an all risk replacement basis to the extent that losses exceed $2,500 per occurrence, up to a limit of $300,000. The Authority maintains insurance coverage for general liability, automobile liability, marine liability, and employers’ liability to the extent that losses exceed $2,500 per occurrence, up to a limit of $25,000. In addition to the primary liability insurance, the Authority maintains excess liability policies with additional limits of $75,000. The Authority also maintains public officials’ liability insurance with a limit of $5,000 per occurrence with a $1,000 deductible. All insurance policies are renewed on an annual basis. The amount of claim settlements has not exceeded insurance coverage in any of the previous three fiscal years.

65
MA
SSA
CH
USE
TT
S W
AT
ER
RE
SOU
RC
ES
AU
TH
OR
ITY
Sche
dule
s of E
mpl
oyer
Con
tribu
tions
–La
st T
en Y
ears
Req
uire
d Su
pple
men
tary
Info
rmat
ion–
GA
SB N
o. 6
8
(Una
udite
d)
(Dol
lars
in T
hous
ands
)
53
2019
2018
2017
2016
2015
2014
2013
2012
2011
2010
Act
uaria
lly D
eter
min
ed C
ontri
butio
n7,
000
$3,
277
$3,
133
$8,
159
$7,
808
$5,
919
$5,
766
$5,
512
$5,
343
$5,
621
$C
ontri
butio
ns in
Rel
atio
n to
the
Act
uaria
lly
Det
erm
ined
Con
tribu
tion
7,00
03,
277
4,63
38,
159
12,6
3012
,447
10,4
907,
363
5,34
35,
621
Con
tribu
tion
Def
icie
ncy
(Exc
ess)
-$
-$
(1,5
00)
$-
$(4
,822
)$
(6,5
28)
$(4
,724
)$
(1,8
51)
$-
$-
$
Cov
ered
Pay
roll
95,8
19$
92,9
75$
89,7
55$
89,1
69$
88,6
46$
84,8
29$
84,8
29$
82,8
70$
82,8
70$
81,9
62$
Con
tribu
tions
as a
Per
cent
age
of C
over
ed P
ayro
ll7.
31%
3.52
%5.
16%
9.15
%14
.25%
14.6
7%12
.37%
8.89
%6.
45%
6.86
%
Not
es to
Req
uire
d Su
pple
men
tary
Info
rmat
ion
Val
uatio
n D
ate
Act
uaria
l det
erm
ined
con
tribu
tions
for f
isca
l 201
8 ar
e de
term
ined
with
the
Janu
ary
1, 2
018
actu
aria
l val
uatio
n.A
ctua
rial C
ost M
etho
dEn
try a
ge n
orm
alA
mor
tizat
ion
Met
hod
Paym
ents
incr
ease
at 4
.5%
per
yea
rR
emai
ning
Am
ortiz
atio
n Pe
riod
8 ye
ars f
rom
July
1, 2
018
Ass
et V
alua
tion
Met
hod
Mar
ket v
alue
of a
sset
s as r
epor
ted
in th
e Pl
an’s
ann
ual s
tate
men
t les
s unr
ecog
nize
d re
turn
in e
ach
of th
e la
st fi
ve y
ears
. U
nrec
ogni
zed
retu
rn is
equ
al to
the
diffe
renc
e be
twee
n th
e ac
tual
mar
ket v
alue
retu
rn a
nd th
e ex
pect
ed m
arke
t val
ue
ret
urn
and
is re
cogn
ized
ove
r a fi
ve-y
ear p
erio
d, fu
rther
adj
uste
d, if
nec
essa
ry, t
o be
with
in 1
0% o
f the
mar
ket v
alue
.
Act
uaria
l Ass
umpt
ions
:In
vest
men
t Rat
e of
Ret
urn
7.50
%D
isco
unt R
ate
7.50
%In
flatio
n R
ate
3.00
%Pr
ojec
ted
Sala
ry In
crea
ses
Bas
ed o
n ye
ars o
f ser
vice
, ran
ging
from
5.7
5% a
t 0 y
ears
of s
ervi
ce d
ecre
asin
g to
4.0
0% a
fter 9
yea
rs o
f ser
vice
.C
ost o
f Liv
ing
Adj
ustm
ents
3% o
n fir
st $
13,0
00
Plan
Mem
bers
hip:
Ret
ired
Parti
cipa
nts a
nd B
enef
icia
ries
Rec
eivi
ng B
enef
its58
2In
activ
e Pa
rtici
pant
s Ent
itled
to a
Ret
urn
of t
heir
Empl
oyee
Con
tribu
tions
64In
activ
e Pa
rtici
pant
s with
a V
este
d R
ight
to
a D
efer
red
or Im
med
iate
Ben
efit
42A
ctiv
e Pa
rtici
pant
s1,
100
Tota
l1,
788
See
acco
mpa
nyin
g in
depe
nden
t aud
itors
' rep
ort
Fisc
al y
ear e
nded
June
, 30

66
MASSACHUSETTS WATER RESOURCES AUTHORITY
Schedules of Changes in the Employer’s Net Pension Liability and Related Ratios – Last Ten Years
Required Supplementary Information– GASB No. 68
(Unaudited)
(Dollars in Thousands)
54
2018 2017 2016 2015 2014Total Pension Liability:
Service cost 11,762$ 11,308$ 11,080$ 10,638$ 10,529$Interest 41,392 38,520 36,917 34,598 33,587Differences between expected and actual experience 3,250 (146) (9,143) - (8,380)Changes of assumptions 16,401 7,977 13,298 - 4,921Changes of benefit terms 5,027 - 2,050 - -Benefit payments, including refunds of employee contributions (21,428) (18,222) (16,129) (15,390) (12,963)
Net change in total pension liability 56,404 39,437 38,073 29,846 27,694Total pension liability - beginning 550,843 511,406 473,333 443,487 415,793
Total pension liability - ending 607,247$ 550,843$ 511,406$ 473,333$ 443,487$
Plan Fiduciary Net Position:Contributions - employer 7,000$ 3,277$ 4,633$ 8,159$ 12,630$Contributions - employee 9,484 9,091 8,757 8,402 8,245Net investment income (17,114) 70,517 24,183 (530) 20,484Benefit payments, including refunds of employee contributions (21,428) (18,222) (16,129) (15,390) (12,963)Administrative expenses (469) (447) (426) (412) (408)Other - military service fundcontribution - - - - 16
Net change in fiduciary net position (22,527) 64,216 21,018 229 28,004Plan fiduciary net position - beginning 529,818 465,602 444,584 444,355 416,351
Plan fiduciary net position - ending 507,291$ 529,818$ 465,602$ 444,584$ 444,355$
Net Pension Liability (Asset) - Ending 99,956$ 21,025$ 45,804$ 28,749$ (868)$Plan’s Fiduciary Net Position as a
Percentage of the Total Pension Liability 83.54% 96.18% 91.04% 93.93% 100.20% Covered Payroll 95,819$ 92,975$ 89,755$ 89,169$ 88,646$Net Pension Liability (Asset) as a Percentage of
Covered Payroll 104.32% 22.61% 51.03% 32.24% (0.98%)
This schedule is intended to present 10 years of data. Additional years will be presented when available.
See accompanying independent auditors' report.
Measurement DateDecember 31,

67
MASSACHUSETTS WATER RESOURCES AUTHORITY
Schedules of Changes in the Employer’s Net OPEB Liability and Related Ratios – Last Ten Years
Required Supplementary Information– GASB No. 75
(Unaudited)
(Dollars in Thousands)
55
2019 2018 2017Total OPEB Liability
Total OPEB Liability - Beginning 150,978$ 154,254$ 146,143$
Service Cost 4,463 2,820 2,705Interest 10,705 10,821 10,253Change of Benefit Terms - - -Differences between expected and actual experience - (11,860) -Change of assumptions - - -Benefit Payments (5,082) (5,057) (4,847)Net Change in total OPEB liability 10,086 (3,276) 8,111
Total OPEB Liability - Ending 161,064 150,978 154,254
Plan Fiduciary Net Position
Plan fiduciary net position - beginning 29,774 22,782 16,123
Contributions - employer (claims + additional funding) 10,656 10,093 9,723Contributions - employee - - -Net Investment Income 1,724 1,956 1,783Benefit Payments (5,082) (5,057) (4,847)Net Change in plan fiduciary net position 7,298 6,992 6,659
Plan fiduciary net position - ending 37,072 29,774 22,782
Net OPEB Liability 123,992$ 121,204$ 131,472$
Plan fiduciary net position as a percentage of the total OPEB liability 23.0% 19.7% 14.8%
Covered payroll 98,238$ 94,816$ 86,475$
MWRA's net OPEB liability as a percentage of covered payroll 126.2% 127.8% 152.0%
Data is being accumulated annually to present 10 years of the reported information.
See accompanying independent auditors' report

68
MA
SSAC
HU
SET
TS W
AT
ER
RE
SOU
RC
ES A
UT
HO
RIT
Y
Schedule of Employer C
ontributions -Last Ten Years
Required Supplem
entary Information–
GA
SB N
o. 75
(Unaudited)
(Dollars in Thousands)
56
20192018
20172016
20152014
20132012
20112010
Actuarially determ
ined contribution$
11,812$
11,400$
10,948$
14,996$
14,564$
15,621$
14,482$
19,151$
17,433$
18,896
Contributions in relation to the actuarially
determined contribution
10,65610,093
9,7239,804
14,8523,493
2,8133,986
3,2932,151
Contribution deficiency (excess)
$1,156
$1,307
$1,225
$5,192
$(288)
$12,128
$11,669
$15,165
$14,140
$16,745
Covered Payroll
$98,238
$94,816
$86,475
Contributions as a Percentage of
Covered Payroll
10.8%10.6%
11.2%
Notes to Schedule
Methods and assum
ptions used to determine contributions rates:
Actuarial cost m
ethodEntry A
ge Norm
alA
mortization m
ethod30 years (closed)
Asset valuation m
ethodM
arket value of assetsInflation
3%H
ealthcare cost trend rates8%
for 2018, decreasing 0.5% per year for 6 years to an ultim
ate rate of 5%D
iscount rate7%
Mortality
See accompanying independent auditors' report
Fiscal year ended June 30,
Actives: RP-2014 B
lue Collar m
ortality table for employees projected using
generational mortality and scale M
P-2017
Retirees: RP-2014 B
lue Collar m
ortality tables for healthy annuitants projected using generational m
ortality and scale MP-2017
Disabled: R
P-2014 Blue C
ollar mortality tables for healthy annuitants
projected using generational mortality and scale M
P-2017. Set forward
one year.

69
MASSACHUSETTS WATER RESOURCES AUTHORITY
Accounts Established by the General Revenue Bond Resolution
June 30, 2019(comparative totals for June 30, 2018)
(Dollars in thousands)
57
Construction Debt Service OperatingRate
Stabilization RevenueCombined Reserves Total
Balance – June 30, 2018 105,802$ 477,698$ 40,070$ 43,044$ 29,952$ 20,747$ 717,313$Proceeds from:
Revenue Bonds and Loans 254,505 1,629 - - - - 256,134Cash Received from Customers - - - - 755,104 - 755,104Interest Income 2,217 14,880 - - (9,266) 17,438 25,269Debt Service Grant - 1,835 - - - - 1,835Grant Receipts 273 4,976 - - - - 5,249Construction Payments (148,192) - - - - - (148,192)Capital Lease Payments (1,130) (2,086) - - - - (3,216)Debt Service Payment (866) (430,883) - - (37,872) - (469,621)Other Commonwealth Payments - - - - (23,442) - (23,442)Interfund Transfers 11,180 431,025 1,882 - (430,942) (13,145) -Transfers from (to) Operating Account (34,496) 2,292 - - (253,408) (1,882) (287,494)
Balance – June 30, 2019 189,293$ 501,366$ 41,952$ 43,044$ 30,126$ 23,158$ 828,939$
Sewer Water 2019 2018Restricted Investments:
Construction 119,196$ 70,097$ 189,293$ 105,802$Debt Service - Debt Service Reserves 95,010 61,677 156,687 149,933Debt Service - Debt Service P & I 222,460 96,085 318,545 302,690Debt Service - Revenue Redemption 5,790 20,344 26,134 25,075Operating Reserve 27,879 14,073 41,952 40,070Rate Stabilization Reserve 25,547 17,497 43,044 43,044Revenue 18,171 11,955 30,126 29,952Combined - Renewal and Replacement Reserve 6,950 2,208 9,158 6,747Combined - Insurance Reserve 7,000 7,000 14,000 14,000
Total Restricted Investments 528,003$ 300,936$ 828,939$ 717,313$
See accompanying independent auditors' report.
Total

70
MASSACHUSETTS WATER RESOURCES AUTHORITY
Combining Statement of Net Position
June 30, 2019
(Dollars in thousands)
58
CombinedAssets Sewer Water Total
Unrestricted current assets:Cash and cash equivalents 38,806$ 16,004$ 54,810$Investments 1,747 9,914 11,661Intergovernmental loans 6,591 26,141 32,732Accounts receivable 333 735 1,068
Total unrestricted current assets 47,477 52,794 100,271
Restricted assets:Investments 533,346 303,002 836,348Interest receivable 1,319 183 1,502
Total restricted assets 534,665 303,185 837,850
Capital assets:Capital assets – not being depreciated 86,432 93,247 179,679Capital assets – being depreciated – net 3,367,256 2,293,481 5,660,737
Total capital assets 3,453,688 2,386,728 5,840,416
Regulatory assets 337,404 32,626 370,030Other assets, net 112,477 169,262 281,739
Total assets 4,485,711 2,944,595 7,430,306
Deferred Outflows of ResourcesDeferred outflows from pension 41,775 22,266 64,041Deferred outflows from OPEB 215 118 333Deferred outflows from derivative instruments 28,590 3,050 31,640Deferred outflows from refunding debt 15,716 13,126 28,842
LiabilitiesCurrent liabilities:
Accounts payable and accrued expenses 47,852 2,179 50,031Commercial paper notes 21,000 54,000 75,000Current portion of long-term debt 171,822 66,096 237,918
Total current liabilities 240,674 122,275 362,949
Payable from restricted assets:Accounts payable for construction 9,626 5,962 15,588Accrued interest on bonds payable 51,757 28,747 80,504Reserves 36,870 23,086 59,956
Total payable from restricted assets 98,253 57,795 156,048
Retainage on construction in progress 4,804 3,114 7,918Long-term debt – less current portion 3,207,325 1,932,491 5,139,816Long-term capital lease 18,289 7,804 26,093Net pension liability 64,200 35,756 99,956Other postemployment benefits 79,862 44,130 123,992Liability for derivative instruments 28,590 3,050 31,640
Total liabilities 3,741,997 2,206,415 5,948,412
Deferred Inflows of ResourcesDeferred inflows from pension 3,945 2,121 6,066Deferred inflows from OPEB 5,089 2,818 7,907Deferred inflows from regulated activities 9,276 17,414 26,690
Net PositionNet investment in capital assets 348,359 478,691 827,050Restricted Construction 119,196 70,097 189,293 Debt Service 71,572 26,679 98,251 Operating 34,538 16,324 50,862 Revenue 18,171 11,955 30,126Unrestricted 219,864 150,641 370,505
Total net position 811,700$ 754,387$ 1,566,087$
Commitments and contingencies
See accompanying independent auditors' report

71
MASSACHUSETTS WATER RESOURCES AUTHORITY
Combining Statement of Net Position
June 30, 2018
(Dollars in thousands)
59
CombinedAssets Sewer Water Total
Unrestricted current assets:Cash and cash equivalents 35,778$ 16,836$ 52,614$Investments 1,687 9,565 11,252Intergovernmental loans 6,641 24,613 31,254Accounts receivable 130 713 843
Total unrestricted current assets 44,236 51,727 95,963
Restricted assets:Investments 463,896 260,532 724,428Interest receivable 1,480 251 1,731Grant receivable 856 89 945
Total restricted assets 466,232 260,872 727,104
Capital assets:Capital assets – not being depreciated 82,632 127,771 210,403Capital assets – being depreciated – net 3,469,413 2,268,534 5,737,947
Total capital assets 3,552,045 2,396,305 5,948,350
Regulatory assets 431,941 73,974 505,915Other assets, net 50,624 159,839 210,463
Total assets 4,545,078 2,942,717 7,487,795
Deferred Outflows of ResourcesDeferred outflows from pension 11,497 5,657 17,154Deferred outflows from derivative instruments 18,963 2,025 20,988Deferred outflows from refunding debt 26,872 20,725 47,597
LiabilitiesCurrent liabilities:
Accounts payable and accrued expenses 46,917 2,548 49,465Commercial paper notes 21,000 54,000 75,000Current portion of long-term debt 158,644 67,273 225,917
Total current liabilities 226,561 123,821 350,382
Payable from restricted assets:Accounts payable for construction 15,214 4,442 19,656Accrued interest on bonds payable 51,467 28,524 79,991Reserves 35,722 22,352 58,074
Total payable from restricted assets 102,403 55,318 157,721
Retainage on construction in progress 3,759 5,808 9,567Long-term debt – less current portion 3,269,376 1,922,940 5,192,316Long-term capital lease 18,965 8,254 27,219Net pension liability 13,229 7,796 21,025Other postemployment benefits 78,062 43,142 121,204Liability for derivative instruments 18,963 2,025 20,988
Total liabilities 3,731,318 2,169,104 5,900,422
Deferred Inflows of ResourcesDeferred inflows from pension 9,691 5,272 14,963Deferred inflows from OPEB 6,461 3,571 10,032Deferred inflows from regulated activities 19,606 23,112 42,718
Net PositionNet investment in capital assets 275,012 484,745 759,757Restricted Construction 66,596 39,206 105,802 Debt Service 126,522 46,576 173,098 Operating 33,312 15,603 48,915 Revenue 20,838 9,114 29,952Unrestricted 313,055 174,820 487,875
Total net position 835,335$ 770,064$ 1,605,399$
Commitments and contingencies
See accompanying independent auditors' report

72
MASSACHUSETTS WATER RESOURCES AUTHORITY
Combining Statement of Revenues, Expenses, and Changes in Net Position
Year Ended June 30, 2019
(Dollars in thousands)
60
CombinedSewer Water Total
Operating revenues :Customer services 491,785$ 258,957$ 750,742$Other 3,087 1,507 4,594
Total operating revenues 494,872 260,464 755,336
Operating Expenses:Operations 66,731 47,147 113,878Maintenance 21,344 9,307 30,651Payments in lieu of taxes - 8,230 8,230Engineering, general, and administrative 94,703 57,648 152,351
Total operating expenses 182,778 122,332 305,110
Income from operating before depreciation 312,094 138,132 450,226
Depreciation and amortization 147,206 59,921 207,127
Operating Income 164,888 78,211 243,099
Regulatory accounting provisions:Change in reserves (1,148) (734) (1,882)Change in regulatory provisions, net (84,207) (35,650) (119,857)
Total regulatory accounting provisions (85,355) (36,384) (121,739)
Nonoperating revenues (expenses):Debt service grant 793 97 890Investment income 16,457 10,753 27,210Interest expense (126,142) (70,819) (196,961)Changes in derivative related accounts 2,528 412 2,940
Total nonoperating expenses (106,364) (59,557) (165,921)
Net loss before capital grants and contributions (26,831) (17,730) (44,561)
Capital grants and contributions 3,196 2,053 5,249
Decrease in net position (23,635) (15,677) (39,312)
Total net position - beginning of year 835,335 770,064 1,605,399
Total net position - end of year 811,700$ 754,387$ 1,566,087$
See accompanying independent auditors' report

73
MASSACHUSETTS WATER RESOURCES AUTHORITY
Combining Statement of Revenues, Expenses, and Changes in Net Position
Year Ended June 30, 2018
(Dollars in thousands)
61
CombinedSewer Water Total
Operating revenues :Customer services 477,379$ 250,902$ 728,281$Other 7,989 2,034 10,023
Total operating revenues 485,368 252,936 738,304
Operating Expenses:Operations 62,402 44,541 106,943Maintenance 20,007 9,060 29,067Payments in lieu of taxes - 8,220 8,220Engineering, general, and administrative 82,250 51,377 133,627
Total operating expenses 164,659 113,198 277,857
Income from operating before depreciation 320,709 139,738 460,447
Depreciation and amortization 144,454 58,345 202,799
Operating Income 176,255 81,393 257,648
Regulatory accounting provisions:Change in reserves (557) (264) (821)Change in regulatory provisions, net (77,286) (28,670) (105,956)
Total regulatory accounting provisions (77,843) (28,934) (106,777)
Nonoperating revenues (expenses):Debt service grant 856 89 945Investment income 2,911 1,084 3,995Interest expense (131,526) (71,741) (203,267)Changes in derivative related accounts 2,528 412 2,940
Total nonoperating expenses (125,231) (70,156) (195,387)
Net loss before capital grants and contributions (26,819) (17,697) (44,516)
Capital grants and contributions 2,545 2,170 4,715
Decrease in net position (24,274) (15,527) (39,801)
Total net position - beginning of year 866,276 800,021 1,666,297
Restatement to comply with GASB Statement No. 75 (6,667) (14,430) (21,097)
Total net position - end of year 835,335$ 770,064$ 1,605,399$
See accompanying independent auditors' report

74
Charlestown Wind Turbine

75
Statistical Section
This part of the Massachusetts Water Resources Authority’s Fiscal Year 2019 Comprehensive Annual Financial Report presents detailed information to provide context to the information in the financial statements, note disclosures, required supplementary information and supplemental schedules.
CONTENTS
Financial Trends (76–79)These schedules contain trend information to help the reader understand how MWRA’s financial performance and well-being have changed over time.
Revenue Capacity (80–83)These schedules contain information to help the reader assess MWRA’s primary revenue source and community assessments.
Debt Capacity (84–87)These schedules present information to help the reader assess the affordability of the MWRA’s current level of outstanding debt and MWRA’s ability to issue additional debt in the future.
Demographic and Economic Information (88–93)These schedules offer demographic and economic indicators to help the reader understand the environment within which MWRA’s financial activities take place.
Operating Information (94–96)These schedules contain service and infrastructure data to help the reader understand how the information in MWRA’s financial report relates to the services the MWRA’s provides and the activities it performs.
Chelsea Creek Headworks

76
2017 2016 2015 2014 2013 2012 2011 20102019
Net investment in capital assets $ 729,903 679,739 632,029 608,232 588,872 705,721 835,638 936,746 827,050 Restricted
ConstructionDebt ServiceOperatingRevenue
Unrestricted 597,321 678,004 749,750 837,790 860,287 796,751 774,678 737,187 370,505 Total net position $
$
$
$
$
$
$
$
$
$
$
$
$
$
$
$
$
$
$ 1,666,297 1,704,109 1,711,593 1,756,415 1,795,167 1,833,247 1,874,933 1,917,474 1,566,087
Source: FY2010–2019 financial statements, reclassified to conform to 2019 presentation
2018
759,757
117,813 119,743 72,375 80,109 129,783 240,904 164,456 135,921 189,293 105,802 140,344 161,723 171,305 145,160 135,678 11,217 24,555 30,990 98,251 173,098
47,544 47,167 48,029 47,508 48,366 46,456 47,369 45,198 50,862 48,915 33,372 17,733 38,105 37,616 32,181 32,198 28,237 31,432 30,126 29,952
487,875 1,605,399
MASSACHUSETTS WATER RESOURCES AUTHORITY
Components of Net PositionLast Ten Fiscal Years
(Dollars in thousands)
MASSACHUSETTS WATER RESOURCES AUTHORITYComponents of Net Position
Last Ten Fiscal Years(Dollars in thousands)

77
2017 2016 2015 2014 2013 2012 2011 20102019
Net investment in capital assets $ 729,903 679,739 632,029 608,232 588,872 705,721 835,638 936,746 827,050 Restricted
ConstructionDebt ServiceOperatingRevenue
Unrestricted 597,321 678,004 749,750 837,790 860,287 796,751 774,678 737,187 370,505 Total net position $
$
$
$
$
$
$
$
$
$
$
$
$
$
$
$
$
$
$ 1,666,297 1,704,109 1,711,593 1,756,415 1,795,167 1,833,247 1,874,933 1,917,474 1,566,087
Source: FY2010–2019 financial statements, reclassified to conform to 2019 presentation
2018
759,757
117,813 119,743 72,375 80,109 129,783 240,904 164,456 135,921 189,293 105,802 140,344 161,723 171,305 145,160 135,678 11,217 24,555 30,990 98,251 173,098
47,544 47,167 48,029 47,508 48,366 46,456 47,369 45,198 50,862 48,915 33,372 17,733 38,105 37,616 32,181 32,198 28,237 31,432 30,126 29,952
487,875 1,605,399
MASSACHUSETTS WATER RESOURCES AUTHORITY
Components of Net PositionLast Ten Fiscal Years
(Dollars in thousands)

78
2017 2016 2015 2014 2013 2012 2011 20102019Operating revenues:
Customer service 705,933$ 683,501$ 661,305$ 639,691$ 617,415$ 599,372$ 579,240$ 571,360$ 750,742$ Other 10,843 13,472 7,299 8,326 5,978 3,248 5,114 2,9384,594
Total operating revenues 716,776 696,973 668,604 648,017 623,393 602,620 584,354 574,298755,336
Operating expenses:Operations 106,844 98,972 102,322 100,778 101,425 99,802 93,756 96,923113,878Maintenance 30,799 30,978 28,323 29,453 26,956 26,776 27,964 25,56130,651Payments in lieu of taxes 8,191 8,129 7,966 7,872 7,640 7,311 7,000 6,7328,230Engineering, general, and administrative 140,435 133,959 124,792 135,401 131,329 127,621 126,127 131,551152,351
Total operating expenses 286,269 272,038 263,403 273,504 267,350 261,510 254,847 260,767305,110
Depreciation and amortization 201,481 197,128 194,000 193,062 190,852 191,124 180,734 189,798207,127Operating income 229,026 227,807 211,201 181,451 165,191 149,986 148,773 123,733243,099
Nonoperating items:Regulatory accounting provisions (62,714) (72,162) (41,634) (3,808) 23,917 57,229 74,139 67,995 (121,739) Net nonoperating expenses (214,288) (204,259) (217,218) (225,293) (239,616) (259,537) (263,761) (234,588) (168,861) Changes in derivative related accounts 2,940 2,940 2,940 2,940 5,798 2,940 (8,728) (21,453)
Total nonoperating items (274,062) (273,481) (255,912) (226,161) (209,901) (199,368) (198,350) (188,046) (287,660)
Change in net position (37,812) (7,484) (38,282) (38,752) (38,080) (41,686) (42,541) (56,102) (39,312)
Total net position – beginning of year 1,704,109 1,711,593 1,756,415 1,795,167 1,833,247 1,874,933 1,917,474 1,973,576 1,605,399 Restatement to comply with GASB* - - (6,540) - - - - - -
Total net position – end of year 1,666,297$ 1,704,109$ 1,711,593$ 1,756,415$ 1,795,167$ 1,833,247$ 1,874,933$ 1,917,474$ 1,566,087$
*2015 - GASB 68*2018 - GASB 75
2018
728,281$ 10,023
738,304
106,943 29,067
8,220 133,627 277,857
202,799 257,648
(106,777) (198,327)
2,9402,940 (302,164)
(39,801)
1,666,297 (21,097)
1,605,399$
MASSACHUSETTS WATER RESOURCES AUTHORITY
Changes in Net PositionLast Ten Fiscal Years
(Dollars in thousands)
Capital grants and contributions 7,224 38,190 6,429 5,958 6,630 7,696 7,036 8,211 5,249 4,715
MASSACHUSETTS WATER RESOURCES AUTHORITYChanges in Net Position
Last Ten Fiscal Years(Dollars in thousands)
79
2017 2016 2015 2014 2013 2012 2011 20102019Operating revenues:
Customer service 705,933$ 683,501$ 661,305$ 639,691$ 617,415$ 599,372$ 579,240$ 571,360$ 750,742$ Other 10,843 13,472 7,299 8,326 5,978 3,248 5,114 2,9384,594
Total operating revenues 716,776 696,973 668,604 648,017 623,393 602,620 584,354 574,298755,336
Operating expenses:Operations 106,844 98,972 102,322 100,778 101,425 99,802 93,756 96,923113,878Maintenance 30,799 30,978 28,323 29,453 26,956 26,776 27,964 25,56130,651Payments in lieu of taxes 8,191 8,129 7,966 7,872 7,640 7,311 7,000 6,7328,230Engineering, general, and administrative 140,435 133,959 124,792 135,401 131,329 127,621 126,127 131,551152,351
Total operating expenses 286,269 272,038 263,403 273,504 267,350 261,510 254,847 260,767305,110
Depreciation and amortization 201,481 197,128 194,000 193,062 190,852 191,124 180,734 189,798207,127Operating income 229,026 227,807 211,201 181,451 165,191 149,986 148,773 123,733243,099
Nonoperating items:Regulatory accounting provisions (62,714) (72,162) (41,634) (3,808) 23,917 57,229 74,139 67,995 (121,739) Net nonoperating expenses (214,288) (204,259) (217,218) (225,293) (239,616) (259,537) (263,761) (234,588) (168,861) Changes in derivative related accounts 2,940 2,940 2,940 2,940 5,798 2,940 (8,728) (21,453)
Total nonoperating items (274,062) (273,481) (255,912) (226,161) (209,901) (199,368) (198,350) (188,046) (287,660)
Change in net position (37,812) (7,484) (38,282) (38,752) (38,080) (41,686) (42,541) (56,102) (39,312)
Total net position – beginning of year 1,704,109 1,711,593 1,756,415 1,795,167 1,833,247 1,874,933 1,917,474 1,973,576 1,605,399 Restatement to comply with GASB* - - (6,540) - - - - - -
Total net position – end of year 1,666,297$ 1,704,109$ 1,711,593$ 1,756,415$ 1,795,167$ 1,833,247$ 1,874,933$ 1,917,474$ 1,566,087$
*2015 - GASB 68*2018 - GASB 75
2018
728,281$ 10,023
738,304
106,943 29,067
8,220 133,627 277,857
202,799 257,648
(106,777) (198,327)
2,9402,940 (302,164)
(39,801)
1,666,297 (21,097)
1,605,399$
MASSACHUSETTS WATER RESOURCES AUTHORITY
Changes in Net PositionLast Ten Fiscal Years
(Dollars in thousands)
Capital grants and contributions 7,224 38,190 6,429 5,958 6,630 7,696 7,036 8,211 5,249 4,715

80
MASSACHUSETTS WATER RESOURCES AUTHORITYHistorical Rate Revenue and Percentage Increases
Last Ten Fiscal Years(Dollars in millions)
2019201820172016201520142013201220112010
Water Sewer CombinedAmount
$249.8242.4234.3226.4210.2203.2196.0183.9180.2179.1
Amount
$489.2474.6 460.6446.1440.1425.5411.5405.8389.6382.3
Amount
$739.0717.0 694.9672.4650.3628.7607.5589.7659.8651.4
Increase
3.1%3.03.31.43.43.41.44.21.96.0
Increase
3.1%3.23.33.43.43.53.53.51.53.8
Increase
3.1%3.53.57.73.53.76.62.00.6
(0.6)
Note: Rate revenue is derived exclusively from member community assessments and does not include other charges and fees.

81
(This page intentionally left blank)

82
Revenues:Rates and Charges $ 726,073 $ 703,688 $ 681,223 $ 650,316 $ 628,721 $ 607,512 $ 589,700 $ 569,800 $ 561,431 $ 748,389 Investment Income 12,755 9,758 10,303 9,689 12,130 13,590 16,268 15,193 15,22316,985Transfer from Rate Stabilization Fund - - - - 3,500 - 1,092 5,030 7,312- Other Income 12,231 13,088 15,750 18,289 19,296 15,881 12,920 14,554 12,8666,947Total Revenues 751,059 726,534 707,276 678,294 663,647 636,983 619,980 604,577 596,832772,321
Operating Expenses 263,226 258,046 293,682 258,534 257,724 252,333 245,210 240,678 244,729277,104Capital Lease 3,217 3,217 3,217 3,217 3,217 3,217 3,217 3,217 3,2173,217Net Operating Revenues 484,616 465,271 410,377 416,543 402,706 381,433 371,553 360,682 348,886492,000
Debt Service on Bonds $ 279,790 $ 286,666 $ 274,212 $ 233,079 $ 228,652 $ 209,826 $ 208,332 $ 224,746 $ 199,368 $ 285,663 Other Debt Service 158,485 139,430 114,481 161,736 160,032 158,666 145,722 124,656 136,677169,017Debt Prepayment 10,900 10,995 - - - - - - - 7,100
35,441 $ 28,180 21,685 21,728 14,022 12,941 17,499 11,280 12,841 30,220
Fund Deposits:Reserve Funds 821$ $ $ $ $ $ $ $ $$ (168) (35) 483 169 1,398 195 (407) (653) 1,882 Construction Fund 14,683 $ 13,059 11,462 10,464 9,516 8,535 7,481 7,539 5,96716,740 Core Fund - $ - - 730 132 - - - - - Rate Stabilization 6,532$
$
$ $ $$
$
$ $$
$
$ $$
$
$ $$
$
$ $$
$
$ $$
$
$ $$
$
$ $$
$
$ $$ - - - - - - - - -
Amount Available After Operations and Debt Service
MASSACHUSETTS WATER RESOURCES AUTHORITY
Historical Revenues, Expenses and Fund DepositsLast Ten Fiscal Years
(in thousands of dollars)
2018 2017 2016 2015 2014 2013 2012 2011 20102019
MASSACHUSETTS WATER RESOURCES AUTHORITYHistorical Revenues, Expenses and Fund Deposits
Last Ten Fiscal Years(Dollars in thousands)
Note: Schedule prepared in accordance with MWRA General Bond Resolution.

83
Revenues:Rates and Charges $ 726,073 $ 703,688 $ 681,223 $ 650,316 $ 628,721 $ 607,512 $ 589,700 $ 569,800 $ 561,431 $ 748,389 Investment Income 12,755 9,758 10,303 9,689 12,130 13,590 16,268 15,193 15,22316,985Transfer from Rate Stabilization Fund - - - - 3,500 - 1,092 5,030 7,312- Other Income 12,231 13,088 15,750 18,289 19,296 15,881 12,920 14,554 12,8666,947Total Revenues 751,059 726,534 707,276 678,294 663,647 636,983 619,980 604,577 596,832772,321
Operating Expenses 263,226 258,046 293,682 258,534 257,724 252,333 245,210 240,678 244,729277,104Capital Lease 3,217 3,217 3,217 3,217 3,217 3,217 3,217 3,217 3,2173,217Net Operating Revenues 484,616 465,271 410,377 416,543 402,706 381,433 371,553 360,682 348,886492,000
Debt Service on Bonds $ 279,790 $ 286,666 $ 274,212 $ 233,079 $ 228,652 $ 209,826 $ 208,332 $ 224,746 $ 199,368 $ 285,663 Other Debt Service 158,485 139,430 114,481 161,736 160,032 158,666 145,722 124,656 136,677169,017Debt Prepayment 10,900 10,995 - - - - - - - 7,100
35,441 $ 28,180 21,685 21,728 14,022 12,941 17,499 11,280 12,841 30,220
Fund Deposits:Reserve Funds 821$ $ $ $ $ $ $ $ $$ (168) (35) 483 169 1,398 195 (407) (653) 1,882 Construction Fund 14,683 $ 13,059 11,462 10,464 9,516 8,535 7,481 7,539 5,96716,740 Core Fund - $ - - 730 132 - - - - - Rate Stabilization 6,532$
$
$ $ $$
$
$ $$
$
$ $$
$
$ $$
$
$ $$
$
$ $$
$
$ $$
$
$ $$
$
$ $$ - - - - - - - - -
Amount Available After Operations and Debt Service
MASSACHUSETTS WATER RESOURCES AUTHORITY
Historical Revenues, Expenses and Fund DepositsLast Ten Fiscal Years
(in thousands of dollars)
2018 2017 2016 2015 2014 2013 2012 2011 20102019

84
2017 2016 2015 2014 2013 2010201120122019
Operating Revenues $ 716,776 $ 696,973 $ 668,605 $ 648,017 $ 623,393 602,620$ 584,354$ $ 574,297 $ 755,336
Interest Income 9,758 10,303 9,689 12,130 13,590 16,268 15,193 15,22316,985
Special Payment Obligation - - - - - - - -
Transfers from Rate Stabilization Fund - - - 3,500 - 1,092 5,030 7,312
Total Revenues $ 726,534 $ 707,276 $ 678,294 $ 663,647 $ 636,983 619,980$ 604,577$ $ 596,832 $ 772,321
Operating Expenses $ (266,415) $ (278,887) $ (271,329) $ (273,500) $ (267,351) (261,510)$ (254,846)$ (260,765)$ $ (276,631)
Special Payment Obligation - - - - - - - -
Commonwealth Obligations 23,912 27,470 27,168 26,641 26,004 25,630 24,709 23,34923,412
OPEB 3,449 11,555 9,401 13,521 13,123 15,118 14,169 16,838331
Pollution Remediation 4,752 322 3,394 2,261 -- -- -- --1,078
Capital Lease (3,217) (3,217) (3,217) (3,217) (3,217) (3,217) (3,217) (3,217)(3,217)
Net Revenues $ 489,015 $ 464,519 $ 443,711 $ 429,353 $ 405,542 396,001$ 385,392$ $ 373,037 $ 517,294
CORE Fund Deposits - - 862 132 - - - --
Required Subordinated Debt Service Deposits(D) 139,430 114,481 161,737 160,032 151,598 145,236 117,656 129,667 169,017
Coverage:
Before Provision for Transfer to Rate Stabilization Fund:
Primary 187% 170% 212% 211% 210% 211% 193% 208%192%
SRF Primary 122% 120% 120% 118% 118% 119% 122% 121%118%
After Provision for Transfer to Rate Stabilization Fund:
Primary 187% 170% 212% 211% 210% 211% 191% 204%192%
SRF Primary 122% 120% 120% 118% 118% 199% 120% 118%118%
Required CORE Fund Deposits N/A N/A $862 $132
CORE Fund Deposits N/A N/A $862 $132
$ - $ - $ - $ - $ -
$ - $ - $ - $ - $ -
429,221
199,294 188,054 192,834 203,338
517,294 365,510 381,244 396,001 405,542
Required Senior Debt Service Fund Deposits(C) 272,570 262,093 208,500 269,435 179,440
$ -
Revenues Available for Primary and SRF Primary Coverage (After Provision for Transfer to Rate Stabilization Fund)(B)
442,849 464,519 489,015
405,542 429,221 442,849 464,519 489,015 Revenues Available for Primary and SRF Primary Coverage (Before Provision for Transfer to Rate Stabilization Fund)(A)
Provision for Transfer to Rate Stabilization
Fund $ - $ - $ - $ - $ -
396,001
$ 3,108.00 $ 7,527.00 4,148.00$ -$
517,294 373,037 385,392
2018
$ 738,304
12,755
-
-
-
-
$ 751,059
$ (263,394)
--
23,757
(236)
1,225
(3,217)
$ 509,194
-
158,485
195%
121%
192%
120%
N/A
N/A
261,383
502,662
509,194 $
$
$
$
$
$
$
$
$
$
$
$
$
$
$
$
$
$
$
$
$
$
$
$
$
$
$
$
$
$
$
$
$
$
$
$
$
$
$
$
$ 6,532
MASSACHUSETTS WATER RESOURCES AUTHORITY
Debt Service CoverageLast Ten Fiscal Years
(in thousands of dollars)
MASSACHUSETTS WATER RESOURCES AUTHORITYDebt Service Coverage
Last Ten Fiscal Years(Dollars in thousands)
Note: Schedule prepared in accordance with MWRA General Bond Resolution.

85
2017 2016 2015 2014 2013 2010201120122019
Operating Revenues $ 716,776 $ 696,973 $ 668,605 $ 648,017 $ 623,393 602,620$ 584,354$ $ 574,297 $ 755,336
Interest Income 9,758 10,303 9,689 12,130 13,590 16,268 15,193 15,22316,985
Special Payment Obligation - - - - - - - -
Transfers from Rate Stabilization Fund - - - 3,500 - 1,092 5,030 7,312
Total Revenues $ 726,534 $ 707,276 $ 678,294 $ 663,647 $ 636,983 619,980$ 604,577$ $ 596,832 $ 772,321
Operating Expenses $ (266,415) $ (278,887) $ (271,329) $ (273,500) $ (267,351) (261,510)$ (254,846)$ (260,765)$ $ (276,631)
Special Payment Obligation - - - - - - - -
Commonwealth Obligations 23,912 27,470 27,168 26,641 26,004 25,630 24,709 23,34923,412
OPEB 3,449 11,555 9,401 13,521 13,123 15,118 14,169 16,838331
Pollution Remediation 4,752 322 3,394 2,261 -- -- -- --1,078
Capital Lease (3,217) (3,217) (3,217) (3,217) (3,217) (3,217) (3,217) (3,217)(3,217)
Net Revenues $ 489,015 $ 464,519 $ 443,711 $ 429,353 $ 405,542 396,001$ 385,392$ $ 373,037 $ 517,294
CORE Fund Deposits - - 862 132 - - - --
Required Subordinated Debt Service Deposits(D) 139,430 114,481 161,737 160,032 151,598 145,236 117,656 129,667 169,017
Coverage:
Before Provision for Transfer to Rate Stabilization Fund:
Primary 187% 170% 212% 211% 210% 211% 193% 208%192%
SRF Primary 122% 120% 120% 118% 118% 119% 122% 121%118%
After Provision for Transfer to Rate Stabilization Fund:
Primary 187% 170% 212% 211% 210% 211% 191% 204%192%
SRF Primary 122% 120% 120% 118% 118% 199% 120% 118%118%
Required CORE Fund Deposits N/A N/A $862 $132
CORE Fund Deposits N/A N/A $862 $132
$ - $ - $ - $ - $ -
$ - $ - $ - $ - $ -
429,221
199,294 188,054 192,834 203,338
517,294 365,510 381,244 396,001 405,542
Required Senior Debt Service Fund Deposits(C) 272,570 262,093 208,500 269,435 179,440
$ -
Revenues Available for Primary and SRF Primary Coverage (After Provision for Transfer to Rate Stabilization Fund)(B)
442,849 464,519 489,015
405,542 429,221 442,849 464,519 489,015 Revenues Available for Primary and SRF Primary Coverage (Before Provision for Transfer to Rate Stabilization Fund)(A)
Provision for Transfer to Rate Stabilization
Fund $ - $ - $ - $ - $ -
396,001
$ 3,108.00 $ 7,527.00 4,148.00$ -$
517,294 373,037 385,392
2018
$ 738,304
12,755
-
-
-
-
$ 751,059
$ (263,394)
--
23,757
(236)
1,225
(3,217)
$ 509,194
-
158,485
195%
121%
192%
120%
N/A
N/A
261,383
502,662
509,194 $
$
$
$
$
$
$
$
$
$
$
$
$
$
$
$
$
$
$
$
$
$
$
$
$
$
$
$
$
$
$
$
$
$
$
$
$
$
$
$
$ 6,532
MASSACHUSETTS WATER RESOURCES AUTHORITY
Debt Service CoverageLast Ten Fiscal Years
(in thousands of dollars)

86
Sewer Water Sewer Water Sewer Water Sewer Water Sewer Water Sewer Water Sewer Water Sewer Water Sewer WaterSewer WaterGeneral Revenue Bonds:
1993C Series Bonds - - - - 8,807 1,258 17,172 2,453 25,117 3,588 25,117 3,588 28,446 4,064 31,583 4,512 42,083 6,012 - -
2019B Series Bonds - - - - - - - - - - - - - - - - - - 87,500 37,500
2002B Series Bonds - - - - - - - - - - - - - - - - 7,442 66,974 - - 2002J Series Bonds 218,739 22,601 247,895 26,285 254,960 27,070 268,703 28,597 268,703 28,597 268,703 28,597 397,898 131,397 397,898 131,397 414,584 133,251 128,338 12,557 2003D Series Bonds - - - - - - - - - - - - 37,780 75,560 37,780 75,560 37,780 75,560 - - 2004A Series Bonds - - - - - - - - - - - - 7,865 97,005 7,865 97,005 7,865 97,005 - - 2006A Series Bonds - - - - - 62,320 - 149,990 - 149,990 - 200,000 - 200,000 - 200,000 - 200,000 - - 2007A Series Bonds - - - - 33,660 164,340 33,660 164,340 33,660 164,340 33,660 164,340 34,000 166,000 34,000 166,000 34,000 166,000 - - 2009A Series Bonds - - - - 48,180 16,060 57,334 19,111 60,210 20,070 68,370 22,790 70,504 23,501 73,500 24,500 73,500 24,500 - - 2010A Series Bonds 973 417 3,630 1,556 59,605 25,545 67,571 28,959 68,418 29,322 69,227 29,669 70,000 30,000 70,000 30,000 - - - - 2011B Series Bonds 5,852 2,508 55,892 23,954 94,350 40,436 98,098 42,042 101,388 43,452 103,135 44,201 105,000 45,000 - - - - 4,379 1,8772012A Series Bonds 37,295 37,295 49,043 49,043 66,310 66,310 69,683 69,683 72,338 72,338 75,000 75,000 - - - - - - 36,328 36,328 2014D Series Bonds 41,851 19,694 46,427 21,848 48,052 22,613 - - - - - - - - - - - - 40,912 19,253 2016B Series Bonds 32,985 32,985 32,985 32,985 - - - - - - - - - - - - - - 31,045 31,045 2017B Series Bonds 34,120 34,120 - - - - - - - - - - - - - - - - 33,490 33,490
General Revenue Refunding Bonds:1997D Series Bonds - - - - - - - - - - - - 6,871 439 6,871 439 13,357 853 1998B Series Bonds - - - - - - - - - - - - 18,557 773 23,270 970 23,688 987 2004B Series Bonds - - - - - - 33,604 4,801 42,831 6,119 42,831 6,119 43,216 6,174 43,216 6,174 43,216 6,174 2005A Series Bonds - - 118,730 145,115 138,173 168,878 155,174 189,657 155,174 189,657 160,499 196,166 160,499 196,166 171,158 209,193 180,122 220,149 2005B Series Bonds - - 25,082 50,163 26,763 53,527 26,763 53,527 26,763 53,527 26,763 53,527 26,763 53,527 26,763 53,527 26,763 53,527 2006B Series Bonds 22,823 7,608 23,614 7,871 129,431 43,144 162,701 54,234 162,701 54,234 197,955 65,985 197,955 65,985 198,709 66,236 198,709 66,236 2007B Series Bonds 544,278 103,672 544,278 103,672 544,278 103,672 544,278 103,672 544,278 103,672 544,278 103,672 544,278 103,672 544,278 103,672 544,278 103,672 544,278 103,672 2009B Series Bonds 104,562 40,663 113,386 44,094 193,043 75,072 195,142 75,888 197,352 76,748 201,758 78,462 203,443 79,117 205,344 79,856 205,344 79,856 47,146 18,334 2010B Series Bonds 57,214 41,431 62,608 45,337 95,836 69,399 100,824 73,011 106,471 77,099 106,471 77,099 106,471 77,099 106,471 77,099 - - 49,741 36,019 2011C Series Bonds 125,252 195,908 125,252 195,908 127,592 199,568 127,592 199,568 127,592 199,568 127,592 199,568 - - - - - - 113,552 177,608 2012B Series Bonds 18,223 68,552 18,223 68,552 18,223 68,552 18,223 68,552 18,223 68,552 18,223 68,552 - - - - - - 18,223 68,552 2013A Series Bonds 79,537 62,493 92,758 72,882 95,102 74,723 95,108 74,727 95,556 75,079 - - - - - - - - 57,408 45,107 2014E Series Bonds 13,654 1,951 22,133 3,162 24,714 3,531 - - - - - - - - - - - - 4,589 656 2014F Series Bonds 43,837 97,573 43,837 97,573 43,873 97,652 - - - - - - - - - - - - 43,837 97,573 2016C Series Bonds 347,624 333,991 347,624 333,991 - - - - - - - - - - - - - - 345,874 332,311 2016D Series Bonds 67,769 36,491 - - - - - - - - - - - - - - - - 67,769 36,491 2017C Series Bonds2018C Series Bonds
114,635 140,110 - - - - - - - - - - - - - - - - 110,475 135,025
General Revenue Bonds (variable rates):1999B Series Bonds 35,160 23,440 35,160 23,440 35,160 23,440 35,160 23,440 37,380 24,920 37,380 24,920 41,580 27,720 43,560 29,040 43,560 29,040 30,420 20,280
General Revenue Refunding Bonds (variable rates):2002C Series Bonds 11,290 23,830 11,290 23,830 11,290 23,830 11,290 23,830 11,290 23,830 11,290 23,830 23,108 47,467 23,108 47,467 23,108 47,467 11,290 23,830 2002D Series Bonds - - - - - - - - - - 56,450 - 56,450 - 56,450 - 66,450 -- -2008A Series Bonds 187,343 25,547 206,664 28,181 251,438 34,287 294,224 40,121 297,154 40,521 297,154 40,521 297,154 40,521 297,154 40,521 297,444 40,561 179,467 24,473 2008B Series Bonds - - - - - - - - - - 25,857 97,273 25,857 97,273 25,857 97,273 26,165 98,430 - - 2008C Series Bonds 97,248 4,052 101,395 4,225 105,427 4,393 109,286 4,554 112,973 4,707 174,432 7,268 180,192 7,508 181,632 7,568 187,104 7,796 67,872 2,828 2008D Series Bonds - - - - - - - - - - - - - - 12,240 - 73,140 -- -2008E Series Bonds 122,949 10,691 122,949 10,691 122,949 10,691 122,949 10,691 159,215 13,845 193,816 16,854 193,816 16,854 193,816 16,854 206,788 17,982 122,949 10,691 2008F Series Bonds - - 4,500 45,500 4,500 45,500 4,500 45,500 14,828 149,927 16,642 168,268 16,642 168,268 16,642 168,268 17,253 174,452 - - 2012E Series Bonds 12,897 48,518 13,194 49,636 13,194 49,636 13,194 49,636 13,194 49,636 - - - - - - - - 12,271 46,1642012F Series Bonds 10,936 41,139 12,663 47,637 12,663 47,637 12,663 47,637 12,663 47,637 - - - - - - - - - - 2012G Series Bonds 45,024 1,876 47,789 1,991 50,477 2,103 53,050 2,210 55,507 2,313 - - - - - - - - 25,440 1,0602014A Series Bonds 4,500 45,500 4,500 45,500 4,500 45,500 4,500 45,500 - - - - - - - - - - 4,500 45,5002014B Series Bonds 5,828 58,927 5,828 58,927 5,828 58,927 5,828 58,927 - - - - - - - - - - 4,869 49,226
Revolving Loan:2015C Revolving Loan 39,500 39,500 39,500 39,500 - - - - - - - - - - - - - - 26,500 26,500
814,296 192,155 853,081 182,716 859,991 182,973 853,322 177,847 892,160 184,391 899,618 187,141 884,690 185,558 888,758 166,628 901,849 173,700 767,588 212,295
Total 3,298,193 1,795,238 3,431,908 1,885,764 3,528,369 1,912,586 3,591,594 1,932,704 3,713,138 1,957,678 3,782,221 1,983,408 3,779,037 1,946,646 3,717,924 1,899,757 3,730,610 1,907,689 3,127,650 1,824,408
General Revenue Bonds with the Massachusetts Clean Water Trust:
201320142015201620172019 2009201020112012Sewer Water
- -
- -
- - 171,651 17,369
- - - - - - - - - - - -
5,495 2,355 37,295 37,295 40,912 19,253 31,685 31,685 34,120 34,120
2018B Series Bonds - - - - - - - - - - - - - - - - - -64,548 43,032 64,548 43,032
- -
2019C Series Bonds - - - - - - - - - - - - 13 ,817 5,373 - -
- -- -- -- -- -
- -- -- -- -- -- -
544,278 103,672 91,019 35,396 55,648 40,297
125,252 195,908 18,223 68,552 57,408 45,107 13,654 1,951 43,837 97,573
345,874 332,311 67,769 36,491
112,27516,425 5,475 -- - - - - - - - - - - - - - - - -
- - - - - -16,425 5,475
137,225
32,820 21,880
11,290 23,830 - -
184,294 25,131 - -
82,848 3,452 - -
122,949 10,691 - -
12,590 47,361 - -
35,424 1,476 4,500 45,500 5,828 58,927
26,500 26,500
766,343 176,538
3,177,882 1,811,833
2018
MASSACHUSETTS WATER RESOURCES AUTHORITY
Long Term Debt by UtilityLast Ten Fiscal Years
(Dollars in thousands)
2018A Series Bonds - - - - - - - - - - - - - - - - - - 10,310 38,7852018D Series Bonds - - - - - - - - - - - - - - - - - - 4,500 45,500
10,628 39,982 4,500 45,500
MASSACHUSETTS WATER RESOURCES AUTHORITYLong Term Debt by System
Last Ten Fiscal Years(Dollars in thousands)

87
Sewer Water Sewer Water Sewer Water Sewer Water Sewer Water Sewer Water Sewer Water Sewer Water Sewer WaterSewer WaterGeneral Revenue Bonds:
1993C Series Bonds - - - - 8,807 1,258 17,172 2,453 25,117 3,588 25,117 3,588 28,446 4,064 31,583 4,512 42,083 6,012 - -
2019B Series Bonds - - - - - - - - - - - - - - - - - - 87,500 37,500
2002B Series Bonds - - - - - - - - - - - - - - - - 7,442 66,974 - - 2002J Series Bonds 218,739 22,601 247,895 26,285 254,960 27,070 268,703 28,597 268,703 28,597 268,703 28,597 397,898 131,397 397,898 131,397 414,584 133,251 128,338 12,557 2003D Series Bonds - - - - - - - - - - - - 37,780 75,560 37,780 75,560 37,780 75,560 - - 2004A Series Bonds - - - - - - - - - - - - 7,865 97,005 7,865 97,005 7,865 97,005 - - 2006A Series Bonds - - - - - 62,320 - 149,990 - 149,990 - 200,000 - 200,000 - 200,000 - 200,000 - - 2007A Series Bonds - - - - 33,660 164,340 33,660 164,340 33,660 164,340 33,660 164,340 34,000 166,000 34,000 166,000 34,000 166,000 - - 2009A Series Bonds - - - - 48,180 16,060 57,334 19,111 60,210 20,070 68,370 22,790 70,504 23,501 73,500 24,500 73,500 24,500 - - 2010A Series Bonds 973 417 3,630 1,556 59,605 25,545 67,571 28,959 68,418 29,322 69,227 29,669 70,000 30,000 70,000 30,000 - - - - 2011B Series Bonds 5,852 2,508 55,892 23,954 94,350 40,436 98,098 42,042 101,388 43,452 103,135 44,201 105,000 45,000 - - - - 4,379 1,8772012A Series Bonds 37,295 37,295 49,043 49,043 66,310 66,310 69,683 69,683 72,338 72,338 75,000 75,000 - - - - - - 36,328 36,328 2014D Series Bonds 41,851 19,694 46,427 21,848 48,052 22,613 - - - - - - - - - - - - 40,912 19,253 2016B Series Bonds 32,985 32,985 32,985 32,985 - - - - - - - - - - - - - - 31,045 31,045 2017B Series Bonds 34,120 34,120 - - - - - - - - - - - - - - - - 33,490 33,490
General Revenue Refunding Bonds:1997D Series Bonds - - - - - - - - - - - - 6,871 439 6,871 439 13,357 853 1998B Series Bonds - - - - - - - - - - - - 18,557 773 23,270 970 23,688 987 2004B Series Bonds - - - - - - 33,604 4,801 42,831 6,119 42,831 6,119 43,216 6,174 43,216 6,174 43,216 6,174 2005A Series Bonds - - 118,730 145,115 138,173 168,878 155,174 189,657 155,174 189,657 160,499 196,166 160,499 196,166 171,158 209,193 180,122 220,149 2005B Series Bonds - - 25,082 50,163 26,763 53,527 26,763 53,527 26,763 53,527 26,763 53,527 26,763 53,527 26,763 53,527 26,763 53,527 2006B Series Bonds 22,823 7,608 23,614 7,871 129,431 43,144 162,701 54,234 162,701 54,234 197,955 65,985 197,955 65,985 198,709 66,236 198,709 66,236 2007B Series Bonds 544,278 103,672 544,278 103,672 544,278 103,672 544,278 103,672 544,278 103,672 544,278 103,672 544,278 103,672 544,278 103,672 544,278 103,672 544,278 103,672 2009B Series Bonds 104,562 40,663 113,386 44,094 193,043 75,072 195,142 75,888 197,352 76,748 201,758 78,462 203,443 79,117 205,344 79,856 205,344 79,856 47,146 18,334 2010B Series Bonds 57,214 41,431 62,608 45,337 95,836 69,399 100,824 73,011 106,471 77,099 106,471 77,099 106,471 77,099 106,471 77,099 - - 49,741 36,019 2011C Series Bonds 125,252 195,908 125,252 195,908 127,592 199,568 127,592 199,568 127,592 199,568 127,592 199,568 - - - - - - 113,552 177,608 2012B Series Bonds 18,223 68,552 18,223 68,552 18,223 68,552 18,223 68,552 18,223 68,552 18,223 68,552 - - - - - - 18,223 68,552 2013A Series Bonds 79,537 62,493 92,758 72,882 95,102 74,723 95,108 74,727 95,556 75,079 - - - - - - - - 57,408 45,107 2014E Series Bonds 13,654 1,951 22,133 3,162 24,714 3,531 - - - - - - - - - - - - 4,589 656 2014F Series Bonds 43,837 97,573 43,837 97,573 43,873 97,652 - - - - - - - - - - - - 43,837 97,573 2016C Series Bonds 347,624 333,991 347,624 333,991 - - - - - - - - - - - - - - 345,874 332,311 2016D Series Bonds 67,769 36,491 - - - - - - - - - - - - - - - - 67,769 36,491 2017C Series Bonds2018C Series Bonds
114,635 140,110 - - - - - - - - - - - - - - - - 110,475 135,025
General Revenue Bonds (variable rates):1999B Series Bonds 35,160 23,440 35,160 23,440 35,160 23,440 35,160 23,440 37,380 24,920 37,380 24,920 41,580 27,720 43,560 29,040 43,560 29,040 30,420 20,280
General Revenue Refunding Bonds (variable rates):2002C Series Bonds 11,290 23,830 11,290 23,830 11,290 23,830 11,290 23,830 11,290 23,830 11,290 23,830 23,108 47,467 23,108 47,467 23,108 47,467 11,290 23,830 2002D Series Bonds - - - - - - - - - - 56,450 - 56,450 - 56,450 - 66,450 -- -2008A Series Bonds 187,343 25,547 206,664 28,181 251,438 34,287 294,224 40,121 297,154 40,521 297,154 40,521 297,154 40,521 297,154 40,521 297,444 40,561 179,467 24,473 2008B Series Bonds - - - - - - - - - - 25,857 97,273 25,857 97,273 25,857 97,273 26,165 98,430 - - 2008C Series Bonds 97,248 4,052 101,395 4,225 105,427 4,393 109,286 4,554 112,973 4,707 174,432 7,268 180,192 7,508 181,632 7,568 187,104 7,796 67,872 2,828 2008D Series Bonds - - - - - - - - - - - - - - 12,240 - 73,140 -- -2008E Series Bonds 122,949 10,691 122,949 10,691 122,949 10,691 122,949 10,691 159,215 13,845 193,816 16,854 193,816 16,854 193,816 16,854 206,788 17,982 122,949 10,691 2008F Series Bonds - - 4,500 45,500 4,500 45,500 4,500 45,500 14,828 149,927 16,642 168,268 16,642 168,268 16,642 168,268 17,253 174,452 - - 2012E Series Bonds 12,897 48,518 13,194 49,636 13,194 49,636 13,194 49,636 13,194 49,636 - - - - - - - - 12,271 46,1642012F Series Bonds 10,936 41,139 12,663 47,637 12,663 47,637 12,663 47,637 12,663 47,637 - - - - - - - - - - 2012G Series Bonds 45,024 1,876 47,789 1,991 50,477 2,103 53,050 2,210 55,507 2,313 - - - - - - - - 25,440 1,0602014A Series Bonds 4,500 45,500 4,500 45,500 4,500 45,500 4,500 45,500 - - - - - - - - - - 4,500 45,5002014B Series Bonds 5,828 58,927 5,828 58,927 5,828 58,927 5,828 58,927 - - - - - - - - - - 4,869 49,226
Revolving Loan:2015C Revolving Loan 39,500 39,500 39,500 39,500 - - - - - - - - - - - - - - 26,500 26,500
814,296 192,155 853,081 182,716 859,991 182,973 853,322 177,847 892,160 184,391 899,618 187,141 884,690 185,558 888,758 166,628 901,849 173,700 767,588 212,295
Total 3,298,193 1,795,238 3,431,908 1,885,764 3,528,369 1,912,586 3,591,594 1,932,704 3,713,138 1,957,678 3,782,221 1,983,408 3,779,037 1,946,646 3,717,924 1,899,757 3,730,610 1,907,689 3,127,650 1,824,408
General Revenue Bonds with the Massachusetts Clean Water Trust:
201320142015201620172019 2009201020112012Sewer Water
- -
- -
- - 171,651 17,369
- - - - - - - - - - - -
5,495 2,355 37,295 37,295 40,912 19,253 31,685 31,685 34,120 34,120
2018B Series Bonds - - - - - - - - - - - - - - - - - -64,548 43,032 64,548 43,032
- -
2019C Series Bonds - - - - - - - - - - - - 13 ,817 5,373 - -
- -- -- -- -- -
- -- -- -- -- -- -
544,278 103,672 91,019 35,396 55,648 40,297
125,252 195,908 18,223 68,552 57,408 45,107 13,654 1,951 43,837 97,573
345,874 332,311 67,769 36,491
112,27516,425 5,475 -- - - - - - - - - - - - - - - - -
- - - - - -16,425 5,475
137,225
32,820 21,880
11,290 23,830 - -
184,294 25,131 - -
82,848 3,452 - -
122,949 10,691 - -
12,590 47,361 - -
35,424 1,476 4,500 45,500 5,828 58,927
26,500 26,500
766,343 176,538
3,177,882 1,811,833
2018
MASSACHUSETTS WATER RESOURCES AUTHORITY
Long Term Debt by UtilityLast Ten Fiscal Years
(Dollars in thousands)
2018A Series Bonds - - - - - - - - - - - - - - - - - - 10,310 38,7852018D Series Bonds - - - - - - - - - - - - - - - - - - 4,500 45,500
10,628 39,982 4,500 45,500

88
MWRA Community 2017 2016 2015 2014 2013 2012 2011 20102019Arlington 4.64 3.96 4.56 4.15 4.47 5.08 4.72 5.885.28Ashland 1.36 1.11 1.16 1.20 1.22 1.24 1.10 1.341.37Bedford 2.46 2.34 2.57 2.42 2.41 2.52 2.33 2.852.72Belmont 2.69 2.31 2.89 2.56 2.92 3.10 3.05 3.983.40Boston (BWSC) 87.04 80.51 87.21 85.18 94.79 97.02 95.81 100.40101.54Braintree 6.26 6.63 7.08 6.39 6.58 6.82 6.52 6.978.74Brookline 7.72 7.07 8.62 8.89 9.09 10.03 9.61 11.749.72Burlington 3.38 3.00 3.31 3.12 3.22 3.45 3.53 4.183.95Cambridge 17.83 16.31 17.93 16.15 17.28 17.16 16.84 19.6019.08Canton 2.79 2.59 2.77 2.98 2.77 2.26 2.44 2.403.35Chelsea 5.12 4.67 5.16 4.76 4.88 4.91 5.08 5.355.90Dedham 3.41 3.06 3.53 3.44 3.57 3.61 3.39 4.424.52Everett 5.12 4.54 4.95 4.85 5.15 5.81 4.81 6.086.43Framingham 6.87 7.15 7.62 6.76 7.05 6.11 6.28 7.737.86Hingham Sewer District 1.25 1.22 1.37 1.25 1.32 1.26 1.28 1.411.62Holbrook 0.85 0.83 0.89 0.86 0.92 0.76 0.78 0.901.01Lexington 4.59 4.22 4.93 4.47 5.06 5.25 5.00 6.965.85Malden 8.45 8.19 9.20 8.13 8.95 9.11 9.18 9.729.35Medford 7.17 6.72 8.26 7.09 7.96 7.68 7.63 9.957.79Melrose 4.29 3.69 4.64 3.86 4.50 4.69 3.91 4.894.80Milton 3.04 2.56 3.26 2.93 3.14 3.33 3.32 4.243.97Natick 2.76 2.80 2.93 2.95 3.07 3.10 2.95 2.943.28Needham 3.52 3.06 3.39 3.29 3.52 3.62 3.71 4.694.28Newton 14.73 14.11 15.22 13.29 15.31 17.09 15.61 19.4316.50Norwood 5.41 4.58 5.29 4.97 5.13 4.82 4.50 5.526.93Quincy 12.58 12.11 13.56 12.96 13.45 14.09 13.79 16.3614.92Randolph 3.58 2.82 3.52 3.41 3.66 3.63 3.43 4.074.06Reading 2.89 2.42 2.83 2.65 2.86 3.07 2.87 3.463.63Revere 6.14 5.97 6.82 6.13 7.01 7.50 7.36 7.977.18Somerville 10.27 9.96 10.70 9.30 10.87 10.63 10.79 11.8610.25Stoneham 2.68 2.39 3.16 2.70 3.15 3.47 3.12 3.913.57Stoughton 2.75 2.60 3.20 2.67 2.66 3.09 2.83 4.353.55Wakefield 4.09 3.59 4.26 3.50 3.88 4.42 4.21 5.275.02Walpole 1.99 1.75 1.88 1.89 2.00 1.93 1.92 2.552.48Waltham 8.39 8.10 9.11 8.06 9.26 9.39 9.77 11.2810.02Watertown 3.36 3.00 3.31 3.14 3.49 3.68 3.66 4.303.84Wellesley 3.15 2.82 3.14 3.05 3.38 3.63 3.29 4.253.80Westwood 1.78 1.50 1.50 1.28 1.42 1.42 1.33 1.781.99Weymouth 7.93 7.15 7.82 6.90 8.18 7.56 7.39 8.9410.14Wilmington 1.40 1.28 1.33 1.20 1.20 1.32 1.27 1.531.56Winchester 2.23 1.94 2.24 1.99 2.30 2.39 2.28 2.742.73Winthrop 2.14 1.85 1.90 1.84 1.99 2.21 2.22 2.532.40Woburn 6.48 5.83 6.86 6.97 7.34 7.28 7.48 9.085.97
20184.791.282.512.93
89.827.078.053.58
17.983.245.493.925.607.321.320.915.038.737.524.183.282.773.68
14.216.20
13.483.852.886.18
10.633.133.244.172.079.073.483.221.768.651.452.302.106.29
MASSACHUSETTS WATER RESOURCES AUTHORITY
Schedule of Sewer FlowsLast Ten Fiscal Years
(million gallons per day)
Source: MWRA metering
MASSACHUSETTS WATER RESOURCES AUTHORITYSchedule of Sewer Flows
Last Ten Fiscal Years(Million gallons per day)

89
MWRA Community 2017 2016 2015 2014 2013 2012 2011 20102019Arlington 4.64 3.96 4.56 4.15 4.47 5.08 4.72 5.885.28Ashland 1.36 1.11 1.16 1.20 1.22 1.24 1.10 1.341.37Bedford 2.46 2.34 2.57 2.42 2.41 2.52 2.33 2.852.72Belmont 2.69 2.31 2.89 2.56 2.92 3.10 3.05 3.983.40Boston (BWSC) 87.04 80.51 87.21 85.18 94.79 97.02 95.81 100.40101.54Braintree 6.26 6.63 7.08 6.39 6.58 6.82 6.52 6.978.74Brookline 7.72 7.07 8.62 8.89 9.09 10.03 9.61 11.749.72Burlington 3.38 3.00 3.31 3.12 3.22 3.45 3.53 4.183.95Cambridge 17.83 16.31 17.93 16.15 17.28 17.16 16.84 19.6019.08Canton 2.79 2.59 2.77 2.98 2.77 2.26 2.44 2.403.35Chelsea 5.12 4.67 5.16 4.76 4.88 4.91 5.08 5.355.90Dedham 3.41 3.06 3.53 3.44 3.57 3.61 3.39 4.424.52Everett 5.12 4.54 4.95 4.85 5.15 5.81 4.81 6.086.43Framingham 6.87 7.15 7.62 6.76 7.05 6.11 6.28 7.737.86Hingham Sewer District 1.25 1.22 1.37 1.25 1.32 1.26 1.28 1.411.62Holbrook 0.85 0.83 0.89 0.86 0.92 0.76 0.78 0.901.01Lexington 4.59 4.22 4.93 4.47 5.06 5.25 5.00 6.965.85Malden 8.45 8.19 9.20 8.13 8.95 9.11 9.18 9.729.35Medford 7.17 6.72 8.26 7.09 7.96 7.68 7.63 9.957.79Melrose 4.29 3.69 4.64 3.86 4.50 4.69 3.91 4.894.80Milton 3.04 2.56 3.26 2.93 3.14 3.33 3.32 4.243.97Natick 2.76 2.80 2.93 2.95 3.07 3.10 2.95 2.943.28Needham 3.52 3.06 3.39 3.29 3.52 3.62 3.71 4.694.28Newton 14.73 14.11 15.22 13.29 15.31 17.09 15.61 19.4316.50Norwood 5.41 4.58 5.29 4.97 5.13 4.82 4.50 5.526.93Quincy 12.58 12.11 13.56 12.96 13.45 14.09 13.79 16.3614.92Randolph 3.58 2.82 3.52 3.41 3.66 3.63 3.43 4.074.06Reading 2.89 2.42 2.83 2.65 2.86 3.07 2.87 3.463.63Revere 6.14 5.97 6.82 6.13 7.01 7.50 7.36 7.977.18Somerville 10.27 9.96 10.70 9.30 10.87 10.63 10.79 11.8610.25Stoneham 2.68 2.39 3.16 2.70 3.15 3.47 3.12 3.913.57Stoughton 2.75 2.60 3.20 2.67 2.66 3.09 2.83 4.353.55Wakefield 4.09 3.59 4.26 3.50 3.88 4.42 4.21 5.275.02Walpole 1.99 1.75 1.88 1.89 2.00 1.93 1.92 2.552.48Waltham 8.39 8.10 9.11 8.06 9.26 9.39 9.77 11.2810.02Watertown 3.36 3.00 3.31 3.14 3.49 3.68 3.66 4.303.84Wellesley 3.15 2.82 3.14 3.05 3.38 3.63 3.29 4.253.80Westwood 1.78 1.50 1.50 1.28 1.42 1.42 1.33 1.781.99Weymouth 7.93 7.15 7.82 6.90 8.18 7.56 7.39 8.9410.14Wilmington 1.40 1.28 1.33 1.20 1.20 1.32 1.27 1.531.56Winchester 2.23 1.94 2.24 1.99 2.30 2.39 2.28 2.742.73Winthrop 2.14 1.85 1.90 1.84 1.99 2.21 2.22 2.532.40Woburn 6.48 5.83 6.86 6.97 7.34 7.28 7.48 9.085.97
20184.791.282.512.93
89.827.078.053.58
17.983.245.493.925.607.321.320.915.038.737.524.183.282.773.68
14.216.20
13.483.852.886.18
10.633.133.244.172.079.073.483.221.768.651.452.302.106.29
MASSACHUSETTS WATER RESOURCES AUTHORITY
Schedule of Sewer FlowsLast Ten Fiscal Years
(million gallons per day)
Source: MWRA metering

90
MWRA Water Customer 2017 2016 2015 2014 2013 2012 2011 20102019Arlington 3.782 3.907 3.826 3.778 3.933 4.061 4.309 3.8723.573Belmont 2.105 2.187 2.157 2.113 2.169 2.174 2.092 2.1861.990Boston (BWSC) 64.334 64.902 64.567 63.184 64.325 64.395 65.128 65.53062.331Brookline 5.068 5.275 5.500 5.462 5.344 5.078 5.120 5.1104.903Chelsea 3.323 3.283 3.248 3.306 3.121 3.095 3.036 3.0363.278Chicopee 5.122 5.306 5.251 5.285 5.394 5.496 5.457 5.6204.878Clinton 1.433 1.637 1.700 1.719 1.951 1.975 1.896 1.6891.390Everett 3.905 3.883 3.755 3.832 3.902 3.857 4.007 4.1683.710Framingham 5.883 6.017 6.621 6.504 6.542 6.578 6.859 6.4265.669Lexington 5.304 5.377 5.824 5.145 4.961 4.534 4.990 4.5485.034Lynnfield W.D. 0.560 0.522 0.488 0.463 0.415 0.354 0.415 0.3600.488Malden 4.941 5.225 5.684 5.250 5.372 5.524 5.486 5.2525.101Marblehead 1.817 1.839 1.803 1.791 1.715 1.698 1.757 1.7511.654Medford 4.624 4.944 5.059 5.075 4.957 4.835 5.077 4.9944.292Melrose 2.071 2.207 2.323 2.235 2.218 2.144 2.247 2.1011.976Milton 2.578 2.632 2.598 2.394 2.464 2.442 2.383 2.2882.271Nahant 0.390 0.384 0.357 0.331 0.307 0.290 0.311 0.2870.315Newton 8.973 9.986 10.095 9.174 8.858 8.891 8.871 8.4488.540Norwood 2.835 2.776 2.932 2.892 2.736 2.808 3.241 2.9042.662Quincy 8.869 9.209 9.330 9.173 8.933 8.878 9.126 9.0517.894Reading 1.658 1.646 1.625 1.616 1.648 1.601 1.728 1.6691.540Revere 3.673 3.770 3.919 3.909 3.798 3.871 3.975 4.1163.558Saugus 2.926 2.862 2.935 2.805 2.632 2.668 2.892 2.9062.830Somerville 5.805 6.186 5.672 5.609 5.843 5.521 5.706 5.8155.653So. Hadley Fire District #1 1.070 1.091 1.082 1.074 1.128 1.159 1.209 1.1420.978Southborough 0.984 1.050 1.014 0.956 0.909 0.860 0.973 0.8860.904Stoneham 2.247 2.336 2.573 2.793 2.982 2.785 2.849 2.6871.865Swampscott 1.426 1.431 1.380 1.559 1.459 1.546 1.510 1.3971.473Waltham 6.599 7.077 7.133 6.823 6.855 6.753 7.451 7.3696.400Watertown 2.582 2.553 2.599 2.661 2.606 2.583 2.664 2.5502.547Weston 1.973 1.940 1.919 1.675 1.608 1.599 1.719 1.3681.566Wilbraham 1.166 1.193 1.153 1.112 1.153 1.121 1.174 1.0471.066Winthrop 1.196 1.225 1.312 1.263 1.243 1.241 1.264 1.1821.258Cambridge (Partial) 1.403 0.942 - 5.874 - - - -0.025Canton (Partial) 1.867 1.559 1.068 0.875 1.082 1.560 1.968 2.2921.342Dedham-Westwood W.D. (Partial) 0.198 0.140 0.273 0.039 0.089 0.063 0.046 0.0010.210Lynn (LWSC) (Partial) 0.233 0.690 0.175 0.227 0.172 0.233 0.230 0.1770.330Marlborough (Partial) 3.834 3.570 3.247 3.482 2.969 2.260 3.294 2.2433.883Needham (Partial) 0.703 0.933 0.907 0.787 0.894 1.091 0.802 0.3030.834Northborough (Partial) 0.912 0.906 0.891 0.875 0.882 0.882 0.760 0.7070.893Peabody (Partial) 2.105 1.126 1.257 1.155 0.828 0.509 0.668 0.4421.562Stoughton (Partial) 0.154 0.526 0.979 0.759 0.753 0.632 0.658 0.5440.078Wakefield (Partial) 1.667 1.426 1.505 1.355 1.439 1.360 1.531 1.4361.782Wellesley (Partial) 0.994 1.054 0.820 0.686 1.499 0.789 1.058 0.9061.158
Winchester (Partial) 1.407 1.542 1.042 1.048 0.987 0.928 0.978 0.8191.230Woburn (Partial) 2.627 2.482 2.673 2.383 3.029 2.520 2.317 1.8132.766Worcester (Partial) 2.322 0.001 - - 0.002 - - - 0.000Comm. of Mass. - Fernald (Other) - - 0.015 0.063 0.066 0.060 0.070 0.083-D.C.R. Parks/Pools/Blue Hills (Other) 0.044 0.052 0.058 0.061 0.052 0.047 0.052 0.0500.077MWRA - Deer Island Water (Other) 1.325 1.397 1.279 1.247 1.310 1.448 1.341 1.4181.310Other Reservoir Withdrawals (Other) 2.821 - - - - - 0.160 0.9086.146Quinapoxet Withdrawal (Other) 2.654 7.582 3.824 4.110 6.241 0.530 5.544 -3.192Westboro State Hospital (Other) - - - - 0.014 0.015 0.039 0.121-
Wilmington (Partial) 0.485 0.539 0.456 0.256 0.204 0.084 0.555 0.2060.461
Westboro State Hospital (DYS) (Other)
Source: MWRA metering
0.023 0.024 0.045 0.017 0.017 - - - 0.008
20183.6762.032
63.4184.9483.3685.1311.4163.7785.7525.0470.5495.0881.8044.5872.0382.4200.3238.5112.7718.1061.6103.6002.8525.6361.0340.9342.2201.4616.6002.6401.7391.1071.2240.0001.1980.1340.2694.0740.6380.8903.4870.1021.5411.160
1.1442.4000.000
-0.1031.2756.0015.250
-
0.456
0.024
MASSACHUSETTS WATER RESOURCES AUTHORITY
Schedule of Water FlowsLast Ten Fiscal Years
(million gallons per day)
MASSACHUSETTS WATER RESOURCES AUTHORITYSchedule of Water Flows
Last Ten Fiscal Years(Million gallons per day)

91
MWRA Water Customer 2017 2016 2015 2014 2013 2012 2011 20102019Arlington 3.782 3.907 3.826 3.778 3.933 4.061 4.309 3.8723.573Belmont 2.105 2.187 2.157 2.113 2.169 2.174 2.092 2.1861.990Boston (BWSC) 64.334 64.902 64.567 63.184 64.325 64.395 65.128 65.53062.331Brookline 5.068 5.275 5.500 5.462 5.344 5.078 5.120 5.1104.903Chelsea 3.323 3.283 3.248 3.306 3.121 3.095 3.036 3.0363.278Chicopee 5.122 5.306 5.251 5.285 5.394 5.496 5.457 5.6204.878Clinton 1.433 1.637 1.700 1.719 1.951 1.975 1.896 1.6891.390Everett 3.905 3.883 3.755 3.832 3.902 3.857 4.007 4.1683.710Framingham 5.883 6.017 6.621 6.504 6.542 6.578 6.859 6.4265.669Lexington 5.304 5.377 5.824 5.145 4.961 4.534 4.990 4.5485.034Lynnfield W.D. 0.560 0.522 0.488 0.463 0.415 0.354 0.415 0.3600.488Malden 4.941 5.225 5.684 5.250 5.372 5.524 5.486 5.2525.101Marblehead 1.817 1.839 1.803 1.791 1.715 1.698 1.757 1.7511.654Medford 4.624 4.944 5.059 5.075 4.957 4.835 5.077 4.9944.292Melrose 2.071 2.207 2.323 2.235 2.218 2.144 2.247 2.1011.976Milton 2.578 2.632 2.598 2.394 2.464 2.442 2.383 2.2882.271Nahant 0.390 0.384 0.357 0.331 0.307 0.290 0.311 0.2870.315Newton 8.973 9.986 10.095 9.174 8.858 8.891 8.871 8.4488.540Norwood 2.835 2.776 2.932 2.892 2.736 2.808 3.241 2.9042.662Quincy 8.869 9.209 9.330 9.173 8.933 8.878 9.126 9.0517.894Reading 1.658 1.646 1.625 1.616 1.648 1.601 1.728 1.6691.540Revere 3.673 3.770 3.919 3.909 3.798 3.871 3.975 4.1163.558Saugus 2.926 2.862 2.935 2.805 2.632 2.668 2.892 2.9062.830Somerville 5.805 6.186 5.672 5.609 5.843 5.521 5.706 5.8155.653So. Hadley Fire District #1 1.070 1.091 1.082 1.074 1.128 1.159 1.209 1.1420.978Southborough 0.984 1.050 1.014 0.956 0.909 0.860 0.973 0.8860.904Stoneham 2.247 2.336 2.573 2.793 2.982 2.785 2.849 2.6871.865Swampscott 1.426 1.431 1.380 1.559 1.459 1.546 1.510 1.3971.473Waltham 6.599 7.077 7.133 6.823 6.855 6.753 7.451 7.3696.400Watertown 2.582 2.553 2.599 2.661 2.606 2.583 2.664 2.5502.547Weston 1.973 1.940 1.919 1.675 1.608 1.599 1.719 1.3681.566Wilbraham 1.166 1.193 1.153 1.112 1.153 1.121 1.174 1.0471.066Winthrop 1.196 1.225 1.312 1.263 1.243 1.241 1.264 1.1821.258Cambridge (Partial) 1.403 0.942 - 5.874 - - - -0.025Canton (Partial) 1.867 1.559 1.068 0.875 1.082 1.560 1.968 2.2921.342Dedham-Westwood W.D. (Partial) 0.198 0.140 0.273 0.039 0.089 0.063 0.046 0.0010.210Lynn (LWSC) (Partial) 0.233 0.690 0.175 0.227 0.172 0.233 0.230 0.1770.330Marlborough (Partial) 3.834 3.570 3.247 3.482 2.969 2.260 3.294 2.2433.883Needham (Partial) 0.703 0.933 0.907 0.787 0.894 1.091 0.802 0.3030.834Northborough (Partial) 0.912 0.906 0.891 0.875 0.882 0.882 0.760 0.7070.893Peabody (Partial) 2.105 1.126 1.257 1.155 0.828 0.509 0.668 0.4421.562Stoughton (Partial) 0.154 0.526 0.979 0.759 0.753 0.632 0.658 0.5440.078Wakefield (Partial) 1.667 1.426 1.505 1.355 1.439 1.360 1.531 1.4361.782Wellesley (Partial) 0.994 1.054 0.820 0.686 1.499 0.789 1.058 0.9061.158
Winchester (Partial) 1.407 1.542 1.042 1.048 0.987 0.928 0.978 0.8191.230Woburn (Partial) 2.627 2.482 2.673 2.383 3.029 2.520 2.317 1.8132.766Worcester (Partial) 2.322 0.001 - - 0.002 - - - 0.000Comm. of Mass. - Fernald (Other) - - 0.015 0.063 0.066 0.060 0.070 0.083-D.C.R. Parks/Pools/Blue Hills (Other) 0.044 0.052 0.058 0.061 0.052 0.047 0.052 0.0500.077MWRA - Deer Island Water (Other) 1.325 1.397 1.279 1.247 1.310 1.448 1.341 1.4181.310Other Reservoir Withdrawals (Other) 2.821 - - - - - 0.160 0.9086.146Quinapoxet Withdrawal (Other) 2.654 7.582 3.824 4.110 6.241 0.530 5.544 -3.192Westboro State Hospital (Other) - - - - 0.014 0.015 0.039 0.121-
Wilmington (Partial) 0.485 0.539 0.456 0.256 0.204 0.084 0.555 0.2060.461
Westboro State Hospital (DYS) (Other)
Source: MWRA metering
0.023 0.024 0.045 0.017 0.017 - - - 0.008
20183.6762.032
63.4184.9483.3685.1311.4163.7785.7525.0470.5495.0881.8044.5872.0382.4200.3238.5112.7718.1061.6103.6002.8525.6361.0340.9342.2201.4616.6002.6401.7391.1071.2240.0001.1980.1340.2694.0740.6380.8903.4870.1021.5411.160
1.1442.4000.000
-0.1031.2756.0015.250
-
0.456
0.024
MASSACHUSETTS WATER RESOURCES AUTHORITY
Schedule of Water FlowsLast Ten Fiscal Years
(million gallons per day)

92
System Share 2016 2015 2014 2013 2012 2011 2010 2009 2008Population 2016 2015 2014 2013 2012 2011 2010 2009 2008 2007
Arlington 45,052 44,204 44,212 44,028 43,711 43,290 42,844 41,719 40,993 41,144 Ashland 17,684 17,185 17,191 17,150 16,993 16,767 16,593 15,381 15,807 15,796 Bedford 14,411 14,058 14,086 13,975 13,765 13,455 13,320 13,813 13,545 13,146 Belmont 26,171 25,425 25,431 25,332 25,204 24,987 24,729 23,723 23,291 23,356Boston Water & Sewer Commission 673,184 651,710 649,917 645,966 636,479 625,087 617,594 645,169 620,535 608,352 Braintree 37,297 36,984 36,968 36,727 36,249 35,990 35,744 35,488 35,294 34,422 Brookline 59,126 59,277 59,246 59,128 59,115 59,132 58,732 56,417 54,896 54,809 Burlington 26,351 25,502 25,507 25,463 25,165 24,755 24,498 25,749 24,985 25,034 Cambridge 110,651 107,705 107,732 107,289 106,471 106,038 105,162 108,771 105,596 101,388 Canton 22,952 22,257 22,246 22,221 21,932 21,710 21,561 22,370 22,048 21,916 Chelsea 38,599 37,359 37,881 37,670 36,828 35,649 35,177 37,483 41,577 38,203 Dedham 25,263 25,322 25,346 25,299 24,974 24,895 24,729 24,811 24,630 24,132 Everett 44,840 43,484 43,110 42,935 42,567 42,101 41,667 38,299 37,353 37,269 Framingham 71,594 70,569 70,583 70,441 70,068 68,991 68,318 67,191 64,885 64,786 Hingham Sewer District 7,708 7,370 7,260 7,475 7,279 7,201 7,162 7,863 7,611 7,555 Holbrook 11,022 10,994 10,988 10,952 10,899 10,866 10,791 10,732 10,644 10,663 Lexington 33,410 32,810 32,817 32,650 32,272 31,718 31,394 30,925 30,272 30,332 Malden 60,840 60,776 60,788 60,509 60,374 60,071 59,450 56,146 55,597 55,712 Medford 57,213 57,266 57,385 57,170 57,033 56,738 56,173 55,578 55,573 55,565 Melrose 27,928 27,777 27,810 27,690 27,435 27,263 26,983 27,091 26,708 26,782 Milton 27,351 27,358 27,345 27,270 27,158 27,182 27,003 26,186 26,187 26,272 Natick 36,137 35,326 35,339 35,214 33,760 33,349 33,006 32,335 31,880 31,975 Needham 30,755 29,797 29,785 29,736 29,366 29,083 28,886 29,021 28,560 28,263 Newton 89,045 87,908 87,927 87,971 86,307 85,945 85,146 84,592 82,139 83,271 Norwood 29,097 29,021 29,007 28,951 28,780 28,801 28,602 28,442 28,211 28,172 Quincy 93,688 93,373 93,327 93,494 93,027 92,909 92,271 91,028 92,339 91,622 Randolph 33,610 33,541 33,519 33,456 33,226 32,336 32,112 31,022 30,082 30,168 Reading 25,834 25,397 25,433 25,327 25,192 25,001 24,747 23,509 23,052 23,129 Revere 53,157 53,316 54,063 53,756 53,179 52,459 51,755 51,693 60,204 55,341 Somerville 81,322 78,929 78,857 78,804 77,104 76,519 75,754 76,491 75,662 74,405 Stoneham 21,953 21,803 21,808 21,734 21,605 21,659 21,437 21,558 21,471 21,508 Stoughton 28,431 28,197 28,183 28,106 27,849 27,150 26,962 27,154 26,927 26,951 Wakefield 26,753 26,147 26,182 26,080 25,613 25,191 24,932 25,196 24,717 24,706 Walpole 25,125 24,788 24,776 24,818 24,562 24,234 24,070 23,448 23,133 23,086 Waltham 63,002 62,412 62,424 62,227 61,918 61,181 60,632 60,604 60,236 60,325 Watertown 34,025 33,124 33,130 32,996 32,863 32,248 31,915 33,117 32,365 32,521 Wellesley 29,215 28,897 29,180 29,090 28,748 28,152 27,982 27,398 27,244 26,985 Westwood 15,279 14,904 14,896 14,876 14,768 14,721 14,618 14,322 14,189 14,010 Weymouth 55,972 55,510 55,482 55,419 54,906 54,116 53,743 53,977 53,261 53,272 Wilmington 23,570 23,199 23,204 23,147 22,936 22,557 22,325 22,369 21,649 21,679 Winchester 22,808 22,159 22,166 22,079 21,869 21,594 21,374 21,495 21,090 21,137 Winthrop 18,190 17,979 18,232 18,111 17,940 17,737 17,497 19,235 17,943 20,154 Woburn 39,452 39,162 39,170 39,083 38,949 38,520 38,120 38,983 36,871 37,042
SYSTEM 2,315,067
2017
40,99315,80713,54523,291
620,53535,29454,89624,985105,59622,04841,57724,63037,35364,8857,611
10,64430,27255,59755,57326,70826,18731,88028,56082,13928,21192,33930,08223,05260,20475,66221,47126,92724,71723,13360,23632,36527,24414,18953,26121,64921,09017,94336,871
2,171,252 2,270,281 2,269,939 2,261,815 2,236,438 2,209,348 2,187,510 2,207,894 2,171,252 2,146,356
Arlington 1.95% 1.95% 1.95% 1.95% 1.95% 1.96% 1.96% 1.89% 1.89% Ashland 0.76% 0.76% 0.76% 0.76% 0.76% 0.76% 0.76% 0.70% 0.73% Bedford 0.62% 0.62% 0.62% 0.62% 0.62% 0.61% 0.61% 0.63% 0.62% Belmont 1.13% 1.12% 1.12% 1.12% 1.13% 1.13% 1.13% 1.07% 1.07%Boston Water & Sewer Commision 29.08% 28.71% 28.63% 28.56% 28.46% 28.29% 28.23% 29.22% 28.58% Braintree 1.61% 1.63% 1.63% 1.62% 1.62% 1.63% 1.63% 1.61% 1.63% Brookline 2.55% 2.61% 2.61% 2.61% 2.64% 2.68% 2.68% 2.56% 2.53% Burlington 1.14% 1.12% 1.12% 1.13% 1.13% 1.12% 1.12% 1.17% 1.15% Cambridge 4.78% 4.74% 4.75% 4.74% 4.76% 4.80% 4.81% 4.93% 4.86% Canton 0.99% 0.98% 0.98% 0.98% 0.98% 0.98% 0.99% 1.01% 1.02% Chelsea 1.67% 1.65% 1.67% 1.67% 1.65% 1.61% 1.61% 1.70% 1.91% Dedham 1.09% 1.12% 1.12% 1.12% 1.12% 1.13% 1.13% 1.12% 1.13% Everett 1.94% 1.92% 1.90% 1.90% 1.90% 1.91% 1.90% 1.73% 1.72% Framingham 3.09% 3.11% 3.11% 3.11% 3.13% 3.12% 3.12% 3.04% 2.99% Hingham 0.33% 0.32% 0.32% 0.33% 0.33% 0.33% 0.33% 0.36% 0.35% Holbrook 0.48% 0.48% 0.48% 0.48% 0.49% 0.49% 0.49% 0.49% 0.49% Lexington 1.44% 1.45% 1.45% 1.44% 1.44% 1.44% 1.44% 1.40% 1.39% Malden 2.63% 2.68% 2.68% 2.68% 2.70% 2.72% 2.72% 2.54% 2.56% Medford 2.47% 2.52% 2.53% 2.53% 2.55% 2.57% 2.57% 2.52% 2.56% Melrose 1.21% 1.22% 1.23% 1.22% 1.23% 1.23% 1.23% 1.23% 1.23% Milton 1.18% 1.21% 1.20% 1.21% 1.21% 1.23% 1.23% 1.19% 1.21% Natick 1.56% 1.56% 1.56% 1.56% 1.51% 1.51% 1.51% 1.46% 1.47% Needham 1.33% 1.31% 1.31% 1.31% 1.31% 1.32% 1.32% 1.31% 1.32% Newton 3.85% 3.87% 3.87% 3.89% 3.86% 3.89% 3.89% 3.83% 3.78% Norwood 1.26% 1.28% 1.28% 1.28% 1.29% 1.30% 1.31% 1.29% 1.30% Quincy 4.05% 4.11% 4.11% 4.13% 4.16% 4.21% 4.22% 4.12% 4.25% Randolph 1.45% 1.48% 1.48% 1.48% 1.49% 1.46% 1.47% 1.41% 1.39% Reading 1.12% 1.12% 1.12% 1.12% 1.13% 1.13% 1.13% 1.06% 1.06% Revere 2.30% 2.35% 2.38% 2.38% 2.38% 2.37% 2.37% 2.34% 2.77% Somerville 3.51% 3.48% 3.47% 3.48% 3.45% 3.46% 3.46% 3.46% 3.48% Stoneham 0.95% 0.96% 0.96% 0.96% 0.97% 0.98% 0.98% 0.98% 0.99% Stoughton 1.23% 1.24% 1.24% 1.24% 1.25% 1.23% 1.23% 1.23% 1.24% Wakefield 1.16% 1.15% 1.15% 1.15% 1.15% 1.14% 1.14% 1.14% 1.14% Walpole 1.09% 1.09% 1.09% 1.10% 1.10% 1.10% 1.10% 1.06% 1.07% Waltham 2.72% 2.75% 2.75% 2.75% 2.77% 2.77% 2.77% 2.74% 2.77% Watertown 1.47% 1.46% 1.46% 1.46% 1.47% 1.46% 1.46% 1.50% 1.49% Wellesley 1.26% 1.27% 1.29% 1.29% 1.29% 1.27% 1.28% 1.24% 1.25% Westwood 0.66% 0.66% 0.66% 0.66% 0.66% 0.67% 0.67% 0.65% 0.65% Weymouth 2.42% 2.45% 2.44% 2.45% 2.46% 2.45% 2.46% 2.44% 2.45% Wilmington 1.02% 1.02% 1.02% 1.02% 1.03% 1.02% 1.02% 1.01% 1.00% Winchester 0.99% 0.98% 0.98% 0.98% 0.98% 0.98% 0.98% 0.97% 0.97% Winthrop 0.79% 0.79% 0.80% 0.80% 0.80% 0.80% 0.80% 0.87% 0.83% Woburn 1.70% 1.72% 1.73% 1.73% 1.74% 1.74% 1.74% 1.77% 1.70%
SYSTEM 100.00%
2017
1.89%0.73%0.62%1.07%
28.58%1.63%2.53%1.15%4.86%1.02%1.91%1.13%1.72%2.99%0.35%0.49%1.39%2.56%2.56%1.23%1.21%1.47%1.32%3.78%1.30%4.25%1.39%1.06%2.77%3.48%0.99%1.24%1.14%1.07%2.77%1.49%1.25%0.65%2.45%1.00%0.97%0.83%1.70%
100.00% 100.00% 100.00% 100.00% 100.00% 100.00% 100.00% 100.00% 100.00%
MASSACHUSETTS WATER RESOURCES AUTHORITY
Sewer-System Total Community Population Estimates
Last Ten Calendar Years
MASSACHUSETTS WATER RESOURCES AUTHORITY
Sewer-System Total Community Population Estimates
Last Ten Calendar Years
Source: U.S. Census Bureau
Population Customer Type 2018 2017 2016 2015 2014 2013 2012 2011 2010 2009
Arlington Sewer & Water 45,624 45,510 45,052 44,204 44,212 44,028 43,711 43,290 42,844 41,719Ashland Sewer 17,739 17,706 17,684 17,185 17,191 17,150 16,993 16,767 16,593 15,381Bedford Sewer 14,195 14,197 14,411 14,058 14,086 13,975 13,765 13,455 13,320 13,813Belmont Sewer & Water 26,330 26,458 26,171 25,425 25,431 25,332 25,204 24,987 24,729 23,723Boston Water & Sewer Comm. Sewer & Water 694,583 685,094 673,184 651,710 649,917 645,966 636,479 625,087 617,594 645,169Braintree Sewer 37,250 37,156 37,297 36,984 36,968 36,727 36,249 35,990 35,744 35,488Brookline Sewer & Water 59,310 59,157 59,126 59,277 59,246 59,128 59,115 59,132 58,732 56,417Burlington Sewer 28,742 27,176 26,351 25,502 25,507 25,463 25,165 24,755 24,498 25,749Cambridge Sewer 118,977 113,630 110,651 107,705 107,732 107,289 106,471 106,038 105,162 108,771Canton Sewer & Partial Water 23,629 23,444 22,952 22,257 22,246 22,221 21,932 21,710 21,561 22,370Chelsea Sewer & Water 40,160 40,227 38,599 37,359 37,881 37,670 36,828 35,649 35,177 37,483Chicopee Water 55,582 55,363 55,342 55,789 56,233 55,882 55,795 55,583 55,305 55,220Clinton Water 14,022 13,958 13,873 13,837 13,788 13,748 13,693 13,643 13,624 13,596Dedham Sewer & Partial Water 25,334 25,364 25,263 25,322 25,346 25,299 24,974 24,895 24,729 24,811Everett Sewer & Water 46,880 46,324 44,840 43,484 43,110 42,935 42,567 42,101 41,667 38,299Framingham Sewer & Water 73,123 72,032 71,594 70,569 70,583 70,441 70,068 68,991 68,318 67,191Hingham Sewer District Sewer 7,586 7,611 7,708 7,370 7,260 7,475 7,279 7,201 7,162 7,863Holbrook Sewer 11,048 11,026 11,022 10,994 10,988 10,952 10,899 10,866 10,791 10,732Lexington Sewer & Water 33,792 33,727 33,410 32,810 32,817 32,650 32,272 31,718 31,394 30,925Lynnfield Water 13,041 12,944 12,839 12,765 12,667 12,409 11,821 11,726 11,621 11,535Malden Sewer & Water 61,036 61,246 60,840 60,776 60,788 60,509 60,374 60,071 59,450 56,146Marblehead Water 20,634 20,559 20,467 20,428 20,364 20,256 20,119 19,980 19,854 19,776Marlborough Partial Water 39,825 39,788 39,793 39,799 39,691 39,468 39,305 38,934 38,580 38,187Medford Sewer & Water 57,765 57,797 57,213 57,266 57,385 57,170 57,033 56,738 56,173 55,578Melrose Sewer & Water 28,193 28,367 27,928 27,777 27,810 27,690 27,435 27,263 26,983 27,091Milton Sewer & Water 27,616 27,575 27,351 27,358 27,345 27,270 27,158 27,182 27,003 26,186Nahant Water 3,524 3,506 3,493 3,496 3,483 3,474 3,446 3,432 3,417 3,415Natick Sewer 36,229 36,246 36,137 35,326 35,339 35,214 33,760 33,349 33,006 32,335Needham Sewer & Partial Water 31,248 30,999 30,755 29,797 29,785 29,736 29,366 29,083 28,886 29,021Newton Sewer & Water 88,904 88,994 89,045 87,908 87,927 87,971 86,307 85,945 85,146 84,592Northborough Partial Water 15,101 15,038 14,962 14,944 14,905 14,749 14,646 14,664 14,397 14,148Norwood Sewer & Water 29,327 29,195 29,097 29,021 29,007 28,951 28,780 28,801 28,602 28,442Peabody Partial Water 53,278 53,008 52,809 52,661 52,489 52,243 51,913 51,633 51,403 50,844Quincy Sewer & Water 94,580 94,166 93,688 93,373 93,327 93,494 93,027 92,909 92,271 91,028Randolph Sewer 34,398 34,272 33,610 33,541 33,519 33,456 33,226 32,336 32,112 31,022Reading Sewer & Water 25,337 26,106 25,834 25,397 25,433 25,327 25,192 25,001 24,747 23,509Revere Sewer & Water 53,821 53,993 53,157 53,316 54,063 53,756 53,179 52,459 51,755 51,693Saugus Water 28,385 28,265 28,125 28,080 27,976 27,826 27,387 27,047 26,730 26,493Somerville Sewer & Water 81,562 81,360 81,322 78,929 78,857 78,804 77,104 76,519 75,754 76,491South Hadley Fire District #1 Water 17,806 17,836 17,765 17,625 17,712 17,715 17,834 17,817 17,726 17,504Southborough Water 10,169 10,138 10,087 10,015 9,936 9,894 9,851 9,816 9,775 9,695Stoneham Sewer & Water 22,729 22,036 21,953 21,803 21,808 21,734 21,605 21,659 21,437 21,558Stoughton Sewer & Partial Water 28,950 28,528 28,431 28,197 28,183 28,106 27,849 27,150 26,962 27,154Swampscott Water 15,227 14,976 14,898 14,564 14,085 14,025 13,949 13,874 13,807 13,783Wakefield Sewer & Partial Water 27,135 27,157 26,753 26,147 26,182 26,080 25,613 25,191 24,932 25,196Walpole Sewer 25,209 25,073 25,125 24,788 24,776 24,818 24,562 24,234 24,070 23,448Waltham Sewer & Water 62,962 62,442 63,002 62,412 62,424 62,227 61,918 61,181 60,632 60,604Watertown Sewer & Water 35,954 35,756 34,025 33,124 33,130 32,996 32,863 32,248 31,915 33,117Wellesley Sewer & Partial Water 29,673 29,479 29,215 28,897 29,180 29,090 28,748 28,152 27,982 27,398Weston Water 12,134 12,119 12,100 12,066 11,921 11,845 11,698 11,515 11,370 11,241Westwood Sewer & Partial Water 16,127 16,056 15,279 14,904 14,896 14,876 14,768 14,721 14,618 14,322Weymouth Sewer 57,719 56,664 55,972 55,510 55,482 55,419 54,906 54,116 53,743 53,977Wilbraham Water 14,749 14,625 14,588 14,573 14,477 14,432 14,366 14,311 14,226 14,161Wilmington Sewer & Partial Water 23,907 23,803 23,570 23,199 23,204 23,147 22,936 22,557 22,325 22,369Winchester Sewer & Partial Water 22,851 22,838 22,808 22,159 22,166 22,079 21,869 21,594 21,374 21,495Winthrop Sewer & Water 18,688 18,625 18,190 17,979 18,232 18,111 17,940 17,737 17,497 19,235Woburn Sewer & Partial Water
Sewer & WaterSewer Sewer Sewer & WaterSewer & WaterSewer Sewer & WaterSewer Sewer Sewer & Partial WaterSewer & WaterWaterWaterSewer & Partial WaterSewer & WaterSewer & WaterSewer Sewer Sewer & WaterWaterSewer & WaterWaterPartial WaterSewer & WaterSewer & WaterSewer & WaterWaterSewer Sewer & Partial WaterSewer & WaterPartial WaterSewer & WaterPartial WaterSewer & WaterSewer Sewer & WaterSewer & WaterWaterSewer & WaterWaterWaterSewer & WaterSewer & Partial WaterWaterSewer & Partial WaterSewer Sewer & WaterSewer & WaterSewer & Partial WaterWaterSewer & Partial WaterSewer WaterSewer & Partial WaterSewer & Partial WaterSewer & WaterSewer & Partial Water
40,397 39,701 39,452 39,162 39,170 39,083 38,949 38,520 38,120 38,983
SYSTEM 2,680,096 2,656,436 2,626,208 2,580,923 2,579,666 2,569,781 2,542,261 2,513,323 2,489,345 2,507,492
System Share Customer Type 2018 2017 2016 2015 2014 2013 2012 2011 2010 2009
Arlington 1.70% 1.71% 1.72% 1.71% 1.71% 1.71% 1.72% 1.72% 1.72% 1.66%Ashland 0.66% 0.67% 0.67% 0.67% 0.67% 0.67% 0.67% 0.67% 0.67% 0.61%Bedford 0.53% 0.53% 0.55% 0.54% 0.55% 0.54% 0.54% 0.54% 0.54% 0.55%Belmont 0.98% 1.00% 1.00% 0.99% 0.99% 0.99% 0.99% 0.99% 0.99% 0.95%Boston Water & Sewer Comm. 25.92% 25.79% 25.63% 25.25% 25.19% 25.14% 25.04% 24.87% 24.81% 25.73%Braintree 1.39% 1.40% 1.42% 1.43% 1.43% 1.43% 1.43% 1.43% 1.44% 1.42%Brookline 2.21% 2.23% 2.25% 2.30% 2.30% 2.30% 2.33% 2.35% 2.36% 2.25%Burlington 1.07% 1.02% 1.00% 0.99% 0.99% 0.99% 0.99% 0.98% 0.98% 1.03%Cambridge 4.44% 4.28% 4.21% 4.17% 4.18% 4.18% 4.19% 4.22% 4.22% 4.34%Canton 0.88% 0.88% 0.87% 0.86% 0.86% 0.86% 0.86% 0.86% 0.87% 0.89%Chelsea 1.50% 1.51% 1.47% 1.45% 1.47% 1.47% 1.45% 1.42% 1.41% 1.49%Chicopee 2.07% 2.08% 2.11% 2.16% 2.18% 2.17% 2.19% 2.21% 2.22% 2.20%Clinton 0.52% 0.53% 0.53% 0.54% 0.53% 0.53% 0.54% 0.54% 0.55% 0.54%Dedham 0.95% 0.95% 0.96% 0.98% 0.98% 0.98% 0.98% 0.99% 0.99% 0.99%Everett 1.75% 1.74% 1.71% 1.68% 1.67% 1.67% 1.67% 1.68% 1.67% 1.53%Framingham 2.73% 2.71% 2.73% 2.73% 2.74% 2.74% 2.76% 2.75% 2.74% 2.68%Hingham Sewer District 0.28% 0.29% 0.29% 0.29% 0.28% 0.29% 0.29% 0.29% 0.29% 0.31%Holbrook 0.41% 0.42% 0.42% 0.43% 0.43% 0.43% 0.43% 0.43% 0.43% 0.43%Lexington 1.26% 1.27% 1.27% 1.27% 1.27% 1.27% 1.27% 1.26% 1.26% 1.23%Lynnfield 0.49% 0.49% 0.49% 0.49% 0.49% 0.48% 0.46% 0.47% 0.47% 0.46%Malden 2.28% 2.31% 2.32% 2.35% 2.36% 2.35% 2.37% 2.39% 2.39% 2.24%Marblehead 0.77% 0.77% 0.78% 0.79% 0.79% 0.79% 0.79% 0.79% 0.80% 0.79%Marlborough 1.49% 1.50% 1.52% 1.54% 1.54% 1.54% 1.55% 1.55% 1.55% 1.52%Medford 2.16% 2.18% 2.18% 2.22% 2.22% 2.22% 2.24% 2.26% 2.26% 2.22%Melrose 1.05% 1.07% 1.06% 1.08% 1.08% 1.08% 1.08% 1.08% 1.08% 1.08%Milton 1.03% 1.04% 1.04% 1.06% 1.06% 1.06% 1.07% 1.08% 1.08% 1.04%Nahant 0.13% 0.13% 0.13% 0.14% 0.14% 0.14% 0.14% 0.14% 0.14% 0.14%Natick 1.35% 1.36% 1.38% 1.37% 1.37% 1.37% 1.33% 1.33% 1.33% 1.29%Needham 1.17% 1.17% 1.17% 1.15% 1.15% 1.16% 1.16% 1.16% 1.16% 1.16%Newton 3.32% 3.35% 3.39% 3.41% 3.41% 3.42% 3.39% 3.42% 3.42% 3.37%Northborough 0.56% 0.57% 0.57% 0.58% 0.58% 0.57% 0.58% 0.58% 0.58% 0.56%Norwood 1.09% 1.10% 1.11% 1.12% 1.12% 1.13% 1.13% 1.15% 1.15% 1.13%Peabody 1.99% 2.00% 2.01% 2.04% 2.03% 2.03% 2.04% 2.05% 2.06% 2.03%Quincy 3.53% 3.54% 3.57% 3.62% 3.62% 3.64% 3.66% 3.70% 3.71% 3.63%Randolph 1.28% 1.29% 1.28% 1.30% 1.30% 1.30% 1.31% 1.29% 1.29% 1.24%Reading 0.95% 0.98% 0.98% 0.98% 0.99% 0.99% 0.99% 0.99% 0.99% 0.94%Revere 2.01% 2.03% 2.02% 2.07% 2.10% 2.09% 2.09% 2.09% 2.08% 2.06%Saugus 1.06% 1.06% 1.07% 1.09% 1.08% 1.08% 1.08% 1.08% 1.07% 1.06%Somerville 3.04% 3.06% 3.10% 3.06% 3.06% 3.07% 3.03% 3.04% 3.04% 3.05%South Hadley Fire District #1 0.66% 0.67% 0.68% 0.68% 0.69% 0.69% 0.70% 0.71% 0.71% 0.70%Southborough 0.38% 0.38% 0.38% 0.39% 0.39% 0.39% 0.39% 0.39% 0.39% 0.39%Stoneham 0.85% 0.83% 0.84% 0.84% 0.85% 0.85% 0.85% 0.86% 0.86% 0.86%Stoughton 1.08% 1.07% 1.08% 1.09% 1.09% 1.09% 1.10% 1.08% 1.08% 1.08%Swampscott 0.57% 0.56% 0.57% 0.56% 0.55% 0.55% 0.55% 0.55% 0.55% 0.55%Wakefield 1.01% 1.02% 1.02% 1.01% 1.01% 1.01% 1.01% 1.00% 1.00% 1.00%Walpole 0.94% 0.94% 0.96% 0.96% 0.96% 0.97% 0.97% 0.96% 0.97% 0.94%Waltham 2.35% 2.35% 2.40% 2.42% 2.42% 2.42% 2.44% 2.43% 2.44% 2.42%Watertown 1.34% 1.35% 1.30% 1.28% 1.28% 1.28% 1.29% 1.28% 1.28% 1.32%Wellesley 1.11% 1.11% 1.11% 1.12% 1.13% 1.13% 1.13% 1.12% 1.12% 1.09%Weston 0.45% 0.46% 0.46% 0.47% 0.46% 0.46% 0.46% 0.46% 0.46% 0.45%Westwood 0.60% 0.60% 0.58% 0.58% 0.58% 0.58% 0.58% 0.59% 0.59% 0.57%Weymouth 2.15% 2.13% 2.13% 2.15% 2.15% 2.16% 2.16% 2.15% 2.16% 2.15%Wilbraham 0.55% 0.55% 0.56% 0.56% 0.56% 0.56% 0.57% 0.57% 0.57% 0.56%Wilmington 0.89% 0.90% 0.90% 0.90% 0.90% 0.90% 0.90% 0.90% 0.90% 0.89%Winchester 0.85% 0.86% 0.87% 0.86% 0.86% 0.86% 0.86% 0.86% 0.86% 0.86%Winthrop 0.70% 0.70% 0.69% 0.70% 0.71% 0.70% 0.71% 0.71% 0.70% 0.77%Woburn 1.51% 1.49% 1.50% 1.52% 1.52% 1.52% 1.53% 1.53% 1.53% 1.55%
SYSTEM 100% 100% 100% 100% 100% 100% 100% 100% 100% 100%
MASSACHUSETTS WATER RESOURCES AUTHORITYSewer-System Total
Community Population EstimatesLast Ten Calendar Years
Source: U.S. Census Bureau

93
Population Customer Type 2018 2017 2016 2015 2014 2013 2012 2011 2010 2009
Arlington Sewer & Water 45,624 45,510 45,052 44,204 44,212 44,028 43,711 43,290 42,844 41,719Ashland Sewer 17,739 17,706 17,684 17,185 17,191 17,150 16,993 16,767 16,593 15,381Bedford Sewer 14,195 14,197 14,411 14,058 14,086 13,975 13,765 13,455 13,320 13,813Belmont Sewer & Water 26,330 26,458 26,171 25,425 25,431 25,332 25,204 24,987 24,729 23,723Boston Water & Sewer Comm. Sewer & Water 694,583 685,094 673,184 651,710 649,917 645,966 636,479 625,087 617,594 645,169Braintree Sewer 37,250 37,156 37,297 36,984 36,968 36,727 36,249 35,990 35,744 35,488Brookline Sewer & Water 59,310 59,157 59,126 59,277 59,246 59,128 59,115 59,132 58,732 56,417Burlington Sewer 28,742 27,176 26,351 25,502 25,507 25,463 25,165 24,755 24,498 25,749Cambridge Sewer 118,977 113,630 110,651 107,705 107,732 107,289 106,471 106,038 105,162 108,771Canton Sewer & Partial Water 23,629 23,444 22,952 22,257 22,246 22,221 21,932 21,710 21,561 22,370Chelsea Sewer & Water 40,160 40,227 38,599 37,359 37,881 37,670 36,828 35,649 35,177 37,483Chicopee Water 55,582 55,363 55,342 55,789 56,233 55,882 55,795 55,583 55,305 55,220Clinton Water 14,022 13,958 13,873 13,837 13,788 13,748 13,693 13,643 13,624 13,596Dedham Sewer & Partial Water 25,334 25,364 25,263 25,322 25,346 25,299 24,974 24,895 24,729 24,811Everett Sewer & Water 46,880 46,324 44,840 43,484 43,110 42,935 42,567 42,101 41,667 38,299Framingham Sewer & Water 73,123 72,032 71,594 70,569 70,583 70,441 70,068 68,991 68,318 67,191Hingham Sewer District Sewer 7,586 7,611 7,708 7,370 7,260 7,475 7,279 7,201 7,162 7,863Holbrook Sewer 11,048 11,026 11,022 10,994 10,988 10,952 10,899 10,866 10,791 10,732Lexington Sewer & Water 33,792 33,727 33,410 32,810 32,817 32,650 32,272 31,718 31,394 30,925Lynnfield Water 13,041 12,944 12,839 12,765 12,667 12,409 11,821 11,726 11,621 11,535Malden Sewer & Water 61,036 61,246 60,840 60,776 60,788 60,509 60,374 60,071 59,450 56,146Marblehead Water 20,634 20,559 20,467 20,428 20,364 20,256 20,119 19,980 19,854 19,776Marlborough Partial Water 39,825 39,788 39,793 39,799 39,691 39,468 39,305 38,934 38,580 38,187Medford Sewer & Water 57,765 57,797 57,213 57,266 57,385 57,170 57,033 56,738 56,173 55,578Melrose Sewer & Water 28,193 28,367 27,928 27,777 27,810 27,690 27,435 27,263 26,983 27,091Milton Sewer & Water 27,616 27,575 27,351 27,358 27,345 27,270 27,158 27,182 27,003 26,186Nahant Water 3,524 3,506 3,493 3,496 3,483 3,474 3,446 3,432 3,417 3,415Natick Sewer 36,229 36,246 36,137 35,326 35,339 35,214 33,760 33,349 33,006 32,335Needham Sewer & Partial Water 31,248 30,999 30,755 29,797 29,785 29,736 29,366 29,083 28,886 29,021Newton Sewer & Water 88,904 88,994 89,045 87,908 87,927 87,971 86,307 85,945 85,146 84,592Northborough Partial Water 15,101 15,038 14,962 14,944 14,905 14,749 14,646 14,664 14,397 14,148Norwood Sewer & Water 29,327 29,195 29,097 29,021 29,007 28,951 28,780 28,801 28,602 28,442Peabody Partial Water 53,278 53,008 52,809 52,661 52,489 52,243 51,913 51,633 51,403 50,844Quincy Sewer & Water 94,580 94,166 93,688 93,373 93,327 93,494 93,027 92,909 92,271 91,028Randolph Sewer 34,398 34,272 33,610 33,541 33,519 33,456 33,226 32,336 32,112 31,022Reading Sewer & Water 25,337 26,106 25,834 25,397 25,433 25,327 25,192 25,001 24,747 23,509Revere Sewer & Water 53,821 53,993 53,157 53,316 54,063 53,756 53,179 52,459 51,755 51,693Saugus Water 28,385 28,265 28,125 28,080 27,976 27,826 27,387 27,047 26,730 26,493Somerville Sewer & Water 81,562 81,360 81,322 78,929 78,857 78,804 77,104 76,519 75,754 76,491South Hadley Fire District #1 Water 17,806 17,836 17,765 17,625 17,712 17,715 17,834 17,817 17,726 17,504Southborough Water 10,169 10,138 10,087 10,015 9,936 9,894 9,851 9,816 9,775 9,695Stoneham Sewer & Water 22,729 22,036 21,953 21,803 21,808 21,734 21,605 21,659 21,437 21,558Stoughton Sewer & Partial Water 28,950 28,528 28,431 28,197 28,183 28,106 27,849 27,150 26,962 27,154Swampscott Water 15,227 14,976 14,898 14,564 14,085 14,025 13,949 13,874 13,807 13,783Wakefield Sewer & Partial Water 27,135 27,157 26,753 26,147 26,182 26,080 25,613 25,191 24,932 25,196Walpole Sewer 25,209 25,073 25,125 24,788 24,776 24,818 24,562 24,234 24,070 23,448Waltham Sewer & Water 62,962 62,442 63,002 62,412 62,424 62,227 61,918 61,181 60,632 60,604Watertown Sewer & Water 35,954 35,756 34,025 33,124 33,130 32,996 32,863 32,248 31,915 33,117Wellesley Sewer & Partial Water 29,673 29,479 29,215 28,897 29,180 29,090 28,748 28,152 27,982 27,398Weston Water 12,134 12,119 12,100 12,066 11,921 11,845 11,698 11,515 11,370 11,241Westwood Sewer & Partial Water 16,127 16,056 15,279 14,904 14,896 14,876 14,768 14,721 14,618 14,322Weymouth Sewer 57,719 56,664 55,972 55,510 55,482 55,419 54,906 54,116 53,743 53,977Wilbraham Water 14,749 14,625 14,588 14,573 14,477 14,432 14,366 14,311 14,226 14,161Wilmington Sewer & Partial Water 23,907 23,803 23,570 23,199 23,204 23,147 22,936 22,557 22,325 22,369Winchester Sewer & Partial Water 22,851 22,838 22,808 22,159 22,166 22,079 21,869 21,594 21,374 21,495Winthrop Sewer & Water 18,688 18,625 18,190 17,979 18,232 18,111 17,940 17,737 17,497 19,235Woburn Sewer & Partial Water
Sewer & WaterSewer Sewer Sewer & WaterSewer & WaterSewer Sewer & WaterSewer Sewer Sewer & Partial WaterSewer & WaterWaterWaterSewer & Partial WaterSewer & WaterSewer & WaterSewer Sewer Sewer & WaterWaterSewer & WaterWaterPartial WaterSewer & WaterSewer & WaterSewer & WaterWaterSewer Sewer & Partial WaterSewer & WaterPartial WaterSewer & WaterPartial WaterSewer & WaterSewer Sewer & WaterSewer & WaterWaterSewer & WaterWaterWaterSewer & WaterSewer & Partial WaterWaterSewer & Partial WaterSewer Sewer & WaterSewer & WaterSewer & Partial WaterWaterSewer & Partial WaterSewer WaterSewer & Partial WaterSewer & Partial WaterSewer & WaterSewer & Partial Water
40,397 39,701 39,452 39,162 39,170 39,083 38,949 38,520 38,120 38,983
SYSTEM 2,680,096 2,656,436 2,626,208 2,580,923 2,579,666 2,569,781 2,542,261 2,513,323 2,489,345 2,507,492
System Share Customer Type 2018 2017 2016 2015 2014 2013 2012 2011 2010 2009
Arlington 1.70% 1.71% 1.72% 1.71% 1.71% 1.71% 1.72% 1.72% 1.72% 1.66%Ashland 0.66% 0.67% 0.67% 0.67% 0.67% 0.67% 0.67% 0.67% 0.67% 0.61%Bedford 0.53% 0.53% 0.55% 0.54% 0.55% 0.54% 0.54% 0.54% 0.54% 0.55%Belmont 0.98% 1.00% 1.00% 0.99% 0.99% 0.99% 0.99% 0.99% 0.99% 0.95%Boston Water & Sewer Comm. 25.92% 25.79% 25.63% 25.25% 25.19% 25.14% 25.04% 24.87% 24.81% 25.73%Braintree 1.39% 1.40% 1.42% 1.43% 1.43% 1.43% 1.43% 1.43% 1.44% 1.42%Brookline 2.21% 2.23% 2.25% 2.30% 2.30% 2.30% 2.33% 2.35% 2.36% 2.25%Burlington 1.07% 1.02% 1.00% 0.99% 0.99% 0.99% 0.99% 0.98% 0.98% 1.03%Cambridge 4.44% 4.28% 4.21% 4.17% 4.18% 4.18% 4.19% 4.22% 4.22% 4.34%Canton 0.88% 0.88% 0.87% 0.86% 0.86% 0.86% 0.86% 0.86% 0.87% 0.89%Chelsea 1.50% 1.51% 1.47% 1.45% 1.47% 1.47% 1.45% 1.42% 1.41% 1.49%Chicopee 2.07% 2.08% 2.11% 2.16% 2.18% 2.17% 2.19% 2.21% 2.22% 2.20%Clinton 0.52% 0.53% 0.53% 0.54% 0.53% 0.53% 0.54% 0.54% 0.55% 0.54%Dedham 0.95% 0.95% 0.96% 0.98% 0.98% 0.98% 0.98% 0.99% 0.99% 0.99%Everett 1.75% 1.74% 1.71% 1.68% 1.67% 1.67% 1.67% 1.68% 1.67% 1.53%Framingham 2.73% 2.71% 2.73% 2.73% 2.74% 2.74% 2.76% 2.75% 2.74% 2.68%Hingham Sewer District 0.28% 0.29% 0.29% 0.29% 0.28% 0.29% 0.29% 0.29% 0.29% 0.31%Holbrook 0.41% 0.42% 0.42% 0.43% 0.43% 0.43% 0.43% 0.43% 0.43% 0.43%Lexington 1.26% 1.27% 1.27% 1.27% 1.27% 1.27% 1.27% 1.26% 1.26% 1.23%Lynnfield 0.49% 0.49% 0.49% 0.49% 0.49% 0.48% 0.46% 0.47% 0.47% 0.46%Malden 2.28% 2.31% 2.32% 2.35% 2.36% 2.35% 2.37% 2.39% 2.39% 2.24%Marblehead 0.77% 0.77% 0.78% 0.79% 0.79% 0.79% 0.79% 0.79% 0.80% 0.79%Marlborough 1.49% 1.50% 1.52% 1.54% 1.54% 1.54% 1.55% 1.55% 1.55% 1.52%Medford 2.16% 2.18% 2.18% 2.22% 2.22% 2.22% 2.24% 2.26% 2.26% 2.22%Melrose 1.05% 1.07% 1.06% 1.08% 1.08% 1.08% 1.08% 1.08% 1.08% 1.08%Milton 1.03% 1.04% 1.04% 1.06% 1.06% 1.06% 1.07% 1.08% 1.08% 1.04%Nahant 0.13% 0.13% 0.13% 0.14% 0.14% 0.14% 0.14% 0.14% 0.14% 0.14%Natick 1.35% 1.36% 1.38% 1.37% 1.37% 1.37% 1.33% 1.33% 1.33% 1.29%Needham 1.17% 1.17% 1.17% 1.15% 1.15% 1.16% 1.16% 1.16% 1.16% 1.16%Newton 3.32% 3.35% 3.39% 3.41% 3.41% 3.42% 3.39% 3.42% 3.42% 3.37%Northborough 0.56% 0.57% 0.57% 0.58% 0.58% 0.57% 0.58% 0.58% 0.58% 0.56%Norwood 1.09% 1.10% 1.11% 1.12% 1.12% 1.13% 1.13% 1.15% 1.15% 1.13%Peabody 1.99% 2.00% 2.01% 2.04% 2.03% 2.03% 2.04% 2.05% 2.06% 2.03%Quincy 3.53% 3.54% 3.57% 3.62% 3.62% 3.64% 3.66% 3.70% 3.71% 3.63%Randolph 1.28% 1.29% 1.28% 1.30% 1.30% 1.30% 1.31% 1.29% 1.29% 1.24%Reading 0.95% 0.98% 0.98% 0.98% 0.99% 0.99% 0.99% 0.99% 0.99% 0.94%Revere 2.01% 2.03% 2.02% 2.07% 2.10% 2.09% 2.09% 2.09% 2.08% 2.06%Saugus 1.06% 1.06% 1.07% 1.09% 1.08% 1.08% 1.08% 1.08% 1.07% 1.06%Somerville 3.04% 3.06% 3.10% 3.06% 3.06% 3.07% 3.03% 3.04% 3.04% 3.05%South Hadley Fire District #1 0.66% 0.67% 0.68% 0.68% 0.69% 0.69% 0.70% 0.71% 0.71% 0.70%Southborough 0.38% 0.38% 0.38% 0.39% 0.39% 0.39% 0.39% 0.39% 0.39% 0.39%Stoneham 0.85% 0.83% 0.84% 0.84% 0.85% 0.85% 0.85% 0.86% 0.86% 0.86%Stoughton 1.08% 1.07% 1.08% 1.09% 1.09% 1.09% 1.10% 1.08% 1.08% 1.08%Swampscott 0.57% 0.56% 0.57% 0.56% 0.55% 0.55% 0.55% 0.55% 0.55% 0.55%Wakefield 1.01% 1.02% 1.02% 1.01% 1.01% 1.01% 1.01% 1.00% 1.00% 1.00%Walpole 0.94% 0.94% 0.96% 0.96% 0.96% 0.97% 0.97% 0.96% 0.97% 0.94%Waltham 2.35% 2.35% 2.40% 2.42% 2.42% 2.42% 2.44% 2.43% 2.44% 2.42%Watertown 1.34% 1.35% 1.30% 1.28% 1.28% 1.28% 1.29% 1.28% 1.28% 1.32%Wellesley 1.11% 1.11% 1.11% 1.12% 1.13% 1.13% 1.13% 1.12% 1.12% 1.09%Weston 0.45% 0.46% 0.46% 0.47% 0.46% 0.46% 0.46% 0.46% 0.46% 0.45%Westwood 0.60% 0.60% 0.58% 0.58% 0.58% 0.58% 0.58% 0.59% 0.59% 0.57%Weymouth 2.15% 2.13% 2.13% 2.15% 2.15% 2.16% 2.16% 2.15% 2.16% 2.15%Wilbraham 0.55% 0.55% 0.56% 0.56% 0.56% 0.56% 0.57% 0.57% 0.57% 0.56%Wilmington 0.89% 0.90% 0.90% 0.90% 0.90% 0.90% 0.90% 0.90% 0.90% 0.89%Winchester 0.85% 0.86% 0.87% 0.86% 0.86% 0.86% 0.86% 0.86% 0.86% 0.86%Winthrop 0.70% 0.70% 0.69% 0.70% 0.71% 0.70% 0.71% 0.71% 0.70% 0.77%Woburn 1.51% 1.49% 1.50% 1.52% 1.52% 1.52% 1.53% 1.53% 1.53% 1.55%
SYSTEM 100% 100% 100% 100% 100% 100% 100% 100% 100% 100%
MASSACHUSETTS WATER RESOURCES AUTHORITYSewer-System Total
Community Population EstimatesLast Ten Calendar Years

94
Division FTE Vacancy FTE Vacancy FTE Vacancy FTE Vacancy FTE Vacancy FTE Vacancy FTE Vacancy FTE VacancyFTE VacancyRate Rate Rate Rate Rate Rate Rate RateRate
Executive 5.0 0.00% 5.0 0.00% 5.0 0.00% 5.0 0.00% 5.0 0.00% 5.0 0.00% 4.0 0.00% 4.0 0.00%4.0 20.00%Internal Audit 6.7 12.50% 6.7 12.50% 6.7 12.50% 7.5 0.00% 7.5 0.00% 7.5 0.00% 7.5 0.00% 7.2 0.00%5.7 25.00%Public Affairs 11.9 7.69% 12.9 7.14% 12.9 7.69% 11.9 7.69% 12.9 0.00% 12.9 0.00% 13.9 0.00% 14.9 0.00%9.9 28.57%Affirmative Action 4.0 33.33% 6.0 0.00% 5.0 33.33% 6.0 14.29% 7.0 0.00% 6.8 12.50% 7.0 12.50% 8.0 0.00%5.0 28.57%Emergency Preparedness 8.0 0.00% 5.8 0.00% 4.8 0.00% 5.8 0.00% 4.8 0.00% 3.8 0.00% 4.8 0.00% 3.8 0.00%4.0 0.00%
Finance 35.5 14.29% 37.5 11.63% 38.3 9.30% 39.3 4.65% 39.3 6.98% 41.3 4.55% 42.3 2.27% 43.2 2.22%31.5 23.81%Operations 930.0 7.35% 922.7 6.93% 925.1 7.35% 917.2 7.55% 935.1 4.96% 939.8 4.77% 949.4 3.35% 955.0 4.68%922.8 8.51%Law 13.5 26.32% 15.5 15.79% 14.5 26.32% 14.9 15.79% 15.1 15.79% 16.1 10.53% 17.1 5.26% 17.1 10.00%12.5 31.58%Administration 135.4 12.26% 138.0 10.32% 138.0 9.74% 136.6 9.03% 139.6 8.97% 144.8 5.77% 147.4 3.85% 147.1 7.41%136.8 15.63%
2011 20102019 2017
FTE VacancyRate
4.0 20.00%6.7 12.50%
10.9 15.38%6.0 0.00%8.0 0.00%
Tunnel Redundancy - - - - - - - - 7.0 0.00% 1.0 0.00%33.5 19.05%
923.3 8.70%13.5 26.32%
135.5 13.46%
2018 2016 2015 2014 2013 2012
MASSACHUSETTS WATER RESOURCES AUTHORITY
Full-time Equivalent Employees by FunctionLast Ten Fiscal Years
MASSACHUSETTS WATER RESOURCES AUTHORITYFull-time Equivalent Employees by Function
Last Ten Fiscal Years

95
Division FTE Vacancy FTE Vacancy FTE Vacancy FTE Vacancy FTE Vacancy FTE Vacancy FTE Vacancy FTE VacancyFTE VacancyRate Rate Rate Rate Rate Rate Rate RateRate
Executive 5.0 0.00% 5.0 0.00% 5.0 0.00% 5.0 0.00% 5.0 0.00% 5.0 0.00% 4.0 0.00% 4.0 0.00%4.0 20.00%Internal Audit 6.7 12.50% 6.7 12.50% 6.7 12.50% 7.5 0.00% 7.5 0.00% 7.5 0.00% 7.5 0.00% 7.2 0.00%5.7 25.00%Public Affairs 11.9 7.69% 12.9 7.14% 12.9 7.69% 11.9 7.69% 12.9 0.00% 12.9 0.00% 13.9 0.00% 14.9 0.00%9.9 28.57%Affirmative Action 4.0 33.33% 6.0 0.00% 5.0 33.33% 6.0 14.29% 7.0 0.00% 6.8 12.50% 7.0 12.50% 8.0 0.00%5.0 28.57%Emergency Preparedness 8.0 0.00% 5.8 0.00% 4.8 0.00% 5.8 0.00% 4.8 0.00% 3.8 0.00% 4.8 0.00% 3.8 0.00%4.0 0.00%
Finance 35.5 14.29% 37.5 11.63% 38.3 9.30% 39.3 4.65% 39.3 6.98% 41.3 4.55% 42.3 2.27% 43.2 2.22%31.5 23.81%Operations 930.0 7.35% 922.7 6.93% 925.1 7.35% 917.2 7.55% 935.1 4.96% 939.8 4.77% 949.4 3.35% 955.0 4.68%922.8 8.51%Law 13.5 26.32% 15.5 15.79% 14.5 26.32% 14.9 15.79% 15.1 15.79% 16.1 10.53% 17.1 5.26% 17.1 10.00%12.5 31.58%Administration 135.4 12.26% 138.0 10.32% 138.0 9.74% 136.6 9.03% 139.6 8.97% 144.8 5.77% 147.4 3.85% 147.1 7.41%136.8 15.63%
2011 20102019 2017
FTE VacancyRate
4.0 20.00%6.7 12.50%
10.9 15.38%6.0 0.00%8.0 0.00%
Tunnel Redundancy - - - - - - - - 7.0 0.00% 1.0 0.00%33.5 19.05%
923.3 8.70%13.5 26.32%
135.5 13.46%
2018 2016 2015 2014 2013 2012
MASSACHUSETTS WATER RESOURCES AUTHORITY
Full-time Equivalent Employees by FunctionLast Ten Fiscal Years

96
MASSACHUSETTS WATER RESOURCES AUTHORITYCapital Asset Statistics by Function
WATER SYSTEM
◆ 2 protected reservoirs - Quabbin - Wachusett◆ 2 water treatment facilities - John J. Carroll - William A. Brutsch◆ 350 miles of distribution infrastructure, including aqueducts, deep rock tunnels, and pipeline◆ 14 active storage reservoirs and standpipes◆ 11 active pumping stations◆ Average Daily flow: 200 mgd◆ Safe yield: 300 mgd◆ Treatment Capacity: 405 mgd◆ Percentage of capacity utilized: 67%*
*based on safe yield
WASTEWATER SYSTEM
◆ 240 miles of sewer pipelines and cross-harbor tunnels◆ 13 pump stations◆ 1 screening facility ◆ 1 gate house◆ 6 CSO treatment/storage facilities◆ 2 wastewater treatment plants - Deer Island Treatment Plant - Clinton Advanced Wastewater Treatment Plant◆ 4 remote headworks◆ 1 Pellet Plant residuals processing◆ Average daily flow: 365 mgd◆ Peak wet weather capacity: 1,270 mgd◆ Percentage of capacity utilized on average: 30%
Southern Extra High Pipeline, Boston
Deer Island Gravity Thickener Rehabilitation

97

98
Massachusetts Water Resources AuthorityCharlestown Navy Yard
Building 39Boston, MA 02129
617.242.6000www.mwra.com