city of cambridge, massachusetts comprehensive annual
TRANSCRIPT

C i t y o f C a m b r i d g e , M a s s a c h u s e t t s
C o m p r e h e n s i v e A n n u a l F i n a n c i a l R e p o r t
J u l y 1 , 2 0 1 0 – J u n e 3 0 , 2 0 1 1

CITY OF CAMBRIDGE, MASSACHUSETTS
COMPREHENSIVE
ANNUAL FINANCIAL REPORT
Fiscal Year
July 1, 2010 through June 30, 2011
Robert W. Healy
City Manager
Richard C. Rossi
Deputy City Manager
Louis A. DePasquale
Assistant City Manager for Fiscal Affairs
James Monagle
City Auditor
Prepared by:
Finance Department
City of Cambridge, Massachusetts

Cover Photo:
Renovated and Newly Constructed Cambridge Public Library – Main Library
The cover features a photograph of the renovated and newly constructed Cambridge Public Library Main
Library, which was completed and re-dedicated in 2009. The renovation work preserved the integrity of the
historic building, donated by Frederick Rindge and listed in the National Register of Historic Places, while
adding a striking new, glass curtain wall enveloped, 76,700 square foot wing, a 33,000 square foot (70 space)
underground parking garage and a renovated park. The renovations dramatically improved the energy efficiency
of the historic structure and achieved LEED Silver designation for the project‘s many ―green‖ features, while
improving pedestrian and vehicular access, adding a climate controlled Cambridge History room, a computer
training room, Children‘s reading and Young Adult rooms, and public meeting and performance spaces,
including a 230 seat auditorium/lecture hall. Since its completion, the Main Library has received a host of
prestigious architectural and design awards, including the following:
Bestowing Organization Award
1 Boston Society of Architects 2010 Harleston Parker Medal
2 Boston Society of Architects 2010 Honor Award for Design Excellence
3 Boston Society of Architects 2010 Award for Interior Design/Interior
Architecture
4 AIA New England 2010 Honor Award for Design Excellence
5 ARCHITECT Magazine 2010 Annual Design Review Award
(November 2010 issue)
6 Massachusetts Historical Commission 2010 Preservation Award
7 New Hampshire AIA
2010 Integrated Design/Integrated Development
Award (IDID) for Excellence in Sustainable Design
8 Associated General Contractors of America 2010 AGC Aon Build America Award
9 American Libraries Magazine 2010 Library Design Showcase
10 Sustainable Buildings Industry Council (SBIC) –
Beyond Green High-Performance Building Awards 2010 Citation for Innovative Envelope System
Articles that have been published about the Main Library:
Architectural Record (Oct 2010), ―Legible and Luminous‖ by Joann Gonchar (6-page feature)
http://www.archrecord.construction.com/projects/portfolio/2010/10/cambridge_public_library.asp
Architectural Record (July 2010), ―More than skin deep‖ by Joann Gonchar (Feature in the double-skin
curtain walls issue)
Architect Magazine (November 2010), ―Annual Design Review Award: Cambridge Public Library‖
http://www.architectmagazine.com/government-projects/awardnew-cambridge-public-library-cambridgem
ass.aspx

CITY OF CAMBRIDGE, MASSACHUSETTS
Comprehensive
Annual Financial Report
June 30, 2011
Table of Contents
Page(s)
Introductory Section
Letters of Transmittal i
A Few Words about Cambridge xi
Directory of Officials xii
Organizational Chart xiii
Certificate of Achievement xiv
Financial Section
Independent Auditors‘ Report 1 – 2
Management‘s Discussion and Analysis – Required Supplementary Information 3 – 13
Basic Financial Statements:
Statement of Net Assets 14
Statement of Activities 15
Balance Sheet – Governmental Funds 16
Reconciliation of the Governmental Funds Balance Sheet to the Statement of Net Assets 17
Statement of Revenues, Expenditures, and Changes in Fund Balances – Governmental
Funds 18
Reconciliation of the Statement of Revenues, Expenditures, and Changes in Fund Balance
of Governmental Funds to the Statement of Activities 19
Statement of Net Assets – Proprietary Fund 20
Statement of Revenues, Expenses, and Changes in Net Assets – Proprietary Fund 21
Statement of Cash Flows – Proprietary Fund 22
Statement of Fiduciary Net Assets 23
Statement of Changes in Fiduciary Net Assets 24
Notes to Basic Financial Statements 25 – 53
Required Supplementary Information:
Schedules of Funding Progress 54
Schedule of Employers‘ Contributions 54
Schedule of Revenues and Expenditures – Budgetary Basis – General Fund – Budget and
Actual 55
Notes to schedule 56

CITY OF CAMBRIDGE, MASSACHUSETTS
Comprehensive
Annual Financial Report
June 30, 2011
Table of Contents
Page(s)
Supplemental Statements and Schedules:
Schedule of Expenditures – Budgetary Basis – General Fund 58 – 63
Other Governmental Funds 64
Combining Financial Statements:
Combining Balance Sheet – Other Governmental Funds 65
Combining Statement of Revenues, Expenditures, and Changes in Fund Equity –
Other Governmental Funds 66
Agency Funds 67
Combining Statement of Changes in Assets and Liabilities – Agency Funds 68 – 69
Other Schedules 70
Schedule of Gross Real Estate, Personal Property, and Motor Vehicle Excise Taxes 71 – 73
Schedule of Bonds and Notes Payable 74 – 75
Statistical Section
General Government Expenditures by Function – GAAP Basis 77
General Government Revenues by Source – GAAP Basis 78
Net Assets by Component 79
Changes in Net Assets 80 – 81
Fund Balances, Governmental Funds 82
Changes in Fund Balances, Governmental Funds 83
Assessed Value and Actual Value of Taxable Property 84
Property and Motor Vehicle Tax Rates 85
Largest Principal Taxpayers 86
Property Tax Levies and Collections 87
Ratios of Outstanding Debt by Type 88
Ratios of General Bonded Debt Outstanding 89
Direct and Overlapping Governmental Activities Debt 90
Legal Debt Margin Information 91
Demographic and Economic Statistics 92
Principal Employers 93
Full-Time Equivalent Employees by Function/Program 94
Operating Indicators by Function/Program 95
Capital Asset Statistics by Function/Program 96

I n t r o d u c t o r y S e c t i o n
i
December 16, 2011
Mr. Robert W. Healy
City Manager
City of Cambridge
Cambridge, Massachusetts 02139
Dear Mr. Healy:
The Comprehensive Annual Financial Report (CAFR) of the City of Cambridge, Massachusetts (the City),
for the fiscal year ended June 30, 2011 is presented for your review. The report was prepared by the City‘s
Finance Department. The responsibility for the accuracy, completeness, and fairness of the data presented,
including all disclosures, rests with the City. We believe that the data presented is accurate in all material
respects; that it is presented in a manner designed to show fairly the financial position and results of
operations of the City as measured by the financial activities of its various funds; and that all disclosures
deemed necessary to enable the reader to gain the maximum understanding of the City‘s financial activity
have been included.
The financial information in this report is presented in conformity with accounting principles generally
accepted in the United States of America as applicable to governmental entities and conforms to
accounting standards as promulgated by the Governmental Accounting Standards Board (GASB).
Accounting System and Budgetary Control
Basis of Accounting
The accounting records of the City‘s general government operations, as reported in the general fund,
capital projects fund, affordable housing trust fund and other governmental funds are maintained on a
modified accrual basis at the fund level. Accordingly, revenues are recorded when measurable and
available and expenditures are recorded when the services or goods are received and the liabilities are
incurred and payable with expendable available resources. The accrual basis of accounting is followed
when reporting on a government-wide basis as shown on pages 14 and 15. Agency funds are custodial in
nature and do not involve measurement of results of operations.
In developing and maintaining the City‘s accounting system, consideration is given to the adequacy of
internal accounting control. Internal accounting controls are designed to provide reasonable, but not
absolute, assurance regarding: (1) the safeguarding of assets against loss from unauthorized use or
disposition; and (2) the reliability of financial records for preparing financial statements and maintaining
accountability for assets. The concept of reasonable assurance recognizes that: (1) the cost of a control
should not exceed the benefits likely to be derived; and (2) the evaluation of costs and benefits requires
estimates and judgments by management.
All internal control evaluations occur within the above framework. It is our belief that the City‘s internal
accounting controls adequately safeguard assets and provide reasonable assurance of proper recording of
financial transactions.

ii
Budgetary Control
As a part of its internal control structure, the City maintains budgetary controls. The objective of these
controls is to ensure compliance with the legally mandated budget adopted by the City Council. Activities
of the General Fund are included in the annual budget.
Budgetary control defines the level at which expenditures cannot legally exceed the appropriated amount.
For the General Fund, this control is at the department level. Budgetary controls reside within the City‘s
financial system and are monitored by the Office of Budget Management and the Auditing Department to
ensure compliance.
The City uses encumbrance accounting in its governmental funds as a method of recording commitments
under purchase orders and contracts. Encumbrance accounting, under which purchase orders, contracts,
and other commitments for expenditure of funds are recorded as expenditures to reserve that portion of the
applicable appropriation, is employed in the governmental fund types as a significant aspect of budgetary
control.
Collateralized Deposits
The City of Cambridge requires collateral for the majority of its certificates of deposit, money market
accounts, checking, or savings accounts when dealing with major banking institutions in the Boston area.
The Reporting Entity
The basic financial statements present information on the City of Cambridge, Massachusetts (the primary
government) and its component units as required by GASB. Component units are included in the City‘s
reporting entity because of the significance of their operational or financial relationships with the City. The
inclusion of component units in the City‘s basic financial statements does not affect their legal standing.
The City has two component units, which are the Cambridge Retirement System and the Cambridge Health
Alliance.
The financial statements of the Cambridge Retirement System are presented for the year ended
December 31, 2010 which is its fiscal period for reporting to the Public Employee Retirement
Administration Commission of the Commonwealth of Massachusetts.
Acknowledgments
The City continues to show a strong financial position through responsible management of financial
operations and through improved accounting and financial reporting practices. The sound financial
decisions continued during the past fiscal year and will benefit the City in the years to come.
In closing, we would like to thank all employees of the City‘s Finance Department for their dedicated work
and support during the past fiscal year.
Respectfully submitted,
Louis A. DePasquale James Monagle
Assistant City Manager City Auditor
for Fiscal Affairs

iii
December 16, 2011
The Honorable Members of the City Council:
I am pleased to submit the Comprehensive Annual Financial Report (CAFR) of the City of Cambridge,
Massachusetts (the City), for the fiscal year ended June 30, 2011. Each year the City‘s Finance Department
prepares this report, which presents comprehensive financial and operating information about the City‘s
activities during the preceding fiscal year. The CAFR is a detailed report that goes beyond the
requirements of applicable statutes, regulations, and generally accepted accounting principles in order to
present all of the information necessary to meet the needs of many persons and groups with an interest in
the financial affairs of the City. Readers are further encouraged to consider this information in conjunction
with the information that is supplied in the Management‘s Discussion and Analysis (MD&A) section of the
City‘s basic financial statements.
Fiscal 2011 Year in Review: Major Initiatives/Highlights
During fiscal year 2011, the City‘s fiscal year free cash position of $102.2 million increased by
$12.9 million from the previous fiscal year. This balance represents the highest amount in the City‘s
history. The general fund balance totaled $143.4 million at year end, a decrease of $ 2.9 million (2.0%)
over fiscal year 2010.
Real property assessed valuations totaled $24.2 billion in fiscal year 2011, a $0.1 billion or .45% decrease
from FY10. This slight change reflects the strength of the Cambridge real estate market despite a very
volatile environment. The commercial sector realized a 0.41% decrease in assessed value, $39 million from
fiscal year 2010. The residential sector assessed values decreased by a modest $71 million, a 0.47%
decrease from fiscal year 2010. Also, in fiscal 2011, the City‘s property tax levy limit grew to
$383.3 million from $367.2 million. In addition, the excess tax levy capacity, which is the difference
between the levy limit and tax levy, was $99.4 million in fiscal year 2011, an increase of $0.8 million, or
0.8%, from fiscal year 2010.
The above indicators illustrate the City‘s continued strong financial position. Other significant fiscal
achievements during fiscal year 2011 are as follows:
In conjunction with the City‘s February 2011 bond sale, the three major credit rating agencies
confirmed their highest rating available to cities.
Moody‘s Investors Service noted in its rating that ―The Aaa rating reflects the City‘s large, diverse
and stable tax base, which is anchored by prominent higher education institutions and a growing
research and development sector. Also incorporated into the Aaa rating are an exceptionally strong
and resilient financial position which has performed well through the national economic downturn,
management‘s consistently conservative approach to budgeting and a favorable debt profile
supported by healthy enterprise systems and historically strong Commonwealth school construction
aid. Strengths include; A large and diverse tax base anchored by stable universities and a robust
financial position guided by sound management policies.‖
While Standard and Poor‘s wrote in its rating that ―The rating reflects the City‘s: Strong and
dynamic local economy, anchored by Harvard University and Massachusetts Institute of Technology
(MIT), as well as biotechnology and high-tech firms; Above-average wealth and income factors,
including a high market value per capita; Very strong financial position, despite a decline in fiscal

iv
2010, coupled with an experienced management team and strong management policies; and Low
debt burden and manageable capital plan.‖
While Fitch Ratings noted ―The rating rationale reflects the City‘s exceptional financial management
which is characterized by its high reserve and liquidity levels; Conservative budgeting practices
along with a use of reserves the last two years has helped keep tax levy increases at moderate levels
while the City faces increases in education and public safety costs; The stable presence of higher
education, health care, biotechnology, and life sciences industries supports the well-diversified
economy with low unemployment and above-average wealth levels; Growth in assessed value
provides the City with tax levy flexibility for operations and debt service as the gap between the
City‘s actual tax levy and the statutory levy limit has grown to its highest level in the City‘s history;
and Debt levels are moderate and expected to remain manageable, aided by the City‘s rapid
amortization rate. Key Rating Driver includes: Ongoing sound financial management, which has
benefited the City‘s financial position.‖
In addition to assigning its ‗AAA‘ rating, Standard and Poor‘s reaffirmed its ―strong‖ Financial
Management Assessment (FMA) of the City in February 2011. An FMA of ―strong‖ indicates that
practices are strong, well embedded and likely sustainable. The strong rating indicates that the
government maintains most best practices deemed critical to supporting credit quality and that these
are well embedded in the government‘s daily operations and practices. Formal policies support many
of these activities, adding to the likelihood that these practices will continue into the future and
transcend changes in the operating environment or personnel.
In February 2011, the City‘s issued $46.2 million in general obligation bonds to finance a wide
variety of projects including the Cambridge Rindge & Latin School (CRLS) Renovation Project,
Sewer Reconstruction, Old Police Station Renovation Project, Radio System Replacement Project,
Harvard and Kendall Square Surface Improvements, Municipal Building Renovations and Danehy
Park Soccer Field Improvements. The true interest cost of this issue was 3.21%.
In November 2001, Cambridge voters approved adoption of the Community Preservation Act (CPA),
a State law that allows the City to receive matching funds from the State for money raised locally in
support of affordable housing, historic preservation and protection of open space. The local portion
of CPA funding is raised through a 3% surcharge on taxes. The total amount appropriated or
reserved in FY11 was $9.6 million and the City continued a recommended policy to allocate funds as
follows: 80% to affordable housing, 10% to historic preservation and 10% to open space. The
$9.6 million appropriated or reserved included $6.5 million in local receipts from the CPA surcharge
with an additional state match of $2.1 million and $1.0 from CPA fund balance. Through fiscal year
2011, the City appropriated or reserved $101.7 million in CPA funds with approximately
$38.6 million attributable to State matching funds. To date, the City has received more CPA
matching funds from the State than any other participating community.
As a result of continued strong fiscal management, the property tax levy for FY11 increased by only
5.69% when the City Council adopted the City Manager‘s property tax and classification
recommendations in September 2010. During the past six years, the average property tax levy
increase is 4.1%. The FY11 Budget adopted in May 2010, reflected a 3.1% increase over the FY10
adjusted budget and called for a 6.3% increase in the property tax levy. However, the City was able
to use additional non-property tax revenues and reserve balances to reduce the amount needed from
the property tax levy to achieve the 5.69% increase. In FY11, the continued strong commercial
market, coupled with a slight decrease in most residential property values, resulted in the continued
property tax burden shift back to the commercial taxpayers from residential taxpayers for the sixth
year in a row. As a result, 51.7% of the residential taxpayers received a property tax bill that was

v
lower, the same, or an increase less than $100. In addition, another 32.2% of residential taxpayers
received an increase between $100 – $250.
In FY11, the City successfully completed, on time, the triennial Department of Revenue (DOR)
certification of real and personal property valuations process.
The Other Post Employment Benefits (OPEB) Working Group continues to oversee the
implementation of GASB 45. In addition, in FY11 the Working Group included providing necessary
financial information to the actuarial firm to develop the updated OPEB liability as of July 1, 2010.
In recognition of the City‘s financial achievements, the Government Finance Officers Association
(GFOA) awarded the City its Certificate for Excellence in Financial Reporting and the Distinguished
Budget Presentation Award. The City has achieved both these awards annually from the GFOA for
the last 24 years.
Financial Summary
The City continues to be in sound financial condition as demonstrated by the financial statements and
schedules included in this report. Throughout the year, the City maintained a strong cash and investment
position and once again did not issue any tax anticipation notes.
General Fund Balances and Cash Position
The City ended fiscal year 2011 with a total general fund balance of $143.4 million, which represents
34.4% of general fund revenues, a decrease from 37.5% in fiscal year 2011. In fiscal year 2011, operations
produced an $18.6 million deficit. Each year, a portion of fund balance is allocated to committed and
nonspendable accounts. A total of $43.7 million was held as committed and nonspendable accounts in
fiscal year 2011, leaving an unassigned fund balance of $99.7 million. General fund cash and short-term
investments totaled $183.0 million, while the balance of cash and short-term investments for all funds
totaled $337.5 million, which is a $2.5 million, or 0.7% decrease from fiscal year 2010.
The following table presents the balance in the City‘s unreserved/unassigned general fund balance for
fiscal years 2001 through 2011.
Unreserved/unassigned
general fundbalance
Fiscal year:2001 $ 31,879,786 2002 (1) 69,586,739 2003 85,286,219 2004 90,479,144 2005 100,050,320 2006 120,245,450 2007 134,869,147 2008 150,312,018 2009 141,595,256 2010 129,495,866 2011 (2) 99,698,895
(1) Upon implementation of GASB 34, fund balances from the health claims trust and City and school
stabilization funds have been included in the general fund.

vi
(2) The City, in 2011, implemented GASB 54, Fund Balance Reporting and Governmental Fund Type
Definitions.
Cash Position
The table and charts displayed below present the changes in year-end general fund cash and total cash for
all funds for the past eight fiscal years. The table and charts do not include cash for the Cambridge Health
Alliance, a component unit.
Year-end Year-end allgeneral fund funds cash
cash and andshort-term short-terminvestments investments
Fiscal year:2004 117,007,650 237,761,490 2005 141,163,873 272,770,097 2006 157,015,287 311,599,017 2007 175,514,111 349,547,200 2008 193,401,156 380,717,649 2009 184,961,474 344,372,924 2010 178,909,465 340,010,757 2011 183,045,990 337,450,678
$0 $10,000,000 $20,000,000 $30,000,000 $40,000,000 $50,000,000 $60,000,000 $70,000,000 $80,000,000 $90,000,000
$100,000,000 $110,000,000 $120,000,000 $130,000,000 $140,000,000 $150,000,000 $160,000,000 $170,000,000 $180,000,000 $190,000,000 $200,000,000
2004 2005 2006 2007 2008 2009 2010 2011
Year-End Cash Balance – General Fund

vii
Capital Financing and Debt Management
In conjunction with the operating budget, the City annually prepares both a capital budget for the
upcoming fiscal year and a five-year improvement plan that is used as a guide for capital expenditures in
future years. The Capital Improvement Program for the five-year period from fiscal year 2012 through
fiscal year 2016, which was approved by the City Council in May 2011, has an estimated cost of
$278,869,045. Financing for the fiscal year 2012 portion of the capital plan was appropriated with the
adoption of the fiscal year 2012 operating budget in May 2011.
The City issues a majority of its debt with a ten-year or shorter repayment schedule, which requires higher
debt service payments in the short-term, but results in sizable interest savings. In addition, since fiscal year
1985, the City has funded a portion of its Capital Improvement Program on a ―pay-as-you-go‖ basis out of
current revenues. The City‘s outstanding bonded debt as of June 30, 2011 totaled $322.6 million.
Property Valuations
Based on valuations of all real and personal property as of January 1, 2010, the total value of all property in
the City is $24.2 billion. Of that total, $0.4 billion is attributable to new construction. The table below
compares fiscal year 2011 property valuations and tax rates to fiscal year 2010 valuations and tax rates.
Property valuation Tax ratesFY 2011 FY 2010 FY 2011 FY 2010
(In millions)
Commercial/industrial $ 8,378 8,467 19.90 18.75Personal property 960 911 19.90 18.75Residential 14,824 14,894 8.16 7.72
Total value $ 24,162 24,272
$0
$50,000,000
$100,000,000
$150,000,000
$200,000,000
$250,000,000
$300,000,000
$350,000,000
$400,000,000
2003 2004 2005 2006 2007 2008 2009 2010 2011
Year-End Cash Balance – All Funds

viii
Permanent Trust Fund
The City‘s permanent trust fund has a total fund balance of $3,446,976 at June 30, 2011 and is included in
the other governmental funds column. The permanent trust fund is used for a variety of purposes including
awarding scholarships and prizes to Cambridge school children, providing entertainment for residents at
the nursing home, purchasing books, and materials for the public library, and providing dental hygiene for
school-age children.
Pension Liability
As of January 1, 2010, the City‘s unfunded actuarial accrued liability is approximately $153.9 million. In
January 1991, the City established a State-approved funding schedule, which is updated based on current
actuarial valuations and reviews every two years. It is projected that the City will eliminate its unfunded
actuarial liabilities in June 30, 2029 based on an updated funding schedule.
OPEB Liability
As of June 30, 2011, the City‘s unfunded actuarial accrued liability is approximately $586.2 million. On
December 21, 2009, the City Council approved the establishment of an irrevocable OPEB trust fund and
transferred $2 million to this fund. The fair value of the assets as of June 30, 2011 is $2.1 million.
Risk Management
The City is self-insured for any damage to its buildings from fire, natural disasters and for theft. The City
currently has sufficient reserves in several funds to cover any unanticipated costs that may arise.
Health insurance is provided to employees and retirees through managed care health plans. The City offers
a variety of health maintenance organization (HMO) options including Blue Cross/Blue Shield‘s Blue
Choice and HMO Blue, Harvard Community Health Plan and Tufts Associated Health Plan. All
nonmedicare plans are paid on a claims basis. All four plans require at least a 12% employee and 15%
retiree contribution with the remaining balance covered by the City.
The City is self-insured in all other areas of risk including auto liability and workers‘ and unemployment
compensation. The City‘s Law Department defends the City in most cases for legal claims, except those
requiring specialized expertise, in which case the City will periodically retain outside counsel. Settlements
for legal claims are paid from the City‘s judgments and claims account. The City‘s Personnel Department
administers risk management.
New Accounting Standards
In 2011, The City implemented GASB Statement No. 54, Fund Balance Reporting and Governmental
Fund Type Definitions. The objective of this pronouncement is to enhance the usefulness of fund balance
information and provide clearer fund balance classifications. Currently, fund balance is reported as
reserved and unreserved. Effective for fiscal year 2011 reporting, fund balance is reported as nonspendable,
restricted, committed, assigned, and unassigned based on the relative strength of the constraints that control
how specific amounts can be spent. Additional information on GASB Statement No. 54 can be found in the
notes to the financial statements.
Independent Audit
The City‘s financial records, books of accounts, and financial transactions are audited each year by an
independent firm of certified public accountants. The City‘s annual audit was performed by the
independent public accounting firm of KPMG LLP. The independent auditors‘ report on the basic financial
statements for the year ended June 30, 2011 is included herein.

ix
Certificate of Achievement
The GFOA awarded a Certificate of Achievement for Excellence in Financial Reporting to the City of
Cambridge, Massachusetts, for its Comprehensive Annual Financial Report for the fiscal year ended
June 30, 2010.
In order to be awarded a Certificate of Achievement, a government unit must publish an easily readable
and efficiently organized comprehensive annual financial report, whose contents conform to program
standards. Such reports must satisfy both U.S. generally accepted accounting principles and applicable
legal requirements.
A Certificate of Achievement is valid for a period of one year only. We believe our current report
continues to conform to the Certificate of Achievement Program requirements, and we are submitting it to
the GFOA.
Economic Condition
The City continues to experience strong economic activity as evidenced by a September 2011
unemployment rate of 5.0% that is lower than the Boston PMSA, the Commonwealth of Massachusetts,
and the United States. Cambridge continues to be a net importer of jobs within the region. In calendar year
2010, the City‘s employment ratio was 99 jobs per 100 residents. In calendar year 2009, per capita personal
income (PCPI) in the Cambridge metropolitan division is 51.2% higher than the PCPI for the USA, 17.9%
higher than the State and 9.7% higher than the Boston MSA. Higher Education and Biotechnology
continue to be important employment sectors for the City. Harvard University and the Massachusetts
Institute of Technology, who employ approximately 17.8% of the City‘s workforce, continue to provide
additional benefits for private employers locating to Cambridge.
Future Outlook and Conclusion
While the City maintains its policy of controlled budget growth, it has also maintained its tradition of
providing a high level of service to its residents and the local business community.
The past fiscal year was another solid year for the finances of the City: with the excess levy capacity
increasing, actual revenues above projections, and strong assessed values. For planning purposes, the City
used $12.8 million in free cash in fiscal year 2011, on a budgetary basis, to lower the property tax levy and
for supplemental appropriations. Due to surpluses in revenue accounts and expenditure savings, the City
was not only able to replace the amount it used, it increased the total free cash balance by $12.9 million to
a the highest amount in the City‘s history of $102.2. Based on the economic climate, this is a major
accomplishment. These strong financial indicators combined with a AAA credit rating provide the City
with enormous fiscal flexibility and stability.
These factors are important as we cautiously navigate through these challenging economic times, which
will require us to look for ways to continue to expand non-property tax revenue, encourage expansion of
the tax base, exercise restraint on expenditures and strategically use our reserve funds. While Cambridge is
not insulated from current economic realities, we have positioned ourselves well to respond to these
challenges in order to preserve our high level of municipal services as well as meet the needs of our
infrastructure that will benefit our citizens for decades to come.
Acknowledgments
The preparation of this report on a timely basis could not be accomplished without the efficient and
dedicated services of the entire staff of the Finance Department. I would like to express my appreciation to
all members of the Department who assisted and contributed to its preparation. I would also like to thank

x
the members of the City Council for their concern and support in planning and constructing the financial
operations of the City in a responsible and progressive manner.
Additionally, I would like to acknowledge all of the City employees who provide the wide array of high
quality services to the citizens of Cambridge, and contributed to the accomplishments highlighted above.
Finally, I would like to thank the City‘s delegation to the State Legislature, who has continually offered
strong support on State fiscal matters that impact the City.
Very truly yours,
Robert W. Healy
City Manager
xi
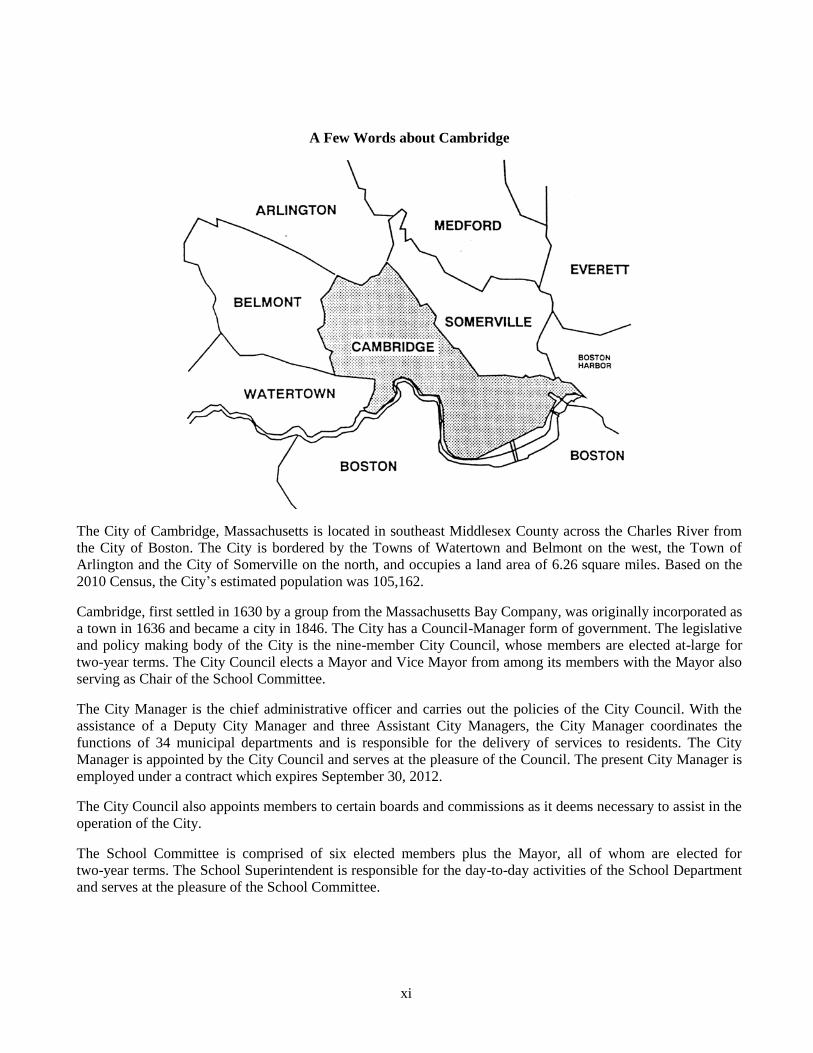
A Few Words about Cambridge
The City of Cambridge, Massachusetts is located in southeast Middlesex County across the Charles River from
the City of Boston. The City is bordered by the Towns of Watertown and Belmont on the west, the Town of
Arlington and the City of Somerville on the north, and occupies a land area of 6.26 square miles. Based on the
2010 Census, the City‘s estimated population was 105,162.
Cambridge, first settled in 1630 by a group from the Massachusetts Bay Company, was originally incorporated as
a town in 1636 and became a city in 1846. The City has a Council-Manager form of government. The legislative
and policy making body of the City is the nine-member City Council, whose members are elected at-large for
two-year terms. The City Council elects a Mayor and Vice Mayor from among its members with the Mayor also
serving as Chair of the School Committee.
The City Manager is the chief administrative officer and carries out the policies of the City Council. With the
assistance of a Deputy City Manager and three Assistant City Managers, the City Manager coordinates the
functions of 34 municipal departments and is responsible for the delivery of services to residents. The City
Manager is appointed by the City Council and serves at the pleasure of the Council. The present City Manager is
employed under a contract which expires September 30, 2012.
The City Council also appoints members to certain boards and commissions as it deems necessary to assist in the
operation of the City.
The School Committee is comprised of six elected members plus the Mayor, all of whom are elected for
two-year terms. The School Superintendent is responsible for the day-to-day activities of the School Department
and serves at the pleasure of the School Committee.

xii
Fiscal Year 2011
Directory of Officials
City Council
David P. Maher, Mayor
Henrietta Davis, Vice Mayor Kenneth E. Reeves
Leland Cheung Sam Seidel
Marjorie C. Decker E. Denise Simmons
Craig A. Kelley Timothy J. Toomey, Jr.
School Committee
David P. Maher, Chair
Alfred B. Fantini Patricia M. Nolan
Richard Harding Alice L. Turkel
Marc McGovern Nancy Tauber
Principal Executive Officers
City Manager Robert W. Healy
Deputy City Manager Richard C. Rossi
Assistant City Manager for Fiscal
Affairs and Treasurer/Collector
Louis A. DePasquale
Assistant City Manager for Community
Development
Brian P. Murphy
Assistant City Manager for Human Services Ellen M. Semonoff
City Auditor James Monagle
City Solicitor Donald A. Drisdell
City Clerk D. Margaret Drury

xiii
ORGANIZATIONAL CHART City of Cambridge, Massachusetts
Legislative Education General Government Community Development Human Services Public Safety Community Maintenance
Citizens/Voters
City Council Mayor
City Manager
Deputy City Manager
School Committee
Schools
Asst. City Manager Human Services
Recreation & Golf Course Community Schools Youth Programs Elderly Services Community Learning Center Childcare & Family Support Services Fuel Assistance Commission for Persons with Disabilities Cambridge Prevention Coalition Workforce Development Kids’ Council MultiService Center
Law Election Commission General Services Arts Council Women’s Commission Peace Commission Human Rights Commission Library Veterans’ Benefits Cable TV
City Clerk City Auditor Accounting
City Council
Finance
Assistant City Manager Fiscal Affairs
Budget Treasury Revenue Assessing Purchasing Personnel Auditing Info. Technology Dept.
Assistant City Manager Community Development
Community Planning Housing Economic Development Transportation & Environmental Planning Community Development Block Grant Lead Safe Cambridge
Public Works Water Historical Commission Conservation Commission
Animal Commission Police Fire Police Review & Advisory Board Emergency Management License Commission Consumers’ Council Electrical Weights & Measures Inspectional Services Traffic, Parking & Transportation Emergency Communications

xiv

F i n a n c i a l S e c t i o n

Independent Auditors’ Report
The Honorable Mayor and City Council
City of Cambridge, Massachusetts:
We have audited the accompanying financial statements of the governmental activities, the business-type
activity, the discretely presented component unit, each major fund, and the aggregate remaining fund
information of the City of Cambridge, Massachusetts (the City), as of and for the year ended June 30,
2011, which collectively comprise the City‘s basic financial statements as listed in the table of contents.
These financial statements are the responsibility of the City‘s management. Our responsibility is to express
opinions on these financial statements based on our audit. We did not audit the financial statements of the
discretely presented component unit. Those financial statements were audited by other auditors whose
report thereon has been furnished to us, and our opinions, insofar as it relates to amounts included for that
entity, is based solely on the report of the other auditors.
We conducted our audit in accordance with auditing standards generally accepted in the United States of
America and the standards applicable to financial audits contained in Government Auditing Standards,
issued by the Comptroller General of the United States. Those standards require that we plan and perform
the audit to obtain reasonable assurance about whether the financial statements are free of material
misstatement. An audit includes consideration of internal control over financial reporting as a basis for
designing audit procedures that are appropriate in the circumstances, but not for the purpose of expressing
an opinion on the effectiveness of the City‘s internal control over financial reporting. Accordingly, we
express no such opinion. An audit includes examining, on a test basis, evidence supporting the amounts
and disclosures in the financial statements. An audit also includes assessing the accounting principles used
and significant estimates made by management, as well as evaluating the overall financial statement
presentation. We believe that our audit and the report of the other auditors provide a reasonable basis for
our opinions.
As described in note 2(n), the City, in 2011, implemented Governmental Accounting Standards Board
Statement No. 54, Fund Balance Reporting and Governmental Fund Type Definitions, as of July 1, 2010.
In our opinion, based upon our audit and the report of the other auditors, the financial statements referred
to above present fairly, in all material respects, the respective financial position of the governmental
activities, the business-type activity, the discretely presented component unit, each major fund, and the
aggregate remaining fund information of the City of Cambridge, Massachusetts, as of June 30, 2011, and
the respective changes in financial position and, where applicable, cash flows thereof for the year then
ended in conformity with U.S. generally accepted accounting principles.
In accordance with Government Auditing Standards, we have also issued our report dated December 16,
2011 on our consideration of the City‘s internal control over financial reporting and on our tests of its
compliance with certain provisions of laws, regulations, contracts and grant agreements and other matters.
The purpose of that report is to describe the scope of our testing of internal control over financial reporting
and compliance and the results of that testing, and not to provide an opinion on the internal control over
KPMG LLP Two Financial Center 60 South Street Boston, MA 02111
KPMG LLP is a Delaware limited liability partnership, the U.S. member firm of KPMG International Cooperative (“KPMG International”), a Swiss entity.

2
financial reporting or on compliance. That report is an integral part of an audit performed in accordance
with Government Auditing Standards and should be considered in assessing the results of our audit.
The management‘s discussion and analysis, the schedules of funding progress and employers‘
contributions, and the schedule of revenues and expenditures – budgetary basis as listed in the
accompanying table of contents are not a required part of the basic financial statements, but are
supplementary information required by U.S. generally accepted accounting principles. We have applied
certain limited procedures, which consisted principally of inquiries of management regarding the methods
of measurement and presentation of the required supplementary information. However, we did not audit
the information and express no opinion on it.
Our audit was conducted for the purpose of forming opinions on the financial statements that collectively
comprise the City of Cambridge‘s basic financial statements. The introductory section, supplemental
statements and schedules, and statistical section are presented for the purposes of additional analysis and
are not a required part of the basic financial statements. The supplemental statements and schedules have
been subjected to the auditing procedures applied in the audit of the basic financial statements and, in our
opinion, are fairly stated in all material respects in relation to the basic financial statements taken as a
whole. The introductory and statistical sections have not been subjected to the auditing procedures applied
in the audit of the basic financial statements and, accordingly, we express no opinion on them.
December 16, 2011
CITY OF CAMBRIDGE, MASSACHUSETTS
Required Supplementary Information
Management‘s Discussion and Analysis
June 30, 2011
(Unaudited)
3 (Continued)
Management of the City of Cambridge (the City) provides this Management‘s Discussion and Analysis as part of
the City‘s Comprehensive Annual Financial Report (CAFR) to assist readers of the basic financial statements in
understanding the financial activities of the City for the fiscal year ended June 30, 2011. We encourage readers to
consider this information in conjunction with the transmittal letters at the front of this report and the City‘s basic
financial statements, which follow this section.
Overview of the Financial Statements
The City‘s financial statements present two types of statements each with a different view of the City‘s finances.
This approach focuses on both the City as a whole (government-wide) and the fund financial statements. The
government-wide financial statements provide both long-term and short-term information about the City as
whole. The fund financial statements focus on the individual parts of the City government, reporting the City‘s
operations in more detail than the government-wide statements. Both presentations (government-wide and fund)
allow the user to address relevant questions, broaden the basis of comparison and enhance the City‘s
accountability. The remaining statements provide financial information about activities for which the City acts
solely as a trustee or agent for the benefit of those outside of the government. An additional part of the basic
financial statements are the notes to the financial statements. This report also contains other required
supplementary information in addition to the basic financial statements.
Government-Wide Financial Statements
The government-wide statements report information about the City as a whole, with the exception of fiduciary
activities, and use accounting methods similar to those used by private-sector companies. The statements provide
both short-term and long-term information about the City‘s financial position, which assists in assessing the
City‘s economic position at the end of the fiscal year. The statements are prepared using the flow of economic
resources measurement focus and the full accrual basis of accounting. All revenues and expenses connected with
the fiscal year are reported even if cash involved has not been received or disbursed. The government-wide
financial statements include two statements:
Statement of Net Assets – Presents all of the government‘s assets and liabilities, with the difference being
reported as ―net assets‖. The amount of net assets is widely considered a good measure of the City‘s
financial health as increases and decreases in the City‘s net assets serve as a useful indicator of whether the
City‘s financial position is improving or deteriorating. The reader should consider other nonfinancial
factors, such as the condition of the City‘s infrastructure and changes to the property tax base, to assess the
overall health of the City.
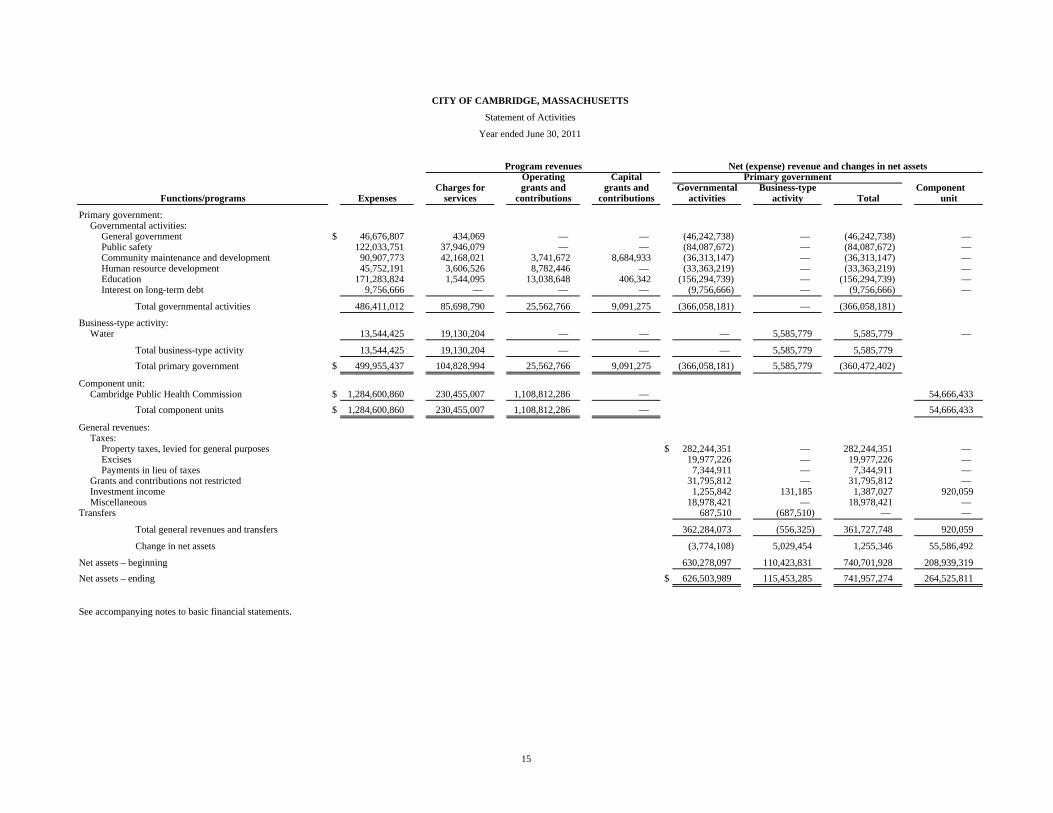
Statement of Activities – Presents information showing how the government‘s net assets changed during
the most recent fiscal year. Revenues and expenses are reported for some items that will not result in cash
flows until future fiscal periods, i.e., uncollected taxes or earned but unused sick and vacation time. This
statement also presents a comparison between direct expenses and program revenues for each function of
the City.

CITY OF CAMBRIDGE, MASSACHUSETTS
Required Supplementary Information
Management‘s Discussion and Analysis
June 30, 2011
(Unaudited)
4 (Continued)
In the government-wide statements, financial information is presented in three columns in order to summarize the
City‘s programs or activities. The types of activities presented are as follows:
Governmental Activities – Taxes and intergovernmental revenues primarily support the functions of the
government and are reported in this section. Most of the City‘s basic services are reported here including
general government, public safety, public works, parks and recreation, library, schools, human services,
public health programs, state and district assessments, debt service and other employee benefits.
Business-Type Activities – These functions normally are intended to recover all or a significant portion of
their costs through user fees and charges to external users of goods and services. The Water Fund operation
is considered a business-type activity.
Discretely Presented Component Unit – Includes a separate legal entity for which the City has financial
accountability and provides operating subsidies. This entity, The Cambridge Health Alliance, (CHA)
operates similar to a private sector business and the business-type activity described above.
Complete financial statements for the CHA can be obtained from its administrative offices located at
101 Station Landing, 5th Floor, Medford, Massachusetts, 02155.
Fund Financial Statements
Traditional users of government financial statements will find the fund financial statement presentation to be
most familiar. A fund is a grouping of related accounts that is used to keep control over resources that have been
allocated to specific projects or activities. The City uses fund accounting to ensure and demonstrate compliance
with several finance-related legal requirements.
All of the funds of the City can be divided into three categories as follows:
Governmental Funds – Most of the basic services provided by the City are financed through
governmental funds. Governmental funds are used to account for the same functions reported as
governmental activities in the government-wide financial statements. However, the governmental fund
financial statements focus on near-term inflows and outflows of resources to be spent. The focus is also on
the balances left at the end of the fiscal year available for spending. This information is useful in evaluating
the City‘s near-term financing requirements. This approach is the modified accrual basis of accounting,
which uses the flow of current financial resources measurement focus. Such statements provide a detailed
short-term view of the City‘s finances that assist in determining whether there will be adequate financial
resources available to meet current needs.
Because the focus of governmental funds is narrower than that of the government-wide financial
statements, it is useful to compare the information presented for governmental funds with similar
information presented for governmental activities in the government-wide financial statements. This
comparison will assist the reader in understanding the long-term impact of the government‘s near-term
financing decisions. The governmental funds balance sheet and the governmental funds statement of
revenues, expenditures, and changes in fund balances provide reconciliations to facilitate the comparison.

CITY OF CAMBRIDGE, MASSACHUSETTS
Required Supplementary Information
Management‘s Discussion and Analysis
June 30, 2011
(Unaudited)
5 (Continued)
The reconciliations are presented on the page immediately following each respective governmental fund
financial statement.
The City has several governmental funds; three are considered major funds for presentation purposes. Each
major fund is presented in a separate column in the governmental funds balance sheet and in the
governmental funds statement of revenues, expenditures, and changes in fund balances. The remaining
governmental funds are aggregated and shown as other governmental funds.
Proprietary Fund – Provides services for which the City charges customers a fee and operates like a
commercial business. The proprietary fund provides the same type of information as in the
government-wide financial statements, only in more detail. Like the government-wide financial statements,
proprietary fund financial statements use the full accrual basis of accounting. There is no reconciliation
needed between the government-wide financial statements for the business-type activity and the
proprietary fund financial statements.
Fiduciary Funds – Such funds are used to account for resources held for the benefit of parties outside the
City government. Fiduciary funds are not reflected in the government-wide financial statements because
the resources of these funds are not available to support the City‘s own programs. The full accrual basis of
accounting is used for fiduciary funds and is much like that used for proprietary funds.
The City‘s fiduciary funds are the Employee Retirement System, the OPEB Trust Fund and the Agency
funds, which are used to account for assets held in agency capacity.
Notes to the Financial Statements
The notes provide additional information that is essential to a full understanding of the data provided in the
government-wide and fund financial statements.
Required Supplementary Information
The basic financial statements are followed by a section of required supplementary information. This section
includes a budgetary comparison schedule for the City‘s general fund – the only fund for which an annual budget
is legally adopted. The budgetary comparison also includes a reconciliation of revenues and expenditures
reported on the City‘s budgetary basis of accounting and the revenues and expenditures reported on a GAAP
basis. Also included is historical information for the City‘s pension and other postemployment benefit
obligations and related schedules of employers‘ contributions.

CITY OF CAMBRIDGE, MASSACHUSETTS
Required Supplementary Information
Management‘s Discussion and Analysis
June 30, 2011
(Unaudited)
6 (Continued)
Government-Wide Financial Analysis
Statement of Net Assets
The following table reflects the condensed net assets based on the statement of net assets found on page 14.
The City‘s combined net assets (governmental and business-type activities) exceeded its liabilities at June 30,
2011 by $742.0 million (presented as net assets). Of this amount, $121.5 million was reported as ―unrestricted
net assets‖. Unrestricted net assets represent the amount available to be used to meet the City‘s ongoing
obligations to citizens and creditors.
The components of net assets are comprised of the following: the investment in capital assets such as land,
buildings, equipment, and infrastructure (roads, sewer pipes, dams, and other immovable assets), less any related
debt used to acquire that asset that is still outstanding – the amount is $606.8 million indicating the amount of
capital debt does not exceed the net book value of the City‘s capital assets. Since most of the City‘s debt has a
ten-year life, a considerable amount of the City‘s capital asset lives extend beyond the life of the debt. The City
uses these capital assets to service the community; therefore, they are not available for future spending. It is
important to note that other resources are needed to repay the debt because the capital assets cannot be used to
finance these liabilities.
Included within the governmental activities current and other assets are cash and investments of $315.6 million,
down 1.8% from prior year; net receivables of $29.5 million; and $10.5 million due from the Cambridge Health
Alliance.
Governmental activities long-term liabilities include $310.7 million in general obligation bonds and notes
payable; $18.1 million in compensated absence liabilities for unused sick and vacation; and $24.6 million in
future year workers‘ compensation, health benefits and possible judgments. The major increase in the long-term
liabilities is due to an increase in other postemployment benefit obligations of $24.4 million.
CITY OF CAMBRIDGE, MASSACHUSETTS
Required Supplementary Information
Management‘s Discussion and Analysis
June 30, 2011
(Unaudited)
7 (Continued)
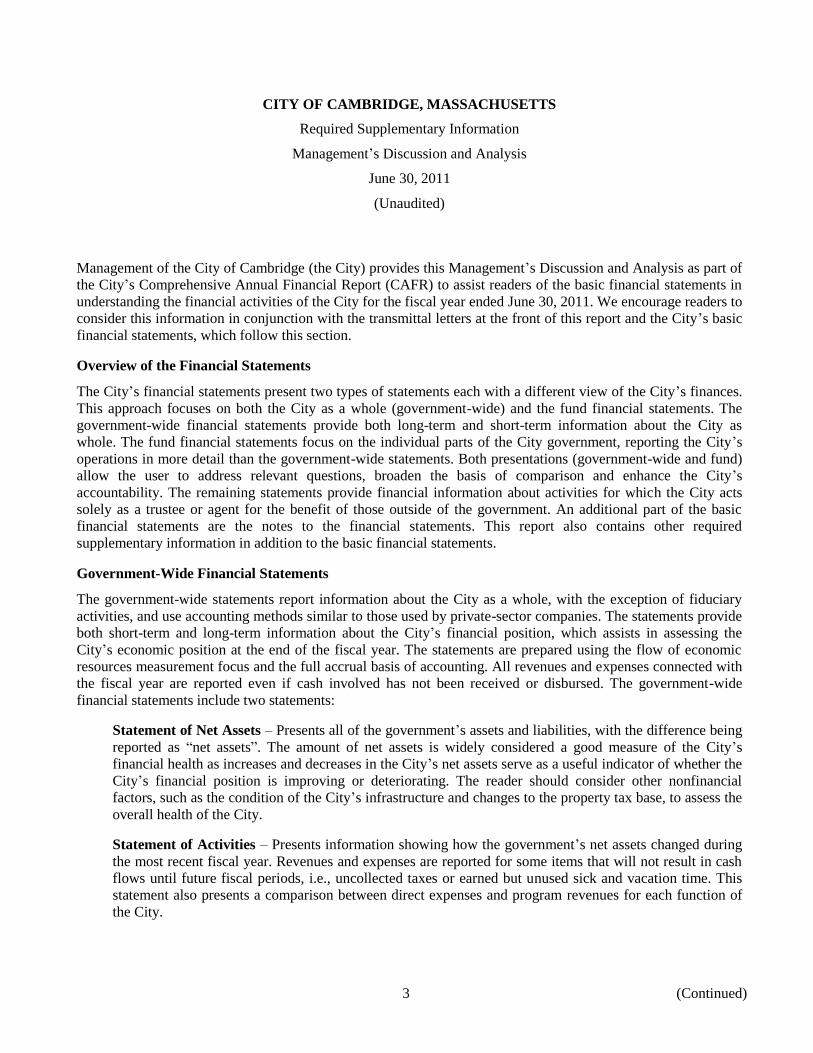
Business-type activity long-term liabilities include $22.3 million in general obligation bonds, $496 thousand in
compensated absences and $887 thousand in future year workers‘ compensation and health benefits. The net
reduction of $5.1 million in general obligation bonds compared to prior year is attributable to an aggressive
ten-year repayment schedule for most debt.
Condensed Schedule of Net Assets
June 30, 2011 and 2010
(In millions)
Governmental activities Business-type activity Total primary government
June 30 June 30 June 30
2011 2010 2011 2010 2011 2010
Current and other assets $ 359.1 368.8 8.8 7.7 367.9 376.5Capital assets 756.9 708.7 131.4 132.8 888.3 841.5
Total assets $ 1,116.0 1,077.5 140.2 140.5 1,256.2 1,218.0
Long-term liabilities $ 441.6 399.9 23.6 29.2 465.2 429.1Other liabilities 47.9 47.3 1.1 0.9 49.0 48.2
Total liabilities $ 489.5 447.2 24.7 30.1 514.2 477.3
Net assets:
Invested in capital assets, net of debt $ 497.7 454.8 109.2 105.5 606.9 560.3Restricted 13.6 10.2 — — 13.6 10.2Unrestricted 115.2 165.3 6.3 4.9 121.5 170.2
Total net assets $ 626.5 630.3 115.5 110.4 742.0 740.7
Statement of Changes in Net Assets
The City‘s total net assets increased by $1.3 million in fiscal year 2011 of which the governmental activities net
assets decreased $3.8 million and the business-type activity increased $5.1 million.

CITY OF CAMBRIDGE, MASSACHUSETTS
Required Supplementary Information
Management‘s Discussion and Analysis
June 30, 2011
(Unaudited)
8 (Continued)
This summary of net changes is based upon the statement found on page 15.
Condensed Schedule of Changes in Net Assets
June 30, 2011 and 2010
(In millions)
Governmental activities Business-type activity Total primary government
June 30 June 30 June 30
2011 2010 2011 2010 2011 2010
Revenues:Program revenues:
Charges for services $ 85.7 78.2 19.2 19.4 104.9 97.6 Operating grants and contributions 25.6 35.9 — — 25.6 35.9 Capital grants and contributions 9.1 38.4 — — 9.1 38.4
General revenues:
Taxes:Property taxes levied 282.2 265.6 — — 282.2 265.6 Excises 20.0 15.5 — — 20.0 15.5 Payment in lieu of taxes 7.3 7.1 — — 7.3 7.1
Grants and contributions not restricted 31.8 21.9 — — 31.8 21.9 Investment income 1.3 1.9 0.1 0.1 1.4 2.0 Miscellaneous 18.9 17.6 — — 18.9 17.6
Total revenues 481.9 482.1 19.3 19.5 501.2 501.6
Expenses:General government 46.6 44.0 — — 46.6 44.0 Public safety 122.0 119.6 — — 122.0 119.6 Community maintenance and development 90.9 74.0 — — 90.9 74.0 Human resource development 45.8 43.7 — — 45.8 43.7 Education 171.3 165.2 — — 171.3 165.2 Water department — — 13.5 13.7 13.5 13.7 Interest 9.8 10.0 — — 9.8 10.0
Total expenses 486.4 456.5 13.5 13.7 499.9 470.2
Excess before transfers (4.5) 25.6 5.8 5.8 1.3 31.4
Transfers 0.7 0.7 (0.7) (0.7) — —
Change in net assets (3.8) 26.3 5.1 5.1 1.3 31.4
Net assets – beginning 630.3 604.0 110.4 105.3 740.7 709.3
Net assets – ending $ 626.5 630.3 115.5 110.4 742.0 740.7

CITY OF CAMBRIDGE, MASSACHUSETTS
Required Supplementary Information
Management‘s Discussion and Analysis
June 30, 2011
(Unaudited)
9 (Continued)
Total Revenues
Total governmental activities revenues for the City are comprised of general revenues of $361.6 million, charges
for services $85.7 million, operating grants and contributions $25.6 million and capital grants and contributions
of $9.1 million.
General
Real estate tax revenues are the City‘s largest revenue source at $282.2 million representing 78.1% of general
revenues. The assessed tax valuation base is $24.2 billion down from $24.3 billion assessed in the prior year
showing a 0.5% decrease mainly due to a slight drop in new construction.
Grants and contributions not restricted to specific programs is $31.8 million representing 8.8% of general
revenues and include state cherry sheet revenues and other unrestricted contributions.
Program
Charges for services are $85.7 million and represent a variety of department revenues. Charges for services
increased $7.5 million from the prior year. The public safety portion of $37.9 million includes several types of
permit revenues, traffic and moving violation revenues, and City garage revenues. The community maintenance
and development portion of $42.2 million includes sewer service revenues, community cable revenues, as well
as, other public works type fees. This category increased by $2.5 million from the prior year mainly due to an
increase of 9.5% in sewer charges attributable to a slight decrease in sewer abatements and a rate increase.
Operating grants and contributions of $25.6 million represents several federal and state grants restricted to
specific grant conditions. This amount accounts for approximately 5.3% of the total City revenues.
75.0%
17.8% 5.3%
1.9%
Total Governmental Revenues
General revenues
Charges for services
Operating grants and
contributions
Capital grants and
contributions

CITY OF CAMBRIDGE, MASSACHUSETTS
Required Supplementary Information
Management‘s Discussion and Analysis
June 30, 2011
(Unaudited)
10 (Continued)
Capital grants and contributions of $9.1 million include community development capital grants, state revolving
grants, state school construction grants, and other capital restricted revenues.
Expenses
For the fiscal year ended June 30, 2011, expenses for government activities totaled $486.4 million, which cover a
range of services, On the whole, the City‘s expenditures increased slightly by $29.9 million or 6.5% over prior
year. The increase is attributable to higher depreciation costs, increases in other postemployment benefits costs,
increased employee insurance costs and pension costs.
Education continues to be one of the City‘s highest priorities and commitments, representing $171.3 million or
35.2% of the total governmental activities expenses.
Another important issue to the City is affordable housing and the preservation of open space. This is the
ninth year of the Community Preservation Act (CPA). This program fosters the investment into permanent
affordable housing projects, preservation of historic locations and the protection of open space. Expenditures
related to these initiatives are recorded in the Community Maintenance and Development category. During 2011,
the City spent $8.8 million from the Affordable Housing Trust to subsidize housing projects.
Business-Type Activity
Business-type activity increased net assets by $5.1 million, which is the same as prior years rise in net assets. The
main reason for the $5.1 million increase is due to the drop off in debt service payments.
Financial Analysis of the Government’s Funds
As noted earlier, the City uses fund accounting to ensure and demonstrate compliance with finance related legal
requirements.
Governmental Funds
As of the end of the current fiscal year, the City‘s governmental funds reported a combined ending fund balance
of $272.3 million. Of this amount, $3.7 million has been categorized nonspendable which includes permanent
funds and health care deposits. Another $70.5 million was restricted because the funds include grants or bonded
projects that are controlled by external sources. Finally, $98.4 has been committed for specific purposes such as
stabilization funds, health claims trust fund, parking fund, etc. for which the movement of these funds must be
approved by the highest legislative level at the City, which is the City Council. The remainder of the Fund
balance $99.7 million is considered ―Unassigned‖.
The general fund is the chief operating fund of the City. At the end of the current year, unassigned fund balance
was $99.7 million, while the total fund balance was $143.4 million. A portion of the change is due to an increase
in expenditures of $18.3 million or 4.4% over prior year, which is partly attributable to the increase of
$8.0 million in legal judgments. The remaining balance is primarily due to increases in employee healthcare and
pension costs of $10 million. Also, the City had a decrease in investment income of $0.2 million due to the
economic downturn over the last year.

CITY OF CAMBRIDGE, MASSACHUSETTS
Required Supplementary Information
Management‘s Discussion and Analysis
June 30, 2011
(Unaudited)
11 (Continued)
As a measure of liquidity, it may be useful to compare both unassigned and total fund balances to total fund
expenditures. Unassigned fund balance represents 22.9% of total General Fund expenditures, while the total
balance represents 33% of that same amount.
The capital fund is the fund that captures all the capital projects expenditures for the City. At the end of fiscal
year 2011, the total fund balance was $52.1 million. This reflects a decrease over the prior fiscal year of
$15.1 million. The major decrease in fund balance is due to spending of bond proceeds on CRLS renovations.
The affordable housing trust fund is the fund that captures all the affordable housing project expenditures for the
City. At the end of fiscal year 2011, the total fund balance was $42.4 million. This fund was established in the
90‘s to provide funding for housing projects to increase the supply of affordable housing units for the City.
Proprietary Fund
The City‘s Proprietary Fund provides the same type of information found in the government-wide statements, but
in more detail.
Net assets of the Water Fund at the end of the year consisted of unrestricted net assets of $6.3 million and an
investment in capital assets, net of related debt of $109.2 million.
General Fund Budgetary Highlights
The City submits its budget to the City Council in April and six months later sets the tax rate at the
Massachusetts Department of Revenue. During this process, the City reviews and revises its revenue and
expenditure plan for final adoption before setting the tax rate. The following are some of the major changes:
1. Cherry sheet revenues and expenditures are estimated in the original budget based upon previous year‘s
cherry sheet revenues and adjusted, if needed, for the final budget.
2. Certain other revenues were adjusted based upon the previous year‘s actual and slightly increased
estimates this year.
The following information pertains to the revenues and expenditures of the general fund. This data is included in
the schedule of revenues and expenditures-budgetary basis-budget-and actual, which presents financial
information on the budgetary basis of accounting.
Revenues and Other Financing Sources
Fiscal year 2011 actual revenues on a budgetary basis totaled $408.1 million. This represents an increase of
$26.4 million or 6.9% from fiscal year 2010. Property taxes are the single largest revenue source, representing
approximately 68.5% of general fund revenues, net of abatements. Sewer use receipts comprise the City‘s next
largest revenue source, representing 9.9%.

CITY OF CAMBRIDGE, MASSACHUSETTS
Required Supplementary Information
Management‘s Discussion and Analysis
June 30, 2011
(Unaudited)
12 (Continued)
Expenditures
During fiscal year 2011, total expenditures increased on a budgetary basis by 4.2% from $416.3 million to
$433.8 million.
Capital Asset and Debt Administration
Capital Assets
As of June 30, 2011, the City‘s capital assets of its governmental activities and business-type activity amounted
to $888.3 million (net of depreciation). The City‘s capital assets include land, buildings, improvements,
machinery and equipment, open space, road and highways.
Some of the major capital asset events during the current fiscal year included several ongoing sewer separation
projects scattered throughout the City, which are funded through bonds and state grants, completion of park
improvements and City building renovations.
Additional information on the City‘s capital assets can be found in note 5.
Debt
At year-end, the City had $328.6 million in outstanding bonds and notes compared to $323.5 million last year.
Governmental activities Business-type activity Totals
2011 2010 2011 2010 2011 2010
(In millions)
General obligation bonds and notes payable $ 306.7 296.6 21.9 26.9 328.6 323.5
The City maintains bond ratings with Fitch ratings of AAA, Moody‘s Investors Service Inc. of Aaa, and Standard
& Poor‘s Corporation of AAA.
Additional information on the City‘s debt can be found in note 8.
Economic Factors and Next Year’s Budgets and Rates
The City‘s tax levy increased $15.1 million, or 5.33%, to $299.1 million in fiscal year 2012. Despite this
increase, the City‘s excess tax capacity, an extremely important indication of the City‘s financial health,
increased from $99.4 million in FY 11 to $102.6 million in FY 12, a 3.3% increase.
The FY 12 operating budget increased by 1.75% over the FY 11 adjusted budget. The increase is attributable to
an 11.8% increase in employee health insurance, a 5.5% increase in employee pension costs. The capital budget
of $55.9 million is an increase of approximately $33.6 million from the prior year.

CITY OF CAMBRIDGE, MASSACHUSETTS
Required Supplementary Information
Management‘s Discussion and Analysis
June 30, 2011
(Unaudited)
13
New Accounting Standards
In 2011, The City implemented GASB Statement No. 54, Fund Balance Reporting and Governmental Fund Type
Definitions. The objective of this pronouncement is to enhance the usefulness of fund balance information and
provide clearer fund balance classifications. Currently, fund balance is reported as reserved and unreserved.
Effective for fiscal year 2011 reporting, fund balance is reported as restricted, committed, assigned, and
unassigned based on the relative strength of the constraints that control how specific amounts can be spent.
Additional information on GASB Statement No. 54 can be found in the notes to the financial statements.
Future Pronouncements
GASB has issued Statement Nos. 55-64, which have various effective dates throughout the year ended June 30,
2012. These Statements are not expected to have a significant impact on the City‘s financial statements.
Contacting the City’s Financial Management
This financial report is designed to provide our citizens, taxpayers, customers and creditors with a general
overview of the City‘s finances and to show the City‘s accountability for the money it receives. Questions
concerning the information provided in this report or requests for additional information should be addressed to:
City of Cambridge, Attn: City Auditor, 795 Massachusetts Avenue, Cambridge, MA 02139-3219.

CITY OF CAMBRIDGE, MASSACHUSETTS
Statement of Net Assets
June 30, 2011
Primary governmentGovernmental Business-type Component
Assets activities activity Total unit
Cash and investments $ 315,018,086 4,029,125 319,047,211 302,189,836 Cash and investments held by trustees 600,000 — 600,000 15,702,691 Receivables, net:
Property taxes 3,336,193 — 3,336,193 — Motor vehicle excise 946,975 — 946,975 — Tax title and possessions 3,056,350 — 3,056,350 — Intergovernmental 6,704,335 6,704,335 — Other 15,411,398 4,651,490 20,062,888 17,822,266
Other assets 3,564,847 68,831 3,633,678 50,721,646 Internal balances (32,723) 32,723 — — Due from component unit 10,495,000 — 10,495,000 — Capital assets:
Nondepreciable 340,416,181 46,854,851 387,271,032 21,381,994 Depreciable, net 416,514,225 84,561,200 501,075,425 172,815,367
Total assets 1,116,030,867 140,198,220 1,256,229,087 580,633,800
Liabilities
Warrants and accounts payable 21,753,848 636,184 22,390,032 103,601,394 Accrued liabilities:
Tax abatements 3,700,000 — 3,700,000 — Accrued payroll 13,094,062 60,729 13,154,791 10,603,534 Accrued interest 4,476,423 411,982 4,888,405 — Other 4,885,794 — 4,885,794 9,317,252
Unearned revenue — — — 44,079,905 Due to primary government — — — 10,495,000 Long-term liabilities:
Due within one year:Bonds and notes payable 34,932,727 3,535,000 38,467,727 533,333 Capital leases — — — 4,269,965 Due to third parties — — — 30,941,630 Compensated absences 6,770,000 190,000 6,960,000 16,075,935 Landfill 25,000 — 25,000 — Judgments and claims 14,335,000 204,000 14,539,000 — Pollution remediation 175,654 — 175,654 —
Due in more than one year:Bonds and notes payable 275,721,986 18,718,040 294,440,026 5,333,334 Capital leases — — — 13,393,374 Due to third parties — — — 36,646,262 Compensated absences 11,290,000 306,000 11,596,000 — Landfill 225,000 — 225,000 — Judgments and claims 10,271,000 683,000 10,954,000 — Other postemployment benefit obligation 86,709,262 — 86,709,262 30,817,071 Pollution remediation 1,161,122 — 1,161,122 —
Total liabilities 489,526,878 24,744,935 514,271,813 316,107,989
Net Assets
Investment in capital assets, net of related debt 497,650,641 109,176,777 606,827,418 160,172,355 Restricted for:
Community preservation 9,584,969 — 9,584,969 — Expendable permanent funds 1,371,803 — 1,371,803 — Nonexpendable permanent funds 2,075,173 — 2,075,173 — Other purposes 600,000 — 600,000 5,163,315
Unrestricted 115,221,403 6,276,508 121,497,911 99,190,141 Total net assets $ 626,503,989 115,453,285 741,957,274 264,525,811
See accompanying notes to basic financial statements.
14
CITY OF CAMBRIDGE, MASSACHUSETTS
Statement of Activities
Year ended June 30, 2011
Program revenues Net (expense) revenue and changes in net assetsOperating Capital Primary government
Charges for grants and grants and Governmental Business-type ComponentFunctions/programs Expenses services contributions contributions activities activity Total unit
Primary government:Governmental activities:
General government $ 46,676,807 434,069 — — (46,242,738) — (46,242,738) — Public safety 122,033,751 37,946,079 — — (84,087,672) — (84,087,672) — Community maintenance and development 90,907,773 42,168,021 3,741,672 8,684,933 (36,313,147) — (36,313,147) — Human resource development 45,752,191 3,606,526 8,782,446 — (33,363,219) — (33,363,219) — Education 171,283,824 1,544,095 13,038,648 406,342 (156,294,739) — (156,294,739) — Interest on long-term debt 9,756,666 — — — (9,756,666) — (9,756,666) —
Total governmental activities 486,411,012 85,698,790 25,562,766 9,091,275 (366,058,181) — (366,058,181)
Business-type activity:Water 13,544,425 19,130,204 — — — 5,585,779 5,585,779 —
Total business-type activity 13,544,425 19,130,204 — — — 5,585,779 5,585,779 Total primary government $ 499,955,437 104,828,994 25,562,766 9,091,275 (366,058,181) 5,585,779 (360,472,402)
Component unit:Cambridge Public Health Commission $ 1,284,600,860 230,455,007 1,108,812,286 — 54,666,433
Total component units $ 1,284,600,860 230,455,007 1,108,812,286 — 54,666,433
General revenues:Taxes:
Property taxes, levied for general purposes $ 282,244,351 — 282,244,351 — Excises 19,977,226 — 19,977,226 — Payments in lieu of taxes 7,344,911 — 7,344,911 —
Grants and contributions not restricted 31,795,812 — 31,795,812 — Investment income 1,255,842 131,185 1,387,027 920,059 Miscellaneous 18,978,421 — 18,978,421 —
Transfers 687,510 (687,510) — —
Total general revenues and transfers 362,284,073 (556,325) 361,727,748 920,059
Change in net assets (3,774,108) 5,029,454 1,255,346 55,586,492
Net assets – beginning 630,278,097 110,423,831 740,701,928 208,939,319 Net assets – ending $ 626,503,989 115,453,285 741,957,274 264,525,811
See accompanying notes to basic financial statements.
15

CITY OF CAMBRIDGE, MASSACHUSETTS
Balance Sheet – Governmental Funds
June 30, 2011
Affordable Other TotalCapital Housing governmental governmental
Assets General fund Trust fund funds funds
Cash and investments $ 183,045,990 59,572,863 37,547,000 34,852,233 315,018,086 Cash and investments held by trustees — — 600,000 — 600,000
Receivables, net:Property taxes 3,336,193 — — — 3,336,193 Motor vehicle excise 946,975 — — — 946,975 Tax title and possessions 3,056,350 — — — 3,056,350 Intergovernmental — 4,967,048 — 1,737,287 6,704,335 Departmental and other 10,448,658 — 4,253,242 709,498 15,411,398
Total receivables 17,788,176 4,967,048 4,253,242 2,446,785 29,455,251
Other assets 1,748,986 — — — 1,748,986 Due from other funds — 834,969 — — 834,969 Due from component unit 10,495,000 — — — 10,495,000
Total assets $ 213,078,152 65,374,880 42,400,242 37,299,018 358,152,292
Liabilities and Fund Balances
Liabilities:Warrants and accounts payable $ 6,656,223 13,283,421 — 1,814,204 21,753,848 Accrued liabilities:
Tax abatements 3,300,000 — — — 3,300,000 Judgments and claims 14,335,000 — — — 14,335,000 Accrued payroll 12,952,767 14,875 — 126,420 13,094,062 Other 4,840,222 — — 45,572 4,885,794
Deferred revenue 27,531,381 — — 53,328 27,584,709 Due to other funds 32,723 — — 834,969 867,692
Total liabilities 69,648,316 13,298,296 — 2,874,493 85,821,105
Fund balances:Nonspendable 1,668,986 — — 2,075,173 3,744,159 Restricted — 52,076,584 600,000 17,846,787 70,523,371 Committed 42,061,955 — 41,800,242 14,502,565 98,364,762 Unassigned 99,698,895 — — — 99,698,895
Total fund balances 143,429,836 52,076,584 42,400,242 34,424,525 272,331,187 Total liabilities and fund balances $ 213,078,152 65,374,880 42,400,242 37,299,018 358,152,292
See accompanying notes to basic financial statements.
16

CITY OF CAMBRIDGE, MASSACHUSETTS
Reconciliation of the Governmental Funds Balance Sheet tothe Statement of Net Assets
June 30, 2011
Total fund balance – governmental funds $ 272,331,187
Amounts reported for governmental activities in the statement of net assets aredifferent because:
Capital assets used in governmental activities are not financial resources andtherefore are not reported in the funds 756,930,406
Adjust deferred revenues to record revenues on an accrual basis 27,584,709 Bond issuance costs are capitalized in the government-wide statements 1,815,861
Some liabilities are not due and payable in the current period and therefore arenot reported in the funds. Those liabilities consist of:
General obligation bonds, net 310,654,713 Accrued interest on bonds 4,476,423 Compensated absences 18,060,000 Landfill 250,000 Judgments and claims 10,271,000 Tax abatements 400,000 Other postemployment benefits 86,709,262 Pollution remediation 1,336,776
432,158,174 Net assets of governmental activities $ 626,503,989
See accompanying notes to basic financial statements.
17

CITY OF CAMBRIDGE, MASSACHUSETTS
Statement of Revenues, Expenditures, and Changes in Fund Balances –Governmental Funds
Year ended June 30, 2011
Affordable Other TotalCapital Housing governmental governmental
General fund Trust fund funds funds
Revenues:Real and personal property taxes $ 281,812,153 — — — 281,812,153 Excises:
Hotel/motel/meals 13,573,132 — — — 13,573,132 Motor vehicles 6,452,602 — — — 6,452,602
Payments in lieu of taxes 7,344,911 — — — 7,344,911 Intergovernmental 31,795,812 9,091,275 — 25,562,766 66,449,853 Investment income 1,064,224 15,871 86,372 89,375 1,255,842 Sewer use charges 40,346,895 — — — 40,346,895 Departmental and other 34,561,571 681,698 707,423 29,769,732 65,720,424
Total revenues 416,951,300 9,788,844 793,795 55,421,873 482,955,812
Expenditures:Current:
General government 35,891,674 — — 358,969 36,250,643 Public safety 100,413,995 — — 1,439,350 101,853,345 Community maintenance and development 36,459,244 — 8,838,127 3,657,578 48,954,949 Human resource development 29,586,338 — — 8,782,088 38,368,426 Education 134,077,602 — — 13,341,394 147,418,996 Judgments and claims 9,029,151 — — — 9,029,151 State and district assessments 44,892,107 — — — 44,892,107
Capital outlays — 76,208,380 — — 76,208,380 Debt service 45,247,561 — — — 45,247,561
Total expenditures 435,597,672 76,208,380 8,838,127 27,579,379 548,223,558
Excess (deficiency) of revenuesover expenditures (18,646,372) (66,419,536) (8,044,332) 27,842,494 (65,267,746)
Other financing sources (uses):Premium on debt issuance 1,030,857 — — — 1,030,857 Issuance of debt — 46,220,000 — — 46,220,000 Transfers in 18,972,455 5,051,104 7,640,000 30,000 31,693,559 Transfers out (4,225,000) — — (26,781,049) (31,006,049)
Total other financing (uses) sources 15,778,312 51,271,104 7,640,000 (26,751,049) 47,938,367
Excess (deficiency) of revenues and otherfinancing sources over expendituresand other financing uses (2,868,060) (15,148,432) (404,332) 1,091,445 (17,329,379)
Fund balance – beginning 146,297,896 67,225,016 42,804,574 33,333,080 289,660,566 Fund balance – ending $ 143,429,836 52,076,584 42,400,242 34,424,525 272,331,187
See accompanying notes to basic financial statements.
18

CITY OF CAMBRIDGE, MASSACHUSETTS
Reconciliation of the Statement of Revenues, Expenditures, and
Changes in Fund Balance of Governmental Funds to the Statement of Activities
Year ended June 30, 2011
Net change in fund balances – total governmental funds $ (17,329,379)
Amounts reported for governmental activities in the statement of activities are differentbecause:
Governmental funds report capital outlays as expenditures. In the statement ofactivities, the cost of those assets is depreciated over their estimated usefullives. Capital outlays, applicable to capital assets, ($73,656,249) exceededdepreciation expense ($25,449,739) 48,206,510
Revenues are recorded on an accrual basis (1,006,418) Proceeds of long-term debt ($46,220,000) increase long-term liabilities in the
statement of net assets, but are included in the operating statement of thegovernmental funds. Repayment of bond principal ($36,081,367) is an expenditurein the governmental funds, but reduces long-term liabilities in the statementof net assets. This is the amount by which repayments exceeded proceeds (10,138,633)
Premiums received are revenues in the governmental funds, but are increases tolong-term liabilities, net of amortization, in the statement of net assets (538,522)
Deferred loss on refunding is amortized in the statement of activities and is notreported in the governmental funds (32,451)
Bond issuance costs are expenditures in the governmental funds, but aredeferred assets, net of amortization, in the statement of net assets 83,533
Other postemployment benefits expense reported in the statement of activities doesrequire the use of current financial resources, and therefore, is not reported asan expenditure in the governmental funds (24,368,835)
Some expenses reported in the statement of activities do not require the use ofcurrent financial resources, and therefore, are not reported as expenditures inthe governmental funds. This amount represents the decrease in landfill liabilities($25,000) and noncurrent claims ($2,435,000) offset by the increase inaccrued interest ($48,189), compensated balances ($456,000) and pollutionremediation ($605,724) 1,350,087
Change in net assets of governmental activities $ (3,774,108)
See accompanying notes to basic financial statements.
19
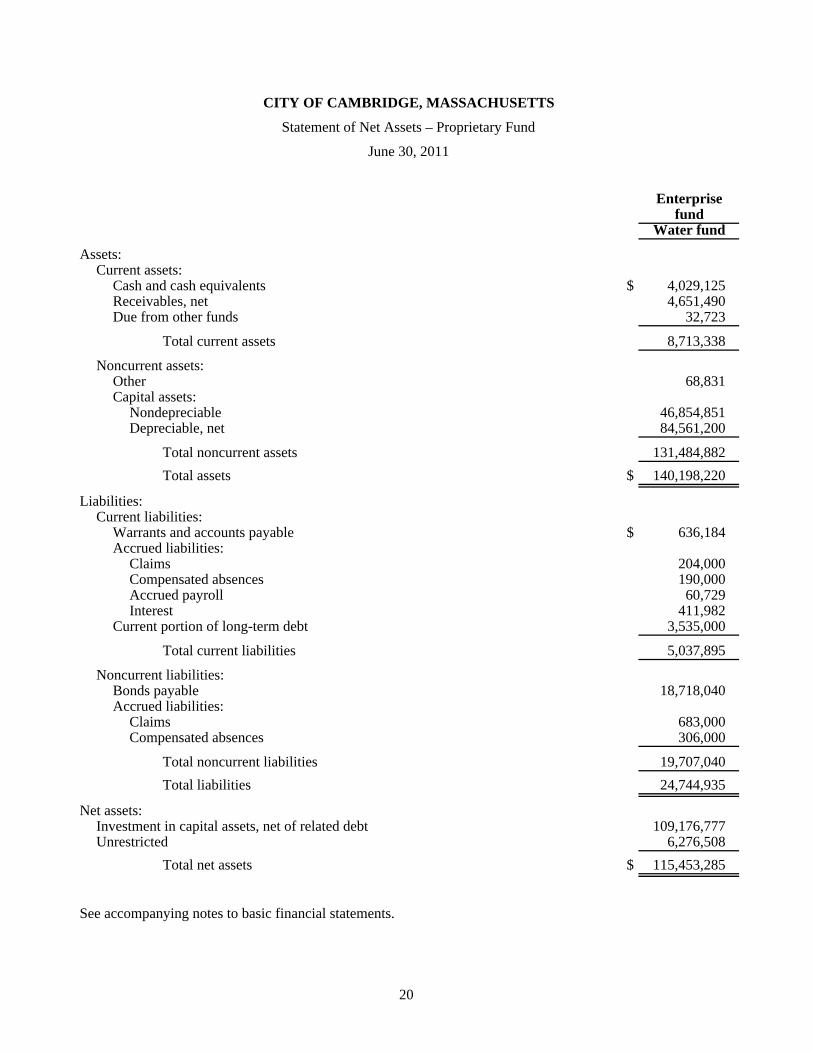
CITY OF CAMBRIDGE, MASSACHUSETTS
Statement of Net Assets – Proprietary Fund
June 30, 2011
Enterprisefund
Water fund
Assets:Current assets:
Cash and cash equivalents $ 4,029,125 Receivables, net 4,651,490 Due from other funds 32,723
Total current assets 8,713,338
Noncurrent assets:Other 68,831 Capital assets:
Nondepreciable 46,854,851 Depreciable, net 84,561,200
Total noncurrent assets 131,484,882 Total assets $ 140,198,220
Liabilities:Current liabilities:
Warrants and accounts payable $ 636,184 Accrued liabilities:
Claims 204,000 Compensated absences 190,000 Accrued payroll 60,729 Interest 411,982
Current portion of long-term debt 3,535,000
Total current liabilities 5,037,895
Noncurrent liabilities:Bonds payable 18,718,040 Accrued liabilities:
Claims 683,000 Compensated absences 306,000
Total noncurrent liabilities 19,707,040 Total liabilities 24,744,935
Net assets:Investment in capital assets, net of related debt 109,176,777 Unrestricted 6,276,508
Total net assets $ 115,453,285
See accompanying notes to basic financial statements.
20

CITY OF CAMBRIDGE, MASSACHUSETTS
Statement of Revenues, Expenses, and Changes in Net Assets – Proprietary Fund
Year ended June 30, 2011
Enterprisefund
Water fund
Operating revenues:Charges for services $ 19,130,204
Total operating revenues 19,130,204
Operating expenses:Administration 2,700,083 Service and support programs 6,923,218 Depreciation 2,880,169
Total operating expenses 12,503,470
Operating income 6,626,734
Nonoperating revenue (expense):Investment earnings – other 131,185 Interest expense (1,040,955)
Nonoperating expense (909,770)
Income before transfers 5,716,964
Transfers to other funds (687,510)
Change in net assets 5,029,454
Total net assets – beginning 110,423,831 Total net assets – ending $ 115,453,285
See accompanying notes to basic financial statements.
21
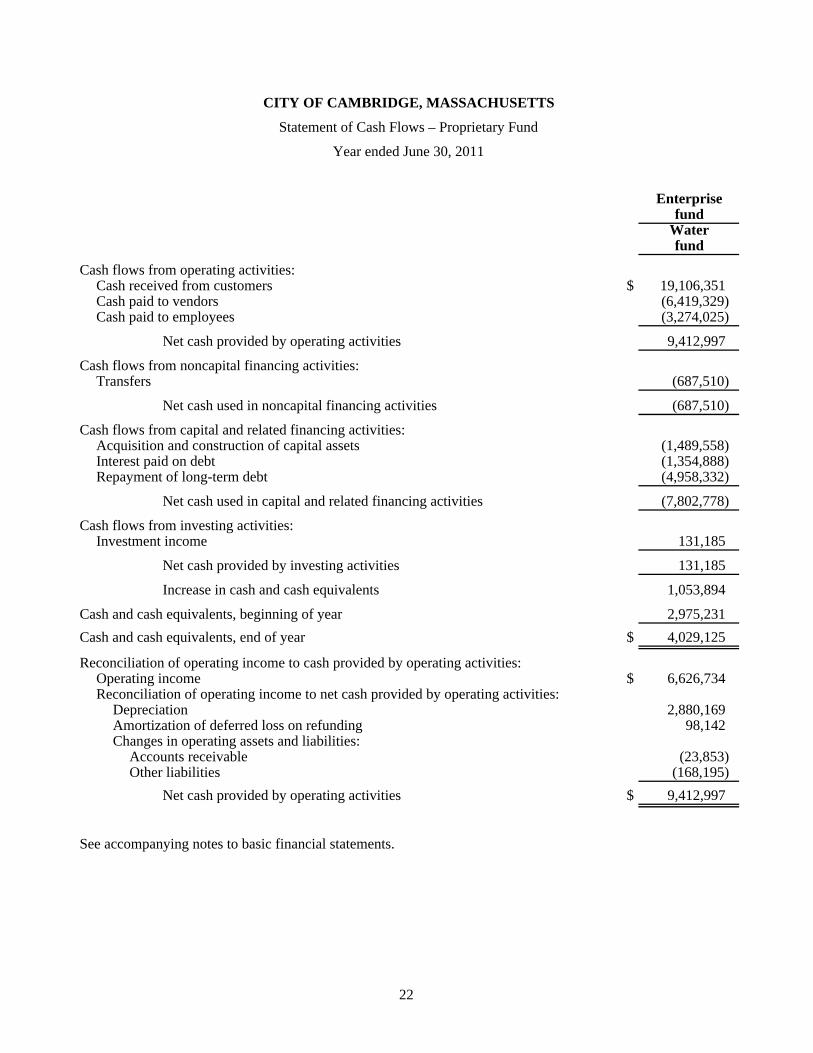
CITY OF CAMBRIDGE, MASSACHUSETTS
Statement of Cash Flows – Proprietary Fund
Year ended June 30, 2011
Enterprisefund
Waterfund
Cash flows from operating activities:Cash received from customers $ 19,106,351 Cash paid to vendors (6,419,329) Cash paid to employees (3,274,025)
Net cash provided by operating activities 9,412,997
Cash flows from noncapital financing activities:Transfers (687,510)
Net cash used in noncapital financing activities (687,510)
Cash flows from capital and related financing activities:Acquisition and construction of capital assets (1,489,558) Interest paid on debt (1,354,888) Repayment of long-term debt (4,958,332)
Net cash used in capital and related financing activities (7,802,778)
Cash flows from investing activities:Investment income 131,185
Net cash provided by investing activities 131,185
Increase in cash and cash equivalents 1,053,894
Cash and cash equivalents, beginning of year 2,975,231 Cash and cash equivalents, end of year $ 4,029,125
Reconciliation of operating income to cash provided by operating activities:Operating income $ 6,626,734 Reconciliation of operating income to net cash provided by operating activities:
Depreciation 2,880,169 Amortization of deferred loss on refunding 98,142 Changes in operating assets and liabilities:
Accounts receivable (23,853) Other liabilities (168,195)
Net cash provided by operating activities $ 9,412,997
See accompanying notes to basic financial statements.
22
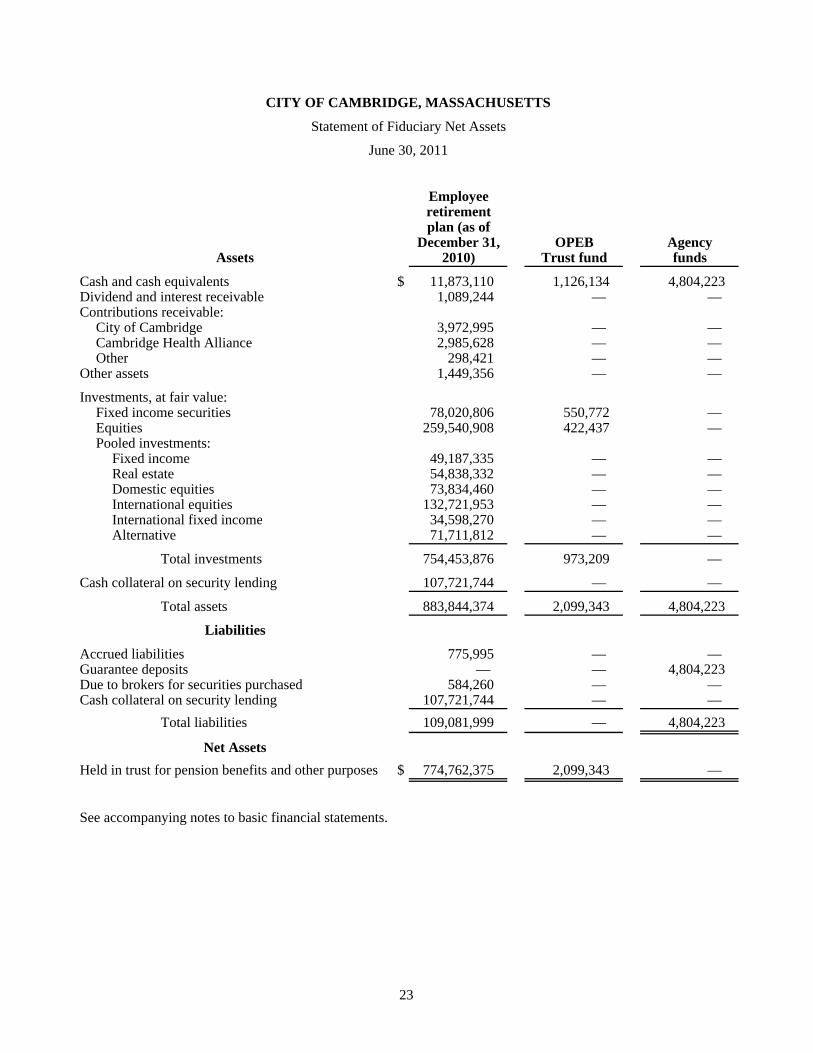
CITY OF CAMBRIDGE, MASSACHUSETTS
Statement of Fiduciary Net Assets
June 30, 2011
Employeeretirementplan (as of
December 31, OPEB AgencyAssets 2010) Trust fund funds
Cash and cash equivalents $ 11,873,110 1,126,134 4,804,223 Dividend and interest receivable 1,089,244 — — Contributions receivable:
City of Cambridge 3,972,995 — — Cambridge Health Alliance 2,985,628 — — Other 298,421 — —
Other assets 1,449,356 — —
Investments, at fair value:Fixed income securities 78,020,806 550,772 — Equities 259,540,908 422,437 — Pooled investments:
Fixed income 49,187,335 — — Real estate 54,838,332 — — Domestic equities 73,834,460 — — International equities 132,721,953 — — International fixed income 34,598,270 — — Alternative 71,711,812 — —
Total investments 754,453,876 973,209 —
Cash collateral on security lending 107,721,744 — —
Total assets 883,844,374 2,099,343 4,804,223
Liabilities
Accrued liabilities 775,995 — — Guarantee deposits — — 4,804,223 Due to brokers for securities purchased 584,260 — — Cash collateral on security lending 107,721,744 — —
Total liabilities 109,081,999 — 4,804,223
Net AssetsHeld in trust for pension benefits and other purposes $ 774,762,375 2,099,343 —
See accompanying notes to basic financial statements.
23

CITY OF CAMBRIDGE, MASSACHUSETTS
Statement of Changes in Fiduciary Net Assets
Year ended June 30, 2011
Employeeretirementplan (as of
December 31, OPEB2010) Trust fund
Additions:Contributions:
Employers $ 28,553,542 — Plan members 21,212,844 —
Other systems 1,677,825 — Commonwealth of Massachusetts 1,017,470 —
Total contributions 52,461,681 —
Investment earnings:Interest and dividends 13,544,529 60,268 Securities lending income 331,315 — Net appreciation (depreciation) in the fair value of investments 85,710,705 57,076 Less management fees (4,000,686) (4,235) Less borrower rebates and fees under securities
lending program (212,599) —
Net investment earnings 95,373,264 113,109
Total additions 147,834,945 113,109
Deductions:Benefits 48,961,941 — Refunds of contributions 2,649,461 — Other systems 1,899,249 — Administrative expenses 891,445 —
Total deductions 54,402,096 —
Change in net assets 93,432,849 113,109
Net assets, beginning of year 681,329,526 1,986,234 Net assets, end of year $ 774,762,375 2,099,343
See accompanying notes to basic financial statements.
24

CITY OF CAMBRIDGE, MASSACHUSETTS
Notes to Basic Financial Statements
June 30, 2011
25 (Continued)
(1) The Financial Reporting Entity
(a) Primary Government
Settled in 1630 by a group from the Massachusetts Bay Company, the City of Cambridge (the City) was incorporated as a town in 1636 and became a city in 1846. Since 1940, the City has operated under a Council Manager form of government. The legislative body of the City is the City Council, consisting of nine members elected at-large every two years; the Mayor and Vice Mayor are elected by the Council from among its members for a two-year term. Executive authority resides with the City Manager, who is appointed by the Council and is responsible for the delivery of services to City residents.
The Mayor also serves as Chair of the School Committee. The School Committee, whose members are elected, has full authority for operations of the school system and appoints a superintendent to administer the system‘s day-to-day operations.
The accompanying basic financial statements present the City of Cambridge and its component units. The component units discussed below are included in the City‘s reporting entity because of the significance of their operational or financial relationships with the City.
(b) Retirement System
The Cambridge Retirement System (the System) is a defined benefit contributory retirement system created under State statute. It is administered by a Retirement Board comprised of five members: the City Auditor who serves as ex officio; two individuals elected by participants in the System; a fourth member appointed by the City Manager and a fifth member chosen by the other members of the Retirement Board. The System provides pension benefits to retired City, Cambridge Housing Authority, Cambridge Redevelopment Authority and Cambridge Health Alliance employees. Although legally separate, the System provides services entirely or almost entirely to the City and thus has been reported as if it were part of the primary government; a method of inclusion known as blending.
The System is on a calendar fiscal year. As a result, the financial information of the System is as of and for the year ended December 31, 2010. The System does not issue stand alone financial statements. The System is included in the City‘s fiduciary fund financial statements.
(c) Discretely Presented Component Unit
The Cambridge Health Alliance (CHA) is reported in a separate column to emphasize that it is legally separate from the City, but is included because the City is financially accountable for and is responsible for the appointment of the hospital‘s board of trustees. Unless otherwise indicated, the notes to the basic financial statements pertain only to the primary government because certain disclosures of the component unit are not significant relative to the primary government. A description of the component unit, criteria for inclusion and its relationship with the City are as follows:
CHA is a body politic and corporate and public instrumentality of the Commonwealth of Massachusetts (the Commonwealth) established by Chapter 147 of the Acts of 1996. CHA is governed by a nineteen member board, all of whom are appointed by the City Manager. CHA is responsible for the implementation of public health programs in the City.

CITY OF CAMBRIDGE, MASSACHUSETTS
Notes to Basic Financial Statements
June 30, 2011
26 (Continued)
Complete financial statements for the CHA for its fiscal year ended June 30, 2011 are available from its offices on 101 Station Landing, 5th Floor, Medford, Massachusetts 02155.
(d) Related Organizations
The Manager is also responsible for appointing four of five board members to the Cambridge Housing Authority, subject to confirmation by the Council. However, the City‘s accountability for this organization does not extend beyond making these appointments.
(2) Summary of Significant Accounting Policies
The following is a summary of the more significant policies followed by the City:
(a) Government-Wide and Fund Financial Statements
The government-wide financial statements (i.e., the statement of net assets and the statement of activities) report information on all of the nonfiduciary activities of the primary government and its discretely presented component unit. For the most part, the effect of interfund activity has been removed from these statements. Governmental activities, which normally are supported by taxes and intergovernmental revenues, are reported separately from business-type activities, that rely to a significant extent on fees and charges for support. Likewise, the primary government is reported separately from the legally separate component unit for which the primary government is financially accountable.
The statement of activities demonstrates the degree to which the direct expenses of a given function or segment are offset by program revenues. Direct expenses are those that are clearly identifiable with a specific function or segment. Program revenues include (1) charges to customers or applicants who purchase, use, or directly benefit from goods, services, or privileges provided by a given function or segment and (2) grants and contributions that are restricted to meeting the operational or capital requirements of a particular function or segment. Taxes and other items not properly included among program revenues are reported instead as general revenues.
Separate financial statements are provided for governmental funds, proprietary funds, and fiduciary funds, even though the latter are excluded from the government-wide financial statements. Major individual governmental funds and the individual enterprise fund are reported as separate columns in the fund financial statements.
(b) Measurement Focus, Basis of Accounting, and Financial Statement Presentation
Government-Wide Financial Statements
The government-wide financial statements are reported using the economic resources measurement focus and the full accrual basis of accounting, as are the proprietary fund and Nonagency fiduciary fund financial statements. The agency fund has no basis of accounting and only reports assets and liabilities. Revenues are recorded when earned and expenses are recorded when a liability is incurred, regardless of the timing of related cash flows. Property taxes are recognized as revenues in the year for which they are levied. Grants and similar items are recognized as revenue as soon as all eligibility requirements have been met.

CITY OF CAMBRIDGE, MASSACHUSETTS
Notes to Basic Financial Statements
June 30, 2011
27 (Continued)
Amounts reported as program revenues include (1) charges to customers or applicants for goods, services, or privileges provided, (2) operating grants and contributions, and (3) capital grants and contributions, including special assessments. Internally dedicated resources are reported as general revenues rather than as program revenues. Likewise, general revenues include all taxes.
Governmental Fund Financial Statements
Governmental fund financial statements are reported using the current financial resources measurements focus and the modified accrual basis of accounting. Revenues are recognized as soon as they are ―susceptible to accrual‖ (i.e., both measurable and available). Revenues not considered to be available are recorded as deferred revenue.
The City applies the susceptible to accrual criteria to intergovernmental revenues. In applying the susceptible to accrual concept to intergovernmental revenues, there are essentially two types of revenues. In one, moneys must be expended for a specific purpose or project before any amounts will be paid to the City; therefore, revenues are recognized as expenditures are incurred. In the other, moneys are virtually unrestricted and are usually revocable only for failure to comply with proscribed requirements. These resources are reflected as revenues when cash is received, or earlier if the susceptible to accrual criteria are met. State aid is accrued as revenue in the year that the funds are appropriated by the Commonwealth.
Property taxes are recorded as revenue in the year for which the taxes have been levied, provided they are collected within 60 days after year-end. Investment income is recorded as earned. Other revenues are recorded when received in cash because they are generally not measurable until actually received.
Expenditures are recorded when the related fund liability is incurred except for (1) interest on general obligation debt, which is recorded when due; and (2) tax abatements and judgments and claims, all of which are recorded as expenditures to the extent that they have matured or are expected to be paid with expendable available financial resources.
Proprietary Fund Financial Statements
Private sector standards of accounting and financial reporting issued prior to December 1, 1989 are followed in both the government-wide and proprietary fund financial statements to the extent that those standards do not conflict with or contradict guidance of the Governmental Accounting Standards Board. Governments also have the option of following subsequent private sector guidance for their business-type activities and enterprise funds, subject to this same limitation. The City has elected not to follow subsequent private sector guidance.
Proprietary funds distinguish operating revenues and expenses from nonoperating items. Operating revenues and expenses generally result from providing services and producing and delivering goods in connection with a proprietary fund‘s principal ongoing operations. The principal operating revenues of the enterprise fund are charges to customers for water service. Operating expenses for the enterprise fund include the cost of preparing and delivering the water, administrative expenses, and depreciation on capital assets. All revenues and expenses not meeting this definition are reported as nonoperating revenues and expenses.

CITY OF CAMBRIDGE, MASSACHUSETTS
Notes to Basic Financial Statements
June 30, 2011
28 (Continued)
Governmental Funds – The City reports the following major governmental funds:
The general fund is the City‘s primary operating fund. It accounts for all financial resources of the general government, except those required to be accounted for in another fund.
The capital fund accounts for financial resources to be used for the acquisition or construction of major capital facilities.
The affordable housing trust fund accounts for financial resources to be used for the acquisition or construction of affordable housing units.
Proprietary Fund – The City reports the following major proprietary fund:
The water fund accounts for activities related to the preparation and delivery of water to City residents.
Fiduciary Funds – Additionally, the City reports the following fiduciary fund types:
The pension trust fund accounts principally for the activities of the System, which accumulates resources for pension benefit payments to retired City employees.
The OPEB trust fund is an irrevocable trust fund established for other postemployment benefits. The assets are appropriated from the General Fund and accumulate to reduce the unfunded actuarial liability of health care and other postemployment benefits. This fund is currently not used for payments of benefits.
The agency fund is used to report assets held in a trustee or agency capacity for others.
When both restricted and unrestricted resources are available for use, it is the City‘s policy to use restricted resources first, then unrestricted resources as they are needed.
(c) Cash Equivalents
For purposes of the statement of cash flows, investments with original maturities of three months or less when purchased are considered to be cash equivalents.
(d) Basis of Investment Valuation
Investments are presented in the accompanying basic financial statements at fair value. Where applicable, fair values are based on quotations from national securities exchanges, except for certain investments of the System, which are described in note 9. Further, income from investments is recognized in the same fund as the related investments.
(e) Interfund Receivables and Payables
Activity between funds that are representative of lending/borrowing arrangements outstanding at the end of the fiscal year are referred to as either ―due to/from other funds‖ (i.e., the current portion of interfund loans) or ―advances to/from other funds‖ (i.e., the noncurrent portion of interfund loans). All other outstanding balances between funds are reported as ―due to/from other funds.‖ Any residual balances outstanding between the governmental activities and the business-type activity are reported in the government-wide financial statements as ―internal balances.‖

CITY OF CAMBRIDGE, MASSACHUSETTS
Notes to Basic Financial Statements
June 30, 2011
29 (Continued)
(f) Uncollectible Tax and Other Receivables
All receivables are shown net of an allowance for uncollectibles. Amounts considered to be uncollectible are based on the type and age of the related receivable.
(g) Capital Assets
Capital assets, which include property, plant, equipment, and infrastructure assets (e.g., roads, bridges, sidewalks, and similar items), are reported in the applicable governmental or business-type activity columns in the government-wide financial statements. Capital assets are defined by the City as assets with an initial, individual cost of more than $10,000 and an estimated useful life in excess of five years. Such assets are recorded at historical cost or estimated historical cost if purchased or constructed. Donated capital assets are recorded at estimated fair market value at the date of donation.
The costs of normal maintenance and repairs that do not add to the value of the asset or materially extend assets‘ lives are not capitalized.
Capital assets of the primary government, as well as the component unit, are depreciated using the straight-line method over the following estimated useful lives:
Assets Years
Buildings and improvements 20 – 40Infrastructure 15 – 50Furniture and equipment 5 – 15
(h) Compensated Absences
Employees are granted sick and vacation leave in varying amounts. Upon retirement, termination, or death, certain employees are compensated for unused sick and vacation leave (subject to certain limitations) at their then current rates of pay. The cost of compensated absences for employees is recorded as earned in the government-wide and proprietary fund financial statements. A liability for these amounts is reported in the governmental funds only if it has matured (i.e., come due for payment). The liability for vacation leave is based on the amount earned but not used; for sick leave, it is based on the amount accumulated at the balance sheet date (vesting method).
(i) Long-Term Obligations and Related Costs
Premiums, discounts, and issue costs – In the government-wide financial statements, and proprietary fund types in the fund financial statements, long-term debt, and other long-term obligations are reported as liabilities in the applicable governmental activities, business-type activity, or proprietary fund type statement of net assets. Bond premiums and discounts, as well as issuance costs, are deferred and amortized over the life of the bonds using the effective-interest method. Bond issuance costs are reported as deferred charges and amortized over the term of the related debt.
In the fund financial statements, governmental fund types recognize bond premiums and discounts, as well as bond issuance costs, during the current period. The face amount of debt issued is reported as other financing sources. Premiums received on debt issuances are reported as other financing sources while discounts on debt issuances are reported as other financing uses. Issuance costs,

CITY OF CAMBRIDGE, MASSACHUSETTS
Notes to Basic Financial Statements
June 30, 2011
30 (Continued)
whether or not withheld from the actual debt proceeds received, are reported as general government expenditures.
(j) Net Assets and Fund Balance
In the Government-wide and Proprietary Fund Financial Statements, net assets are reported in the following categories:
Invested in capital assets, net of related debt: Capital assets, net of accumulated depreciation, and outstanding principal balances of debt attributable to the acquisition, construction, or improvement of those assets.
Restricted: Net assets the use of which is subject to constraints imposed by external parties, including creditors, grantors, and laws and regulations of other governments, or imposed by City Charter or enabling legislation. Nonexpendable amounts are required to remain intact under such constraints.
Unrestricted: Remaining net assets not considered invested in capital assets, net of related debt or restricted.
For purposes of net asset classification, when both restricted and unrestricted resources are available for use, it is the City‘s policy to use restricted resources first, then unrestricted resources as they are needed.
In the Governmental Fund Financial Statements, fund balance is reported in the following categories:
Nonspendable: Amounts that cannot be spent because they are either not in spendable form or they are legally or contractually required to remain intact.
Restricted: Amounts the use of which is subject to constraints imposed by external parties, including creditors, grantors, and laws and regulations of other governments, or imposed by City Charter or enabling legislation.
Committed: Amounts that can only be used for specific purposes pursuant to constraints imposed by formal action of the government‘s highest level of decision-making authority. For the City, this formal action takes the form of statutes which are passed by the City Council and approved by the Mayor.
Assigned: Amounts that are constrained by the City‘s intent for use for specific purposes, but are considered neither restricted or committed. The City Finance Director has the authority to assign amounts to be used for specific purposes on behalf of the City.
Unassigned: Amounts in the general fund that are not otherwise constrained for a specific purpose more narrow than the general operations of the City.

CITY OF CAMBRIDGE, MASSACHUSETTS
Notes to Basic Financial Statements
June 30, 2011
31 (Continued)
(k) Securities Lending Transactions
Collateral received on securities lending transactions is reported as an asset with a corresponding liability to the borrower. The underlying securities lent to the borrower under these transactions are reported as investments. Borrower rebates and administrative fees are reported as expenses; interest and dividends on the underlying securities and related collateral are reported as revenues.
(l) Landfill Postclosure Care Costs
State and federal regulations required the City to place a final cover on its Danehy Park landfill site when it stopped accepting waste and to perform certain maintenance and monitoring functions at the site for 30 years after closure. At June 30, 2011, 100% of the landfill site had been used and has not accepted solid waste for several years. This estimate is subject to changes due to inflation, deflation, technology or applicable laws, and regulations. The City has completed the covering of this site in accordance with applicable laws and regulations.
The liability for postclosure care is estimated based on current costs to perform certain maintenance and monitoring over the next twenty years. The total liability is reported in the statement of net assets.
(m) Use of Estimates
The preparation of the accompanying financial statements in conformity with accounting principles generally accepted in the United States of America, requires management to make estimates and assumptions that affect the reported amounts of assets and liabilities and disclosure of contingent assets and liabilities at the date of the financial statements and the reported amounts of revenues and expenses during the reporting period. Actual results could differ from those estimates.
(n) Fund Balance Classification Policies and Procedures
For the fiscal year ended June 30, 2011, the City implemented GASB Statement No. 54, Fund Balance Reporting and Governmental Fund Type Definitions (GASB 54). GASB 54 requires the use of new fund balance classifications that compose a hierarchy primarily based upon the extent to which the government is bound to follow constraints on the use of governmental fund resources. These classifications are described in note 2(j). GASB 54 also clarified the definitions of the governmental fund types. The effect of implementation of GASB 54 on the City‘s financial statements was limited to the use of the new fund balance classifications. Implementation did not result in a change in beginning fund balances nor did it affect the types of governmental funds reported by the City.
(3) Deposits and Investments
(a) Deposits
State and local statutes place certain limitations on the nature of deposits and investments available to the City. The City‘s policies require that deposits, including demand deposits, money markets, and certificates of deposit in any one financial institution, may not exceed certain levels unless collateralized or insured by the financial institution involved.

CITY OF CAMBRIDGE, MASSACHUSETTS
Notes to Basic Financial Statements
June 30, 2011
32 (Continued)
Custodial Credit Risk
Custodial credit risk is the risk that in the event of bank failure, the City‘s deposits may not be returned. As of June 30, 2011, the bank balances of uninsured and uncollateralized deposits are as follows:
Primary government $ 9,310,380 Discretely presented component unit
(CHA) —
$ 9,310,380
(b) Investments
Investments may be made in unconditionally guaranteed U.S. government obligations having maturities of a year or less from the date of purchase, or through repurchase agreements with maturities of no greater than 90 days in which the underlying securities consist of such obligations. Other allowable investments include authorized bonds of all states, bankers‘ acceptances, commercial paper rated within the three highest classifications established by rating agencies, and units in the Massachusetts Municipal Depository Trust (MMDT). The Treasurer of the Commonwealth of Massachusetts oversees the financial management of the MMDT, a local investment pool for cities, towns, and other state and local agencies within the Commonwealth. The City‘s fair value of its investment in the MMDT represents their value of the pool‘s shares.
The City‘s pension system and OPEB irrevocable trust fund have additional investment powers, most notably the ability to invest in common stocks, corporate bonds and other specified investments.
(i) System Investment Policy
The provisions of Massachusetts General Laws (M.G.L.) c. 32, sec 3(2) govern the System‘s investment practice.
Diversification is attained through varied investment management styles that comply with Massachusetts state law. This is accomplished through the retention of investment managers that adhere to M.G.L. c. 32, sec 23(3), the ―Prudent Person‖ rule.
The System has retained an investment consultant to work with the Retirement Board in a fiduciary capacity to assure that strategic investment diversification is attained, to employ investment managers with expertise in their respective asset classes, and to closely monitor the implementation and performance of the respective investment strategies.
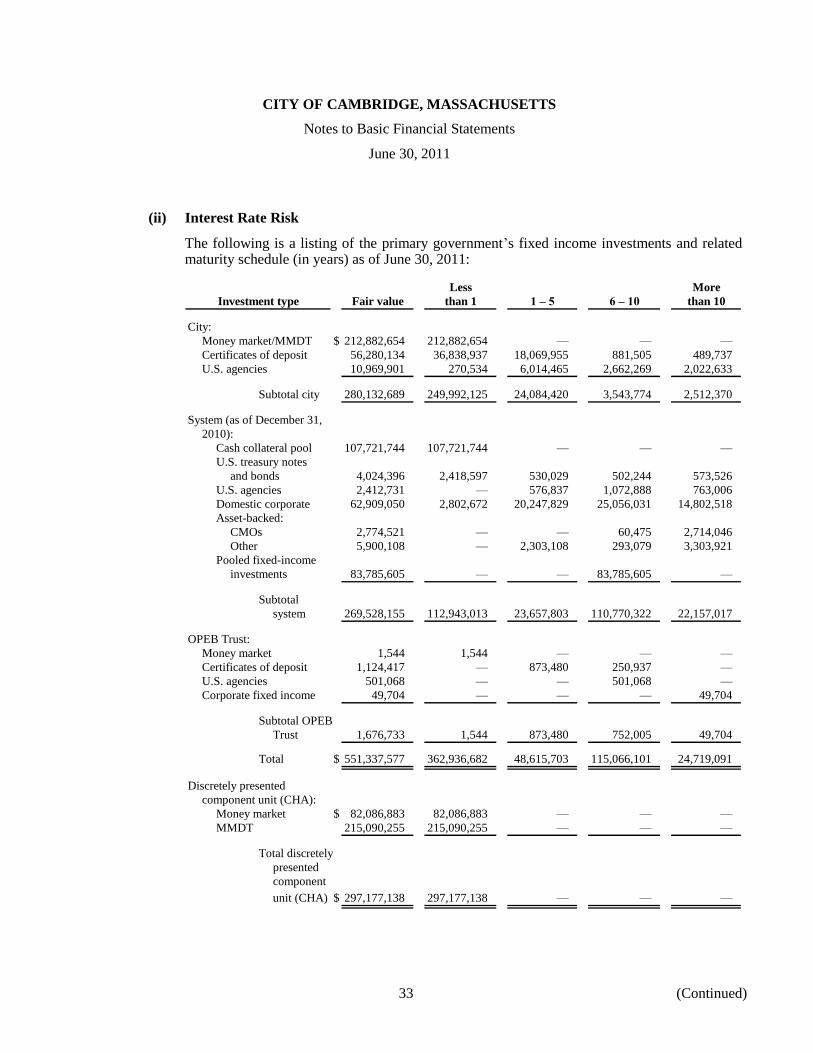
CITY OF CAMBRIDGE, MASSACHUSETTS
Notes to Basic Financial Statements
June 30, 2011
33 (Continued)
(ii) Interest Rate Risk
The following is a listing of the primary government‘s fixed income investments and related maturity schedule (in years) as of June 30, 2011:
Less More
Investment type Fair value than 1 1 – 5 6 – 10 than 10
City:
Money market/MMDT $ 212,882,654 212,882,654 — — —
Certificates of deposit 56,280,134 36,838,937 18,069,955 881,505 489,737
U.S. agencies 10,969,901 270,534 6,014,465 2,662,269 2,022,633
Subtotal city 280,132,689 249,992,125 24,084,420 3,543,774 2,512,370
System (as of December 31,
2010):
Cash collateral pool 107,721,744 107,721,744 — — —
U.S. treasury notes
and bonds 4,024,396 2,418,597 530,029 502,244 573,526
U.S. agencies 2,412,731 — 576,837 1,072,888 763,006
Domestic corporate 62,909,050 2,802,672 20,247,829 25,056,031 14,802,518
Asset-backed:
CMOs 2,774,521 — — 60,475 2,714,046
Other 5,900,108 — 2,303,108 293,079 3,303,921
Pooled fixed-income
investments 83,785,605 — — 83,785,605 —
Subtotal
system 269,528,155 112,943,013 23,657,803 110,770,322 22,157,017
OPEB Trust:
Money market 1,544 1,544 — — —
Certificates of deposit 1,124,417 — 873,480 250,937 —
U.S. agencies 501,068 — — 501,068 —
Corporate fixed income 49,704 — — — 49,704
Subtotal OPEB
Trust 1,676,733 1,544 873,480 752,005 49,704
Total $ 551,337,577 362,936,682 48,615,703 115,066,101 24,719,091
Discretely presented
component unit (CHA):
Money market $ 82,086,883 82,086,883 — — —
MMDT 215,090,255 215,090,255 — — —
Total discretely
presented
component
unit (CHA) $ 297,177,138 297,177,138 — — —

CITY OF CAMBRIDGE, MASSACHUSETTS
Notes to Basic Financial Statements
June 30, 2011
34 (Continued)
The System‘s guidelines do not specifically address limits on maturities as a means of managing its exposure to fair value losses arising from increasing interest rates. The manager of each fixed income portfolio is responsible for determining the maturity and commensurate returns of their portfolio.
The collateralized mortgage obligations (CMOs) held by the System are highly sensitive to changes in interest rates.
(iii) Credit Risk
The System allows investment managers to apply discretion under the ―Prudent Person‖ rule. Investments are made, as a prudent person would be expected to act with discretion and intelligence, to seek reasonable income, preserve capital and, in general, avoid speculative investments.

CITY OF CAMBRIDGE, MASSACHUSETTS
Notes to Basic Financial Statements
June 30, 2011
35 (Continued)
The primary government‘s fixed income investments as of June 30, 2011 were rated by
Standard and Poor‘s and/or an equivalent national rating organization and the ratings are
presented below using the Standard and Poor‘s rating scale:
Fair Less Not
Investment type value AAA AA A BBB BB than BB rated
City:
Money market/MMDT $ 212,882,654 — — — — — — 212,882,654
Certificates of deposit 56,280,134 — — — — — — 56,280,134
U.S. agencies 10,969,901 10,969,901 — — — — — —
Subtotal
city 280,132,689 10,969,901 — — — — — 269,162,788
System (as of
December 31, 2010):
Cash collateral pool 107,721,744 — — — — — — 107,721,744
U.S. agencies 2,412,731 2,412,731 — — — — — —
Domestic corporate 62,909,050 6,700,033 4,216,535 12,779,313 8,700,409 12,116,887 17,492,058 903,815
Asset-backed:
CMOs 2,774,521 2,060,363 714,158 — — — — —
Other 5,900,108 2,646,720 270,029 415,656 232,480 — 59,454 2,275,769
Pooled fixed-income
investments 83,785,605 — — — — — — 83,785,605
Subtotal
system 265,503,759 13,819,847 5,200,722 13,194,969 8,932,889 12,116,887 17,551,512 194,686,933
OPEB Trust:
Money market 1,544 — — — — — — 1,544
Certificates of deposit 1,124,417 — — — — — — 1,124,417
U.S. agencies 501,068 501,068 — — — — — —
Corporate fixed income 49,704 — — 49,704 — — — —
Subtotal OPEB
Trust 1,676,733 501,068 — 49,704 — — — 1,125,961
Total $ 547,313,181 25,290,816 5,200,722 13,244,673 8,932,889 12,116,887 17,551,512 464,975,682
Discretely presented
component unit (CHA):
Money market $ 82,086,883 Not rated
MMDT 215,090,255 Not rated
Total discretely
presented
component
unit (CHA) $ 297,177,138
In addition to the above schedule, the System had $4,024,396 invested in U.S. government
securities, which are not rated as they are explicitly guaranteed by the U.S. government.
(iv) Concentration Risk
The System has no individual investments, at fair value, that exceed 5% of the System‘s net
assets held in trust for pension benefits as of December 31, 2010.
The System adheres to the provisions of M.G.L. c. 32, sec 23(2) when managing concentration
risk.
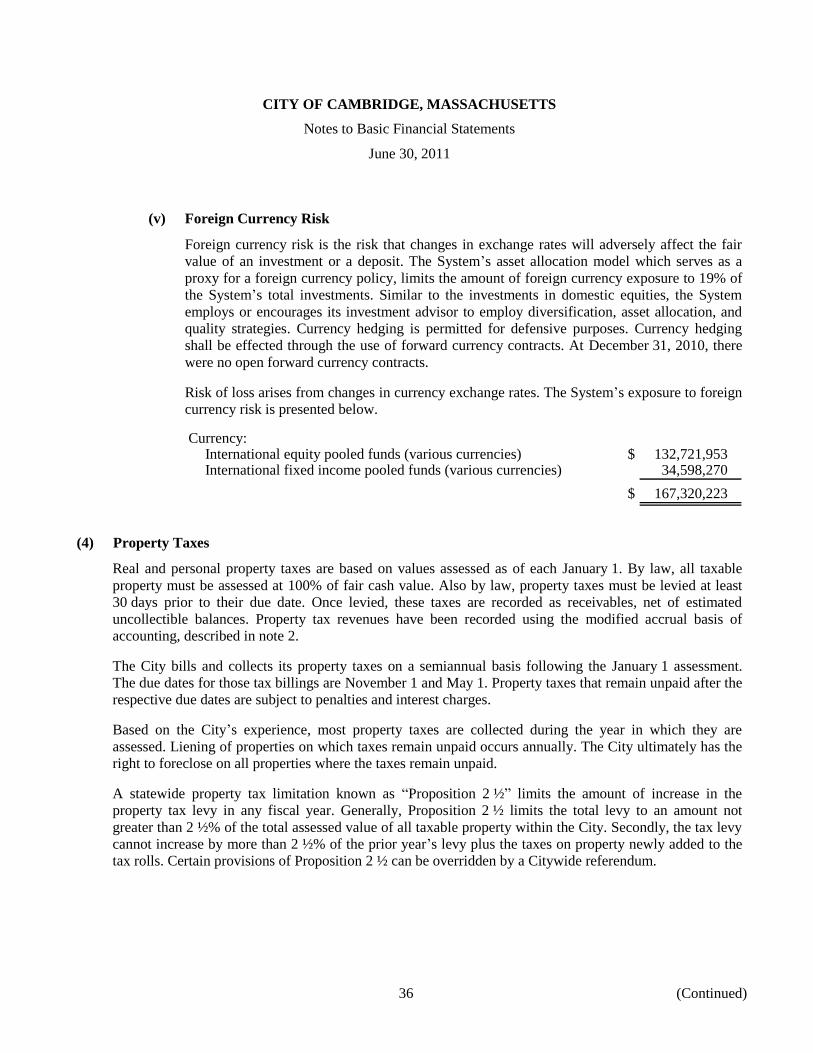
CITY OF CAMBRIDGE, MASSACHUSETTS
Notes to Basic Financial Statements
June 30, 2011
36 (Continued)
(v) Foreign Currency Risk
Foreign currency risk is the risk that changes in exchange rates will adversely affect the fair
value of an investment or a deposit. The System‘s asset allocation model which serves as a
proxy for a foreign currency policy, limits the amount of foreign currency exposure to 19% of
the System‘s total investments. Similar to the investments in domestic equities, the System
employs or encourages its investment advisor to employ diversification, asset allocation, and
quality strategies. Currency hedging is permitted for defensive purposes. Currency hedging
shall be effected through the use of forward currency contracts. At December 31, 2010, there
were no open forward currency contracts.
Risk of loss arises from changes in currency exchange rates. The System‘s exposure to foreign
currency risk is presented below.
Currency:International equity pooled funds (various currencies) $ 132,721,953 International fixed income pooled funds (various currencies) 34,598,270
$ 167,320,223
(4) Property Taxes
Real and personal property taxes are based on values assessed as of each January 1. By law, all taxable
property must be assessed at 100% of fair cash value. Also by law, property taxes must be levied at least
30 days prior to their due date. Once levied, these taxes are recorded as receivables, net of estimated
uncollectible balances. Property tax revenues have been recorded using the modified accrual basis of
accounting, described in note 2.
The City bills and collects its property taxes on a semiannual basis following the January 1 assessment.
The due dates for those tax billings are November 1 and May 1. Property taxes that remain unpaid after the
respective due dates are subject to penalties and interest charges.
Based on the City‘s experience, most property taxes are collected during the year in which they are
assessed. Liening of properties on which taxes remain unpaid occurs annually. The City ultimately has the
right to foreclose on all properties where the taxes remain unpaid.
A statewide property tax limitation known as ―Proposition 2 ½‖ limits the amount of increase in the
property tax levy in any fiscal year. Generally, Proposition 2 ½ limits the total levy to an amount not
greater than 2 ½% of the total assessed value of all taxable property within the City. Secondly, the tax levy
cannot increase by more than 2 ½% of the prior year‘s levy plus the taxes on property newly added to the
tax rolls. Certain provisions of Proposition 2 ½ can be overridden by a Citywide referendum.

CITY OF CAMBRIDGE, MASSACHUSETTS
Notes to Basic Financial Statements
June 30, 2011
37 (Continued)
(5) Capital Assets
Capital asset activity for the year ended June 30, 2011 was as follows:
Primary Government
Beginning Ending
balance Increases Decreases balance
Governmental activities:
Capital assets not being depreciated:
Land $ 165,207,775 — — 165,207,775
Construction in progress 169,567,443 80,926,183 (75,285,220) 175,208,406
Total capital assets not
being depreciated 334,775,218 80,926,183 (75,285,220) 340,416,181
Capital assets being depreciated:
Buildings and improvements 332,993,070 72,534 — 333,065,604
Improvements – nonbuilding 52,626,333 43,922,585 — 96,548,918
Furniture and equipment 50,948,947 3,231,032 — 54,179,979
Infrastructure 241,475,996 20,789,135 — 262,265,131
Total capital assets
being depreciated 678,044,346 68,015,286 — 746,059,632
Less accumulated depreciation for:
Buildings and improvements (97,954,489) (9,861,134) — (107,815,623)
Improvements – nonbuilding (16,905,869) (3,120,483) — (20,026,352)
Furniture and equipment (38,697,879) (2,336,899) — (41,034,778)
Infrastructure (150,537,431) (10,131,223) — (160,668,654)
Total accumulated
depreciation (304,095,668) (25,449,739) — (329,545,407)
Total capital assets
being depreciated, net 373,948,678 42,565,547 — 416,514,225
Governmental activities
capital assets, net $ 708,723,896 123,491,730 (75,285,220) 756,930,406

CITY OF CAMBRIDGE, MASSACHUSETTS
Notes to Basic Financial Statements
June 30, 2011
38 (Continued)
Depreciation expense was charged to functions/programs of the primary government as follows:
Governmental activities:General government $ 709,925 Public safety 3,027,875 Community maintenance and development 14,948,207 Human resource development 1,883,940 Education 4,879,792
Total depreciation expense – governmental activities $ 25,449,739
Beginning Ending
balance Increases Decreases balance
Business-type activity:
Capital assets not being depreciated:
Land $ 39,264,325 — — 39,264,325
Construction in progress 8,570,936 1,309,015 (2,289,425) 7,590,526
Total capital assets not
being depreciated 47,835,261 1,309,015 (2,289,425) 46,854,851
Capital assets being depreciated:
Buildings and improvements 80,593,321 524,317 — 81,117,638
Furniture and equipment 1,633,393 261,777 — 1,895,170
Infrastructure 34,896,842 1,683,874 — 36,580,716
Total capital assets
being depreciated 117,123,556 2,469,968 — 119,593,524
Less accumulated depreciation for:
Buildings and improvements (17,961,663) (2,040,521) — (20,002,184)
Furniture and equipment (1,248,899) (106,309) — (1,355,208)
Infrastructure (12,941,593) (733,339) — (13,674,932)
Total accumulated
depreciation (32,152,155) (2,880,169) — (35,032,324)
Total capital assets
being depreciated, net 84,971,401 (410,201) — 84,561,200
Business-type activity
capital assets, net $ 132,806,662 898,814 (2,289,425) 131,416,051

CITY OF CAMBRIDGE, MASSACHUSETTS
Notes to Basic Financial Statements
June 30, 2011
39 (Continued)
(6) Receivables
Receivables as of year-end for the government‘s individual major funds and nonmajor funds, including the
applicable allowances for uncollectible accounts, are as follows:
Enterprise
Government funds fund
Affordable Other Total
Capital Housing governmental governmental Water
General fund Trust fund funds funds fund
Receivables:Property taxes $ 3,969,474 — — — 3,969,474 — Motor vehicle taxes 3,180,783 — — — 3,180,783 — Other taxes 3,395,944 — — — 3,395,944 —
Intergovernmental — 9,128,528 — 1,737,287 10,865,815 — Other 10,625,601 — 7,635,242 709,498 18,970,341 4,698,475
Gross receivables 21,171,802 9,128,528 7,635,242 2,446,785 40,382,357 4,698,475
Less allowance for uncollectibles 3,383,626 4,161,480 3,382,000 — 10,927,106 46,985
Net total receivables $ 17,788,176 4,967,048 4,253,242 2,446,785 29,455,251 4,651,490
(7) Receivable and Payable Balances between Funds and Component Unit
Individual fund receivable and payable balances at June 30, 2011, are as follows:
Interfund balances Receivable Payable
General fund – payable to water fund – for bondpremium transfer $ — 32,723
Capital fund – receivable from other governmental funds –for capital items 834,969 —
Enterprise fund – receivable from general fund forbond premium 32,723 —
Other governmental funds – community development blockgrant payable to capital fund – for capital items — 834,969
Balance at June 30, 2011 $ 867,692 867,692
Receivable and payable balances between the primary government and CHA at June 30, 2011 are as
follows:
Discrete component unit balances Receivable Payable
Primary government:General $ 10,495,000 —
Discretely presented component unit:CHA — 10,495,000
Balance at June 30, 2011 $ 10,495,000 10,495,000

CITY OF CAMBRIDGE, MASSACHUSETTS
Notes to Basic Financial Statements
June 30, 2011
40 (Continued)
In 1998, the City issued $30 million of general obligation hospital bonds. The proceeds were provided to
the CHA for the construction of an ambulatory care center. CHA has assumed responsibility for paying to
the City an amount equal to current debt service on all outstanding general obligation bonds of the City
issued for public health and hospital purposes. In 2007, the City refunded a portion of the original general
obligation hospital bond. As of June 30, 2011, the amount outstanding on hospital related debt is
$10,495,000.

CITY OF CAMBRIDGE, MASSACHUSETTS
Notes to Basic Financial Statements
June 30, 2011
41 (Continued)
(8) Long-Term Obligations
Following is a summary of the governmental activities long-term obligations of the City as of June 30, 2011:
Outstanding,
Interest beginning Outstanding, Due within
Date of issue rates of year Additions Reductions end of year one year
General obligation bonds:General purpose, serial maturities through February 15, 2031 12/1/00 to 2/15/11 2.0% – 5.0% $ 205,325,776 28,020,000 16,292,598 217,053,178 17,542,598 Urban redevelopment, serial maturities through
February 15, 2021 12/1/00 to 2/15/11 2.0% – 5.0% 19,375,500 3,200,000 4,775,000 17,800,500 4,450,000 Schools, serial maturities through February 1, 2018 12/1/00 to 2/1/08 3.0% – 5.0% 4,307,336 — 1,002,167 3,305,169 472,167 Sewer, serial maturities through February 15, 2021 11/1/00 to 2/15/11 2.0% – 5.0% 49,289,500 15,000,000 12,273,330 52,016,170 10,416,856
Hospital, serial maturities through February 1, 2018 3/15/07 4.0% 11,995,000 — 1,500,000 10,495,000 1,500,000
Sub-total general obligation bonds 290,293,112 46,220,000 35,843,095 300,670,017 34,381,621
Notes payable:Section 108 HUD notes payable, serial maturities
through August 1, 2014 9/14/06 5.07% 290,000 — 25,000 265,000 30,000 Note payable serial maturities through July 1, 2021 4/20/00 to 6/30/01 2.00 6,000,000 — 213,272 5,786,728 521,106
Sub-total notes payable 6,290,000 — 238,272 6,051,728 551,106
Total governmental obligation bonds and notes payable $ 296,583,112 46,220,000 36,081,367 306,721,745 34,932,727
Add (deduct):Unamortized bond premium 4,082,819
Deferred loss on refunding (149,851) Current portion of long-term debt (34,932,727)
$ 275,721,986
Other long-term obligations:Judgments and claims $ 19,017,000 46,079,984 40,490,984 24,606,000 14,335,000 Compensated absences 17,604,000 17,963,100 17,507,100 18,060,000 6,770,000
Landfill postclosure care costs 275,000 — 25,000 250,000 25,000 Other postemployment benefits 62,340,427 46,624,000 22,255,165 86,709,262 — Pollution remediation 731,052 1,803,787 1,198,063 1,336,776 175,654
Total other governmental long-term obligations $ 99,967,479 112,470,871 81,476,312 130,962,038 21,305,654

CITY OF CAMBRIDGE, MASSACHUSETTS
Notes to Basic Financial Statements
June 30, 2011
42 (Continued)
Following is a summary of the business-type activity long-term obligations of the City as of June 30, 2011:
Outstanding,
Interest beginning Outstanding, Due within
Date of issue rates of year Additions Reductions end of year one year
General obligation bonds:General purpose, serial maturities
through August 1, 2019 11/1/00 to 3/15/07 2.5% – 5.63% $ 26,853,332 — 4,958,332 21,895,000 3,535,000
Total business-type bonds payable $ 26,853,332 — 4,958,332 21,895,000 3,535,000
Add (deduct):Unamortized bond premium 946,664 Deferred loss on refunding (588,624)
Current portion of long-term debt (3,535,000)
$ 18,718,040
Other long-term obligations:
Judgments and claims $ 1,312,000 1,706,016 2,131,016 887,000 204,000 Compensated absences 562,000 414,400 480,400 496,000 190,000
Total other long-term obligations $ 1,874,000 2,120,416 2,611,416 1,383,000 394,000

CITY OF CAMBRIDGE, MASSACHUSETTS
Notes to Basic Financial Statements
June 30, 2011
43 (Continued)
The payment of liabilities for judgments and claims, compensated absences and landfill postclosure costs are primarily the responsibility of the City‘s general fund.
General obligation bonds are backed by the full faith and credit of the City. The annual debt service requirements of the City‘s general obligation governmental bonds and notes payable outstanding as of June 30, 2011, are as follows:
Principal Interest Total
G/O bonds Notes G/O bonds Notes G/O bonds Notes
Year ending June 30:
2012 $ 34,381,621 551,106 10,585,822 123,900 44,967,443 675,006 2013 31,823,404 592,320 9,501,168 111,317 41,324,572 703,637 2014 28,622,774 608,671 8,458,023 98,329 37,080,797 707,000
2015 26,277,218 755,250 7,509,851 82,557 33,787,069 837,807 2016 22,680,000 597,062 6,641,996 65,434 29,321,996 662,496 2017 – 2021 83,360,000 2,910,574 23,232,238 144,272 106,592,238 3,054,846
2022 – 2026 52,555,000 36,744 10,535,731 61 63,090,731 36,805 2027 – 2031 20,970,000 — 1,938,490 — 22,908,490 —
$ 300,670,017 6,051,727 78,403,319 625,870 379,073,336 6,677,597
The City has entered into loan agreements with the President and Fellows of Harvard College. The loans provide funding to further the development of affordable housing within the City. The notes carry interest at 2% per year for a period of twenty years with principal payments beginning in 2010. Interest costs will be $117,000 annually. At June 30, 2011, the principal amount outstanding is $5,786,728.
Principal retirement of governmental funds has been reflected in the basic financial statements as debt service expenditures of $34.8 million and education expenditures of $1 million totaling $35.8 million of principal costs.
In February 2011, the City issued $46,220,000 in general obligation bonds to fund various capital purchases and improvements throughout the City. Interest on the general obligation bonds is due semiannually on each February 15 and August 15, with principal payments due each February 15 until maturity in fiscal 2031.
The City enters into loan agreements with the Massachusetts Water Pollution Abatement Trust (MWPAT) to provide funding for sewer separation and drinking water projects. According to the loan agreements, the City will be subsidized on a periodic basis for debt and interest costs. The City received $1,472,500 in subsidies during 2011 and expects to receive subsidies totaling approximately $328,400 through 2015. Loan payments commenced on February 1, 2005 and end on August 1, 2014, with interest rates ranging from 4.0% to 5.0%.
The City is subject to a dual general debt limit: the normal debt limit and the double debt limit. Such limits are equal to 5% and 10%, respectively, of the valuation of taxable property in the City as last equalized by the State Department of Revenue. Debt may be authorized up to the normal debt limit without state approval. Authorizations under the double debt limit, however, require the approval of the State Municipal Finance Oversight Board. Additionally, there are many categories of general obligation debt which are exempt from the debt limit, but are subject to other limitations.

CITY OF CAMBRIDGE, MASSACHUSETTS
Notes to Basic Financial Statements
June 30, 2011
44 (Continued)
As of June 30, 2011, the City may issue approximately $1.0 billion additional general obligation debt under the normal debt limit. The City has approximately $27.9 million of debt exempt from the debt limit.
The annual debt service requirements of the City‘s water enterprise fund as of June 30, 2011 are as follows:
Principal Interest Total
Year ending June 30:2012 $ 3,535,000 994,976 4,529,976 2013 2,840,000 842,801 3,682,801 2014 2,840,000 708,000 3,548,000 2015 2,540,000 572,301 3,112,301 2016 2,420,000 446,501 2,866,501 2017 – 2020 7,720,000 625,004 8,345,004
$ 21,895,000 4,189,583 26,084,583
The City‘s commitment under operating leases is not significant.
In 2007, the CHA entered into a commercial loan of $8 million to finance renovations at one of its leased facilities. CHA has swapped its variable rate (30 day LIBOR +0.50 basis points) for a fixed rate of 5.69%. The annual scheduled debt service requirements as of June 30, 2011 are as follows:
Principal Interest Total
Year ending June 30:2012 $ 533,333 319,905 853,238 2013 533,333 289,558 822,891 2014 533,333 259,211 792,544 2015 533,333 228,864 762,197 2016 2,666,667 689,122 3,355,789 2017 – 2022 1,066,668 63,222 1,129,890
$ 5,866,667 1,849,882 7,716,549
(9) Retirement Plan
(a) Plan Description
The City contributes to the System, a cost sharing, multi employer public employee retirement system. The System provides retirement, disability, and death benefits to plan members and beneficiaries of the following governmental units:
(i) City of Cambridge
(ii) Cambridge Redevelopment Authority
(iii) Cambridge Housing Authority

CITY OF CAMBRIDGE, MASSACHUSETTS
Notes to Basic Financial Statements
June 30, 2011
45 (Continued)
(iv) Cambridge Health Alliance
The System is a member of the Massachusetts Contributory System, which is governed by Chapter 32 of the Massachusetts General Laws (MGL).
The System is administered by a five-person Board of Retirement consisting of the City Auditor who serves as a member ex officio, two members who are elected by the participants, in or retired from the service of the System, a fourth member appointed by the Manager and a fifth member chosen by the other members.
(b) Basis of Accounting
The System‘s financial statements are prepared using the full accrual basis of accounting. Plan member contributions are recognized in the period in which the contributions are due. Employer contributions to the plan are recognized when due and the employer has made a formal commitment to provide the contributions. Benefits and refunds are recognized when due and payable in accordance with the terms of each plan.
Investments of the System are stated as follows:
(i) Fixed income securities are stated at quoted market value.
(ii) Equity securities are stated at quoted market value.
(iii) Real estate funds are stated at partner‘s account value based upon the appraised value of the underlying investments.
(iv) Venture capital funds are stated at the lower of contributed cost or fair value.
(v) International investments are stated at quoted market value and are included in equities and fixed income categories.
(vi) Alternative investments are stated at partner‘s account or unit value.
(c) Membership
Membership in the System consisted of the following at January 1, 2010, the date of the latest actuarial valuation:
Retirees and beneficiaries receiving benefits 1,809 Terminated plan members entitled to, but not receiving benefits 1,001 Terminated plan members with a vested right to a deferred or
immediate benefit 173 Active plan members 3,614
Total membership 6,597
Total number of participating employers 4

CITY OF CAMBRIDGE, MASSACHUSETTS
Notes to Basic Financial Statements
June 30, 2011
46 (Continued)
(d) Contributions
Plan members are required to contribute to the System. Depending on their employment date, active members must contribute a range of 5% to 9% of their regular gross compensation. Members hired after December 31, 1978 must contribute an additional 2% of regular compensation in excess of $30,000. Participating employers are required to pay into the System their share of the remaining system-wide actuarially determined contribution, which is apportioned among the employers based on active covered payroll. The contributions of plan members and the participating employers are governed by Chapter 32 of the MGL. The City‘s and CHA‘s actual contributions equaled their required contributions to the System for the years ended June 30, 2011, 2010, and 2009 were $22,096,592, $21,565,919, and $20,876,886, respectively, and $5,017,900, $4,871,695, and $4,792,800 respectively.
The Commonwealth reimburses the System for a portion of the benefits payments for cost of living increases granted before July 1998.
(e) Legally Required Reserve Accounts
The balances in the System‘s legally required reserves (on the statutory basis of accounting) at December 31, 2010 are as follows:
Description Amount Purpose
Annuity savings fund $ 212,738,880 Active members‘ contribution balanceAnnuity reserve fund 54,594,850 Retired members‘ contribution accountMilitary service credit fund 5,882 Members‘ contribution account while
on military leavePension reserve fund 502,102,661 Amounts appropriated to fund future
retirement benefitsPension fund 5,320,102 Remaining net assets
$ 774,762,375
All reserve accounts are funded at levels required by State statute.
(f) Securities Lending
The Public Employment Retirement Administration Commission of Massachusetts (PERAC) has issued supplemental regulations that permit the System to engage in securities lending transactions. These transactions are conducted by the System‘s custodian, which lends certain securities owned by the System to other broker dealers and banks pursuant to a form of loan agreement. The System and the borrowers maintain the right to terminate all securities lending transactions on demand.
At the System‘s direction, the custodian lends the System‘s securities and receives cash (including both U.S. and foreign currency), U.S. government securities, sovereign debt of foreign countries, and irrevocable bank letters of credit as collateral. The custodian does not have the ability to pledge or sell collateral unless the borrower defaults. Borrowers are required to deliver cash collateral in amounts equal to not less than 100% of the market value of the loaned securities.
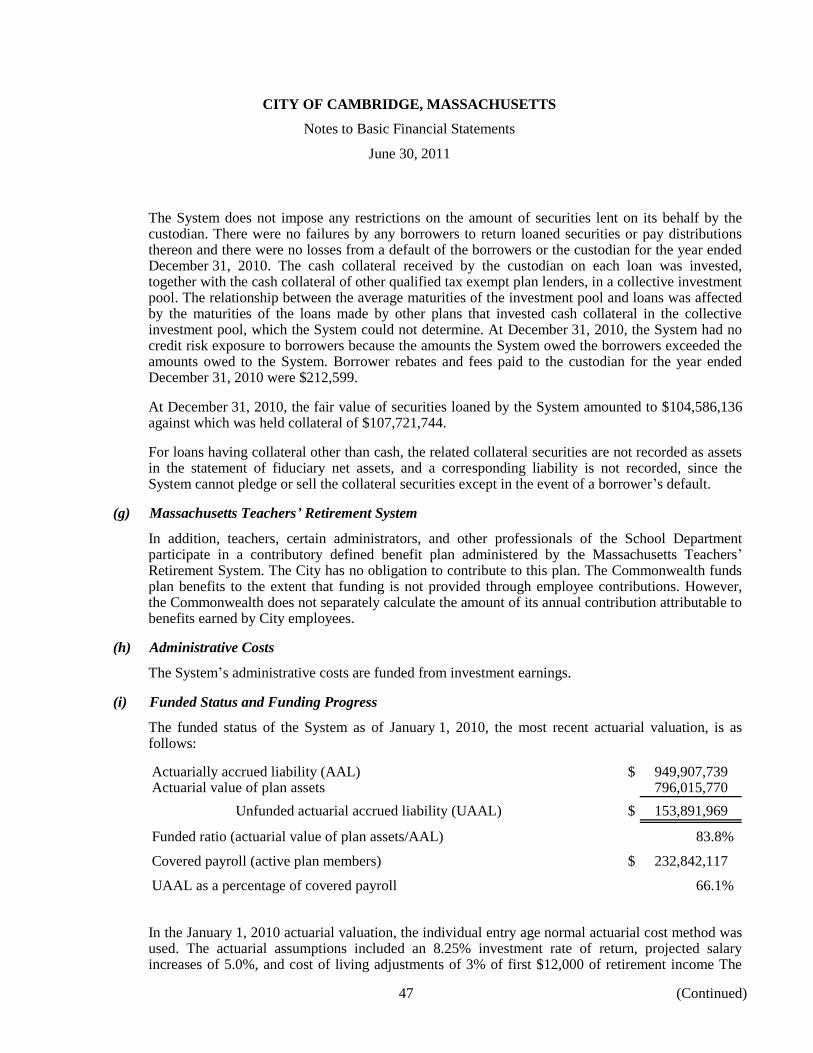
CITY OF CAMBRIDGE, MASSACHUSETTS
Notes to Basic Financial Statements
June 30, 2011
47 (Continued)
The System does not impose any restrictions on the amount of securities lent on its behalf by the custodian. There were no failures by any borrowers to return loaned securities or pay distributions thereon and there were no losses from a default of the borrowers or the custodian for the year ended December 31, 2010. The cash collateral received by the custodian on each loan was invested, together with the cash collateral of other qualified tax exempt plan lenders, in a collective investment pool. The relationship between the average maturities of the investment pool and loans was affected by the maturities of the loans made by other plans that invested cash collateral in the collective investment pool, which the System could not determine. At December 31, 2010, the System had no credit risk exposure to borrowers because the amounts the System owed the borrowers exceeded the amounts owed to the System. Borrower rebates and fees paid to the custodian for the year ended December 31, 2010 were $212,599.
At December 31, 2010, the fair value of securities loaned by the System amounted to $104,586,136 against which was held collateral of $107,721,744.
For loans having collateral other than cash, the related collateral securities are not recorded as assets in the statement of fiduciary net assets, and a corresponding liability is not recorded, since the System cannot pledge or sell the collateral securities except in the event of a borrower‘s default.
(g) Massachusetts Teachers’ Retirement System
In addition, teachers, certain administrators, and other professionals of the School Department participate in a contributory defined benefit plan administered by the Massachusetts Teachers‘ Retirement System. The City has no obligation to contribute to this plan. The Commonwealth funds plan benefits to the extent that funding is not provided through employee contributions. However, the Commonwealth does not separately calculate the amount of its annual contribution attributable to benefits earned by City employees.
(h) Administrative Costs
The System‘s administrative costs are funded from investment earnings.
(i) Funded Status and Funding Progress
The funded status of the System as of January 1, 2010, the most recent actuarial valuation, is as follows:
Actuarially accrued liability (AAL) $ 949,907,739 Actuarial value of plan assets 796,015,770
Unfunded actuarial accrued liability (UAAL) $ 153,891,969
Funded ratio (actuarial value of plan assets/AAL) 83.8%
Covered payroll (active plan members) $ 232,842,117
UAAL as a percentage of covered payroll 66.1%
In the January 1, 2010 actuarial valuation, the individual entry age normal actuarial cost method was used. The actuarial assumptions included an 8.25% investment rate of return, projected salary increases of 5.0%, and cost of living adjustments of 3% of first $12,000 of retirement income The

CITY OF CAMBRIDGE, MASSACHUSETTS
Notes to Basic Financial Statements
June 30, 2011
48 (Continued)
actuarial value of assets was determined using the difference between the expected return and the actual investment return on a market value basis is recognized over a five-year period. The System‘s unfunded actuarial accrued liability is being amortized as increasing amortization for remaining unfunded liability. The remaining amortization period is 19 years from July 1, 2010 for remaining unfunded liability.
Actuarial valuations of an ongoing plan involve estimates of the value of reported amounts and assumptions about the probability of occurrence of events far into the future. Examples include assumptions about termination rates, retirement rates, mortality and salary increases. Amounts determined regarding the funded status of the plan and the annual required contributions of the City are subject to continual revision as actual results are compared with past expectations and new estimates are made about the future. The schedule of funding progress, presented as required supplementary information following the notes to the financial statements, presents multi-year trend information that shows whether the actuarial value of plan assets is increasing or decreasing over time relative to the actuarial accrued liabilities for benefits.
(10) Other Postemployment Benefit Disclosures
In addition to the pension benefits described in note 9, the City provides postemployment healthcare and life insurance benefits, in accordance with state statute and City ordinance, to participating retirees and their beneficiaries. As of the valuation date, approximately 2,285 retirees and 2,788 active members meet the eligibility requirements as put forth in Chapter 32B of MGL. The City sponsors and participates in an agent multi-employer defined benefit OPEB plan. The OPEB plan is administered by the City and does not issue a stand-alone financial report.
Medical and prescription drug benefits are provided to all eligible retirees not enrolled in Medicare through a variety of plans offered by Blue Cross Blue Shield of Massachusetts, Harvard Pilgrim HealthCare, and Tufts Health Plan. Medical and prescription drug benefits are provided to retirees enrolled in Medicare through supplemental and Medicare Advantage plans offered by Blue Cross Blue Shield of Massachusetts, Harvard Pilgrim HealthCare, and Tufts Health Plan.
Groups 1 and 4 retirees, including teachers, with at least 10 years of creditable service are eligible at age 55 or any age, respectively. Group 4 retirees with at least 10 years of creditable service are eligible at age 45 or any age, respectively. Retirees on ordinary or accidental disability retirement are eligible at any age while ordinary disability requires 10 years of creditable service. The surviving spouse is eligible to receive both pre- and post-retirement death benefits, as well as medical and prescription drug coverage.
(a) Funding Policy
Employer and employee contribution rates are governed by the respective collective bargaining agreements. The City currently funds the plan on a pay-as-you-go basis. The City and plan members share the cost of benefits. As of the valuation date, the plan members contribute 10% to 25% of the monthly premium cost, depending on the plan in which they are enrolled. The City contributes the balance of the premium cost.
(b) Annual OPEB Cost and Net OPEB Obligation
The City‘s annual OPEB expense is calculated based on the annual required contribution of the employer (ARC), an amount actuarially determined in accordance with the parameters of GASB Statement No. 45. The ARC represents a level of funding that, if paid on an ongoing basis, is
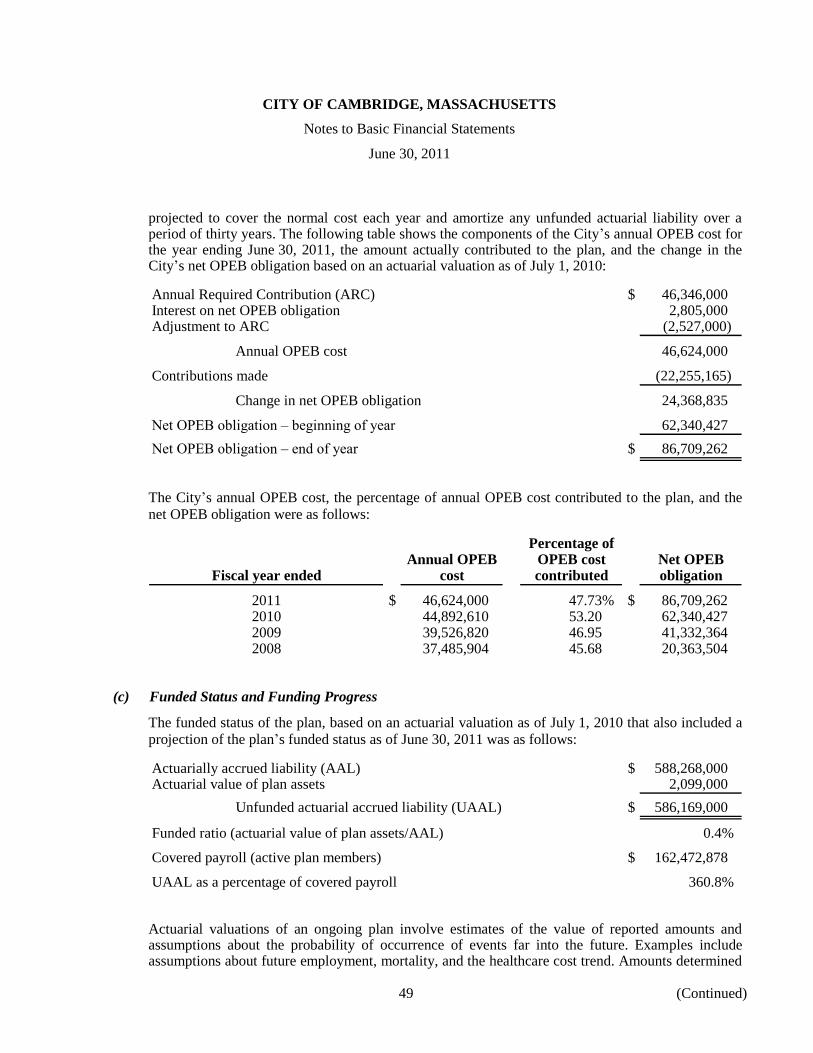
CITY OF CAMBRIDGE, MASSACHUSETTS
Notes to Basic Financial Statements
June 30, 2011
49 (Continued)
projected to cover the normal cost each year and amortize any unfunded actuarial liability over a period of thirty years. The following table shows the components of the City‘s annual OPEB cost for the year ending June 30, 2011, the amount actually contributed to the plan, and the change in the City‘s net OPEB obligation based on an actuarial valuation as of July 1, 2010:
Annual Required Contribution (ARC) $ 46,346,000 Interest on net OPEB obligation 2,805,000 Adjustment to ARC (2,527,000)
Annual OPEB cost 46,624,000
Contributions made (22,255,165)
Change in net OPEB obligation 24,368,835
Net OPEB obligation – beginning of year 62,340,427
Net OPEB obligation – end of year $ 86,709,262
The City‘s annual OPEB cost, the percentage of annual OPEB cost contributed to the plan, and the
net OPEB obligation were as follows:
Percentage ofAnnual OPEB OPEB cost Net OPEB
Fiscal year ended cost contributed obligation
2011 $ 46,624,000 47.73% $ 86,709,262 2010 44,892,610 53.20 62,340,427 2009 39,526,820 46.95 41,332,364 2008 37,485,904 45.68 20,363,504
(c) Funded Status and Funding Progress
The funded status of the plan, based on an actuarial valuation as of July 1, 2010 that also included a
projection of the plan‘s funded status as of June 30, 2011 was as follows:
Actuarially accrued liability (AAL) $ 588,268,000 Actuarial value of plan assets 2,099,000
Unfunded actuarial accrued liability (UAAL) $ 586,169,000
Funded ratio (actuarial value of plan assets/AAL) 0.4%
Covered payroll (active plan members) $ 162,472,878
UAAL as a percentage of covered payroll 360.8%
Actuarial valuations of an ongoing plan involve estimates of the value of reported amounts and assumptions about the probability of occurrence of events far into the future. Examples include assumptions about future employment, mortality, and the healthcare cost trend. Amounts determined

CITY OF CAMBRIDGE, MASSACHUSETTS
Notes to Basic Financial Statements
June 30, 2011
50 (Continued)
regarding the funded status of the plan and the annual required contributions of the City are subject to continual revision as actual results are compared with past expectations and new estimates are made about the future. The schedule of funding progress, presented as required supplementary information following the notes to the financial statements, presents multi-year trend information that shows whether the actuarial value of plan assets is increasing or decreasing over time relative to the actuarial accrued liabilities for benefits.
In January 2009, the Commonwealth adopted Chapter 479, which amends Chapter 32B and allows local municipalities to establish an OPEB liability trust fund and a funding schedule for the trust fund. On December 21, 2009, the City Council approved the establishment of an irrevocable OPEB trust fund and $2,000,000 was transferred to the fund.
(d) Actuarial Methods and Assumptions
Projections of benefits for financial reporting purposes are based on the substantive plan (the plan as understood by the City and plan members) and include the types of benefits provided at the time of each valuation and the historical pattern of sharing of benefit costs between the City and plan members to that point. The actuarial methods and assumptions used include techniques that are designed to reduce short-term volatility in actuarial accrued liabilities and the actuarial value of assets, consistent with the long-term perspective of the calculations.
In the July 1, 2010 actuarial valuation, the projected unit credit cost method was used and the actuarial accrued liability is being amortized over a period of 28 years on a closed basis and is calculated assuming a level percentage of projected payroll.
As of July 1, 2010 the discount rate was 4.5%. In general, the discount rate is to be equal to the long term rate of return of the assets paying retiree costs.
As of July 1, 2010, the healthcare cost trend rates begin with 10% and decrease 0.5% annually to an ultimate rate of 5.0%. The healthcare cost trend rates as of July 1, 2010 are based on current market conditions and updated normative trend data and studies.
As of July 1, 2010, the expected annual trend rates begin with 6% and decreases 0.25% annually to an ultimate rate of 5.0%. The healthcare cost trend rates as of July 1, 2010 are based on past annual increases in the Medicare Part B premium.
As of July 1, 2010, the payroll growth rate was 3.5%. This assumption should represent long-term expectations of the City‘s payroll growth. Therefore, recent salary increase rates, current economic environment, and the prior increases were considered. In addition, 3.5% appears to be a reasonable long-term rate of return for the City. This assumption does not affect the liability of the plan, but does affect the amortization of the unfunded actuarial accrued liability and, consequently, the annual costs.
As of July 1, 2010, future retirees electing spouse coverage is based on the employees‘ current coverage election. In other words, employees in the current census data with spouse coverage are assumed to have spouse coverage at retirement.
As of July 1, 2010, the percent of participants assumed to not be Medicare eligible at 65 was 7% based on the current 156 retirees over 65 in the non-Medicare plans divided by the total

CITY OF CAMBRIDGE, MASSACHUSETTS
Notes to Basic Financial Statements
June 30, 2011
51 (Continued)
1,646 retirees over age 65. Based on this updated information, the percent of new retirees not being Medicare eligible at 65 decreased and is likely to continue to decrease. Therefore, it was assumed that 7% of retirees attaining 65 in the future would not be eligible for Medicare.
Current and future retirees contribute an amount based on the costs or premiums of the plan they elect.
(11) Transfers
Transfers and their purposes during the year ended June 30, 2011 were as follows:
Governmental funds
Affordable
Housing Enterprise
General Capital Trust fund Other fund water
Capital – to fund capital
expenditures $ (4,195,000) 4,195,000 — — —
Parking – reimbursement of
administrative costs and other
eligible City expenditures 18,244,945 800,000 — (19,044,945) —
Other Grants – License
Commission matching grant (30,000) — — 30,000 —
Cemetery – reimbursement of
operational costs to fund
renovations of administration,
buildings and grounds 40,000 — — (40,000) —
CDBG – reimbursement of eligible
capital costs — 56,104 — (56,104) —
Water – reimbursement of
administrative costs 687,510 — — — (687,510)
Affordable housing fund – from
CPA Fund — — — (7,640,000) —
CPA Fund – to affordable housing
fund — — 7,640,000 — —
Total $ 14,747,455 5,051,104 7,640,000 (26,751,049) (687,510)
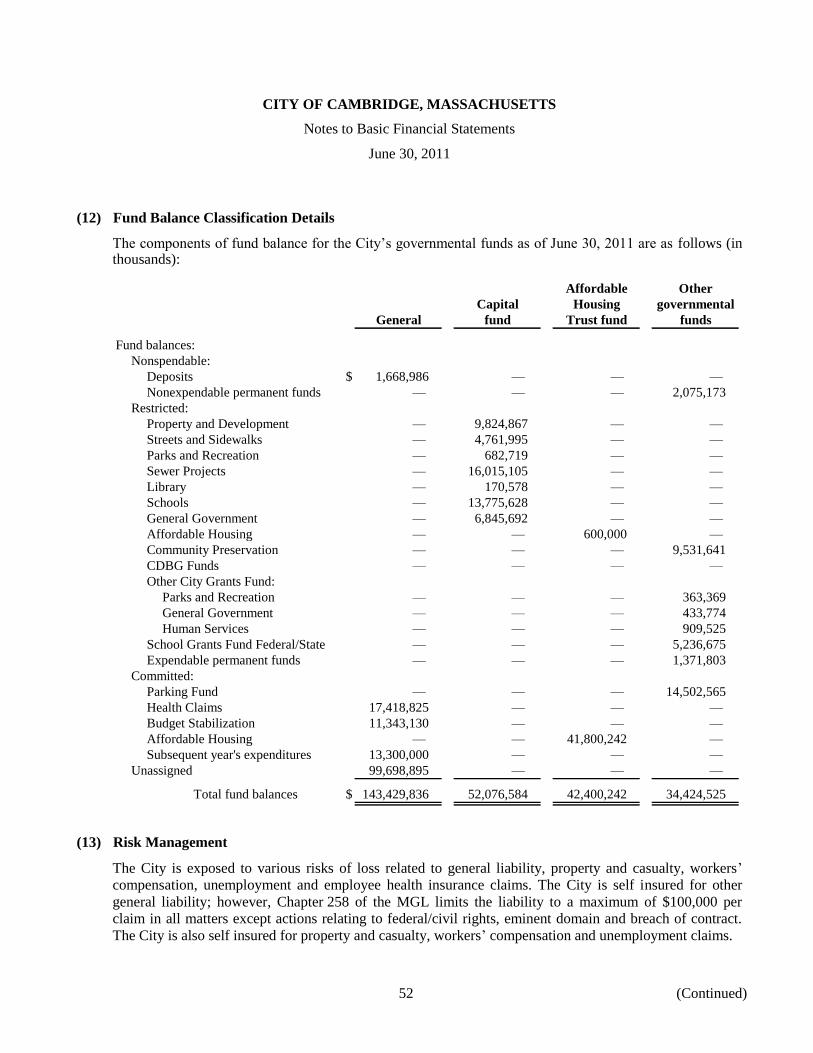
CITY OF CAMBRIDGE, MASSACHUSETTS
Notes to Basic Financial Statements
June 30, 2011
52 (Continued)
(12) Fund Balance Classification Details
The components of fund balance for the City‘s governmental funds as of June 30, 2011 are as follows (in thousands):
Affordable Other
Capital Housing governmental
General fund Trust fund funds
Fund balances:
Nonspendable:
Deposits $ 1,668,986 — — —
Nonexpendable permanent funds — — — 2,075,173
Restricted:
Property and Development — 9,824,867 — —
Streets and Sidewalks — 4,761,995 — —
Parks and Recreation — 682,719 — —
Sewer Projects — 16,015,105 — —
Library — 170,578 — —
Schools — 13,775,628 — —
General Government — 6,845,692 — —
Affordable Housing — — 600,000 —
Community Preservation — — — 9,531,641
CDBG Funds — — — —
Other City Grants Fund:
Parks and Recreation — — — 363,369
General Government — — — 433,774
Human Services — — — 909,525
School Grants Fund Federal/State — — — 5,236,675
Expendable permanent funds — — — 1,371,803
Committed:
Parking Fund — — — 14,502,565
Health Claims 17,418,825 — — —
Budget Stabilization 11,343,130 — — —
Affordable Housing — — 41,800,242 —
Subsequent year's expenditures 13,300,000 — — —
Unassigned 99,698,895 — — —
Total fund balances $ 143,429,836 52,076,584 42,400,242 34,424,525
(13) Risk Management
The City is exposed to various risks of loss related to general liability, property and casualty, workers‘
compensation, unemployment and employee health insurance claims. The City is self insured for other
general liability; however, Chapter 258 of the MGL limits the liability to a maximum of $100,000 per
claim in all matters except actions relating to federal/civil rights, eminent domain and breach of contract.
The City is also self insured for property and casualty, workers‘ compensation and unemployment claims.

CITY OF CAMBRIDGE, MASSACHUSETTS
Notes to Basic Financial Statements
June 30, 2011
53
The City has medical plans with Tufts, Harvard Pilgrim and Blue Cross/Blue Shield under which it makes
actual claims payments. The medical plan providers act as claim processors and a transfer of risk does not
occur. Approximately 90% of the City‘s employees participate in the self-insured plan with the remainder
electing preferred provider plans that are premium based. The amount of settlements exceeded insurance
coverage for premium based health insurance elections by $2.7 million, $1.7 million, and $0 for
fiscal years ended June 30, 2011, 2010, and 2009, respectively.
Active employees contribute at least 12% of the cost of healthcare with the remainder paid by the City.
These costs are accounted for in the general fund. The contribution rate for retirees is 1% for those who are
currently enrolled in indemnity plans and 15% for those who enroll in HMO type plans. The City does not
carry stop-loss insurance.
The City has established a liability based on historical trends of previous years and attorney‘s estimates of
pending matters and lawsuits in which the City is involved.
Changes in the self insurance liability for the years ended June 30, 2011 and 2010 are as follows:
2011 2010
Judgments and accrued claims, beginning of year $ 20,329,000 18,098,000 Incurred claims 47,786,000 43,093,790 Less payments of claims attributable to events of both
current and prior fiscal years (42,622,000) (40,862,790)
Judgments and accrued claims, end of year $ 25,493,000 20,329,000

CITY OF CAMBRIDGE, MASSACHUSETTS
Required Supplementary Information
June 30, 2011
(Unaudited)
54
Schedules of Funding Progress
(Dollars in thousands)
Pension
UAAL as a
Actuarial Unfunded percentage
Actuarial accrued AAL of covered
Actuarial value liability (UAAL) Funded Covered payroll
valuation date of assets (a) (AAL) (b) (b-a) ratio (a/b) payroll (c) ((b-a)/c)
January 1, 2010 $ 796,016 949,908 153,892 83.8% $ 232,842 66.1%January 1, 2008 766,031 833,034 67,003 92.0 231,770 28.9January 1, 2006 632,059 740,320 108,261 85.4 201,088 53.8
January 1, 2004 569,500 655,107 85,607 86.9 184,254 46.5January 1, 2002 516,947 578,050 61,103 89.4 167,303 36.5January 1, 2000 424,606 510,973 86,367 83.1 140,489 61.5
OPEB
UAAL as a
Actuarial Unfunded percentage
Actuarial accrued AAL of covered
Actuarial value liability (UAAL) Funded Covered payroll
valuation date of assets (a) (AAL) (b) (b-a) ratio (a/b) payroll (c) ((b-a)/c)
July 1, 2010 $ 2,099 588,268 586,169 0.4% $ 162,473 360.8%January 1, 2009 (1) 1,986 624,815 622,829 0.3% 156,520 397.9%January 1, 2009 — 598,995 598,995 — 152,151 393.7December 31, 2006 — 602,697 602,697 — 155,456 387.7
(1) The January 1, 2009 actuarial valuation included a projection as of June 30, 2010. The actuarial value of
assets represents the fair value of OPEB assets as of June 30, 2010.
Future cost of living increases assumed by the City.
Schedule of Employers’ Contributions – Pension
(Dollars in thousands)
Annualrequired Percentage
contribution contributed
Year ended December 31:2010 $ 28,554 1002009 27,728 1002008 26,891 1002007 28,067 1002006 25,220 1002005 24,577 1002004 23,978 100
See accompanying independent auditors‘ report.

CITY OF CAMBRIDGE, MASSACHUSETTS
Schedule of Revenues and Expenditures – Budgetary Basis
Required Supplementary Information
General Fund – Budget and Actual
Year ended June 30, 2011
Unaudited(with comparative actual amounts for 2010)
2011 2011 VarianceOriginal Final 2011 favorable 2010budget budget Actual (unfavorable) Actual
Revenues:Property taxes $ 283,961,699 283,961,699 283,961,699 — 268,662,984 Provisions for tax abatements and adj. (4,295,422) (4,295,422) (4,295,422) — (4,362,984) Payments in lieu of tax receipts 6,720,000 6,720,000 7,344,911 624,911 7,105,643 Hotel/motel/meals excise tax 11,665,000 11,665,000 13,573,132 1,908,132 9,361,688 Intergovernmental 32,695,949 32,695,949 31,795,812 (900,137) 32,138,738 Sewer use 38,369,720 38,375,235 40,346,895 1,971,660 36,825,469 Motor vehicle excise 6,181,635 6,181,635 6,452,602 270,967 6,182,561 Investment income 870,000 870,000 536,337 (333,663) 872,705 Other 18,404,985 18,570,142 28,431,356 9,861,214 24,943,680
Total revenues 394,573,566 394,744,238 408,147,322 13,403,084 381,730,484
Expenditures:Current:
General government 42,804,500 40,534,424 37,601,872 2,932,552 36,361,395 Public safety 100,879,625 101,840,990 101,117,208 723,782 96,466,498 Community maintenance and development 37,169,385 38,871,986 38,478,329 393,657 34,907,542 Human resource development 30,102,300 30,504,110 30,152,199 351,911 28,683,418 Education 137,492,275 136,567,275 135,368,303 1,198,972 133,250,468 Judgments and claims 200,000 929,155 929,151 4 924,862 State and district assessments 47,120,828 47,135,645 44,892,107 2,243,538 42,447,468
Debt service:Principal 34,865,930 34,865,930 34,865,929 1 32,775,576 Interest 10,439,725 10,439,725 10,381,632 58,093 10,450,318
Total expenditures 441,074,568 441,689,240 433,786,730 7,902,510 416,267,545
Excess (deficiency) of revenuesover expenditures (46,501,002) (46,945,002) (25,639,408) 21,305,594 (34,537,061)
Other financing sources (uses):Operating transfers in (out):
Special revenue funds 20,080,190 20,080,190 18,214,945 (1,865,245) 17,930,169 Capital projects funds (2,670,000) (3,670,000) (4,195,000) (525,000) (2,270,000) Trust funds 16,538,615 16,538,615 16,538,615 — 17,585,770 Enterprise fund 687,510 687,510 687,510 — 684,930
Total other financing sources (uses) 34,636,315 33,636,315 31,246,070 (2,390,245) 33,930,869
Excess (deficiency) of revenues andother financing sources overexpenditures and otherfinancing uses
(11,864,687) (13,308,687) 5,606,662 18,915,349 (606,192)
Other budget items:Free cash appropriations 11,400,000 12,844,000 Prior year deficits raised (1,535,313) (1,535,313) Overlay Surplus 2,000,000 2,000,000
Total other budget items 11,864,687 13,308,687 Net budget and actual $ — —
See accompanying independent auditors’ report.
See accompanying notes to required supplementary information.
55
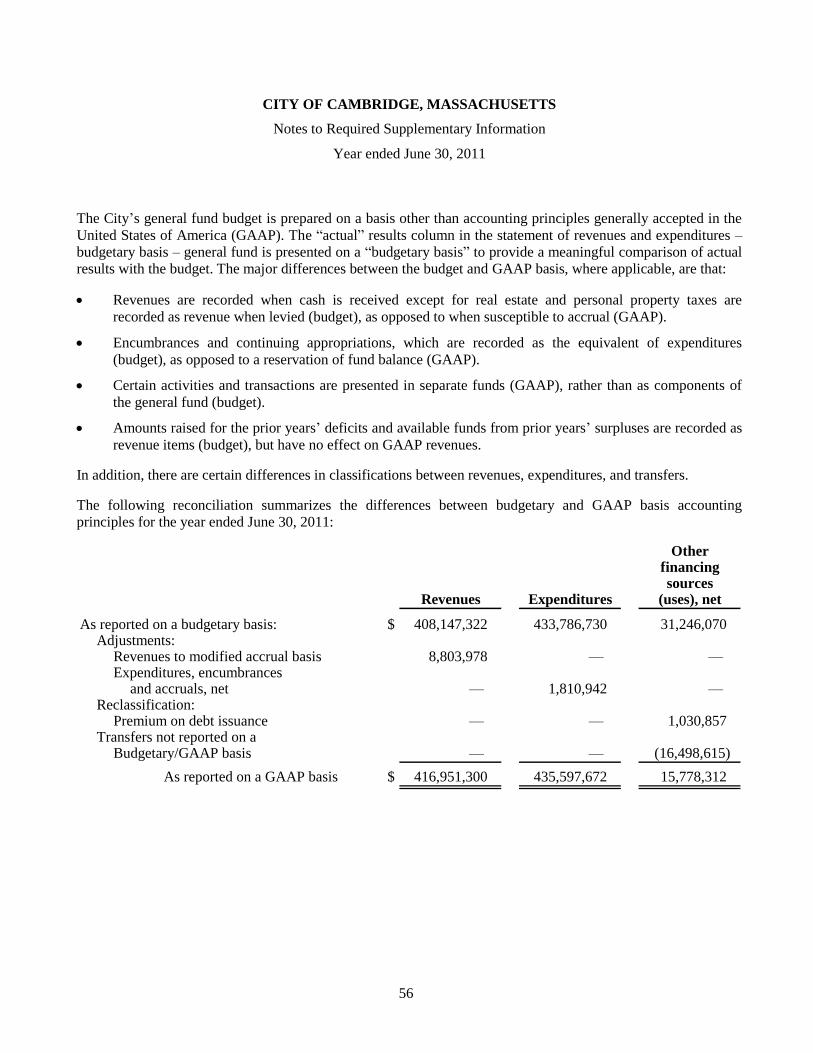
CITY OF CAMBRIDGE, MASSACHUSETTS
Notes to Required Supplementary Information
Year ended June 30, 2011
56
The City‘s general fund budget is prepared on a basis other than accounting principles generally accepted in the
United States of America (GAAP). The ―actual‖ results column in the statement of revenues and expenditures –
budgetary basis – general fund is presented on a ―budgetary basis‖ to provide a meaningful comparison of actual
results with the budget. The major differences between the budget and GAAP basis, where applicable, are that:
Revenues are recorded when cash is received except for real estate and personal property taxes are
recorded as revenue when levied (budget), as opposed to when susceptible to accrual (GAAP).
Encumbrances and continuing appropriations, which are recorded as the equivalent of expenditures
(budget), as opposed to a reservation of fund balance (GAAP).
Certain activities and transactions are presented in separate funds (GAAP), rather than as components of
the general fund (budget).
Amounts raised for the prior years‘ deficits and available funds from prior years‘ surpluses are recorded as
revenue items (budget), but have no effect on GAAP revenues.
In addition, there are certain differences in classifications between revenues, expenditures, and transfers.
The following reconciliation summarizes the differences between budgetary and GAAP basis accounting
principles for the year ended June 30, 2011:
Otherfinancingsources
Revenues Expenditures (uses), net
As reported on a budgetary basis: $ 408,147,322 433,786,730 31,246,070 Adjustments:
Revenues to modified accrual basis 8,803,978 — — Expenditures, encumbrances
and accruals, net — 1,810,942 — Reclassification:
Premium on debt issuance — — 1,030,857 Transfers not reported on a
Budgetary/GAAP basis — — (16,498,615)
As reported on a GAAP basis $ 416,951,300 435,597,672 15,778,312

CITY OF CAMBRIDGE, MASSACHUSETTS
Supplemental Statements and Schedules
June 30, 2011
57 (Continued)
The following section provides detailed information on the general fund, other governmental funds and agency
funds included in the basic financial statements. Information on real, personal, and excise tax collections, and a
schedule of the bonds and notes payable of the City is also provided in this section.

CITY OF CAMBRIDGE, MASSACHUSETTS
General Fund
Schedule of Expenditures – Budgetary Basis
Year ended June 30, 2011
Variancepositive
Budget Actual (negative)
General government:Mayor:
Salaries and wages $ 411,165 411,164 1 Other ordinary maintenance 111,130 111,045 85 Travel and training 29,500 18,799 10,701
Total Mayor 551,795 541,008 10,787
City Manager:Salaries and wages 1,463,545 1,463,509 36 Other ordinary maintenance 506,150 490,870 15,280 Travel and training 38,700 27,277 11,423
Total City Manager 2,008,395 1,981,656 26,739
City Council:Salaries and wages 1,429,470 1,429,421 49 Other ordinary maintenance 41,900 37,669 4,231 Travel and training 59,855 34,331 25,524
Total City Council 1,531,225 1,501,421 29,804
City Clerk:Salaries and wages 882,130 879,831 2,299 Other ordinary maintenance 56,110 42,031 14,079 Travel and training 4,420 857 3,563
Total City Clerk 942,660 922,719 19,941
Law:Salaries and wages 1,326,715 1,300,082 26,633 Other ordinary maintenance 508,655 495,522 13,133 Travel and training 10,245 6,476 3,769
Total law 1,845,615 1,802,080 43,535
Finance:Salaries and wages 8,584,555 8,567,531 17,024 Other ordinary maintenance 2,834,625 2,522,261 312,364 Travel and training 213,870 192,670 21,200 Extraordinary expenditures 62,800 55,435 7,365
Total finance 11,695,850 11,337,897 357,953
58 (Continued)

CITY OF CAMBRIDGE, MASSACHUSETTS
General Fund
Schedule of Expenditures – Budgetary Basis
Year ended June 30, 2011
Variancepositive
Budget Actual (negative)
Employment benefits:Salaries and wages $ 18,284,084 16,263,575 2,020,509 Other ordinary maintenance 831,075 608,072 223,003 Travel and training 15,000 5,223 9,777
Total employment benefits 19,130,159 16,876,870 2,253,289
General services:Salaries and wages 313,915 313,267 648 Other ordinary maintenance 521,270 410,537 110,733
Total general services 835,185 723,804 111,381
Election commission:Salaries and wages 637,695 637,660 35 Other ordinary maintenance 273,635 241,636 31,999 Travel and training 2,270 — 2,270
Total election commission 913,600 879,296 34,304
Public celebrations:Salaries and wages 391,645 391,618 27 Other ordinary maintenance 370,900 359,857 11,043 Travel and training 1,125 629 496
Total public celebrations 763,670 752,104 11,566
Reserve:Other ordinary maintenance 32,500 — 32,500
Total reserve 32,500 — 32,500
Animal commission:Salaries and wages 270,315 270,289 26 Other ordinary maintenance 13,305 12,728 577 Travel and training 150 — 150
Total animal commission 283,770 283,017 753
Total general government 40,534,424 37,601,872 2,932,552
Public safety:Fire:
Salaries and wages 36,303,025 36,302,954 71 Other ordinary maintenance 1,221,905 1,204,636 17,269 Travel and training 608,500 607,929 571 Extraordinary expenditures 84,000 83,640 360
Total fire 38,217,430 38,199,159 18,271
59 (Continued)

CITY OF CAMBRIDGE, MASSACHUSETTS
General Fund
Schedule of Expenditures – Budgetary Basis
Year ended June 30, 2011
Variancepositive
Budget Actual (negative)
Police:Salaries and wages $ 40,019,060 40,019,036 24 Other ordinary maintenance 1,866,500 1,807,756 58,744 Travel and training 441,500 374,269 67,231 Extraordinary expenditures 435,550 434,706 844
Total police 42,762,610 42,635,767 126,843
Traffic and parking:Salaries and wages 6,646,150 6,450,997 195,153 Other ordinary maintenance 3,281,040 3,197,375 83,665 Travel and training 53,400 33,943 19,457 Extraordinary expenditures 54,000 51,451 2,549
Total traffic and parking 10,034,590 9,733,766 300,824
Police review and advisory board:Salaries and wages 86,485 81,831 4,654 Other ordinary maintenance 700 — 700 Travel and training 3,000 2,979 21
Total police review andadvisory board 90,185 84,810 5,375
Inspectional services:Salaries and wages 2,692,210 2,692,158 52 Other ordinary maintenance 123,400 97,788 25,612 Travel and training 46,425 44,221 2,204 Extraordinary expenditures 23,915 23,840 75
Total inspectional services 2,885,950 2,858,007 27,943
License:Salaries and wages 839,095 805,569 33,526 Other ordinary maintenance 57,435 40,643 16,792 Travel and training 6,200 3,487 2,713
Total license 902,730 849,699 53,031
Weights and measures:Salaries and wages 120,865 120,863 2 Other ordinary maintenance 7,280 7,057 223 Travel and training 2,745 2,744 1
Total weights and measures 130,890 130,664 226
60 (Continued)

CITY OF CAMBRIDGE, MASSACHUSETTS
General Fund
Schedule of Expenditures – Budgetary Basis
Year ended June 30, 2011
Variancepositive
Budget Actual (negative)
Electrical:Salaries and wages $ 1,484,610 1,480,814 3,796 Other ordinary maintenance 1,286,460 1,195,999 90,461 Travel and training 1,670 1,653 17 Extraordinary expenditures 25,000 22,354 2,646
Total electrical 2,797,740 2,700,820 96,920
Emergency communications:Salaries and wages 3,850,805 3,797,616 53,189 Other ordinary maintenance 148,210 113,604 34,606 Travel and training 15,850 11,431 4,419 Extraordinary expenditures 4,000 1,865 2,135
Total emergency communications 4,018,865 3,924,516 94,349
Total public safety 101,840,990 101,117,208 723,782
Community maintenance and development:Public works:
Salaries and wages 19,053,897 19,052,980 917 Other ordinary maintenance 11,565,524 11,310,278 255,246 Travel and training 188,180 147,388 40,792 Extraordinary expenditures 520,000 514,117 5,883
Total public works 31,327,601 31,024,763 302,838
Community development:Salaries and wages 4,942,788 4,942,744 44 Other ordinary maintenance 431,189 368,856 62,333 Travel and training 15,798 15,683 115 Extraordinary expenditures 43,245 43,245 —
Total community development 5,433,020 5,370,528 62,492
Historical commission:Salaries and wages 538,120 538,107 13 Other ordinary maintenance 37,380 29,610 7,770 Travel and training 800 536 264
Total historical commission 576,300 568,253 8,047
61 (Continued)

CITY OF CAMBRIDGE, MASSACHUSETTS
General Fund
Schedule of Expenditures – Budgetary Basis
Year ended June 30, 2011
Variancepositive
Budget Actual (negative)
Conservation commission:Salaries and wages $ 96,410 96,395 15 Other ordinary maintenance 2,200 644 1,556 Travel and training 1,400 568 832
Total conservation commission 100,010 97,607 2,403
Peace commission:Salaries and wages 113,305 113,274 31 Other ordinary maintenance 10,325 7,642 2,683 Travel and training 1,850 1,298 552
Total peace commission 125,480 122,214 3,266
Cable television:Salaries and wages 460,300 460,266 34 Other ordinary maintenance 845,825 832,448 13,377 Travel and training 3,450 2,250 1,200
Total cable television 1,309,575 1,294,964 14,611
Total community maintenanceand development 38,871,986 38,478,329 393,657
Human resource development:Library:
Salaries and wages 6,201,895 6,120,089 81,806 Other ordinary maintenance 1,952,035 1,932,338 19,697 Travel and training 56,650 43,260 13,390
Total library 8,210,580 8,095,687 114,893
Human services:Salaries and wages 17,681,425 17,658,364 23,061 Other ordinary maintenance 2,973,323 2,803,384 169,939 Travel and training 180,442 155,265 25,177 Extraordinary expenditures 25,000 25,000 —
Total human services 20,860,190 20,642,013 218,177
Women’s commission:Salaries and wages 201,140 198,642 2,498 Other ordinary maintenance 9,535 9,529 6 Travel and training 1,025 189 836
Total women’s commission 211,700 208,360 3,340
62 (Continued)

CITY OF CAMBRIDGE, MASSACHUSETTS
General Fund
Schedule of Expenditures – Budgetary Basis
Year ended June 30, 2011
Variancepositive
Budget Actual (negative)
Human rights commission:Salaries and wages $ 185,250 184,131 1,119 Other ordinary maintenance 4,055 3,433 622 Travel and training 700 678 22
Total human rights commission 190,005 188,242 1,763
Veterans benefits:Salaries and wages 298,235 298,203 32 Other ordinary maintenance 54,900 52,627 2,273 Travel and training 678,500 667,067 11,433
Total veterans benefits 1,031,635 1,017,897 13,738
Total human resourcedevelopment 30,504,110 30,152,199 351,911
Education:Salaries and wages 106,122,238 105,078,128 1,044,110 Other ordinary maintenance 26,640,392 26,633,653 6,739 Travel and training 1,373,358 1,234,481 138,877 Extraordinary expenditures 1,224,920 1,223,423 1,497 Debt:
Principal payments 1,009,916 1,002,167 7,749 Interest payments 196,451 196,451 —
Total education 136,567,275 135,368,303 1,198,972
Judgments and claims 929,155 929,151 4
Debt retirement:Principal payments 34,865,930 34,865,929 1 Interest payments 10,439,725 10,381,632 58,093
Total debt retirement 45,305,655 45,247,561 58,094
State and district assessments:MBTA assessment 8,618,085 8,618,077 8 MWRA assessment 21,622,820 21,622,817 3 Other State assessments 10,894,740 8,651,213 2,243,527 Cambridge Health Alliance 6,000,000 6,000,000 —
Total state and district assessments 47,135,645 44,892,107 2,243,538 Total general fund expenditures $ 441,689,240 433,786,730 7,902,510
See accompanying independent auditors’ report.
63

CITY OF CAMBRIDGE, MASSACHUSETTS
Supplemental Statements and Schedules
June 30, 2011
64
Other Governmental Funds
Community Development Block Grant
Revenues from the community development block grant program are recorded in this fund. A transfer of
revenues is made at the end of the fiscal year to the capital projects funds to cover block grant related
expenditures in these funds during the fiscal year. All operating expenditures are recorded within this fund.
School Grants
This fund accounts for both the receipt and expenditure of funds received from numerous federal and state
agencies to support a wide range of elementary and secondary school programs.
Fuel Assistance
This fund is used to account for revenues and expenditures for a federal program designed to provide low income
families with assistance in purchasing fuel supplies.
Parking Fund
Receipts from the parking fund, which consist primarily of meter collections, parking fines, and miscellaneous
revenues, are recorded in this fund and support a wide range of City programs in accordance with Chapter 844 of
the Massachusetts General Laws. In a similar manner to the block grant funds, an amount equal to that which is
appropriated to the general and capital projects funds, is transferred to those funds at the end of the fiscal year.
Community Preservation Act
Receipts from added 3% tax and the matching funds from the State for the preservation of open space, historic
locations and affordable housing are recorded in this fund. In a similar manner to the parking fund, an amount
equal to the amount appropriated to the capital projects and other grants funds, is transferred to those funds at the
end of the fiscal year.
Other Grants
Funds from a wide range of federal and state grants provide additional support to several City programs,
including the Arts Council, Historical Commission, and Library. Both the receipt and expenditure of these funds
are accounted for in this fund.
Permanent Funds
This fund accumulates all the City‘s trust funds that are legally restricted to the extent that only earnings, and not
principal, may be used for purposes that support the reporting governments programs.

CITY OF CAMBRIDGE, MASSACHUSETTS
Combining Balance Sheet
Other Governmental Funds
June 30, 2011
Special revenueCommunity Communitydevelopment School Parking preservation Other Permanent
Assets block grant grants fund act grants funds Total
Cash and short-term investments $ 266,372 5,296,899 14,111,398 9,822,098 1,908,490 3,446,976 34,852,233 Accounts receivable 265,000 — 391,167 53,328 3 — 709,498 Due from other governments 375,638 552,604 — — 809,045 — 1,737,287
Total assets $ 907,010 5,849,503 14,502,565 9,875,426 2,717,538 3,446,976 37,299,018
Liabilities and Fund Balances
Warrants payable $ 48,518 589,998 — 250,539 925,149 — 1,814,204 Accrued liabilities 23,523 22,830 — 39,918 85,721 — 171,992 Deferred revenue — — — 53,328 — — 53,328 Due to other funds 834,969 — — — — — 834,969
Total liabilities 907,010 612,828 — 343,785 1,010,870 — 2,874,493
Fund balances:Nonspendable — — — — — 2,075,173 2,075,173 Restricted — 5,236,675 — 9,531,641 1,706,668 1,371,803 17,846,787 Committed — — 14,502,565 — — — 14,502,565
Total fund balances — 5,236,675 14,502,565 9,531,641 1,706,668 3,446,976 34,424,525
Total liabilities andfund balances $ 907,010 5,849,503 14,502,565 9,875,426 2,717,538 3,446,976 37,299,018
See accompanying independent auditors’ report.
65

CITY OF CAMBRIDGE, MASSACHUSETTS
Combining Statement of Revenues, Expenditures, and Changes in Fund Equity
Other Governmental Funds
Year ended June 30, 2011
Special revenueCommunity Communitydevelopment School Parking preservation Other Permanentblock grant grants fund act grants funds Total
Revenues:Intergovernmental $ 1,810,466 13,038,648 — 1,931,206 8,782,446 — 25,562,766 Investment income — — 64,020 18,287 (5,320) 12,388 89,375 Other:
Permits — — 460,096 — — — 460,096 Fines — — 10,758,463 — — — 10,758,463 Charges for services — — 9,211,286 — — — 9,211,286 Miscellaneous — 1,324,233 68,187 7,334,122 449,126 164,219 9,339,887
Total revenues 1,810,466 14,362,881 20,562,052 9,283,615 9,226,252 176,607 55,421,873
Expenditures:General government — — — 200,631 49,240 109,098 358,969 Public safety — — — — 1,439,350 — 1,439,350 Community maintenance
and development 1,192,446 — — 2,163,878 301,254 — 3,657,578 Human services 561,916 — — — 8,220,172 — 8,782,088 Education — 13,341,394 — — — — 13,341,394
Total expenditures 1,754,362 13,341,394 — 2,364,509 10,010,016 109,098 27,579,379
Excess (deficiency)of revenuesover expenditures 56,104 1,021,487 20,562,052 6,919,106 (783,764) 67,509 27,842,494
Other financing sources (uses):Transfers from other funds — — — — 30,000 — 30,000 Transfers to other funds (56,104) — (19,044,945) (7,640,000) — (40,000) (26,781,049)
Excess of revenuesover expendituresand transfers — 1,021,487 1,517,107 (720,894) (753,764) 27,509 1,091,445
Fund balances at beginning of year — 4,215,188 12,985,458 10,252,535 2,460,432 3,419,467 33,333,080 Fund balances at end of year $ — 5,236,675 14,502,565 9,531,641 1,706,668 3,446,976 34,424,525
See accompanying independent auditors’ report.
66

CITY OF CAMBRIDGE, MASSACHUSETTS
Supplemental Statements and Schedules
June 30, 2011
Agency Funds
The City’s Agency Funds are used to account for assets received and disbursed by the City acting in atrustee capacity or as an agent for individuals, private organizations, other governmental units, and/orother funds.
67

CITY OF CAMBRIDGE, MASSACHUSETTS
Combining Statement of Changes in Assets and Liabilities – Agency Funds
Year ended June 30, 2011
Balance at Balance atJune 30, June 30,
Assets 2010 Additions Deductions 2011
Contract Bids $ 113,214 — — 113,214 Plans 2,065 — — 2,065 Tree Removals 485 — — 485 Driveways 266,560 199,387 260,871 205,076 Sidewalk Openings 150 — — 150 In Lieu of Bond 70,945 — — 70,945 License Commission 10,149 — — 10,149 Cambridge Police Detail 180,018 4,624,162 4,718,767 85,413 Cambridge Fire Detail 96,701 921,466 935,358 82,809 Dog Licenses 14,212 — — 14,212 Sporting Licenses 2,703 2,687 2,528 2,862 Dog Officer (3,555) — — (3,555) Constable Fees 203,055 139,529 122,604 219,980 Meal Tax Agency 36,619 — — 36,619 Senior Cab 4,279 — — 4,279 Water Service Renewal 17,422 — — 17,422 Undistributed Interest 3,808 — — 3,808 Purchase of Trees 102,650 2,540 104,269 921 Accident and life Insurance 673,984 157,812 142,588 689,208 Medicare 2,804 — — 2,804 Car Seat Program 1,539 — — 1,539 Deferred Compensation 1,410 — — 1,410 Legal Fees 23,528 — — 23,528 Retirement Office Payroll 700,441 419,792 438,508 681,725 Continental Casualty 12,407 — — 12,407 Teacher Insurance Reimbursement 4,940 — — 4,940 Teachers Retirement 1,207,254 667,144 300,000 1,574,398 Excise Registry Fees 13,857 — — 13,857 3 Bigelow Contingency Fund 67,653 9,858 3,725 73,786 Retroactive Wages 6 — — 6 Land Court Fees 55,608 — — 55,608 Choke Program 1,182 — — 1,182 Payroll Checks 64,992 — — 64,992 Retirement Checks 14,693 — — 14,693 Unclaimed Checks 265,329 — — 265,329 Stop Payments 22,667 — — 22,667 Sewer Abatement Appraisal Fee 10,495 — — 10,495 Water Department Deposits 192,615 130,720 27,450 295,885 Twelve Mt. Auburn 7,684 — — 7,684 Blue Cross 6,112 — — 6,112 Hackney Applications 5,386 — — 5,386 Purchase of Bike Racks 5,138 — — 5,138 Recycling Bins (91) 447 264 92 Levangie/J.P. Construction Co. 1,681 — — 1,681 Forty-Three Mt. Auburn Rents 2,028 — — 2,028 Police – Recovered Cash 442 — — 442 Police – Found Cash 3,482 — 384 3,098 Firearms Recordkeeping Fund 18,786 11,938 22,388 8,336 Cambport Roadways Plan Fund 38 — — 38 Tenant – 199 Prospect St. 25,751 — — 25,751 Estate of George W. Boyce 54,591 — — 54,591 Kendall Sq. Fire Station 150,000 — — 150,000 Computers for Kids 1,000 — — 1,000 Payroll Payable (154,919) 2,653 — (152,266) Robert Chambers Settlement 7,799 — — 7,799
Total $ 4,593,792 7,290,135 7,079,704 4,804,223
68

CITY OF CAMBRIDGE, MASSACHUSETTS
Combining Statement of Changes in Assets and Liabilities – Agency Funds
Year ended June 30, 2011
Balance at Balance atJune 30, June 30,
Liabilities 2010 Additions Deductions 2011
Guarantee deposits and amounts due other:Contract Bids $ 113,214 — — 113,214 Plans 2,065 — — 2,065 Tree Removals 485 — — 485 Driveways 266,560 199,387 260,871 205,076 Sidewalk Openings 150 — — 150 In Lieu of Bond 70,945 — — 70,945 License Commission 10,149 — — 10,149 Cambridge Police Detail 180,018 4,624,162 4,718,767 85,413 Cambridge Fire Detail 96,701 921,466 935,358 82,809 Dog Licenses 14,212 — — 14,212 Sporting Licenses 2,703 2,687 2,528 2,862 Dog Officer (3,555) — — (3,555) Constable Fees 203,055 139,529 122,604 219,980 Meal Tax Agency 36,619 — — 36,619 Senior Cab 4,279 — — 4,279 Water Service Renewal 17,422 — — 17,422 Undistributed Interest 3,808 — — 3,808 Purchase of Trees 102,650 2,540 104,269 921 Accident and life Insurance 673,984 157,812 142,588 689,208 Medicare 2,804 — — 2,804 Car Seat Program 1,539 — — 1,539 Deferred Compensation 1,410 — — 1,410 Legal Fees 23,528 — — 23,528 Retirement Office Payroll 700,441 419,792 438,508 681,725 Continental Casualty 12,407 — — 12,407 Teacher Insurance Reimbursement 4,940 — — 4,940 Teachers Retirement 1,207,254 667,144 300,000 1,574,398 Excise Registry Fees 13,857 — — 13,857 3 Bigelow Contingency Fund 67,653 9,858 3,725 73,786 Retroactive Wages 6 — — 6 Land Court Fees 55,608 — — 55,608 Choke Program 1,182 — — 1,182 Payroll Checks 64,992 — — 64,992 Retirement Checks 14,693 — — 14,693 Unclaimed Checks 265,329 — — 265,329 Stop Payments 22,667 — — 22,667 Sewer Abatement Appraisal Fee 10,495 — — 10,495 Water Department Deposits 192,615 130,720 27,450 295,885 Twelve Mt. Auburn 7,684 — — 7,684 Blue Cross 6,112 — — 6,112 Hackney Applications 5,386 — — 5,386 Purchase of Bike Racks 5,138 — — 5,138 Recycling Bins (91) 447 264 92 Levangie/J.P. Construction Co. 1,681 — — 1,681 Forty-three Mt. Auburn Rents 2,028 — — 2,028 Police – Recovered Cash 442 — — 442 Police – Found Cash 3,482 — 384 3,098 Firearms Recordkeeping Cash 18,786 11,938 22,388 8,336 Cambport Roadways Plan Fund 38 — — 38 Tenant – 199 Prospect St. 25,751 — — 25,751 Estate of George W. Boyce 54,591 — — 54,591 Kendall Sq. Fire Station 150,000 — — 150,000 Computers for Kids 1,000 — — 1,000 Payroll Payable (154,919) 2,653 — (152,266) Robert Chambers Settlement 7,799 — — 7,799
Total $ 4,593,792 7,290,135 7,079,704 4,804,223
See accompanying independent auditors’ report.
69

CITY OF CAMBRIDGE, MASSACHUSETTS
Supplemental Statements and Schedules
June 30, 2011
Other Schedules
The following schedules present detailed information on the City’s real estate, personal property and motorvehicle excise taxes, and bonds and notes payable, as of June 30, 2011.
70

CITY OF CAMBRIDGE, MASSACHUSETTS
Schedule of Gross Real Estate, Personal Property, and Motor Vehicle Excise Taxes
June 30, 2011
Uncollected Adjustments UncollectedJune 30, Transfers to increase June 30,
2010 Commitments Abatements tax title Refunds Collections (decrease) 2011
Real estate taxes:2001 $ — — — — 4,785 — (4,785) — 2002 — — — — 73 — (73) — 2003 — — — — — — 521 521 2004 100 — — — 125 (1,009) 1,432 648 2005 101 — (287,064) — 141,760 287,572 (141,645) 724 2006 — — (536,795) — 4,207 536,905 (3,911) 406 2007 1,447 — (738,640) — 527 846,252 (108,988) 598 2008 53,425 — (205,315) (41,545) 12,775 207,141 (19,474) 7,007 2009 441,770 — (236,068) (390,210) 16,038 205,817 (20,731) 16,616 2010 3,682,565 — (478,436) (690,927) 3,474 (2,420,991) (32,977) 62,708 2011 — 266,017,136 (1,293,144) — 79,468 (262,310,044) (9,245) 2,484,171
Total real estate 4,179,408 266,017,136 (3,775,462) (1,122,682) 263,232 (262,648,357) (339,876) 2,573,399
Years with no beginning uncollected balances or activity are not presented.
71 (Continued)

CITY OF CAMBRIDGE, MASSACHUSETTS
Schedule of Gross Real Estate, Personal Property, and Motor Vehicle Excise Taxes
June 30, 2011
Uncollected Adjustments UncollectedJune 30, Transfers to increase June 30,
2010 Commitments Abatements tax title Refunds Collections (decrease) 2011
Personal property taxes:1998 $ 20 — — — — — — 20 2002 33 — — — — — — 33 2003 172,686 — — — — (133) — 172,553 2004 99,782 — (2,692) — 2,692 (158) (9) 99,615 2005 66,316 — — — — — — 66,316 2006 122,744 — — — — (468) 1 122,277 2007 89,484 — — — — (1,499) (58) 87,927 2008 103,306 — (15,825) — 15,825 (1,167) (630) 101,509 2009 228,415 — (3,221) — 6,106 (16,409) (2,964) 211,927 2010 388,290 — (6,472) — 2,702 (227,400) (7,753) 149,367 2011 — 19,220,571 (178,498) — 34,097 (18,783,156) — 293,014
Total personal property 1,271,076 19,220,571 (206,708) — 61,422 (19,030,390) (11,413) 1,304,558
Other 78,016 — — — — — 13,501 91,517 Property taxes $ 5,528,500 285,237,707 (3,982,170) (1,122,682) 324,654 (281,678,747) (337,788) 3,969,474
Years with no beginning uncollected balances or activity are not presented.
72 (Continued)
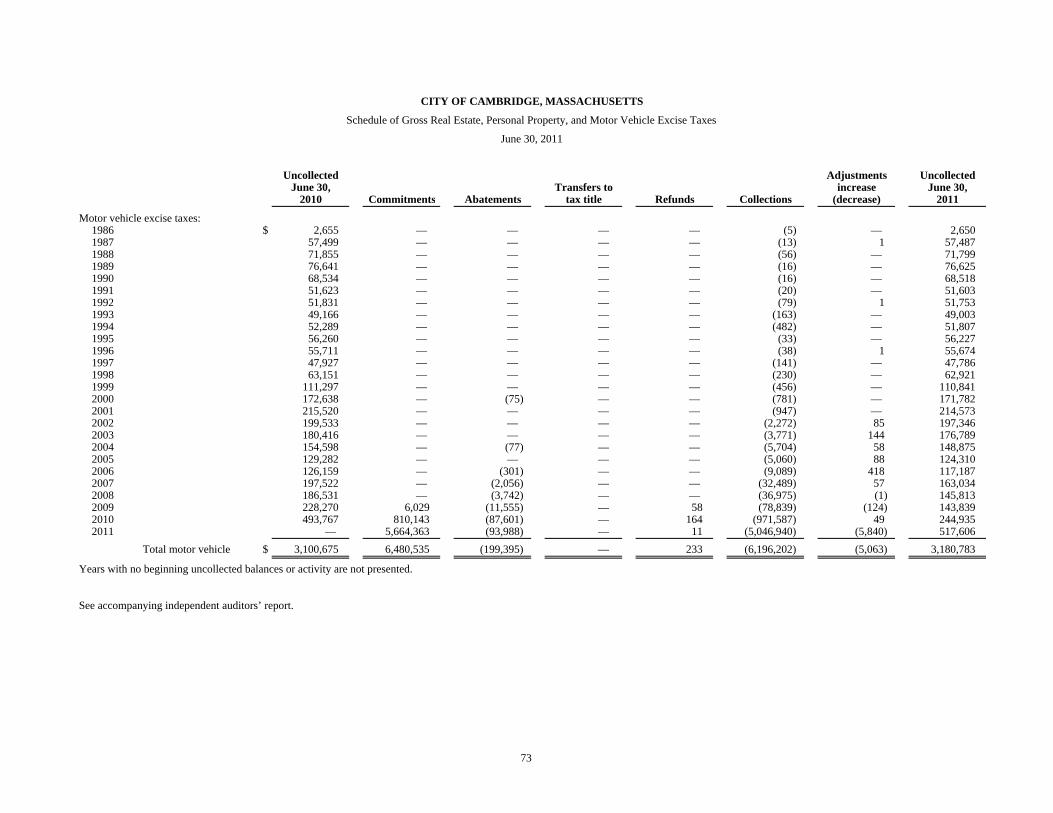
CITY OF CAMBRIDGE, MASSACHUSETTS
Schedule of Gross Real Estate, Personal Property, and Motor Vehicle Excise Taxes
June 30, 2011
Uncollected Adjustments UncollectedJune 30, Transfers to increase June 30,
2010 Commitments Abatements tax title Refunds Collections (decrease) 2011
Motor vehicle excise taxes:1986 $ 2,655 — — — — (5) — 2,650 1987 57,499 — — — — (13) 1 57,487 1988 71,855 — — — — (56) — 71,799 1989 76,641 — — — — (16) — 76,625 1990 68,534 — — — — (16) — 68,518 1991 51,623 — — — — (20) — 51,603 1992 51,831 — — — — (79) 1 51,753 1993 49,166 — — — — (163) — 49,003 1994 52,289 — — — — (482) — 51,807 1995 56,260 — — — — (33) — 56,227 1996 55,711 — — — — (38) 1 55,674 1997 47,927 — — — — (141) — 47,786 1998 63,151 — — — — (230) — 62,921 1999 111,297 — — — — (456) — 110,841 2000 172,638 — (75) — — (781) — 171,782 2001 215,520 — — — — (947) — 214,573 2002 199,533 — — — — (2,272) 85 197,346 2003 180,416 — — — — (3,771) 144 176,789 2004 154,598 — (77) — — (5,704) 58 148,875 2005 129,282 — — — — (5,060) 88 124,310 2006 126,159 — (301) — — (9,089) 418 117,187 2007 197,522 — (2,056) — — (32,489) 57 163,034 2008 186,531 — (3,742) — — (36,975) (1) 145,813 2009 228,270 6,029 (11,555) — 58 (78,839) (124) 143,839 2010 493,767 810,143 (87,601) — 164 (971,587) 49 244,935 2011 — 5,664,363 (93,988) — 11 (5,046,940) (5,840) 517,606
Total motor vehicle $ 3,100,675 6,480,535 (199,395) — 233 (6,196,202) (5,063) 3,180,783
Years with no beginning uncollected balances or activity are not presented.
See accompanying independent auditors’ report.
73

CITY OF CAMBRIDGE, MASSACHUSETTS
Schedule of Bonds and Notes Payable
Year ended June 30, 2011
Final Balance BalanceInterest Issue maturity June 30, June 30,
rates dates date 2010 Additions Retired 2011
Inside debt limit:Gately Center Renovations 4.5% – 5.0% 12/1/2000 12/1/2010 250,000 — 250,000 — City Hall Renovations 4.5% – 5.0% 12/1/2000 12/1/2010 300,000 — 300,000 — Yerxa Road Underpass 4.5% – 5.0% 12/1/2000 12/1/2010 190,000 — 190,000 — Open Space Improvements 4.5% – 5.0% 12/1/2000 12/1/2010 450,000 — 450,000 — MWPAT/Sewer Loan N/A 10/6/1999 8/1/2009 — — — — MWPAT/Sewer Loan N/A 11/1/2000 8/1/2010 227,522 — 227,522 — MWPAT/Sewer Loan N/A 11/1/2000 8/1/2010 130,424 — 130,424 — MWPAT/Sewer Loan N/A 11/1/2000 8/1/2010 27,142 — 27,142 — MWPAT/Sewer Loan N/A 11/1/2000 8/1/2010 928,678 — 928,678 — MWPAT/Sewer Loan N/A 11/1/2000 8/1/2010 423,271 — 423,271 — MWPAT/Sewer Loan 4.5% – 5.0% 12/1/2000 12/1/2010 1,560,000 — 1,560,000 — Hospital Series B 2007 Bonds 4.0% 3/15/2007 2/1/2018 11,995,000 — 1,500,000 10,495,000 City Hall Renovations 3.5% – 5.0% 12/15/2001 12/15/2011 2,640,000 — 1,320,000 1,320,000 Sewer Loan 3.5% – 5.0% 12/15/2001 12/15/2011 2,240,000 — 1,120,000 1,120,000 Traffic Improvement 3.5% – 5.0% 12/15/2001 12/15/2011 250,000 — 125,000 125,000 Sewer Renovations 2.25% – 4.00% 1/15/2003 1/1/2013 3,985,000 — 1,325,000 2,660,000 Fire Station Renovations 2.25% – 4.00% 1/15/2003 1/1/2013 1,455,000 — 485,000 970,000 Building Renovations 2.25% – 4.00% 1/15/2003 1/1/2013 285,000 — 95,000 190,000 City Hall Annex Renovations 2.25% – 4.00% 1/15/2003 1/1/2013 585,000 — 195,000 390,000 Street Reconstruction 2.25% – 4.00% 1/15/2003 1/1/2013 1,805,000 — 605,000 1,200,000 Golf Course Improvements 2.25% – 4.00% 1/15/2003 1/1/2013 255,000 — 85,000 170,000 Open Space Improvements 2.25% – 4.00% 1/15/2003 1/1/2013 75,000 — 25,000 50,000 Harvard Square Enhancements 2.25% – 4.00% 1/15/2003 1/1/2013 150,000 — 50,000 100,000 Fiber Optic Network Infrastructure 2.5% – 3.3% 1/15/2004 1/1/2014 140,000 — 35,000 105,000 Fire Station Renovations 2.5% – 3.3% 1/15/2004 1/1/2014 65,000 — 15,000 50,000 War Memorial Renovations 2.5% – 3.3% 1/15/2004 1/1/2014 480,000 — 120,000 360,000 Building Renovations 2.5% – 3.3% 1/15/2004 1/1/2014 210,000 — 55,000 155,000 Library Construction 2.5% – 4.25% 1/15/2004 1/1/2024 6,040,000 — 435,000 5,605,000 Russell Donnely Field Improvements 2.5% – 3.3% 1/15/2004 1/1/2014 3,640,000 — 910,000 2,730,000 Yerxa Road Underpass 2.5% – 3.3% 1/15/2004 1/1/2014 500,000 — 125,000 375,000 Cambridge Street Improvements 2.5% – 3.3% 1/15/2004 1/1/2014 600,000 — 150,000 450,000 Sewer Reconstruction 2.5% – 3.3% 1/15/2004 1/1/2014 3,760,000 — 940,000 2,820,000 Harvard Square Enhancements 3% – 4% 2/1/2005 1/1/2015 1,000,000 — 200,000 800,000 Gold Star Pool Improvements 3% – 4% 2/1/2005 1/1/2015 550,000 — 110,000 440,000 Library Construction 3% – 4% 2/1/2005 1/1/2025 10,500,000 — 700,000 9,800,000 Area 4 Park Improvements 3% – 4% 2/1/2005 1/1/2015 1,000,000 — 200,000 800,000 Russell Field Improvements 3% – 4% 2/1/2005 1/1/2015 1,705,500 — 345,000 1,360,500 Cambridge Street Improvements 3% – 4% 2/1/2005 1/1/2015 1,175,000 — 235,000 940,000 Porter Square Enhancements 3% – 4% 2/1/2005 1/1/2015 1,150,000 — 230,000 920,000 Yerxa Road Underpass 3% – 4% 2/1/2005 1/1/2015 1,100,000 — 220,000 880,000 MWPAT Loan N/A 10/1/2004 8/1/2010 31,767 — 31,767 — MWPAT Loan N/A 11/23/2004 8/1/2014 1,323,016 — 249,736 1,073,280 MWPAT Loan N/A 11/23/2004 8/1/2014 1,017,674 — 193,962 823,712 MWPAT Loan N/A 11/23/2004 8/1/2014 69,836 — 13,299 56,537 Sewer Reconstruction 3% – 4% 2/1/2005 1/1/2015 7,754,500 — 1,550,000 6,204,500 Police Station Acquisition/
Renovations 3.50% – 4.25% 2/1/2006 1/1/2026 28,000,000 — 1,750,000 26,250,000 Library Construction 3.50% – 4.25% 2/1/2006 1/1/2026 12,800,000 — 800,000 12,000,000 West Cambridge Youth Center 3.50% – 4.25% 2/1/2006 1/1/2016 1,800,000 — 300,000 1,500,000 Building Renovations 3.50% – 4.25% 2/1/2006 1/1/2016 600,000 — 100,000 500,000 Yerxa Road Underpass 3.50% – 4.25% 2/1/2006 1/1/2016 600,000 — 100,000 500,000 Open Space Improvements 3.50% – 4.25% 2/1/2006 1/1/2016 300,000 — 50,000 250,000 Porter Square Enhancements 3.50% – 4.25% 2/1/2006 1/1/2016 480,000 — 80,000 400,000 MWRA Loan N/A 11/17/2005 11/15/2010 39,050 — 39,050 — Sewer Reconstruction 3.50% – 4.25% 2/1/2006 1/1/2016 6,120,000 — 1,020,000 5,100,000 Building Renovations 4.0% 2/15/2007 2/1/2017 455,000 — 65,000 390,000 Police Station Acquisition/
Renovations 4.0% 2/15/2007 2/1/2027 14,450,000 — 850,000 13,600,000 West Cambridge Youth Center 4.0% 2/15/2007 2/1/2017 5,600,000 — 800,000 4,800,000 Area 4 Park Improvements 4.0% 2/15/2007 2/1/2017 350,000 — 50,000 300,000 Yerxa Road Underpass 4.0% 2/15/2007 2/1/2017 770,000 — 110,000 660,000 Harvard Square Enhancements 4.0% 2/15/2007 2/1/2017 1,050,000 — 150,000 900,000 Sewer Reconstruction 4.0% 2/15/2007 2/1/2017 2,390,000 — 345,000 2,045,000 CRLS Renovations 3.0% – 4.0% 2/1/2008 2/1/2028 4,500,000 — 250,000 4,250,000 War Memorial Renovations 3.0% – 3.25% 2/1/2008 2/1/2018 9,780,776 — 1,222,598 8,558,178 Police Station Acquisition/
Renovations 3.0% – 4.0% 2/1/2008 2/1/2028 7,270,000 — 400,000 6,870,000 West Cambridge Youth Center 3.0% – 3.25% 2/1/2008 2/1/2018 4,710,000 — 590,000 4,120,000 Library Construction 3.0% – 4.0% 2/1/2008 2/1/2028 24,415,000 — 1,360,000 23,055,000 War Memorial Renovations 3.0% – 3.25% 2/1/2008 2/1/2018 3,777,336 — 472,167 3,305,169 Harvard Square Enhancements 3.0% – 3.25% 2/1/2008 2/1/2018 480,000 — 60,000 420,000 Sewer Reconstruction 3.0% – 3.25% 2/1/2008 2/1/2018 4,981,888 — 625,235 4,356,653 MWRA Loan — 8/23/2007 8/15/2012 1,029,732 — 343,244 686,488
74

CITY OF CAMBRIDGE, MASSACHUSETTS
Schedule of Bonds and Notes Payable
Year ended June 30, 2011
Final Balance BalanceInterest Issue maturity June 30, June 30,
rates dates date 2010 Additions Retired 2011
Fire Station Renovations 2.0% – 4.0% 3/15/2009 3/15/2019 $ 900,000 — 100,000 800,000 Library Construction 2.0% – 4.375% 3/15/2009 3/15/2029 10,045,000 — 530,000 9,515,000 Building Renovations 2.0% – 4.0% 3/15/2009 3/15/2019 450,000 — 50,000 400,000 CRLS Renovations 2.0% – 4.375% 3/15/2009 3/15/2029 28,500,000 — 1,500,000 27,000,000 Replacement of Radio System 2.0% – 4.0% 3/15/2009 3/15/2019 450,000 — 50,000 400,000 Sewer Reconstruction 2.0% – 4.0% 3/15/2009 3/15/2019 4,325,000 — 485,000 3,840,000 War Memorial Renovations (MSBA) 2.0% 6/25/2009 11/1/2019 2,100,000 — 210,000 1,890,000 CRLS Renovations 2.0% – 3.0% 2/15/2010 2/15/2030 25,000,000 — 1,250,000 23,750,000 Sewer Reconstruction 2.0% – 3.5% 2/15/2010 2/15/2020 6,925,000 — 695,000 6,230,000 Yerxa Road Underpass Construction 2.0% – 3.75% 2/15/2010 2/15/2020 300,000 — 30,000 270,000 War Memorial Renovations 2.0% – 4.0% 2/15/2011 2/15/2021 — 175,000 — 175,000 Building Renovations 2.0% – 4.0% 2/15/2011 2/15/2021 — 1,500,000 — 1,500,000 Replacement of Radio System 2.0% – 4.0% 2/15/2011 2/15/2021 — 6,200,000 — 6,200,000 Old Police Station Renovation 2.0% – 4.5% 2/15/2011 2/15/2031 — 4,000,000 — 4,000,000 CRLS Renovations 2.0% – 4.5% 2/15/2011 2/15/2031 — 16,145,000 — 16,145,000 Harvard Square Enhancements 2.0% – 4.0% 2/15/2011 2/15/2021 — 2,000,000 — 2,000,000 Danehy Park Improvements 2.0% – 4.0% 2/15/2011 2/15/2021 — 700,000 — 700,000 Kendall Square Improvements 2.0% 2/15/2011 2/15/2016 — 500,000 — 500,000 Sewer Reconstruction 2.0% – 4.0% 2/15/2011 2/15/2021 — 15,000,000 — 15,000,000
Total inside debt limit 289,763,112 46,220,000 35,313,095 300,670,017
Outside debt limit:School:
Elementary school renovations 4.5% – 5.0% 12/1/2000 12/1/2010 530,000 — 530,000 —
Total school 530,000 — 530,000 —
Water:MWPAT/Water Loan 4.25% – 5.63% 11/1/2000 11/1/2010 1,418,332 — 1,418,332 — Construction/Stoney Brook 3.5% – 5.0% 12/15/2001 12/15/2011 1,390,000 — 695,000 695,000 Automated Meter Reading
System 2.5% – 3.3% 1/15/2004 1/1/2014 1,200,000 — 300,000 900,000 Automated Meter Reading
System 3% – 4% 2/1/2005 1/1/2015 600,000 — 120,000 480,000 Water Series C 2007 Bonds 4% – 5.0% 3/15/2007 8/1/2019 22,245,000 — 2,425,000 19,820,000
Total water 26,853,332 — 4,958,332 21,895,000
HUD Sec 108 Notes 5.07% 9/14/2006 8/1/2014 290,000 — 25,000 265,000 Housing Trust Fund:
Note payable 2.00% 6/30/2007 7/1/2021 6,000,000 — 213,272 5,786,728
Total outside debt limit 33,673,332 — 5,726,604 27,946,728 Total debt outstanding $ 323,436,444 46,220,000 41,039,699 328,616,745
See accompanying independent auditors’ report.
75

S t a t i s t i c a l S e c t i o n

CITY OF CAMBRIDGE, MASSACHUSETTS
Supplemental Statements and Schedules
June 30, 2011
Statistical Section
This part of the City of Cambridge’s comprehensive annual financial report presentsinformation as a context for understanding what the information in the financialstatements, note disclosures, and required supplementary information says about theCity’s overall financial health.
Contents Page
Financial Trends 77 These schedules contain trend information to help the reader understand howthe City’s financial performance and well-being have changed over time.(See accompanying Management’s Discussion and Analysis, Statement ofNet Assets and Statement of Activities);
General Government Expenditures by Function (GAAP Basis) – Last Ten Fiscal YearsGeneral Government Revenues by Source (GAAP Basis) – Last Ten Fiscal YearsNet Assets by Component – Last Ten Fiscal YearsChanges in Net Assets – Last Ten Fiscal YearsFund Balances of Governmental Funds – Last Ten Fiscal YearsChanges in Fund Balances of Government Funds – Last Ten Fiscal Years
Revenue Capacity 84 These schedules contain information to help the reader assess the City’s mostsignificant revenue source, the property tax:
Assessed Value and Actual Value of Taxable Property – Last Ten Fiscal YearsProperty and Motor Vehicle Tax Rates – Last Ten Fiscal YearsLargest Principal Taxpayers – Current Year and Nine Years AgoProperty Tax Levies and Collections – Last Ten Fiscal Years
Debt Capacity 88 These schedules contain information to assist the reader in assessing the City’scurrent debt outstanding and their ability to issue additional debt in the future:(See accompanying note 8 of the basic financial statements):
Ratios of Outstanding Debt by Type – Last Ten Fiscal YearsRatios of General Bonded Debt Outstanding – Last Ten Fiscal YearsDirect and Overlapping Governmental Activities DebtLegal Debt Margin Information – Last Ten Fiscal Years
Demographic and Economic Information 92 These schedules contain information to help the reader understand the economicenvironment with which the City’s financial activities take place and assistwith comparisons over time and among other City’s:
Demographic and Economic Statistics – Last Ten Calendar YearsPrincipal Employers – Current Year and Nine Years Ago
Operating Information 94 These schedules contain information to provide contextual information aboutthe City’s operations and resources to help readers gain an understanding ofthe City’s economic condition;
Full-Time Position Employees by Function/Program – Last Ten Fiscal YearsOperating Indicators by Function/Program – Last Ten Fiscal YearsCapital Asset Statistics by Function/Program – Last Ten Fiscal Years
Sources: Unless otherwise noted, the information contained in these schedules isderived from the comprehensive annual financial reports for the relevant year.
76
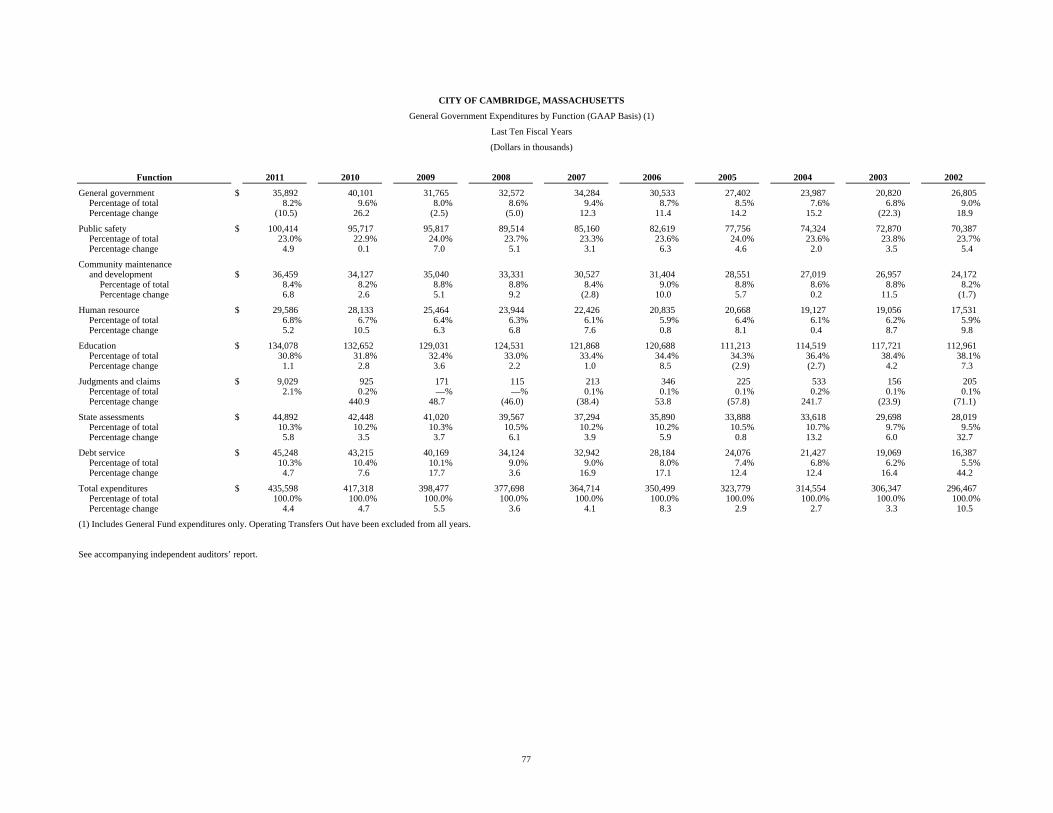
CITY OF CAMBRIDGE, MASSACHUSETTS
General Government Expenditures by Function (GAAP Basis) (1)
Last Ten Fiscal Years
(Dollars in thousands)
Function 2011 2010 2009 2008 2007 2006 2005 2004 2003 2002
General government $ 35,892 40,101 31,765 32,572 34,284 30,533 27,402 23,987 20,820 26,805 Percentage of total 8.2% 9.6% 8.0% 8.6% 9.4% 8.7% 8.5% 7.6% 6.8% 9.0%Percentage change (10.5) 26.2 (2.5) (5.0) 12.3 11.4 14.2 15.2 (22.3) 18.9
Public safety $ 100,414 95,717 95,817 89,514 85,160 82,619 77,756 74,324 72,870 70,387 Percentage of total 23.0% 22.9% 24.0% 23.7% 23.3% 23.6% 24.0% 23.6% 23.8% 23.7%Percentage change 4.9 0.1 7.0 5.1 3.1 6.3 4.6 2.0 3.5 5.4
Community maintenanceand development $ 36,459 34,127 35,040 33,331 30,527 31,404 28,551 27,019 26,957 24,172
Percentage of total 8.4% 8.2% 8.8% 8.8% 8.4% 9.0% 8.8% 8.6% 8.8% 8.2%Percentage change 6.8 2.6 5.1 9.2 (2.8) 10.0 5.7 0.2 11.5 (1.7)
Human resource $ 29,586 28,133 25,464 23,944 22,426 20,835 20,668 19,127 19,056 17,531 Percentage of total 6.8% 6.7% 6.4% 6.3% 6.1% 5.9% 6.4% 6.1% 6.2% 5.9%Percentage change 5.2 10.5 6.3 6.8 7.6 0.8 8.1 0.4 8.7 9.8
Education $ 134,078 132,652 129,031 124,531 121,868 120,688 111,213 114,519 117,721 112,961 Percentage of total 30.8% 31.8% 32.4% 33.0% 33.4% 34.4% 34.3% 36.4% 38.4% 38.1%Percentage change 1.1 2.8 3.6 2.2 1.0 8.5 (2.9) (2.7) 4.2 7.3
Judgments and claims $ 9,029 925 171 115 213 346 225 533 156 205 Percentage of total 2.1% 0.2% —% —% 0.1% 0.1% 0.1% 0.2% 0.1% 0.1%Percentage change 440.9 48.7 (46.0) (38.4) 53.8 (57.8) 241.7 (23.9) (71.1)
State assessments $ 44,892 42,448 41,020 39,567 37,294 35,890 33,888 33,618 29,698 28,019 Percentage of total 10.3% 10.2% 10.3% 10.5% 10.2% 10.2% 10.5% 10.7% 9.7% 9.5%Percentage change 5.8 3.5 3.7 6.1 3.9 5.9 0.8 13.2 6.0 32.7
Debt service $ 45,248 43,215 40,169 34,124 32,942 28,184 24,076 21,427 19,069 16,387 Percentage of total 10.3% 10.4% 10.1% 9.0% 9.0% 8.0% 7.4% 6.8% 6.2% 5.5%Percentage change 4.7 7.6 17.7 3.6 16.9 17.1 12.4 12.4 16.4 44.2
Total expenditures $ 435,598 417,318 398,477 377,698 364,714 350,499 323,779 314,554 306,347 296,467 Percentage of total 100.0% 100.0% 100.0% 100.0% 100.0% 100.0% 100.0% 100.0% 100.0% 100.0%Percentage change 4.4 4.7 5.5 3.6 4.1 8.3 2.9 2.7 3.3 10.5
(1) Includes General Fund expenditures only. Operating Transfers Out have been excluded from all years.
See accompanying independent auditors’ report.
77

CITY OF CAMBRIDGE, MASSACHUSETTS
General Government Revenues by Source (GAAP Basis) (1)
Last Ten Fiscal Years
(Dollars in thousands)
Source 2011 2010 2009 2008 2007 2006 2005 2004 2003 2002
Property taxes $ 281,812 266,862 251,256 238,747 231,875 222,987 220,910 206,354 198,784 198,806 Percentage of total 67.6% 68.4% 66.9% 62.2% 61.8% 62.8% 65.3% 65.3% 64.4% 64.5%Percentage change 5.6 6.2 5.2 3.0 4.0 0.9 7.1 3.8 — 13.8
Motor vehicle excises $ 6,453 6,182 6,140 6,650 5,942 6,146 6,452 6,087 6,031 5,838 Percentage of total 1.5% 1.6% 1.6% 1.7% 1.6% 1.7% 1.9% 1.9% 2.0% 1.9%Percentage change 4.4 0.7 (7.7) 11.9 (3.3) (4.7) 6.0 0.9 3.3 (1.4)
Hotel/motel/meals $ 13,573 9,362 6,803 6,863 6,751 5,801 5,461 4,287 4,401 4,908 Percentage of total 3.3% 2.4% 1.8% 1.8% 1.8% 1.6% 1.6% 1.4% 1.4% 1.6%Percentage change 45.0 38.0 (0.9) 1.7 16.4 6.2 27.4 (2.6) (10.3) (13.1)
Fines $ 637 633 629 767 726 922 352 539 100 536 Percentage of total 0.2% 0.2% 0.2% 0.2% 0.2% 0.3% 0.1% 0.2% —% 0.2%Percentage change 0.6 0.6 (18.0) 5.6 (21.3) 161.9 (34.7) 439.0 (81.3) (67.6)
Intergovernmental $ 31,796 32,139 37,235 47,575 44,658 44,143 43,802 42,601 42,690 46,822 Percentage of total 7.6% 8.2% 9.9% 12.4% 11.9% 12.4% 13.0% 13.5% 13.8% 15.2%Percentage change (1.1) (13.7) (21.7) 6.5 1.2 0.8 2.8 (0.2) (8.8) (0.4)
Licenses and permits $ 14,273 10,305 8,053 12,390 11,701 12,508 8,976 7,790 12,387 7,201 Percentage of total 3.4% 2.6% 2.1% 3.2% 3.1% 3.5% 2.7% 2.5% 4.0% 2.3%Percentage change 38.5 28.0 (35.0) 5.9 (6.5) 39.3 15.2 (37.1) 72.0 (38.6)
Payment in lieu of taxes $ 7,345 7,106 7,012 7,319 6,939 6,579 6,839 6,329 4,644 5,316 Percentage of total 1.8% 1.8% 1.9% 1.9% 1.8% 1.9% 2.0% 2.0% 1.5% 1.7%Percentage change 3.4 1.3 (4.2) 5.5 5.5 (3.8) 8.1 36.3 (12.6) 10.6
Investment income $ 1,064 1,274 4,257 9,295 11,119 7,410 2,888 1,181 1,513 2,344 Percentage of total 0.3% 0.3% 1.1% 2.4% 3.0% 2.1% 0.9% 0.4% 0.5% 0.8%Percentage change (16.5) (70.1) (54.2) (16.4) 50.1 156.6 144.5 (21.9) (35.5) (26.9)
Charges for services $ 40,347 36,825 36,058 36,874 38,761 33,835 28,661 26,546 27,061 23,837 Percentage of total 9.7% 9.4% 9.6% 9.6% 10.3% 9.5% 8.5% 8.4% 8.8% 7.6%Percentage change 9.6 2.1 (2.2) (4.9) 14.6 18.1 8.0 (1.9) 13.5 15.9
Departmental/other $ 19,652 19,132 18,205 17,564 16,650 14,491 13,841 14,054 11,234 12,536 Percentage of total 4.7% 4.9% 4.8% 4.6% 4.4% 4.1% 4.1% 4.5% 3.6% 4.1%Percentage change 2.7 5.1 3.6 5.5 14.9 4.7 (1.5) 25.1 (10.4) 23.9
Total revenues $ 416,951 389,820 375,648 384,044 375,122 354,822 338,182 315,768 308,845 308,144 Percentage of total 100.0% 100.0% 100.0% 100.0% 100.0% 100.0% 100.0% 100.0% 100.0% 100.0%Percentage change 7.0 3.8 (2.2) 2.4 5.7 4.9 7.1 2.2 0.2 8.0
(1) Includes General Fund revenues only. Operating Transfers In have been excluded from all years.
See accompanying independent auditors’ report.
78
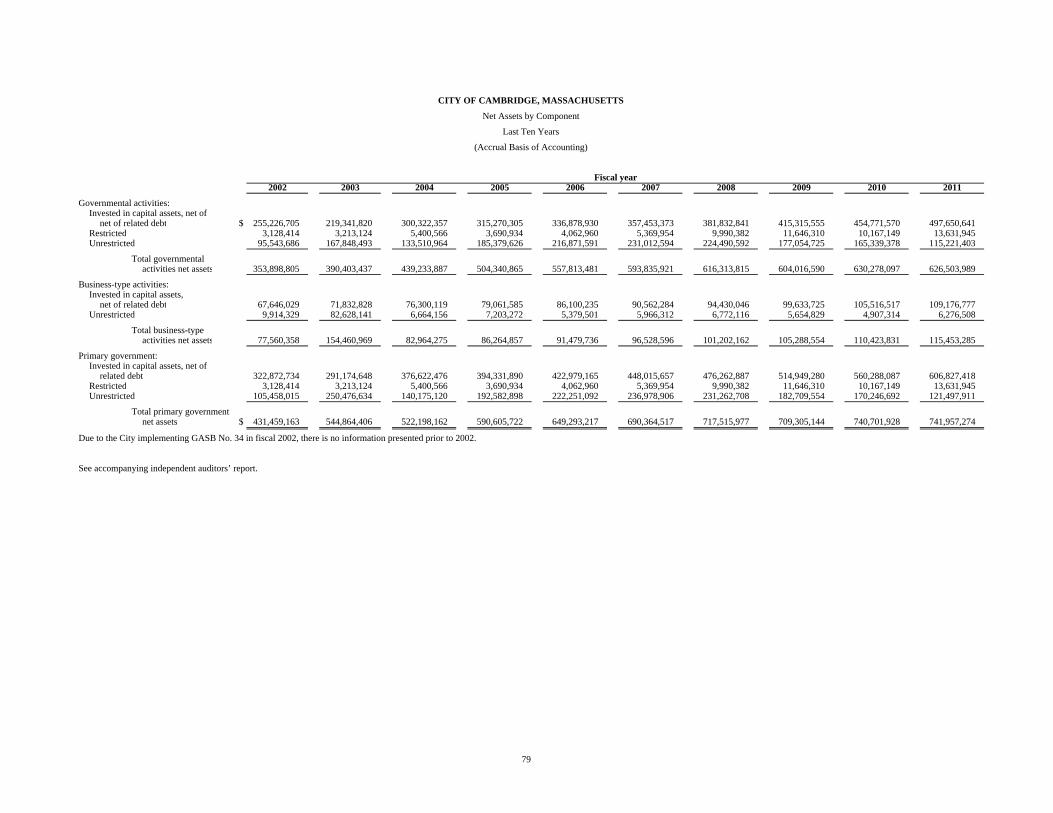
CITY OF CAMBRIDGE, MASSACHUSETTS
Net Assets by Component
Last Ten Years
(Accrual Basis of Accounting)
Fiscal year2002 2003 2004 2005 2006 2007 2008 2009 2010 2011
Governmental activities:Invested in capital assets, net of
net of related debt $ 255,226,705 219,341,820 300,322,357 315,270,305 336,878,930 357,453,373 381,832,841 415,315,555 454,771,570 497,650,641 Restricted 3,128,414 3,213,124 5,400,566 3,690,934 4,062,960 5,369,954 9,990,382 11,646,310 10,167,149 13,631,945 Unrestricted 95,543,686 167,848,493 133,510,964 185,379,626 216,871,591 231,012,594 224,490,592 177,054,725 165,339,378 115,221,403
Total governmentalactivities net assets 353,898,805 390,403,437 439,233,887 504,340,865 557,813,481 593,835,921 616,313,815 604,016,590 630,278,097 626,503,989
Business-type activities:Invested in capital assets,
net of related debt 67,646,029 71,832,828 76,300,119 79,061,585 86,100,235 90,562,284 94,430,046 99,633,725 105,516,517 109,176,777 Unrestricted 9,914,329 82,628,141 6,664,156 7,203,272 5,379,501 5,966,312 6,772,116 5,654,829 4,907,314 6,276,508
Total business-typeactivities net assets 77,560,358 154,460,969 82,964,275 86,264,857 91,479,736 96,528,596 101,202,162 105,288,554 110,423,831 115,453,285
Primary government:Invested in capital assets, net of
related debt 322,872,734 291,174,648 376,622,476 394,331,890 422,979,165 448,015,657 476,262,887 514,949,280 560,288,087 606,827,418 Restricted 3,128,414 3,213,124 5,400,566 3,690,934 4,062,960 5,369,954 9,990,382 11,646,310 10,167,149 13,631,945 Unrestricted 105,458,015 250,476,634 140,175,120 192,582,898 222,251,092 236,978,906 231,262,708 182,709,554 170,246,692 121,497,911
Total primary governmentnet assets $ 431,459,163 544,864,406 522,198,162 590,605,722 649,293,217 690,364,517 717,515,977 709,305,144 740,701,928 741,957,274
Due to the City implementing GASB No. 34 in fiscal 2002, there is no information presented prior to 2002.
See accompanying independent auditors’ report.
79

CITY OF CAMBRIDGE, MASSACHUSETTS
Changes in Net Assets, Last Ten Fiscal Years
(Accrual Basis of Accounting)
Fiscal year2002 2003 2004 2005 2006 2007 2008 2009 2010 2011
Expenses:Governmental activities:
General government $ 28,365,001 23,235,936 26,141,840 27,614,108 31,690,819 36,373,427 35,225,912 39,085,426 44,027,730 46,676,807 Public safety 73,177,887 77,556,200 72,576,467 81,863,575 84,796,098 88,299,052 100,538,293 106,362,564 119,538,796 122,033,751 Community maintenance and development 37,355,588 48,106,254 43,642,108 41,674,280 55,766,148 56,672,106 61,727,373 70,461,598 73,990,003 90,907,773 Human resource development 28,678,036 30,682,567 30,760,075 32,883,356 33,453,013 33,728,004 37,432,501 40,393,841 43,737,742 45,752,191 Education 124,103,073 128,699,429 125,097,466 126,177,359 133,952,334 138,673,636 150,992,375 156,458,805 165,216,021 171,283,824 State and district assessments (1) 21,420,935 22,328,710 27,117,517 27,386,544 29,640,415 31,294,026 33,567,157 35,020,229 — — Interest on long-term debt 5,065,745 4,720,322 5,517,607 6,184,656 8,007,458 8,336,823 9,303,724 9,503,428 10,039,003 9,756,666
Total governmental activities 318,166,265 335,329,418 330,853,080 343,783,878 377,306,285 393,377,074 428,787,335 457,285,891 456,549,295 486,411,012
Business-type activities:Water 15,079,842 14,199,144 13,792,805 14,456,090 14,118,060 13,657,590 14,411,374 14,620,020 13,721,172 13,544,425
Total business-type activities expenses 15,079,842 14,199,144 13,792,805 14,456,090 14,118,060 13,657,590 14,411,374 14,620,020 13,721,172 13,544,425
Total primary government expenses 333,246,107 349,528,562 344,645,885 358,239,968 391,424,345 407,034,664 443,198,709 471,905,911 470,270,467 499,955,437
Program revenues:Governmental activities:
Charges for services:Public safety 22,627,366 27,772,926 23,358,965 26,731,634 33,739,682 31,606,231 34,640,573 29,786,501 33,174,134 37,946,079 Sewer charges 25,251,184 30,821,353 28,040,442 31,311,866 36,633,238 38,689,798 38,967,973 37,767,491 39,685,063 42,168,021 Human resource and development 2,443,060 2,461,592 4,283,188 4,786,376 2,800,184 2,856,637 3,142,447 3,397,736 3,554,633 3,606,526 Other activities 228,388 373,838 436,341 503,519 503,010 414,844 493,643 499,322 1,863,149 1,978,164
Operating grants and contributions 22,735,760 17,455,370 23,877,740 24,521,234 28,125,429 26,210,631 27,238,759 28,910,186 35,953,873 25,562,766 Capital grants and contributions 3,537,887 12,925,487 5,549,984 4,556,870 15,366,641 6,541,460 16,129,811 10,191,408 38,367,032 9,091,275
Total governmental activities program revenues 76,823,645 91,810,566 85,546,660 92,411,499 117,168,184 106,319,601 120,613,206 110,552,644 152,597,884 120,352,831
Business-type activities:Charges for services:
Water 15,523,309 16,979,446 16,902,863 18,153,081 19,629,812 19,016,582 19,597,687 19,070,169 19,396,031 19,130,204
Total business-type program revenues 15,523,309 16,979,446 16,902,863 18,153,081 19,629,812 19,016,582 19,597,687 19,070,169 19,396,031 19,130,204
Total primary government program revenues 92,346,954 108,790,012 102,449,523 110,564,580 136,797,996 125,336,183 140,210,893 129,622,813 171,993,915 139,483,035
Net (expense) revenue:Governmental activities (241,342,620) (243,518,852) (245,306,420) (251,372,379) (260,138,101) (287,057,473) (308,174,129) (346,733,247) (303,951,411) (366,058,181) Business-type activities 443,467 2,780,302 3,110,058 3,696,991 5,511,752 5,358,992 5,186,313 4,450,149 5,674,859 5,585,779
Total primary government net expense $ (240,899,153) (240,738,550) (242,196,362) (247,675,388) (254,626,349) (281,698,481) (302,987,816) (342,283,098) (298,276,552) (360,472,402)
Due to the City implementing GASB No. 34 in fiscal 2002, there is no information presented prior to 2002.
(1) State and district assessments were allocated to appropriate functions in fiscal 2010 and 2011.
See accompanying independent auditors’ report.
(Continued)80

CITY OF CAMBRIDGE, MASSACHUSETTS
Changes in Net Assets, Last Ten Fiscal Years
(Accrual Basis of Accounting)
Fiscal year2002 2003 2004 2005 2006 2007 2008 2009 2010 2011
General revenues and otherchanges in net assets:
Governmental activities:Property taxes $ 199,963,787 198,116,572 211,391,274 214,906,034 227,024,672 230,740,742 238,400,940 252,948,784 265,565,126 282,244,351 Excise taxes 10,745,939 10,204,545 10,561,612 11,753,246 12,555,704 12,516,776 13,676,112 12,801,715 15,526,734 19,977,226
Unrestricted grants and contributions 46,822,454 42,311,932 42,601,103 43,801,641 39,553,164 41,338,603 40,149,251 36,085,639 21,853,897 31,795,812 Payments in lieu of taxes 5,316,254 4,644,373 6,329,176 6,839,369 6,579,380 6,939,046 7,318,567 7,011,953 7,105,643 7,344,911 Investment income 3,331,545 2,546,628 1,659,344 3,873,379 9,699,805 14,434,985 12,467,474 5,865,388 1,894,610 1,255,842 Miscellaneous 15,515,230 21,822,564 21,217,361 12,480,304 17,662,993 16,571,631 17,961,549 20,038,690 17,581,978 18,978,421 Special item — — — 22,293,549 — — — — — — Transfers 376,870 376,870 377,000 531,835 535,000 538,130 678,130 482,585 684,930 687,510
Total governmental activities 282,072,079 280,023,484 294,136,870 316,479,357 313,610,718 323,079,913 330,652,023 335,234,754 330,212,918 362,284,073
Business-type activities:Investment income 56,962 131,852 135,575 135,426 238,127 227,998 165,383 118,828 145,348 131,185 Transfers (376,870) (376,870) (377,000) (531,835) (535,000) (538,130) (678,130) (482,585) (684,930) (687,510)
Total business-type activities (319,908) (245,018) (241,425) (396,409) (296,873) (310,132) (512,747) (363,757) (539,582) (556,325) Total primary government $ 281,752,171 279,778,466 293,895,445 316,082,948 313,313,845 322,769,781 330,139,276 334,870,997 329,673,336 361,727,748
Change in net assets:Governmental activities $ 40,729,459 36,504,632 48,830,450 65,106,978 53,472,617 36,022,440 22,477,894 (11,498,493) 26,261,507 (3,774,108) Business-type activities 123,559 2,535,284 2,868,633 3,300,582 5,214,879 5,048,860 4,673,566 4,086,392 5,135,277 5,029,454
Total primary government $ 40,853,018 39,039,916 51,699,083 68,407,560 58,687,496 41,071,300 27,151,460 (7,412,101) 31,396,784 1,255,346
Due to the City implementing GASB No. 34 in fiscal 2002, there is no information presented prior to 2002.
See accompanying independent auditors’ report.
81

CITY OF CAMBRIDGE, MASSACHUSETTS
Fund Balances, Governmental Funds
Last Ten Fiscal Years
Fiscal years2002 2003 2004 2005 2006 2007 2008 2009 2010 2011
General fund:Reserved $ 13,390,746 6,097,472 9,493,486 24,203,862 16,428,333 17,791,512 17,206,706 14,900,082 16,802,030 — Unreserved 69,586,739 85,286,619 90,479,144 100,050,320 120,245,450 134,869,147 150,312,018 141,595,256 129,495,866 — Nonspendable (2) — — — — — — — — — 1,668,986 Restricted (2) — — — — — — — — — — Committed (2) — — — — — — — — — 42,061,955 Unassigned (2) — — — — — — — — — 99,698,895
Total general fund $ 82,977,485 91,384,091 99,972,630 124,254,182 136,673,783 152,660,659 167,518,724 156,495,338 146,297,896 143,429,836
All other governmental funds:Reserved $ 50,451,757 41,115,518 48,583,062 28,515,541 28,660,330 12,687,274 76,741,409 31,315,543 79,650,408 — Unreserved, reported in:
Special revenue funds andpermanent funds — 28,361,764 31,850,012 38,696,151 50,256,273 87,098,510 52,687,083 48,691,005 21,007,217 —
Affordable Housing Trust fund (1) — — — — — — — — 38,205,509 — Capital funds 776,114 (1,453,931) (702,646) 41,596,488 62,252,680 50,831,905 30,946,966 59,319,015 4,499,536 —
Nonspendable (2) — — — — — — — — — 2,075,173 Restricted (2) — — — — — — — — — 70,523,371 Committed (2) — — — — — — — — — 56,302,807 Unassigned (2) — — — — — — — — — —
Total all othergovernmental funds $ 51,227,871 68,023,351 79,730,428 108,808,180 141,169,283 150,617,689 160,375,458 139,325,563 143,362,670 128,901,351
(1) The Affordable Housing Trust fund became a major fund in fiscal 2010.
(2) The City, in 2011, implemented GASB 54, Fund Balance Reporting and Governmental Fund Type Definitions .
See accompanying independent auditors’ report.
82
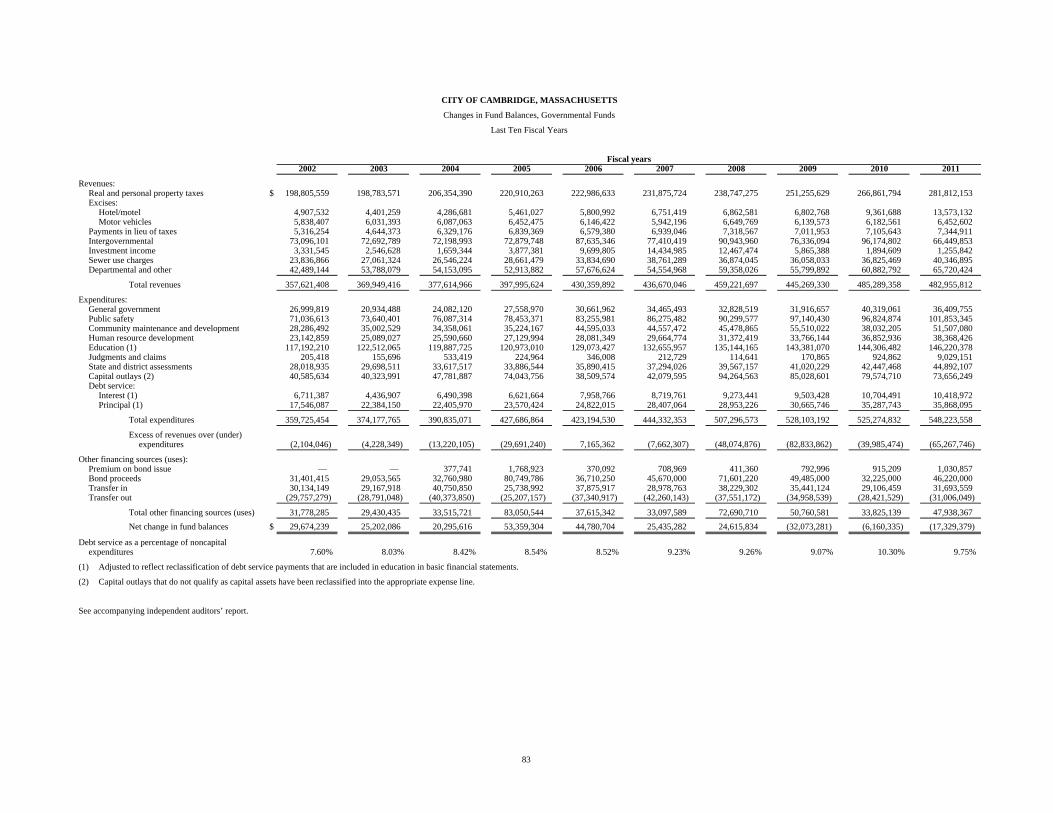
CITY OF CAMBRIDGE, MASSACHUSETTS
Changes in Fund Balances, Governmental Funds
Last Ten Fiscal Years
Fiscal years2002 2003 2004 2005 2006 2007 2008 2009 2010 2011
Revenues:Real and personal property taxes $ 198,805,559 198,783,571 206,354,390 220,910,263 222,986,633 231,875,724 238,747,275 251,255,629 266,861,794 281,812,153 Excises:
Hotel/motel 4,907,532 4,401,259 4,286,681 5,461,027 5,800,992 6,751,419 6,862,581 6,802,768 9,361,688 13,573,132 Motor vehicles 5,838,407 6,031,393 6,087,063 6,452,475 6,146,422 5,942,196 6,649,769 6,139,573 6,182,561 6,452,602
Payments in lieu of taxes 5,316,254 4,644,373 6,329,176 6,839,369 6,579,380 6,939,046 7,318,567 7,011,953 7,105,643 7,344,911 Intergovernmental 73,096,101 72,692,789 72,198,993 72,879,748 87,635,346 77,410,419 90,943,960 76,336,094 96,174,802 66,449,853 Investment income 3,331,545 2,546,628 1,659,344 3,877,381 9,699,805 14,434,985 12,467,474 5,865,388 1,894,609 1,255,842 Sewer use charges 23,836,866 27,061,324 26,546,224 28,661,479 33,834,690 38,761,289 36,874,045 36,058,033 36,825,469 40,346,895 Departmental and other 42,489,144 53,788,079 54,153,095 52,913,882 57,676,624 54,554,968 59,358,026 55,799,892 60,882,792 65,720,424
Total revenues 357,621,408 369,949,416 377,614,966 397,995,624 430,359,892 436,670,046 459,221,697 445,269,330 485,289,358 482,955,812
Expenditures:General government 26,999,819 20,934,488 24,082,120 27,558,970 30,661,962 34,465,493 32,828,519 31,916,657 40,319,061 36,409,755 Public safety 71,036,613 73,640,401 76,087,314 78,453,371 83,255,981 86,275,482 90,299,577 97,140,430 96,824,874 101,853,345 Community maintenance and development 28,286,492 35,002,529 34,358,061 35,224,167 44,595,033 44,557,472 45,478,865 55,510,022 38,032,205 51,507,080 Human resource development 23,142,859 25,089,027 25,590,660 27,129,994 28,081,349 29,664,774 31,372,419 33,766,144 36,852,936 38,368,426 Education (1) 117,192,210 122,512,065 119,887,725 120,973,010 129,073,427 132,655,957 135,144,165 143,381,070 144,306,482 146,220,378 Judgments and claims 205,418 155,696 533,419 224,964 346,008 212,729 114,641 170,865 924,862 9,029,151 State and district assessments 28,018,935 29,698,511 33,617,517 33,886,544 35,890,415 37,294,026 39,567,157 41,020,229 42,447,468 44,892,107 Capital outlays (2) 40,585,634 40,323,991 47,781,887 74,043,756 38,509,574 42,079,595 94,264,563 85,028,601 79,574,710 73,656,249 Debt service:
Interest (1) 6,711,387 4,436,907 6,490,398 6,621,664 7,958,766 8,719,761 9,273,441 9,503,428 10,704,491 10,418,972 Principal (1) 17,546,087 22,384,150 22,405,970 23,570,424 24,822,015 28,407,064 28,953,226 30,665,746 35,287,743 35,868,095
Total expenditures 359,725,454 374,177,765 390,835,071 427,686,864 423,194,530 444,332,353 507,296,573 528,103,192 525,274,832 548,223,558
Excess of revenues over (under)expenditures (2,104,046) (4,228,349) (13,220,105) (29,691,240) 7,165,362 (7,662,307) (48,074,876) (82,833,862) (39,985,474) (65,267,746)
Other financing sources (uses):Premium on bond issue — — 377,741 1,768,923 370,092 708,969 411,360 792,996 915,209 1,030,857 Bond proceeds 31,401,415 29,053,565 32,760,980 80,749,786 36,710,250 45,670,000 71,601,220 49,485,000 32,225,000 46,220,000 Transfer in 30,134,149 29,167,918 40,750,850 25,738,992 37,875,917 28,978,763 38,229,302 35,441,124 29,106,459 31,693,559 Transfer out (29,757,279) (28,791,048) (40,373,850) (25,207,157) (37,340,917) (42,260,143) (37,551,172) (34,958,539) (28,421,529) (31,006,049)
Total other financing sources (uses) 31,778,285 29,430,435 33,515,721 83,050,544 37,615,342 33,097,589 72,690,710 50,760,581 33,825,139 47,938,367 Net change in fund balances $ 29,674,239 25,202,086 20,295,616 53,359,304 44,780,704 25,435,282 24,615,834 (32,073,281) (6,160,335) (17,329,379)
Debt service as a percentage of noncapitalexpenditures 7.60% 8.03% 8.42% 8.54% 8.52% 9.23% 9.26% 9.07% 10.30% 9.75%
(1) Adjusted to reflect reclassification of debt service payments that are included in education in basic financial statements.
(2) Capital outlays that do not qualify as capital assets have been reclassified into the appropriate expense line.
See accompanying independent auditors’ report.
83

CITY OF CAMBRIDGE, MASSACHUSETTS
Assessed Value and Actual Value of Taxable Property
Last Ten Fiscal Years
(In millions of dollars)
Fiscal Personal, WeightedYear Total taxable commercial averageended Residential Commercial Industrial Personal assessed Residential and industrial direct
June 30 property property property property value (1) rate rate rate
2002 $ 10,317 4,994 1,221 305 16,837 7.22 18.81 11.71 2003 10,820 5,098 1,466 368 17,752 7.26 18.67 11.72 2004 12,157 4,818 1,808 444 19,227 7.63 19.08 11.84 2005 13,871 4,980 2,030 467 21,348 7.78 18.28 11.46 2006 13,962 4,930 2,350 605 21,847 7.38 17.86 11.16 2007 14,136 4,929 2,443 659 22,167 7.48 18.30 11.40 2008 14,427 5,541 2,836 737 23,541 7.36 17.24 11.19 2009 14,651 5,606 2,851 768 23,876 7.56 17.97 11.58 2010 14,894 5,561 2,906 911 24,272 7.72 18.75 11.98 2011 14,824 5,528 2,850 960 24,162 8.16 19.90 12.70
(1) As of January 1st of the previous calendar year.
Note: Property in the City is reassessed each year. Property is assessed at actual value; therefore, the assessed values are equal to the fair value.Tax rates are per $1,000 of assessed value.
Source: City Department of Finance
See accompanying independent auditors’ report.
84

CITY OF CAMBRIDGE, MASSACHUSETTS
Property and Motor Vehicle Tax Rates
Last Ten Fiscal Years
CommercialResidential and industrial Personal Motor
Fiscal year real property real property property vehicle
2002 $ 7.22 18.81 18.81 25.00 2003 7.26 18.67 18.67 25.00 2004 7.63 19.08 19.08 25.00 2005 7.78 18.28 18.28 25.00 2006 7.38 17.86 17.86 25.00 2007 7.48 18.30 18.30 25.00 2008 7.36 17.24 17.24 25.00 2009 7.56 17.97 17.97 25.00 2010 7.72 18.75 18.75 25.00 2011 8.16 19.90 19.90 25.00
(1) Real and personal property tax rate applicable to each $1,000 of assessed value. Motor vehicle excisetax is assessed on a calendar year basis, applicable to each $1,000 of assessed value.
See accompanying independent auditors’ report.
85

CITY OF CAMBRIDGE, MASSACHUSETTS
Largest Principal Taxpayers
Current Year and Nine Years Ago
2011 2002Taxable Percentage Taxable Percentageassessed Amount of total assessed Amount of total
Taxpayer value of tax tax levy Taxpayer value of tax tax levy
Massachusetts Institute of Technology (1) $ 1,780,800,100 33,929,810 11.95% Massachusetts Institute of Technology (1) $ 788,944,000 14,116,236 7.53%BioMed Realty Trust 806,074,400 15,867,559 5.59 Boston Properties 451,045,500 8,484,166 4.53Boston Properties 568,494,000 11,313,031 3.98 Equity Partners 242,671,700 4,564,655 2.44Equity Partners 284,062,200 5,021,479 1.77 Riverfront LLC 211,617,999 3,982,416 2.12Presidents & Fellows of Harvard College (1) 362,094,900 4,894,440 1.72 The Bullfinch Company 157,566,700 2,911,315 1.55New England Development 214,500,000 4,268,550 1.50 President & Fellows of Harvard College (1) 216,697,147 2,382,155 1.27Novartis Pharmaceuticals 195,624,900 3,892,936 1.37 New England Development 125,843,200 2,367,111 1.26PREEF American Reit II Corp. 188,138,600 3,743,958 1.32 Lotus Development Corp./IBM Corp. 122,810,400 2,338,738 1.25RB Kendall Fee LLC 191,032,300 3,789,490 1.33 Cambridge Gas & Electric/Nstar 124,178,299 2,335,999 1.25Alexandria Real Estate 156,467,400 3,109,721 1.10 GE Capital Investments Advisors 123,954,000 2,331,582 1.24
Total $ 4,747,288,800 89,830,974 31.63% $ 2,565,328,945 45,814,373 24.44%
(1) Excludes in-lieu payment on exempt property
Source: City of Cambridge Finance Department
See accompanying independent auditors’ report.
86

CITY OF CAMBRIDGE, MASSACHUSETTS
Property Tax Levies and Collections (1)
Last Ten Fiscal Years
(In millions of dollars)
Taxes Collected within thelevied (2) fiscal year of the levy Collections Total collections to date
Fiscal year for the Percentage in subsequent Percentageended June 30 fiscal year Amount of levy years Amount of levy
2002 $ 187.4 183.0 97.65 (0.4) $ 182.6 97.442003 197.9 192.4 97.22 0.4 192.8 97.422004 210.1 203.0 96.62 2.1 205.1 97.622005 223.1 214.1 95.97 1.4 215.5 96.592006 223.2 217.5 97.45 0.8 218.3 97.802007 233.3 227.1 97.34 0.2 227.3 97.432008 243.0 237.9 97.90 0.6 238.5 98.152009 258.5 250.2 96.79 2.8 253.0 97.872010 269.1 263.1 97.77 2.6 265.7 98.742011 285.2 281.0 98.53 N/A 281.0 98.53
(1) Real and personal property taxes.
(2) Gross tax levied before overlay reserve.
See accompanying independent auditors’ report.
87

CITY OF CAMBRIDGE, MASSACHUSETTS
Ratios of Outstanding Debt by Type
Last Ten Fiscal Years
Business-type Ratio ofGovernmental activities activities debt to
General Section School General Total Percentage of taxableFiscal obligation 108 HUD equipment Notes obligation primary per capita Per assessedyear bonds notes payable notes payable payable bonds government income (a) capita (a) valuation (b)
2002 $ 140,028,249 825,000 2,314,652 6,000,000 72,701,609 221,869,510 7.03% $ 2,189 1.32%2003 148,816,663 405,000 2,000,516 6,000,000 66,789,295 224,011,474 7.09 2,210 1.262004 159,517,629 395,000 1,664,560 6,000,000 63,819,513 231,396,702 7.33 2,283 1.202005 217,066,282 385,000 1,305,269 6,000,000 58,745,699 283,502,250 8.98 2,797 1.332006 229,348,765 375,000 921,021 6,000,000 52,478,366 289,123,152 9.16 2,853 1.322007 233,541,396 355,000 510,082 6,000,000 45,689,363 286,095,841 9.06 2,823 1.292008 276,540,915 335,000 — 6,000,000 39,485,690 322,361,605 10.21 3,181 1.372009 293,330,855 315,000 — 6,000,000 33,200,861 332,846,716 10.54 3,284 1.392010 290,293,112 290,000 — 6,000,000 26,853,332 323,436,444 10.24 3,191 1.332011 300,670,017 265,000 — 5,786,728 21,895,000 328,616,745 6.86 3,125 1.36
Note 1: Details regarding the City’s outstanding debt can be found in the notes to the financial statements.
a See page 92 for per capita income and population data. These ratios are calculated using per capita income and population from prior calendar year.
b See page 84 for the taxable assessed valuation figures.
Note 2: According to the 2006-2008 Census Bureau’s American Community Survey Program, which is the most recent figure available, total personal income for Cambridge residentsis $3,132,936,400.
See accompanying independent auditors’ report.
88

CITY OF CAMBRIDGE, MASSACHUSETTS
Ratios of General Bonded Debt Outstanding
Last Ten Fiscal Years
Ratio ofGeneral Total debt to
obligation taxable taxablebonds assessed Per assessed
Fiscal year outstanding value capita (a) valuation (b)
2002 $ 212,729,858 16,837,000,000 2,099 1.26%2003 215,605,958 17,752,000,000 2,127 1.212004 223,337,142 19,227,000,000 2,204 1.162005 275,811,981 21,348,000,000 2,721 1.292006 281,827,131 21,847,000,000 2,781 1.292007 279,230,759 22,167,000,000 2,755 1.262008 316,026,605 23,541,000,000 3,118 1.342009 326,531,716 23,876,000,000 3,222 1.372010 317,146,444 24,272,000,000 3,129 1.312011 322,565,017 24,162,000,000 3,067 1.34
Note: Details regarding the city’s outstanding debt can be found in the notes to the financial statements.
a See page 92 for median family income and population data. These ratios are calculated using median family income and populationfrom prior calendar year.
b See page 84 for the taxable assessed valuation figures.
See accompanying independent auditors’ report.
89

CITY OF CAMBRIDGE, MASSACHUSETTS
Direct and Overlapping Governmental Activities Debt
June 30, 2011
Total CityPercentage of Cambridge
Outstanding applicable direct andDirect overlapping to City overlapping
Name of Unit debt (1) debt of Cambridge debt (1)
City of Cambridge $ 300,670,017 — 100.00% 300,670,017 Massachusetts Water Resources Authority — 4,004,845,000 5.008 200,559,646
Total direct and overlapping debt $ 300,670,017 4,004,845,000 501,229,663
(1) Excludes general obligation bonds that are reported as debt of the Enterprise Fund.
See accompanying independent auditors’ report.
90

CITY OF CAMBRIDGE, MASSACHUSETTS
Legal Debt Margin Information
Last Ten Fiscal Years
Legal Debt Margin Calculation for Fiscal Year 2011:Fiscal year 2011 equalized valuation (1) $ 28,162,029,300
Debt limit (5% of assessed value) (2) 1,408,101,465
Debt applicable to limit:General obligation bonds 322,830,017 Total authorized/unissued 104,673,551
Total debt outstanding plus authorized/unissued 427,503,568
Less general obligation bonds exempted by authority of the State legislature 21,895,000
Amount within debt limit 405,608,568 Legal debt margin $ 1,002,492,897
Fiscal year (Dollars in thousands)2002 2003 2004 2005 2006 2007 2008 2009 2010 2011
Debt limit $ 317,027 456,081 912,162 1,064,126 1,064,126 1,226,473 1,226,473 1,306,216 1,306,216 1,408,101 Total net debt
applicable to limit 228,807 272,051 313,959 363,536 340,956 365,939 388,105 402,855 382,057 405,608
Legal debtmargin $ 88,220 184,030 598,203 700,590 723,170 860,534 838,368 903,361 924,159 1,002,493
Total net debt applicableto the limit as apercentage of debt limit 72.17% 59.65% 34.42% 34.16% 32.04% 29.84% 31.64% 30.84% 29.25% 28.81%
(1) In order to determine appropriate relative values for the purpose of certain distributions to and assessments upon cities and towns, the Commissioner of Revenue biennially makes his own determination of fair cashvalue of the taxable property in each municipality. This is known as “equalized valuation.” The last redetermination of “equalized valuation” for the City was made as of January 1, 2008.
(2) Under Massachusetts Statutes, the Normal Debt Limit of the City is 5% of the valuation of taxable property as of the last equalized valuation.
See accompanying independent auditors’ report.
91

CITY OF CAMBRIDGE, MASSACHUSETTS
Demographic and Economic Statistics
Last Ten Calendar Years
92
PerMedian family capita Median School Unemployment
Year Population (1) income (1) income (1) age (1) enrollment (2) rate (3)
2002 101,355 $ 59,423 31,156 30.4 7,296 3.60%2003 101,355 59,423 31,156 30.4 7,111 3.802004 101 355 59 423 31 156 30 4 6 756 3 602004 101,355 59,423 31,156 30.4 6,756 3.602005 101,355 59,423 31,156 30.4 6,450 3.402006 101,355 59,423 31,156 30.4 6,001 3.702007 101,355 59,423 31,156 30.4 5,797 3.202008 101,355 59,423 31,156 30.4 5,861 3.802009 101,355 59,423 31,156 30.4 5,950 6.602010 101 355 59 423 31 156 30 4 6 137 5 602010 101,355 59,423 31,156 30.4 6,137 5.602011 105,162 88,574 45,521 30.2 6,202 5.00
(1) Source 2002 – 2010: U.S. Department of Commerce, Bureau of Census, Decennial Census, 2000Source 2011: U.S. Department of Commerce, Bureau of Census, Decennial Census
(2) Source: Cambridge School Department
(4)
(3) Source: State Executive Office of Labor and Workforce Development as of September of each respective year
See accompanying independent auditors’ report.
92

CITY OF CAMBRIDGE, MASSACHUSETTS
Principal Employers (1)
Current Year and Nine Years Ago
2011 2002Percentage Percentageof total city of total city
Employer Employees Rank employment Employer Employees Rank employment
Harvard University 10,718 1 10.07% Harvard University 8,403 1 7.27%MIT 7,604 2 7.15 MIT 7,426 2 6.42City of Cambridge (2) 2,922 3 2.75 City of Cambridge (2) 3,018 3 2.61Novartis Institute 2,095 4 1.97 Cambridge Public Health Commission 1,729 4 1.50Mt. Auburn Hospital 1,665 5 1.56 Lotus Development Corp./IBM 1,620 5 1.40Vertex Pharmaceuticals 1,600 6 1.50 Federal Government 1,485 6 1.28Genzyme Corporation 1,504 7 1.41 Mt. Auburn Hospital 1,476 7 1.28Biogen Idec 1,350 8 1.27 Millenium Pharmaceuticals 1,348 8 1.17Federal Government 1,316 9 1.24 Biogen Idec 1,155 9 1.00Pfizer (Wyeth) 1,300 10 1.22 Genzyme Corporation 1,112 10 0.96
32,074 30.14% 28,772 24.89%
Total average employed 106,405 115,614
(1) Totals based on full time equivalents (FTE’s), when available.
(2) Includes the Cambridge School Department
Source: Cambridge Community Development Department and cited employers
Source: Massachusetts Division of Employment and Training.
See accompanying independent auditors’ report.
93

CITY OF CAMBRIDGE, MASSACHUSETTS
Full-Time Positions by Function/Program
Last Ten Fiscal Years
Full-time positions as of June 30Function/program 2002 2003 2004 2005 2006 2007 2008 2009 2010 2011
General government:Executive management 18 16 15 15 15 16 16 16 16 16 Clerk 10 10 10 10 10 10 10 10 10 10 Law 12 12 11 11 11 11 11 11 11 11 Finance 83 83 83 83 83 83 83 83 80 81 Other 23 23 23 20 19 19 19 15 15 15
Subtotal 146 144 142 139 138 139 139 135 132 133
Public safety:Fire 284 285 283 284 284 284 284 284 284 285 Police 309 312 309 309 307 307 307 313 311 311 Traffic 82 82 81 81 80 80 80 80 81 81 Inspectional 28 28 28 28 28 27 27 27 27 27 Emergency communication 39 39 39 39 39 39 39 39 38 38 Other 25 26 25 31 30 30 30 30 28 27
Subtotal 767 772 765 772 768 767 767 773 769 769
Community maintenance:Public works 223 223 220 219 215 213 211 214 213 213 Community development 47 47 44 45 45 45 45 45 44 44 Other 12 12 12 13 13 13 13 13 13 12
Subtotal 282 282 276 277 273 271 269 272 270 269
Human resource development:Library 59 60 60 60 60 60 60 60 64 65 Human services 125 132 128 129 127 128 128 130 135 136 Other 7 7 7 7 7 7 7 7 7 7
Subtotal 191 199 195 196 194 195 195 197 206 208
Education 1,357 1,335 1,253 1,229 1,197 1,218 1,238 1,244 1,264 1,274 Water 67 67 65 65 63 63 63 63 60 55
Grand total 2,810 2,799 2,696 2,678 2,633 2,653 2,671 2,684 2,701 2,708
See accompanying independent auditors’ report.
94

CITY OF CAMBRIDGE, MASSACHUSETTS
Operating Indicators by Function/Program
Last Ten Fiscal Years
Fiscal yearFunction/program 2002 2003 2004 2005 2006 2007 2008 2009 2010 2011
Fire:Emergency responses 31,960 32,008 31,052 28,920 30,278 32,436 33,207 33,223 31,907 32,396 Fires extinguished 611 565 334 388 574 585 859 904 995 933 Hazardous materials emergency 499 379 497 250 248 287 206 232 206 198
Police:Physical arrests 1,199 1,263 1,248 1,185 1,234 1,385 1,740 1,605 1,534 2,200 Traffic violations 20,661 20,396 24,336 24,973 22,745 22,231 24,853 27,127 21,408 18,426
Traffic:Number of meters on street 3,026 2,804 2,804 2,770 2,815 3,157 3,075 2,909 3,035 3,067 Meter violations 218,010 199,490 181,974 192,462 200,000 187,797 191,583 194,001 201,959 206,101 Overtime meter violations 34,871 28,344 34,896 33,957 34,000 21,771 25,718 25,718 26,012 28,263
Inspectional:Major permits issued 85 90 75 109 143 285 89 45 343 82 Short form permits issued 2,203 2,413 2,500 2,824 2,910 2,818 2,796 2,866 2,737 2,957 Compliance inspections 6,792 5,998 3,645 6,044 5,946 6,942 6,797 5,224 4,809 5,359
Emergency communications:Total 911 Incidents dispatched 106,363 97,714 96,045 89,739 92,375 101,766 107,620 103,671 102,669 118,577 Medical 7,725 7,608 7,670 7,668 8,373 9,531 10,723 10,326 10,978 11,104 Traffic/MV-Related 24,605 21,970 22,898 25,319 27,219 23,772 22,066 21,443 17,754 15,726 Crime and Directed Patrol 40,805 34,502 32,258 28,700 28,796 38,232 44,402 43,588 45,536 60,392
Public works:Street Resurfacing (miles) 10.8 22.2 17.8 22.5 12.4 6.5 7.5 11.9 7.4 9.4 Sidewalk replaced (miles) 7.6 6.7 6.7 5.8 3.5 4.8 3.0 8.0 12.8 6.8 Rubbish collected (tons) 24,893 25,223 25,104 23,993 23,425 20,230 18,592 18,171 16,963 16,066 Recycling collected (tons) 11,789 11,966 13,065 12,742 12,600 12,710 13,166 12,954 12,685 13,300 New stormwater drains installed (linear feet) 3,000 1,500 3,000 1,200 525 750 3,190 1,595 3,257 4,099 New sanitary sewer installed (linear feet) 500 700 1,000 850 290 590 1,559 247 2,293 2,617
Community development:Number of affordable multi-family rental units 82 45 44 6 26 70 51 80 155 125 Number of affordable homeownership units developed 6 7 23 28 26 42 17 2 2 14
Human resource development:Library system circulation 998,331 1,116,012 1,123,755 986,501 940,330 1,015,073 1,064,743 1,035,135 1,087,466 1,397,593 Library acquisitions for collection 41,134 34,106 35,649 24,822 34,508 34,813 28,827 40,166 45,145 48,046 Number of clients served in youth and family services programs 1,631 1,339 1,344 2,172 2,173 2,536 942 1,101 1,010 970 Number of clients served through homelessness prevention programs 3,454 4,307 5,494 4,843 5,142 5,492 4,882 5,019 6,094 6,675 Number of clients visits to food pantry programs 7,308 17,366 19,954 20,000 23,642 27,554 25,273 24,984 30,964 30,667 Total number of golf rounds annually 56,565 45,940 31,560 38,590 41,400 41,178 41,809 42,569 40,266 40,953
Water:Number of accounts transitioned to AMR system N/A N/A N/A 6,750 7,900 425 N/A — — — Total water quality tests performed 47,422 66,170 67,729 56,718 60,313 63,039 61,267 62,925 63,702 62,078 Water treatment plant tests performed 41,878 59,073 60,633 49,564 52,513 54,760 53,378 55,199 54,789 53,343 Install, clean and line, and/or replace water mains; (linear feet) 49,000 4,790 3,770 5,180 1,380 5,650 1,890 1,850 3,045 4,611 Elimination of parallel old 6" cast iron pipe (linear feet) N/A N/A 1,500 5,200 4,410 2,950 1,940 4,450 3,220 5,298
Education:Total enrollment 7,296 7,111 6,756 6,450 6,001 5,797 5,861 5,950 6,137 6,202
See accompanying independent auditors’ report.
95

CITY OF CAMBRIDGE, MASSACHUSETTS
Capital Asset Statistics by Function/Program
Last Ten Fiscal Years
Fiscal yearFunction/program 2002 2003 2004 2005 2006 2007 2008 2009 2010 2011
Fire:Fire stations 8 8 8 8 8 8 8 8 8 8 Emergency vehicles 21 21 21 21 21 25 26 26 27 28 Maintenance facility 1 1 1 1 1 1 1 1 1 1
Police:Stations 1 1 1 1 1 1 1 1 1 1 Patrol units 80 79 79 79 79 84 80 80 79 79
Traffic:Garages 2 2 2 2 2 2 2 2 2 2
Public works:Collection trucks 18 18 18 18 18 15 15 15 15 15 Streets (miles) 125 125 125 125 125 125 125 125 125 125
Electric:Streetlights 6,978 7,017 7,193 7,017 7,264 7,285 7,383 7,604 7,615 7,649 Traffic signals 196 196 196 196 195 189 188 187 187 185
Sewer:Sanitary sewers (miles) 145.80 146.50 147.30 148.00 148.70 147.00 147.00 147.00 147.00 150.00 Storm sewers (miles) 85.50 86.12 86.77 97.42 88.07 90.00 92.00 92.00 92.00 94.00
Library:Main library 1 1 1 1 1 1 1 1 1 1 Number of branches 6 6 6 6 6 6 6 6 6 6
Parks and recreation:Acreage 496 496 496 496 496 496 497 497 497 497 Playgrounds 59 59 59 59 59 59 59 59 59 59 Baseball/softball diamonds 23 23 23 23 23 23 23 23 23 23 Soccer/football fields 10 10 10 10 10 10 10 10 10 10 Youth centers 5 5 5 5 5 5 5 5 5 5 Senior centers 2 2 2 2 2 2 2 2 2 2
Water:Water treatment plant 1 1 1 1 1 1 1 1 1 1 Water mains (miles) 190 190 190 190 190 190 190 190 190 185 Fire hydrants 1,750 1,750 1,750 1,750 1,750 1,750 1,750 1,750 1,750 1,800 Storage capacity (thousands of gallons) 3,200 3,200 3,200 3,200 3,200 3,200 3,200 3,200 3,200 3,200 Reservoirs 4,300,000 4,300,000 4,300,000 4,300,000 4,300,000 4,300,000 4,300,000 4,300,000 4,300,000 4,300,000
Education:Elementary schools 15 15 12 12 12 12 12 12 12 12 High school 1 1 1 1 1 1 1 1 1 1
Information for years prior to 2002 is not available.
See accompanying independent auditors’ report.
96

CITY OF CAMBRIDGE, MASSACHUSETTS
Comprehensive Annual Financial Report
Year ended June 30, 2011
Electronic Publishing KPMG LLPPaper 70 pound Finch
Covers and Dividers 80 pound coatedPrinting – Laser Printing/Text KPMG LLP
Printing – Covers and Dividers KPMG LLPComposing KPMG LLP
Cover and Divider Design KPMG LLP
97
