mass spectrometry imaging: looking fruits at molecular level
TRANSCRIPT

International PhD Program in Biomolecular Sciences
XXVI Cycle
“Mass Spectrometry Imaging: Looking Fruits at
Molecular Level”
Tutors
Dr. Pietro Franceschi - Fondazione Edmund Mach
Dr. Fulvio Mattivi - Fondazione Edmund Mach
Prof. Graziano Guella - University of Trento
Ph.D. Thesis of
Yonghui Dong
Fondazione Edmund Mach di San Michele all'Adige
University of Trento
Academic Year 2012-2013


Table of Contents
Abstract ......................................................................................................................................................... 1
Contributions................................................................................................................................................. 3
Acknowledgements ....................................................................................................................................... 1
Chapter 1 ....................................................................................................................................................... 3
Mass Spectrometry Imaging: Principle, Ion Sources and Data Processing .................................................. 3
1.1 Mass spectrometry imaging principle ................................................................................................. 4
1.2. Ionization sources .............................................................................................................................. 4
1.2.1 Secondary Ion Mass Spectrometry (SIMS).................................................................................. 6
1.2.2 Matrix Assisted Laser Desorption Ionization (MALDI) ............................................................... 7
1.2.3 Desorption Electrospray Ionization (DESI) ................................................................................. 7
1.2.4 Laser Ablation Electrospray Ionization (LAESI) ......................................................................... 8
1.3 MSI data processing ............................................................................................................................ 9
1.3.1 Pre-processing ............................................................................................................................ 10
1.3.2 Statistical analysis ...................................................................................................................... 13
1.4 Conclusion ........................................................................................................................................ 15
Chapter 2 ..................................................................................................................................................... 20
Mass Spectrometry Imaging in Plants: Sample Preparation and Application ............................................ 20
2.1 Introduction ....................................................................................................................................... 21
2.2 Sample Preparation ........................................................................................................................... 22
2.2.1 sample storage ........................................................................................................................... 22
2.2.2 Sectioning .................................................................................................................................. 23
2.2.3 Mounting .................................................................................................................................... 24
2.2.4 Ionization aiding treatments ....................................................................................................... 25
2.2.5 Other considerations for plant samples ...................................................................................... 26
2.3 Application of MSI in plants ............................................................................................................. 28
2.3.1 Primary metabolites ................................................................................................................... 32
2.3.2 Secondary metabolites ............................................................................................................... 34
Chapter 3 .................................................................................................................................................... 40
Combining intensity correlation analysis and MALDI imaging to study the distribution of flavonols and
dihydrochalcones in Golden Delicious apples ............................................................................................ 40
3.1 Introduction ....................................................................................................................................... 41

3.2 Material and Methods ....................................................................................................................... 43
3.2.1 Reagents ..................................................................................................................................... 43
3.2.2 Preparation of apple sections ..................................................................................................... 44
3.2.3 MALDI Imaging ........................................................................................................................ 45
3.2.4 Data Analysis ............................................................................................................................. 46
3.3 Results and Discussion ..................................................................................................................... 48
3.3.1 Imaging of test metabolites ........................................................................................................ 48
3.3.2 Imaging of selected polyphenol glycosides ............................................................................... 50
3.4 Conclusions ....................................................................................................................................... 58
Chapter 4 ..................................................................................................................................................... 62
Tissue surface properties jeopardize quantitative detection of metabolites in DESI imaging .................... 62
4.1 Introduction ....................................................................................................................................... 63
4.2 Experimental ..................................................................................................................................... 64
4.2.1 Chemicals and Reagents ............................................................................................................ 64
4.2.2 DESI imaging and profiling ....................................................................................................... 65
4.2.3 Quantification of organic acids .................................................................................................. 66
4.2.4 Data processing and data analysis .............................................................................................. 66
4.3 Results and Discussion ..................................................................................................................... 67
4.3.1 DESI Imaging of Vitis vinifera tissues ...................................................................................... 67
4.3.2 DESI Profiling on PTFE ............................................................................................................ 75
Chapter 5 ..................................................................................................................................................... 81
High production of small organic dicarboxylate dianions by DESI and ESI .............................................. 81
5.1 Introduction ....................................................................................................................................... 82
Experimental section ............................................................................................................................... 83
5.2 Results and Discussion ..................................................................................................................... 84
5.3 Conclusions ....................................................................................................................................... 87
Conclusions and Future Work..................................................................................................................... 89
6.1 Conclusions ....................................................................................................................................... 89
6.2 Future directions ............................................................................................................................... 90
6.2.1 Sample preparation .................................................................................................................... 90
6.2.2 Data analysis .............................................................................................................................. 90
6.2.3 Quantitative imaging .................................................................................................................. 91
6.2.4 High spatial resolution MSI ....................................................................................................... 91

Appendix 1: ................................................................................................................................................. 92
Appendix 2: ................................................................................................................................................. 97
Appendix 3: ............................................................................................................................................... 104

1
Abstract 1
Mass spectrometry imaging (MSI) is a MS-based technique. It provides a way of ascertaining 2
both spatial distribution and relative abundance of a large variety of analytes from various 3
biological sample surfaces. MSI is able to generate distribution maps of multiple analytes 4
simultaneously without any labeling and does not require a prior knowledge of the target 5
analytes, thus it has become an attractive molecular histology tool. MSI has been widely used in 6
medicine and pharmaceutical fields, while its application in plants is recent although information 7
regarding the spatial organization of metabolic processes in plants is of great value for 8
understanding biological questions such as plant development, plant environment interactions, 9
gene function and regulatory processes. 10
The application of MSI to these studies, however, is not straightforward due to the inherent 11
complexity of the technique. In this thesis, the issues of plant sample preparation, surface 12
properties heterogeneity, fast MSI analysis for spatially resolved population studies and data 13
analysis are addressed. More specifically, two MSI approaches, namely matrix assisted laser 14
desorption ionization (MALDI) imaging and desorption electrospray ionization (DESI) imaging, 15
have been evaluated and compared by mapping the localization of a range of secondary and 16
primary metabolites in apple and grapes, respectively. The work based on MALDI has been 17
focused on the optimization of sample preparation for apple tissues to preserve the true 18
quantitative localization of metabolites and on the development of specific data analysis tool to 19
enhance the chemical identification in untargeted MSI (chapter 3). MALDI imaging allows high-20
spatial localization analysis of metabolites, but it is not suitable for applications where rapid and 21
high throughput analysis is required when the absolute quantitative information is not necessary 22
as in the case of screening a large number of lines in genomic or plant breeding programs. DESI 23
imaging, in contrast, is suitable for high throughput applications with the potential of obtaining 24
statistically robust results. However, DESI is still in its infancy and there are several fundamental 25
aspects which have to be investigated before using it as a reliable technique in extensive imaging 26
applications. With this in mind, we investigated how DESI imaging can be used to map the 27
distribution of the major organic acids in different grapevine tissue parts, aiming at statistically 28
comparing their distribution differences among various grapevine tissues and gaining insights 29
into their metabolic pathways in grapevine. Our study demonstrated that this class of molecules 30

2
can be successfully detected in grapevine stem sections, but the surface property differences 31
within the structurally heterogeneous grapevine tissues can strongly affect their semi-quantitative 32
detection in DESI, thereby masking their true distribution. Then we decided to investigate this 33
phenomenon in details, in a series of dedicated imaging studies, and the results have been 34
presented in chapter 4. At the same time, during DESI experiments we have observed the 35
production of the dianions of small dicarboxylates acids. We further studied the mechanism of 36
formation of such species in the ion source proposing the use of doubly charged anions as a 37
possible proxy to visualize the distributions of organic acid salts directly in plant tissues (chapter 38
5). The structural organization of the PhD thesis is as below: 39
Chapter one and Chapter two describe the general MSI principle, compare the most widely 40
used MSI ion sources, and discuss the current status in MSI data pre-processing and statistical 41
methods. Due to the importance of sample preparation in MSI, sample handling for plant 42
samples is independently reviewed in chapter two, with all the essential steps being fully 43
discussed. The first two chapters describe the comprehensive picture regarding to MSI in plants. 44
Chapter three presents high spatial and high mass resolution MALDI imaging of flavonols and 45
dihydrochalcones in apple. Besides its importance in plant research, our results demonstrate that 46
how data analysis as such Intensity Correlation Analysis could benefit untargeted MSI analysis. 47
Chapter four discusses how sample surface property differences in a structurally/biologically 48
heterogeneous sample affect the quantitative mapping of analytes in the DESI imaging of 49
organic acids in grapevine tissue sections. 50
Chapter five discusses the mechanism of formation of dicarboxylate dianions in DESI and ESI 51
Chapter six summarizes the work in the thesis and discusses the future perspectives. 52
53
54

3
Contributions 55
Those who made significant inputs to my research projects and writing of my PhD thesis are 56
listed below: 57
Chapter 1: Dong Y. wrote the draft; Pietro Franceschi revised the manuscript; Fulvio Mattivi 58
and Graziano Guella approved the final manuscript. 59
Chapter 2: Dong Y. wrote the draft; Pietro Franceschi revised and approved the final 60
manuscript. 61
Chapter 3: Dong Y. conducted part of the experiment, wrote the introduction and materials and 62
methods in the manuscript; Franceschi P. conceived and designed the experiment, conducted part 63
of the experiment, performed the data analysis, wrote the results and discussion in the manuscript, 64
and approved the final manuscript; Strupat K. conducted part of the experiment; Vrhovsek U and 65
Mattivi F approved the final manuscript. 66
Chapter 4: Dong Y. conceived and designed the experiment, conducted the experiment, 67
performed data analysis and wrote the draft; Guella G. and Mattivi F. designed the experiment 68
and approved the final manuscript; Franceschi P. conceived and designed the experiment, revised 69
and approved the final manuscript. 70
Chapter 5: Dong Y. conducted the experiment, performed data analysis and wrote the draft; 71
Guella G. designed the experiment, revised and approved the final manuscript; Mattivi F. 72
approved the final manuscript; Franceschi P. conceived and design the experiment, revised and 73
approved the final manuscript.74

1
Acknowledgements 1
This work would not have been possible without the financial support from Fondazione Edmund 2
Mach and University of Trento. 3
First of all, I would like to express my greatest gratitude to my supervisor, Dr. Pietro Franceschi, 4
for all his competent guidance, incredible kindness and immense encouragement through all my 5
PhD study. He has been always available whenever I need his help (even on weekends). 6
Likewise, I would like to thank my tutor Dr. Fulvio Mattivi and my supervisor Prof. Graziano 7
Guella for the meaningful discussions, great ideas and guidance. 8
My visit in Dr. Aleš Svatoš’s group in Max Planck Institute for Chemical Ecology was a 9
wonderful experience for me. I am thankful to Dr. Aleš Svatoš, Dr. Filip Kaftan, Sybille Lorenz, 10
Dr. Natalie Wielsch, Amol Fatangare, Mayuri Napagoda, Dr. Marco Kai, Dr. Jerrit Weißflog, 11
Yvonne Hupfer, Tan Wenhua and Jingjing Fang for their help and friendships. I have greatly 12
benefited from the interactions from all of them. 13
I am so lucky to be a part in biostatistics group, a friendly, collaborative and supportive research 14
group. I would like to thank my group leader Dr. Ron Wehrens for all his kind suggestions and 15
knowledge I have learned during group meetings. I would like to thank all my group members 16
Dr. Matthias Scholz, Dr. Marco Giordan, Nir Shahaf, Nikola Dordevi, Nay Min Min Thaw Saw 17
and Mridula Prasad for your suggestions, time and friendships. 18
I would like to acknowledge all my lab members for their valuable suggestions and technical 19
contributions. Dr. Fulvio Mattivi’s Food Quality research group: Dr. Arapitsas Panagiotis, Dr. 20
Weingart Georg, Dr. Mary Ulaszewska, Dr. Kajetan Trost, Ghaste Manoj Shahaji, Narduzzi 21
Luca, Perenzoni Daniele and Angeli Andrea; Dr. Vrhovsek Urska’s Metabolomics research 22
group: Masuero Domenico, Carlin Silvia, Gasperotti Mattia, Dr. Vinay Vishwanath, Dr. Della 23
Corte Anna and Lotti Cesare; Dr. Martens Stefan’s Biotechnology of Natural Products research 24
group: Dr. Feller Antje Christin, Dr. Elisabete Carvalho and Lorena Herrera; Prof. Graziano 25
Guella’s Bioorganic Chemistry research group: Dr.Andrea Anesi and Yu Yang; Dr. Claudio 26
Varotto’s Ecogenomics research group: Dr. Li Minai, Wang bo, Qu Dong and Fu Yuan. 27

2
I sincerely thank my sister and brother-in-law for their support that ease the hardship of being 28
away from home for long. I would like to convey my deepest gratitude to my parents for their 29
encouragement and support throughout my life. For that, I dedicate my thesis to them. 30

3
Chapter 1 1
Mass Spectrometry Imaging: Principle, Ion Sources and 2
Data Processing 3
Notes: 4
Dong Y. wrote the draft; Pietro Franceschi revised the manuscript; Fulvio Mattivi and Graziano 5
Guella approved the final manuscript. 6

4
1.1 Mass spectrometry imaging principle 7
The basic principle of MSI is simple: the instrument collects a series of mass spectra by 8
‘scanning’ an area of a tissue sample according to a predefined x-y coordinate. The distribution 9
images of the analytes over the sample surface are then generated by plotting the intensity of 10
their individual m/z peak in the mass spectra against the x-y coordinate [1]. The core of each 11
MSI experiments is the mass spectrometer, which consists of 3 major parts: ion source, mass 12
analyzer and detector. In ion source, analytes are desorbed and ionized. In the analyzer, they are 13
separated on the basis of their mass to charge ratios (m/z). The separated ions are then detected 14
in the detector. as a final output a mass spectrum is generated by displaying the intensity of the 15
detected ions over a full m/z scale [2] (Fig.1). 16
17
Figure 1. Scheme for mass spectrometry Imaging 18
1.2. Ionization sources 19
A large variety of ionization sources are available for MSI (Table 1), among which secondary 20
ion mass spectrometry (SIMS), matrix assisted laser desorption ionization (MALDI) and 21
desorption electrospray ionization (DESI) are the most popular [2-4]. In addition, laser ablation 22
electrospray ionization (LAESI) starts to gain popularity in MSI field. Each of them has their 23
own merits and a brief introduction of the four ionization sources is described below. 24

5
Table 1 Common MSI ion sources 25
Ion source Matrix & Probe beam Pressure regime Spatial resolution Reference
UV-MALDI
MALDI matrix;
UV-laser
Vacuum or Ambient 50-100 µm [5, 6]
LDI*
None (only for UV-
absorbing metabolites);
UV-laser
Vacuum or Ambient ~10 µm by over-sampling [7]
GALDI*
Colloidal graphite;
UV-laser
Vacuum or Ambient 50-100 µm [8-10]
IR-MALDI
Native water of the
sample;
Infrared (IR)-laser
Vacuum or Ambient ~200 µm [11-13]
DESI
None;
High speed gas flow jet
Ambient
~200 µm
(can be improved to ~35
µm by optimization of
several operational
parameters)
[14-16]
SIMS
None;
Ion beam
Vacuum 0.1-1 µm [17-19]
LAESI
Native water of the
sample;
Sample desorbed by mid
infrared (mid-IR) laser
Ambient
100-300 µm
(can be improved to
single cell level by
focusing the laser pulse)
[20-23]
* LDI : laser desorption ionization; GALDI: graphite assisted laser desorption ionization; 26
They are considered as variations of conventional UV-MALDI. 27

6
28
Figure 2. . Simplified mechanistic diagrams for the four most commonly used ionization 29
techniques in mass spectrometry Imaging. Image reproduced by permission from Chemical 30
Communications (Royal Society of Chemistry) of Ref. [24]. It is worth noting that atmospheric 31
pressure MALDI (AP-MALDI) also allows ionization to occur at ambient condition. 32
1.2.1 Secondary Ion Mass Spectrometry (SIMS) 33
In SIMS, a focused high energy primary ion beam (e.g. Ar+, Ga
+, In
+) is used to strike the sample 34
surface. The analyte molecules are released from the surface and ionized upon collision with the 35
primary ions [4]. SIMS is advantageous in its high spatial resolution (~100 nm), enabling MS 36
imaging at subcellular scale. Furthermore, the high energy used in SIMS (typically 5-40 KeV) 37
can sputter individual atoms from the sample surface for elemental analysis [3]. On the other 38
hand, because the elemental distributions cannot be used to address the most relevant biological 39
questions, and the high energy usually causes extensive secondary ion fragmentation (limiting 40
the practical mass range to ~ m/z 1000), SIMS is not widely used for biological applications 41
regardless of its long history [25]. Recently, several strategies aiming at extending the potential 42
of SIMS and to increase the ionization efficiency of large intact biomolecule have been proposed. 43
Among is worth mentioning primary ion beam modifications (i.e. using C60+) and sample surface 44
treatment (i.e. coating the sample surface with common MALDI matrices and metallization of 45
samples with silver and gold). Both methods modify the way that the energy of the primary ions 46

7
is dissipated in the surface so as to increase the survival yield and ionization efficiency of intact 47
biomolecular species [25]. 48
1.2.2 Matrix Assisted Laser Desorption Ionization (MALDI) 49
MALDI can be used for the non-destructive vaporization and ionization of both small and large 50
molecules [26]. In MALDI analysis the deposition of a matrix (usually a UV absorbing weak 51
organic acid) on the sample surface serves several functions: 1). extraction of analytes from the 52
sample surface, 2). co-crystallization of analytes and matrix, and 3). ionization of analytes by 53
absorption of laser energy [27]. The spatial resolution of MALDI imaging is relatively low 54
compared with the one of SIMS (most MALDI imaging is done at 50-100 µm). Several factors 55
are responsible for that but the laser spot size, the matrix crystal size and matrix coverage are 56
worth to be mentioned [28-30]. Oversampling has been used to achieve higher spatial resolution 57
(~ 10 µm), in these applications the laser beam is fired at a fixed position until no more ions are 58
detected, then the laser is moved by a distance smaller than its diameter to a second position; at 59
the second position, ions are only produced from the area which has not yet been exposed to 60
laser irradiation; therefore the effective area is reduced [31]. This higher spatial resolution, 61
however, is obtained at the cost of a slower analysis and of an extensive use of the laser source 62
which can reduce its lifetime. 63
Due to the high background noise resulting from common MALDI matrices, UV-MALDI is 64
limited in its ability of imaging the distribution of small metabolites (m/z<500). To minimize the 65
high background noises in the low mass region matrix free MALDI laser desorption ionization 66
(LDI) approach has been proposed [7]. As an alternative for non UV-absorbing analytes, new 67
matrices such as colloidal graphite (Graphite assisted laser desorption and ionization, GALDI) [8, 68
9] and 1,8-bis(dimethylamino) naphthalene (DMAN) [32] have also been developed. Infrared 69
(IR) MALDI uses the water in the sample as matrix, therefore avoiding limitations associated to 70
the use of external matrices. The major drawback of this techniques is that the sample may dry 71
out during IR irritation, and additionally, different locations may give different sensitivities due 72
to inhomogeneous water content [9]. 73
1.2.3 Desorption Electrospray Ionization (DESI) 74

8
DESI combines features of ESI with desorption ionization methods. It is mostly used to analyse a 75
large variety of polar compounds such as peptides and proteins, but it can also be used to ionize 76
molecules that are generally not ionized by electrospray, e.g. nonpolar compounds such as 77
cholesterol, carotene, and TNT [14, 33]. In DESI, sample surface is directed with continuous 78
spray of high-speed electrically charged aqueous mist, the initial wetting of the sample surface 79
allows rapid liquid-extraction of analyte molecules, the subsequent splash of the high-speed 80
droplets with the sample surface produces charged secondary micro-droplets with extracted 81
surface molecules. The charged micro-droplets containing the ions of analyte molecules are then 82
released from the surface and transports into an atmospheric inlet of the mass spectrometer [34]. 83
DESI allows rapid ambient surface sampling without sample pretreatment, albeit its spatial 84
resolution is low (typically 200 µm). It has been shown that the spatial resolution can be 85
improved to ~ 35 µm by optimizing several operational parameters, such as spray tip-to-surface 86
distance, solvent flow rate, and spacing of lane scans [15, 16]. Cooks group originally proposed 87
three DESI ionization mechanisms: droplet pick-up, chemical sputtering (based on charge 88
transfer from gas-phase ion to the analyte on surface) and neutral volatilization/desorption (based 89
on volatilization or desorption of neutral species from the surface into the gas phase) [14]. 90
Droplet pickup is now considered as the most common mechanism [33, 35], and at a practical 91
point of view it sufficiently explains why DESI and normal ESI spectra are similar, often 92
identical [36]. Droplet pickup involves extraction of the analyte into the droplet by impacting of 93
electrosprayed droplets onto the surface, followed by dissolution of the analyte from the surface 94
into the droplets. The droplets are again released from the surface and subsequent evaporation of 95
the solvent and Coulomb fission generates ions by processes analogous to conventional ESI [14, 96
35]. 97
1.2.4 Laser Ablation Electrospray Ionization (LAESI) 98
In LAESI, the sample is kept at atmospheric pressure and a focused mid-IR laser beam 99
(wavelength: 2.940 µm) is used to excite the OH vibrations of native water molecules in the 100
tissue sample. As rapid micro-scale ablation driven by phase explosion sets in, a microscopic 101
volume of the sample in the form of neutral particulates and/or molecules is ejected from the 102
sample (similar as IR-MALDI). The resulting plume is then crossed with charged droplets 103
produced by an electrospray, and a fraction of them is converted into gas-phase ions [21, 37, 38]. 104

9
The intrinsic spatial resolution of LAESI is low (~ 300 µm), but recently, it has been shown that 105
by focusing the laser pulse through an etched optical fiber, the spatial resolution can be improved 106
to single cell level [20, 22]. A unique feature of LAESI imaging is depth profiling which, in 107
combination with lateral imaging, enables three-dimensional molecular imaging, with lateral and 108
depth resolutions of ~100 μm and ~40 μm, respectively [23]. As IR-MALDI, LAESI is only 109
suitable for biological samples with appreciable water content, sample can then dry out during IR 110
irritation and sensitivities may also get affected by inhomogeneous water content in the sample 111
[9]. Despite being in its infancy, this technique is expected to give interesting results in water 112
rich tissues like the ones commonly found in plants. 113
1.3 MSI data processing 114
A large number of powerful, integrated software suites are commercially and freely available for 115
MS image construction and/or statistical analysis (Table 2). The MSI data analysis includes 2 116
steps: preprocessing and statistical analysis. 117
Table 2 Commercial and open source MSI software 118
Software Company/Authors Web
ImageQuest Thermo Scientific http://www.thermoscientific.com/en/home.html
FlexImaging Brucker http://www.bruker.com
HDI Waters http://www.waters.com/waters/home.htm?locale=en_US
SCiLS Lab SciLS http://scils.de/software
MALDIVision Premier Biosoft http://www.premierbiosoft.com
TissueView AB SCIEX http://www.absciex.com
Quantinetix Imabiotech http://www.imabiotech.com
Biomap M. Rausch & M. Stoeckli http://www.maldi-msi.org
Datacube Explorer AMOLF www.imzml.org

10
MSiReader
NC State University, W.M.
Keck FT-ICR Mass
Spectrometry lab
http://www4.ncsu.edu/~dcmuddim/msireader.html
OpenMSI* Lawrence Berkeley National
Lab
https://openmsi.nersc.gov/openmsi/client/index.html
1.3.1 Pre-processing 119
The purpose of pre-processing of MSI data is to reduce experimental variance and transform the 120
big amount of raw spectral data into a much cleaner, smaller, and statistically manageable set of 121
peaks. The pre-processing of MSI dataset includes baseline correction, peak picking, 122
normalization, and spectra alignment. It is worth noting that data preprocessing is instrument 123
specific, different instrument may require various data pre-processing methods. 124
The baseline is a mass-to-charge dependent offset of mass intensities easily visible in ToF 125
spectra, commonly such that it is highest at low m/z values, and shows an exponential decay 126
towards higher masses [39]. Many algorithms have been developed for baseline correction. The 127
simplest one is to identify the lowest point in the spectrum and set it to 0, and meanwhile the 128
base peak is still kept as 100% intensity. As a consequence, the spectrum is stretched along the 129
y-axis. More advanced methods take into account that baseline varies across the spectrum and try 130
to locally fit some functions (e.g. polynomial and spline) to find regions of signal that consist 131
only of the baseline without peaks of real signal [40-42]. 132
The objective of peak picking is to locate peaks within a spectrum. Its purpose is to reduce the 133
number of m/z values by removing those peaks corresponding to noise or non-specific baseline 134
signals [43]. Various approaches have been used in the mass spectrometry community to identify 135
the peaks, some of them look for signals above a certain noise level (signal to noise ratio SNR), 136
others use more advanced mathematical tools like continuous wavelet transform (CWT), or 137
template based peak detection [44]. Peak picking in MSI can be challenging due to the large 138
amount of spectra (i.e. high spatial resolution MALDI imaging). Computationally inefficient 139
methods such as continuous wavelet transformation or ridge lines are therefore less common in 140
MSI. Peak picking methods should be robust to strong noise, those which create too many false 141

11
positives such as simple local maxima or signal to noise ratio are less favored [45]. To improve 142
speed, peak picking applied to the dataset mean spectrum has been proposed, in this way, the 143
position of the possible peaks is identified on the base of only one spectrum; however this 144
approach is not sensitive as it does not favor high and relevant peaks presented only in a small 145
part of a sample. For example, if a peak is present only in 1% of spectra, then its contribution to 146
the mean spectrum will be reduced by 100 times as compared to a low peak present in all spectra 147
[43, 45]. To overcome this problem, peak picking is performed pixel-wise and a peak is retained 148
if it is found in at least 1% of the spectra [45]. A possible appealing alternative to the pixel-wise 149
approach is to look for m/z-images exhibiting a spatial structure, regardless of its intensity [46]. 150
Normalization is a process employed to minimize intra-spectrum differences in peak intensities 151
which might derive from sample variability, sample preparation, instrument variation and 152
experimental error [47]. This is often performed by dividing the intensity of each mass spectrum 153
by a normalization factor [43, 48]. The most common method used in MSI is total ion count 154
(TIC) normalization, where all the mass spectra are divided by their TIC value. In certain cases, 155
however, TIC normalization may create misleading results and lead to wrong conclusions. This 156
is typical when signals with very high intensity are solely present in localized tissue areas, as the 157
example present in Figure 3, where the dominant insulin signal causes artificial attenuation of 158
m/z 14,104 signal when vector (Fig 3D) and TIC (Fig 3F) are used. Normalization to the median 159
(Fig 3J) or the noise level (Fig 3L) are suggested as more robust methods (although TIC 160
normalization with the manual exclusion achieves best results (Fig 3H), this approach requires 161
manual intervention) [49]. The use spraying of a section with an internal standard is a very 162
robust strategy, which is commonly applied in targeted MSI by using isotopically labeled 163
standards. In such case, the molecule-specific ion suppression and global effects are also 164
affecting the internal standard which can then be used to extract (semi-)quantitative information 165
[48]. 166

12
167
Figure 3. MALDI images of insulin (m/z 5,800) and a ubiquitous signal at m/z 14,014 in the 168
mouse pancreas visualized using several normalization algorithms. The dominant insulin signal 169
causes artificial attenuation of m/z 14,104 signal when vector and TIC normalization methods 170
are used (as indicated by arrows). Image reproduced by permission from Analytical and 171
Bioanalytical Chemistry (Springer) of Ref. [49]. 172

13
Spectra alignment aims at correcting for possible mass shifts occurring from spectrum to 173
spectrum. In practice this is done by finding, for each spectrum, a warping function in order to 174
match or bin peaks with similarly mass into categories to ensure that we are comparing the 175
intensity of the same ions across multiple spectra [42, 50]. In many cases, the warping function is 176
not simple because mass shift varies with m/z in a nonlinear fashion as a result of experimental 177
and instrumental complexity and data variation [42], so it cannot be found by using a single 178
“lock mass” value This limitation can be overcome by using several internal standards covering 179
the whole span of the entire mass range. Anther similar but internal standards free method is to 180
identify a subset of common peaks present in most of the datasets using the criteria that a peak 181
must be found in more than 90% of the spectra, and then use these peaks as basis for spectra 182
alignment). Typically, 10-20 peaks are selected and it is important to ensure that these peaks 183
span the entire mass range [47, 50]. As before, a simple and fast method for peak alignment is to 184
use the dataset mean spectrum [51]. 185
1.3.2 Statistical analysis 186
Statistical analysis can be divided into unsupervised and supervised methods. Unsupervised 187
methods do not rely on a prior knowledge. They can be applied for preliminary data examination, 188
and aim at revealing general data structure [43], while supervised methods are used for 189
biomarker discovery. They require specifying at least 2 groups of spectra, and aims at identifying 190
discriminative m/z values [43, 47]. 191
1.3.2.1 Unsupervised methods 192
In unsupervised methods, MSI dataset is decomposed into a series of components, score images 193
and loadings plots are then created for each component. In the majority of cases, each pixel of 194
the image is projected in the space of the mass spectra and the organization of the point is 195
analyzed by multivariate methods [52]. Various unsupervised approaches have been used for 196
MSI data representation such as Principle Component Analysis (PCA) [53, 54], Independent 197
Component Analysis (ICA) [55], Probabilistic Latent Semantic Analysis (PLSA) [56] and K-198
Means Clustering [57, 58]. A comprehensive comparison of the different methods can be found 199
in [52, 56]. 200

14
(1) Principal Component Analysis: Performs linear orthogonal transformation of the data to 201
maximize variance, resulting in a set of orthogonal principal components that describe the largest 202
variance in the dataset (PC1), the next largest variance (PC2), and so on [52]. 203
(2) Independent Component Analysis: separates a multivariate signal into additive sub-204
components by assuming that the characteristic component spectra are statistically independent 205
with a non-Gaussian distribution [56]. 206
(3) Probabilistic Latent Semantic Analysis: Each single tissue type is characterized by a distinct 207
distribution and each acquired spectrum is regarded as a specific mixture of these structures. It 208
provides physical interpretability and allows identification of the discriminating peaks for a 209
specific tissue type within a spectrum [56]. 210
(4) K-Means Clustering: Assigns each pixel to a predefined number of classes using the squared 211
Euclidean distance between spectra [52]. 212
1.3.2.2 Supervised methods 213
Supervised method in MSI is mainly used to identify profiles or specific bio-molecular ions to 214
discriminate samples from different groups, e.g. a tumor from benign tissue. If information is 215
known about patient outcome or response-to-treatment, the supervised analysis of the tumor 216
specific profiles is then used to search for candidate bio-markers. These candidates are then 217
tested in a larger sample set to test their ability to distinguish samples from different groups. This 218
step usually yields only several candidate bio-markers, which can be then finally validated by 219
using well established assays [48, 59]. To find candidate biomarkers, the pixels belonging to 220
different areas of the tissues (e.g. tumor/benign) are compared, another time in the multivariate 221
space of the m/zs, to find which variables are more important to distinguish one area from the 222
other. Currently the widely used supervised classification methods include Partial Least Squares 223
Discriminant Analysis (PLS-DA) [60, 61], Support Vector Machine (SVM) [62, 63] and 224
Artificial Neural Network (ANN) [64, 65]. The foremost advantage of supervised methods is that 225
the output manipulated by the algorithm is meaningful and can be easily used for discriminative 226
pattern classification, but there are several disadvantages, such as 1) over-training of some 227

15
patterns while other patterns are left untrained or under-trained and 2) training data can be time-228
consuming and costly. 229
(1) Partial Least Squares Discriminant Analysis: Calculates scores and loadings like PCA from 230
the training spectra groups and a discrimination line is created to represent the area of maximum 231
separation between training spectra. The new spectra are then projected onto the training spectra 232
for discrimination [60]. 233
(2) Support Vector Machine: finds a hyper-plane that separates one or more classes. A peak 234
ranking is derived from the hyper-plane. The best number of peaks is determined by a clustering 235
in the subspace taken from the k best peaks, and the (best) solution is stored as the final model. 236
The generated models are then used to classify each spectrum of the sample [66]. 237
(3) Artificial Neural Network (back-propagation): feeds the information forward through the 238
ANN layers, compares with outcome result with the known value, and then propagate the error 239
backwards through the network. During the sequence of forward and backward cycles, the error 240
is minimized by adjusting the weights that are applied to the interconnection between the input 241
and hidden nodes, and hidden and output nodes. The training is terminated when the error 242
reaches an acceptable threshold, The trained model is then used to classify each spectrum [67]. 243
1.4 Conclusion 244
Most current data processing methods (both pre-processing and statistical analysis) follow 245
algorithms designed for metabolomics. Those methods, unfortunately, cannot always be directly 246
applied for MSI. Additionally, considering the large dataset produced in MSI, more time and 247
memory efficient methods are required. These methods should also be instrument (both ion 248
source and mass analyzer) specific. For example, base line correction could be easily done by 249
smoothing for MSI data generated by high resolution Orbitrap, while it is not the case at all for 250
those produced by TOF-MS. Although several ion sources have been widely used in MSI 251
community, the data analysis is still focused on MALDI imaging, thus ion source-specific data 252
processing methods are expected in the near future. 253
References 254

16
1. Goodwin, R.J., S.R. Pennington, and A.R. Pitt, Protein and peptides in pictures: imaging with 255 MALDI mass spectrometry. Proteomics, 2008. 8(18): p. 3785-3800. 256
2. Svatos, A., Mass spectrometric imaging of small molecules. Trends Biotechnol, 2010. 28(8): p. 257 425-434. 258
3. Lee, Y.J., et al., Use of mass spectrometry for imaging metabolites in plants. The Plant Journal, 259 2012. 70(1): p. 81-95. 260
4. Amstalden van Hove, E.R., D.F. Smith, and R.M. Heeren, A concise review of mass spectrometry 261 imaging. J Chromatogr A, 2010. 1217(25): p. 3946-3954. 262
5. Franceschi, P., et al., Combining intensity correlation analysis and MALDI imaging to study the 263 distribution of flavonols and dihydrochalcones in Golden Delicious apples. J Exp Bot, 2012. 63(3): 264 p. 1123-1133. 265
6. Peukert, M., et al., Spatially resolved analysis of small molecules by matrix-assisted laser 266 desorption/ionization mass spectrometric imaging (MALDI-MSI). New Phytol, 2012. 193(3): p. 267 806-815. 268
7. Holscher, D., et al., Matrix-free UV-laser desorption/ionization (LDI) mass spectrometric imaging 269 at the single-cell level: distribution of secondary metabolites of Arabidopsis thaliana and 270 Hypericum species. Plant Journal, 2009. 60(5): p. 907-918. 271
8. Cha, S., et al., Direct profiling and imaging of plant metabolites in intact tissues by using colloidal 272 graphite-assisted laser desorption ionization mass spectrometry. Plant J, 2008. 55(2): p. 348-360. 273
9. Zhang, H., S. Cha, and E.S. Yeung, Colloidal graphite-assisted laser desorption/ionization MS and 274 MS(n) of small molecules. 2. Direct profiling and MS imaging of small metabolites from fruits. 275 Analytical chemistry, 2007. 79(17): p. 6575-6584. 276
10. Cha, S. and E.S. Yeung, Colloidal graphite-assisted laser desorption/ionization mass spectrometry 277 and MSn of small molecules. 1. Imaging of cerebrosides directly from rat brain tissue. Anal Chem, 278 2007. 79(6): p. 2373-2385. 279
11. Shrestha, B., Y. Li, and A. Vertes, Rapid analysis of pharmaceuticals and excreted xenobiotic and 280 endogenous metabolites with atmospheric pressure infrared MALDI mass spectrometry. 281 Metabolomics, 2008. 4(4): p. 297-311. 282
12. Li, Y., B. Shrestha, and A. Vertes, Atmospheric pressure molecular imaging by infrared MALDI 283 mass spectrometry. Anal Chem, 2007. 79(2): p. 523-532. 284
13. Li, Y., B. Shrestha, and A. Vertes, Atmospheric pressure infrared MALDI imaging mass 285 spectrometry for plant metabolomics. Anal Chem, 2008. 80(2): p. 407-420. 286
14. Takats, Z., et al., Mass spectrometry sampling under ambient conditions with desorption 287 electrospray ionization. Science, 2004. 306(5695): p. 471-473. 288
15. Kertesz, V. and G.J. Van Berkel, Improved imaging resolution in desorption electrospray 289 ionization mass spectrometry. Rapid Commun Mass Spectrom, 2008. 22(17): p. 2639-2644. 290
16. Campbell, D.I., et al., Improved spatial resolution in the imaging of biological tissue using 291 desorption electrospray ionization. Anal Bioanal Chem, 2012. 404(2): p. 389-398. 292
17. Metzner, R., et al., Imaging nutrient distributions in plant tissue using time-of-flight secondary 293 ion mass spectrometry and scanning electron microscopy. Plant Physiol, 2008. 147(4): p. 1774-294 1787. 295
18. Smart, K.E., et al., High-resolution elemental localization in vacuolate plant cells by nanoscale 296 secondary ion mass spectrometry. Plant J, 2010. 63(5): p. 870-879. 297
19. Saito, K., et al., Direct mapping of morphological distribution of syringyl and guaiacyl lignin in the 298 xylem of maple by time-of-flight secondary ion mass spectrometry. Plant J, 2012. 69(3): p. 542-299 552. 300
20. Shrestha, B., J.M. Patt, and A. Vertes, In situ cell-by-cell imaging and analysis of small cell 301 populations by mass spectrometry. Anal Chem, 2011. 83(8): p. 2947-2955. 302

17
21. Nemes, P., A.A. Barton, and A. Vertes, Three-dimensional imaging of metabolites in tissues under 303 ambient conditions by laser ablation electrospray ionization mass spectrometry. Anal Chem, 304 2009. 81(16): p. 6668-6675. 305
22. Shrestha, B. and A. Vertes, In situ metabolic profiling of single cells by laser ablation electrospray 306 ionization mass spectrometry. Anal Chem, 2009. 81(20): p. 8265-8271. 307
23. Nemes, P. and A. Vertes, Atmospheric-pressure molecular imaging of biological tissues and 308 biofilms by LAESI mass spectrometry. J Vis Exp, 2010(43). 309
24. Dill, A.L., et al., Perspectives in imaging using mass spectrometry. Chem Commun (Camb), 2011. 310 47(10): p. 2741-2746. 311
25. Heeren, R.M.A., et al., Why don't biologists use SIMS? A critical evaluation of imaging MS. 312 Applied Surface Science, 2006. 252(19): p. 6827-6835. 313
26. Jessome, L., et al., Matrix-assisted laser desorption/ionization mechanism study with 314 dihydroxybenzoic acid isomers as matrices. Rapid Communications in Mass Spectrometry, 2008. 315 22(2): p. 130-134. 316
27. Lewis, J.K., J. Wei, and G. Siuzdak, Matrix‐Assisted Laser Desorption/Ionization Mass 317 Spectrometry in Peptide and Protein Analysis. Encyclopedia of Analytical Chemistry, 2000. 318
28. Boggio, K.J., et al., Recent advances in single-cell MALDI mass spectrometry imaging and 319 potential clinical impact. Expert Rev Proteomics, 2011. 8(5): p. 591-604. 320
29. Anderson, D.M., et al., High-resolution matrix-assisted laser desorption ionization-imaging mass 321 spectrometry of lipids in rodent optic nerve tissue. Mol Vis, 2013. 19: p. 581-592. 322
30. Puolitaival, S.M., et al., Solvent-free matrix dry-coating for MALDI imaging of phospholipids. J Am 323 Soc Mass Spectrom, 2008. 19(6): p. 882-886. 324
31. Snel, M.F. and M. Fuller, High-Spatial Resolution Matrix-Assisted Laser Desorption Ionization 325 Imaging Analysis of Glucosylceramide in Spleen Sections from a Mouse Model of Gaucher 326 Disease. Analytical chemistry, 2010. 82(9): p. 3664-3670. 327
32. Shroff, R., et al., Acid-base-driven matrix-assisted mass spectrometry for targeted metabolomics. 328 Proc Natl Acad Sci U S A, 2009. 106(25): p. 10092-10096. 329
33. Takats, Z., J.M. Wiseman, and R.G. Cooks, Ambient mass spectrometry using desorption 330 electrospray ionization (DESI): instrumentation, mechanisms and applications in forensics, 331 chemistry, and biology. Journal of Mass Spectrometry, 2005. 40(10): p. 1261-1275. 332
34. Ifa, D.R., et al., Desorption electrospray ionization and other ambient ionization methods: current 333 progress and preview. Analyst, 2010. 135(4): p. 669-681. 334
35. Nefliu, M., et al., Internal energy distributions in desorption electrospray ionization (DESI). J Am 335 Soc Mass Spectrom, 2008. 19(3): p. 420-427. 336
36. Kaftan, F., et al., Scanning electron microscopic imaging of surface effects in desorption and 337 nano-desorption electrospray ionization. Journal of Mass Spectrometry, 2011. 46(3): p. 256-261. 338
37. Nemes, P., A.S. Woods, and A. Vertes, Simultaneous Imaging of Small Metabolites and Lipids in 339 Rat Brain Tissues at Atmospheric Pressure by Laser Ablation Electrospray Ionization Mass 340 Spectrometry. Analytical chemistry, 2010. 82(3): p. 982-988. 341
38. Nemes, P. and A. Vertes, Laser ablation electrospray ionization for atmospheric pressure, in vivo, 342 and imaging mass spectrometry. Analytical chemistry, 2007. 79(21): p. 8098-8106. 343
39. Williams, B., et al., An algorithm for baseline correction of MALDI mass spectra, in Proceedings of 344 the 43rd annual Southeast regional conference - Volume 12005, ACM: Kennesaw, Georgia. p. 345 137-142. 346
40. Yu, W.C., et al., Detecting and aligning peaks in mass spectrometry data with applications to 347 MALDI. Computational Biology and Chemistry, 2006. 30(1): p. 27-38. 348
41. Eidhammer, I., et al., Computational methods for mass spectrometry proteomics. 2008: John 349 Wiley & Sons. 350

18
42. Antoniadis, A., J. Bigot, and S. Lambert-Lacroix, Peaks detection and alignment for mass 351 spectrometry data. Journal de la Société Française de Statistique, 2010. 151(1): p. 17-37. 352
43. Alexandrov, T., MALDI imaging mass spectrometry: statistical data analysis and current 353 computational challenges. BMC Bioinformatics, 2012. 13 Suppl 16: p. S11. 354
44. Bauer, C., R. Cramer, and J. Schuchhardt, Evaluation of peak-picking algorithms for protein mass 355 spectrometry. Methods Mol Biol, 2011. 696: p. 341-352. 356
45. Alexandrov, T., et al., Spatial segmentation of imaging mass spectrometry data with edge-357 preserving image denoising and clustering. J Proteome Res, 2010. 9(12): p. 6535-6546. 358
46. Alexandrov, T. and A. Bartels, Testing for presence of known and unknown molecules in imaging 359 mass spectrometry. Bioinformatics, 2013. 29(18): p. 2335-2342. 360
47. Nimesh, S., et al., Current status and future perspectives of mass spectrometry imaging. Int J Mol 361 Sci, 2013. 14(6): p. 11277-11301. 362
48. Jones, E.A., et al., Imaging mass spectrometry statistical analysis. J Proteomics, 2012. 75(16): p. 363 4962-4989. 364
49. Deininger, S.O., et al., Normalization in MALDI-TOF imaging datasets of proteins: practical 365 considerations. Anal Bioanal Chem, 2011. 401(1): p. 167-181. 366
50. Norris, J.L., et al., Processing MALDI Mass Spectra to Improve Mass Spectral Direct Tissue 367 Analysis. International Journal of Mass Spectrometry, 2007. 260(2-3): p. 212-221. 368
51. Alexandrov, T. and J.H. Kobarg, Efficient spatial segmentation of large imaging mass 369 spectrometry datasets with spatially aware clustering. Bioinformatics, 2011. 27(13): p. i230-238. 370
52. Jones, E.A., et al., Multiple statistical analysis techniques corroborate intratumor heterogeneity 371 in imaging mass spectrometry datasets of myxofibrosarcoma. PLoS One, 2011. 6(9): p. e24913. 372
53. Race, A.M., et al., Memory efficient principal component analysis for the dimensionality 373 reduction of large mass spectrometry imaging data sets. Anal Chem, 2013. 85(6): p. 3071-3078. 374
54. Yao, I., et al., In situ proteomics with imaging mass spectrometry and principal component 375 analysis in the Scrapper-knockout mouse brain. Proteomics, 2008. 8(18): p. 3692-3701. 376
55. Siy, P.W., et al., Matrix Factorization Techniques for Analysis of Imaging Mass Spectrometry Data. 377 8th Ieee International Conference on Bioinformatics and Bioengineering, Vols 1 and 2, 2008: p. 378 875-880. 379
56. Hanselmann, M., et al., Concise representation of mass spectrometry images by probabilistic 380 latent semantic analysis. Anal Chem, 2008. 80(24): p. 9649-9658. 381
57. Louie, K.B., et al., Mass spectrometry imaging for in situ kinetic histochemistry. Scientific reports, 382 2013. 3. 383
58. Konicek, A.R., J. Lefman, and C. Szakal, Automated correlation and classification of secondary ion 384 mass spectrometry images using a k-means cluster method. Analyst, 2012. 137(15): p. 3479-385 3487. 386
59. Schwamborn, K., Imaging mass spectrometry in biomarker discovery and validation. J 387 Proteomics, 2012. 75(16): p. 4990-4998. 388
60. Barnes, C.A., et al., Identifying individual cell types in heterogeneous cultures using secondary Ion 389 mass spectrometry imaging with C60 etching and multivariate analysis. Analytical chemistry, 390 2012. 84(2): p. 893-900. 391
61. Ferguson, L.S., et al., Direct detection of peptides and small proteins in fingermarks and 392 determination of sex by MALDI mass spectrometry profiling. Analyst, 2012. 137(20): p. 4686-393 4692. 394
62. Gormanns, P., et al., Segmentation of multi-isotope imaging mass spectrometry data for semi-395 automatic detection of regions of interest. PLoS One, 2012. 7(2): p. e30576. 396
63. Casadonte, R., et al., Imaging mass spectrometry (IMS) to discriminate breast from pancreatic 397 cancer metastasis in FFPE tissues. Proteomics, 2014. 398

19
64. Xiong, X.C., et al., Artificial Neural Networks for Classification and Identification of Data of 399 Biological Tissue Obtained by Mass-Spectrometry Imaging. Chinese Journal of Analytical 400 Chemistry, 2012. 40(1): p. 43-49. 401
65. Rauser, S., et al., Classification of HER2 receptor status in breast cancer tissues by MALDI 402 imaging mass spectrometry. J Proteome Res, 2010. 9(4): p. 1854-1863. 403
66. Schwamborn, K., et al., Identifying prostate carcinoma by MALDI-Imaging. Int J Mol Med, 2007. 404 20(2): p. 155-159. 405
67. Wilkins, C.L. and J.O. Lay, Identification of microorganisms by mass spectrometry. Vol. 169. 2005: 406 John Wiley & Sons. 407
408

20
Chapter 2 1
Mass Spectrometry Imaging in Plants: Sample 2
Preparation and Application 3
Yonghui Dong, Pietro Franceschi 4
Notes: 5
This Chapter has been prepared for submission. Dong Y. wrote the draft; Pietro Franceschi 6
revised and approved the final manuscript. 7

21
2.1 Introduction 8
Sample handling is one of the most crucial steps in MSI. Appropriate sample preparation method 9
ensures high-quality signals, sufficient spatial resolution, and maintains the origin distribution 10
and abundance of the molecules in biological samples [1-3]. Although sample preparation for 11
proteins and peptides has been somewhat standardized [4, 5], it is still a major challenge for 12
metabolites, largely because metabolites can be easily metabolically modified, diffuse from the 13
sample, or be removed during sample preparation [5]. Figure 1 presents an example showing 14
how small variations in sample handling (use ascorbic acid to prevent oxidation) can greatly 15
influence the quantitative mapping of metabolites in MSI by comparing three ion images at two 16
different areas in the same apple section. Enzymatic oxidation is effectively prevented in the area 17
where ascorbic acid solution is sprayed, and quercetin and phloretin are solely detected in the 18
sepal bundle. While in the ascorbic acid-free area, quercetin is found to diffuse out of the sepal 19
bundle and phloretin is completely undetectable. Alongside, a marker of m/z 490.948 is 20
identified in the enzymatic browning area. Everyone agrees on the fact that sample preparation is 21
important to ensure true and accurate mapping of molecules with a reproducible manner, but it is 22
common to think that sample preparation is appropriate if there are not visible alternations in 23
tissue. This is in general true, but cannot be generalized to all cases. Sample preparation method 24
is MSI instrument, sample tissue and target analyte molecules dependent, and therefore should 25
be carefully optimized accordingly. 26
27
Figure 1. Effects of sample preparation on quantitative mapping of flavonols in apple by using 28
MALDI imaging. Apple section was manual sliced using a razor blade. After mounted on a glass 29
slide, the upper part of the section was immediately sprayed with 10 mM/L ascorbic acid to 30
prevent the enzymatic oxidation, while the lower part remained untreated. After vacuum 31
dehydration (~4h), the section was uniformly sprayed coated with 7 g/L CHCA using an 32

22
ImagePrep station and analyzed by MALDI Orbitrap at negative mode. (a) An apple sketch 33
illustrating the origin of apple tissue sample. (b) The optical image of apple section prior to 34
matrix coating, showing difference between ascorbic acid treated (upper) and untreated (lower) 35
parts following vacuum dehydration. (c) Delocalization: quercetin (m/z 300.028) detected in 36
sepal bundle in both upper and lower apple section, but it was diffused from the sepal bundle in 37
lower part. (d) False negative: phloretin (m/z 273.076) only present in the sepal bundle in upper 38
part. (e) False positive: marker (m/z 490.948) only present in the lower part as a result of 39
enzymatic browning. 40
A comprehensive overview of different aspects of MSI sample preparation for mammalian 41
tissues has been recently published [6]. MSI sample preparation for plants, however, is more 42
challenging as plant surfaces are hydrophobic, making ionization more difficult. In addition, 43
plant surface are often covered with cuticles, direct MSI of molecules under the cuticle layer 44
become difficult by using soft ionization methods like MALDI and DESI; therefore it is 45
necessary to efficiently remove the cuticle barriers while preserving the analytes original 46
localization. Furthermore, application of MSI in plants is recent, and there is a necessity to adapt 47
the current sample preparation protocols for plant tissues [1]. This review will thereby focus on 48
MSI sample preparation methods for plants. In particular, the optimal sample preparation 49
strategy for different classes of metabolites in plants will be discussed on the bases of the most 50
recent publications. 51
2.2 Sample Preparation 52
The sample preparation protocol consists of several steps: tissue storage, sectioning, mounting 53
and ionization aiding treatment [6, 7]. The steps vary in methods and sequences depending on 54
MSI instrument, nature of sample tissues and analytes to be imaged. Therefore each step need to 55
be carefully designed and optimized accordingly. 56
2.2.1 sample storage 57
Most MSI in plants are done on freshly prepared samples, MSI on long-term-stored plant 58
samples are seldom reported. When necessary, plant samples can be stored as section slides. In 59
our lab, apple sections are vacuum dried (~50 Torr, 4 h), mounted onto the glass slide, and 60

23
placed into a 50 ml centrafigation tube with several small holes (~ 2mm) drilled on its cap (i.e. 61
corning® 50 mL PP centrifuge tubes, Sigma Aldrich). The tubes are then vacuum sealed in a 62
vacuum bag, and stored at -80 oC. Vacuum sealing prevents the sample from contacting with air 63
and water, while placing the section slide into the tube avoids the deformation of section during 64
vacuum sealing, and avoids direct contact with the bag during storage. When ready for MSI, the 65
sections can be recovered for 2 h under vacuuum (~50 Torr). Our MALDI imaging of flavonoids 66
suggests that there are no significant quantitative detection differences between long-term-stored 67
(9 months) and fresh-prepared apple sections for the target analytes. A possible alternative is to 68
store plant samples as imprints, although the effect of storage on the quantitative detection in 69
MSI still needs to be evaluated (details about Impring are discusses in the following section). 70
When samples are small, they can also be stored as intact tissues, but freezing and thawing are a 71
critical process that has an effect on the tissue architecture. 72
2.2.2 Sectioning 73
Plant cells have rigid cell walls and large intercellular spaces, embedding materials are often 74
used to maintain the tissue morphology and to ensure precise sample sectioning in conventional 75
histology practice. Unfortunately, many of these commonly used embedding mediums are 76
incompatible with MSI, for example, optimum temperature cutting (OTC) compounds can 77
diffuse easily into sample tissues and act as significant ion suppressors (as they have a high 78
ionization efficiency) in MALDI-MSI [8]. Carboxymethyl cellulose (CMC) [9], gelatin [10], ice 79
[11] or their combinations [12] have been successfully employed for embedding mammalian 80
tissues. While for plant tissues in the specific case of rice seed, Zaima and coworkers found that 81
the rice section quality is rather poor when using 2% CMC alone as embedding medium; with 82
the assistance of adhesive film, CMC embedding offers good performance for both sectioning 83
and MALDI imaging of rice metabolites [13, 14] because the presence of adhesive film largely 84
reduces section distortion and dislocation, facilitating the transfer and attachment of sections to 85
slides [15]. 86
Cryosectioning is the most commonly used method to prepare plant sample sections. Frozen 87
samples are prepared by using freezer (mostly -80 o
C), powdered dry ice, liquid nitrogen or 88
liquid nitrogen-chilled isopentane [8]. Liquid nitrogen frozen usually makes plant sections brittle, 89

24
and can result in ice crystal formation, thus rapid plunging of the tissue into the liquid nitrogen is 90
not recommended. Floating tissues in aluminum foil in liquid nitrogen [16, 17] or freezing plant 91
tissues on dry ice-chilled steel plate is more favoured. Besides, plant sample sections can be 92
prepared using microtome sectioning [18] and hand-cutting [19, 20] at room temperature. 93
Sample thickness is another important parameter to consider as it can affect peak numbers and 94
peak intensity in some MSI instruments. For mammalian tissues, section thickness between 5-20 95
µm is recommended for analysis of low molecular weight molecules, and < 5 µm thickness for 96
high molecular weight proteins (m/z>9000) [21]. In contrast, relationship between tissue 97
thickness and spectrum quality is seldom studied in MSI of plant sections. As a general rule it is 98
difficult to cut tiny slices from the water rich tissues commonly found in plants, so tissue 99
thickness of most plant sections in current MSI studies is around 50 µm, which provides a good 100
compromise between optimum MSI performance and practicality, especially when a large 101
number of samples has to be prepared [1]. Thicker sections, however, usually cause poor 102
molecule ionization, which is probably due to electrical non-conductivity (especially in ToF-MS), 103
high impurities in thick tissues [21], tissue distortion and matrix absorption (in MALDI MSI) [1]. 104
In particular, matrix absorption is often observed in spongy tissue sections, and this causes a 105
strong signal loss. This phenomenon has been observed in the pith region of a tobacco root 106
section when the tissue thickness is over 45 µm [1]. 107
2.2.3 Mounting 108
The simplest mounting method is to place the tissue slices directly onto the target plate, however, 109
target plate must be thoroughly cleaned after each measurement [17]. A more common method 110
involves attaching the sample slices onto a glass slide. It is worth noting that indium tin 111
oxide coated (ITO) conductive glass slide is not a must, it is only needed when good electric 112
conductivity is essential, i.e. non-orthogonal TOF-MS. In contrast, since DESI involves landing 113
and releasing of charged particles in the surface, such conductive materials should not be used to 114
avoid neutralization on the surface [22]. 115
Three approaches are commonly used to mount plant sections to the glass slide, the use of double 116
sided tapes, epoxy glue and thaw mounting. Using double sided tape is fast and easy, but it 117
should be careful not to contaminate the sample. Epoxy glue is suitable for delicate samples and 118

25
it does not produce extra mass signals. Thaw mounting is usually used to attach plant samples 119
sectioned which are acquired by cryosectioning. It minimizes the risk of sample contamination, 120
while relocation of water soluble analytes due to water condensation during thaw mounting of 121
frozen sections is a major concern [23]. Thaw mounting also limits the downstream sample 122
processing steps, as the tissue risks being washed off the sample plate by any vigorous solution-123
based treatments (i.e. the washing steps in MSI of proteins for the purpose of removing salts) [4]. 124
To avoid this problem, thaw mounted samples are usually freeze dried on the sample plate to 125
improve the mounting efficiency. 126
2.2.4 Ionization aiding treatments 127
Most widly used matrices in MALDI MSI are α-cyano-4-hydroxycinnamic acid (CHCA) and 128
2,5-dihydroxybenzoic acid (DHB). However, there is a valid concern that imaging of small 129
molecules, especially those with molecule weights in the matrix region, is affected by 130
interference with matrix [24]. For these reasons, alternative metrics are designed to limit these 131
artifacts, such as porphyrins [25], inorganic materials [23, 26, 27], porous silicon [28], and 1,8-132
bis(dimethylamino) naphthalene (DMAN) [29]. 133
Four matrix application methods are generally used: 134
The first is spray based method, including manual spraying (i.e. with an airbrush) and 135
automatic spraying (i.e. using ImagePrep (Brucker) or M-Sprayer™ (HTXImaging)). Manual 136
spray requires high skills as inhomogeneous matrix application and analyte delocalization 137
can easily occur, while with automatic spraying sample surface could be homogeneously 138
covered with matrices easily. 139
The second method is spotting based (matrix is delivered by microspotting to a specific 140
sample surface location), such as using CHIP-1000 chemical printer (Shimadzu) or 141
Portrait®
630 Spotter (Labcyte). The spotting method allows accurate matrix depositition 142
onto tissue sections, which thus ensures a good quantitative MS signal generation in MSI 143
[30]. 144
The thrid method is sublimation, where matrix can be homogeneouly applied to sample 145
surface under reduced pressure and elevated temperature in a fast manner. This method 146
requires no solvent; therefore diffusion of the analyte molecules during matrix 147

26
application is eliminated. Other advantages include high reproducibility, increased matrix 148
purity and formation of fine matrix crystals [31]. 149
The matrix can be dry coated by filtering through a sieve (i.e. 20 µm) directly onto the tissue 150
sections without any solvent. This method is simple, fast and meanwhile it avoids analyte 151
delocalization [32], ], even though it can reduce the extraction of the metabolites from the 152
tissues. 153
In DESI, matrix coating on sample surface is not necessary because analyte molecules are 154
ionized by a high-speed, charged liquid jet stream. In this case, however, the spray solvent 155
composition is the critical element. It should be optimized according to the metabolites under 156
investigation, but also taking into account specific characteristics of the samples like surface 157
wettability [33, 34]. In general, an higher fraction of water is used for long lasting signal, while 158
an higher proportion of methanol is used when higher spatial resolution is required [35] . 159
2.2.5 Other considerations for plant samples 160
2.2.5.1 Fresh sample versus dry sample 161
Fresh plant tissues are ideal for MSI studies since they are chemically unmodified and treatment-162
free, which largely keep the origin and integrity of molecules spatial arrangement and avoid the 163
chemical contamination during sample handling. One obvious problem is that the fresh plant 164
samples may shrink significantly during MSI analysis even when they are firmly attached on the 165
sample plate. This is particularly true when the experiments are performed under vacuum like in 166
the case of UV-MALDI or SIMS. The shrinkage would result in mismatch between MS image 167
and optical image [23], which makes biological interpretation difficult. Alongside, the shrinkage 168
during MSI analysis may bring in large mass shift under ToF-MS analyzer, and molecule 169
identification and reproducibility of MS images are thus limited. Another concern is that the 170
biological processes are still active inside the fresh samples and they may cause degradation 171
and/or chemical modification during MS imaging. In the case of (IR)-MALDI and LAESI, 172
native water in the plant samples are employed as matrix, so the sample tissues should be fresh 173
or at least not totally dried out [36-38]. 174

27
Most plant tissue samples are usually vacuum or freeze dried prior to MSI. Vacuum desiccation 175
is generally applied at room temperature to thin plant organs without sectioning, such as plant 176
leaves and flowers [23, 39-41], or to plant samples sectioned with a microtome or a razor blade, 177
such as apple [20]. Vacuum pressure and drying time should be carefully optimized, according to 178
the nature of sample and analytes of interest. Sample surface regulation after drying is usually 179
necessary to reduce the distortion of plant tissues. It is likely that some volatiles would be 180
removed from plant sections upon vacuum desiccation, while the majority of molecules are 181
expected to be unaffected due to their low vapor pressure [20]. This has been confirmed by 182
comparing MS profiles of target metabolites between fresh and dried Arabidopsis samples before 183
MSI studies [23]. 184
2.2.5.2 Removal of plant cuticle 185
Land plant body, such as leaves and flowers, is usually covered with cuticles (0.1-10 µm thick). 186
Soft ionization techniques such as MALDI and DESI are unable to penetrate through the plant 187
cuticle, causing signal intensity insufficient and instability during MSI of analyte molecules 188
below the cuticle layer. There are several ways to deal with the plant cuticle barrier. Direct 189
methods include physical and chemical treatments. Sample cuticles can be either physically 190
removed or chemically washed off. For example, after peeling off the epidermis, distribution of 191
hydroxynitrile glucosides was successfully mapped in barley leaves [40]; Kaempferol and 192
kaempferol rhamnoside were mostly detected in Arabidopsis leaf area where it was pre-treated 193
with chloroform for 60 s [39]. However those ‘stress methods’ may delocalize and/or wash away 194
the target compounds, and not all plant epidermis can be easily removed physically. 195
Alternatively, an indirect method is the use of blotting or imprinting. Plant tissues are pressed 196
onto porous Teflon [40, 42, 43], porous polytetrafluoroethylene (PTFE) [44] or print paper 197
surfaces [45] by applying a moderate pressure over the plant tissues, thereby transferring the 198
plant molecules onto flat hard surfaces while keeping their spatial distribution. A recent 199
publication demonstrates that the transfer efficiency could be improved with the assistance of 200
solvent extraction and/or heating during imprinting [46]. Imprinting is simple, fast and robust, 201
and MSI results are quite reproducible. However, this method is restricted to relatively ‘juicy’ 202
plant tissues. Spatial resolution is also limited since analytes can be smeared during imprinting 203

28
[5]. The loss of compartmentalization of enzymes during imprinting may also trigger the reaction 204
of the enzymes with their metabolites, causing the degradation or inter-conversion of the 205
metabolites. 206
2.2.5.3 Tissue sample surface effect 207
The multicellular nature of higher plants presents many challenges for mapping the distribution 208
of analyte molecules [5]. It is well known that that sample surface properties affect the ionization 209
processes in MSI, while it is often ignored that the differences of sample surface properties in a 210
structurally/biologically heterogeneous sample can largely affect the quantitative detection of 211
analytes, causing the MS images misrepresenting their true distribution. This phenomenon has 212
been observed in MALDI [1], SIMS [47] and DESI (chapter 4). In MALDI imaging, spraying 213
the surface with large amounts of matrix can to some degree minimize the surface effect 214
differences [5], while it is more difficult for SIMS and DESI imaging. Complementary 215
quantification methods such as LC-MS or GC-MS, novel sample handling methods (see details 216
in chapter 4) are thus suggested to validate the MSI results. 217
2.3 Application of MSI in plants 218
MSI studies in plants are still focused on method development and technological applications 219
and this type of studies has been mainly performed by mapping distribution of readily accessible 220
metabolites [48], only recently has MSI started to be applied to the solution of biologically 221
relevant questions [5], including: 1) plant-environment interaction [49-51], 2) new compound 222
identification [52], and 3) functional genomics [41]. 223
In the following section, we will summarize the recent studies of MSI in plants according to 224
different classes of primary and secondary metabolites. More specifically, the choice of 225
matrix/spray solvent is also a crucial factor contributing to MSI quality, i.e., spatial resolution, 226
peak resolution, sensitivity, intensity, noise. Thereby the use of different matrices/spray solvents 227
to specifically map various classes of molecules will be also discussed. 228
Table 1 A summarize of current MSI of different classes of plant metabolites. 229

29
Chemical
class
MSI Source
(Ion mode)
Matrix or
Spray solvent Sample Analyte Sample preparation Ref.
Carbohydrates
UV-MALDI
(+)
CHCA
(in MeOH:H2O,
1:1, + 0.1% FA)
Wheat stem
(Triticum
aestivum)
oligosaccharides
cryosecting (-20oC,
50 µm) & hand
sectioning
matrix applied with
airbrush
doubly sided tape
mounting
[19]
UV-MALDI
(+)
DHB, CHCA, SA
20mg/ml
(ACN:H2O, 1:1,
+0.1% TFA)
Poplar stem Cellulose
cryosecting (-8oC,
50 µm)
matrix applied with
oscillating capillary
nebulizer
doubly sided tape
mounting
[53]
UV-MALDI
(+)
DHB, 25mg/ml
(in 0.05 mM
aqueous sodium
acetate)
Poplar stem cellulose
hemicellulose
microtome
sectioning (room
temperature, 50 µm)
matrix applied with
Meinhard nebulizer
cryoJane tape
mounting
[18]
IR-MALDI
(+)
Native water in
the samples Strawberry
fructose/glucose
sucrose
hand cutting (room
temperature, 0.2-0.5
mm)
fresh sample
[36]
DESI
(+)
MeOH:H2O,1:1
+1%FA
Datura
stramonium
hexose
sucrose imprinting on
porous Teflon
[42]
Organic acids
GALDI
(-)
Colloidal graphite
(in 2-propanol)
Apple
Strawberry
malic acid
ascorbic acid
citric acid
quinic acid
cryosecting (liquid
nitrogen pre-treated)
colloidal graphite
applied by air spray
doubly sided tape
mounting
[26]
DESI
(-) ACN:H2O,4:1
Grape leaf,
stem
malic acid
tartaric acid
citric acid
hand cutting (room
temperature,
0.3mm) &
imprinting
doubly sided tape
mounting
unpublis
hed

30
Lipids &
Fatty acids
MALDI
(+/-)
DHB, 50mg/ml
(in MeOH:H2O,
7:3)
Black rice
seed
(Oryza sativa
L.)
lysophosphatidylc
holine,
phosphatidylcholi
ne,
Phytic acid
gamma-Oryzanol
ahpha-Tocopherol
cryosecting (-80oC
frozen section &
freeze imbedded
section with 2%
CMC at -80oC, 8
µm )
matrix applied with
airbrush
doubly sided tape
mounting
[13]
MALDI
(+) DHB
Cotton seed
(Gossypium
hirsutum)
phosphatidylcholi
nes,
triacylglycerols,
phospholipids
cryosecting (unfixed
& paraformaldehyde
fixed sections, -
20oC, 30 µm)
matrix applied via
sublimation
[54]
LDI
(+) Colloidal silver
A. thaliana
leaf & flower
epicuticular wax
metaboliyes
vacuum dried (~50
Torr, 30-60 min)
MicroFlow PFA-ST
Nebulizer
doubly sided tape
mounting
[39]
MALDI
(+)
Lithium-DHB,
20mg/ml
(in acetone:
dichloromethane,
9:1)
A. thaliana
leaf
Date palm tree
leaf (Phoenix
sp.)
Wax esters
desiccator dried
samples
matrix applied with
airbrush
[55]
Proteins &
Peptides
MALDI
(?) Sinapinic acid
soybean
cotyledon Proteins
cryosectioning (10-
15 µm)
[2]
MALDI
(?) ? Barley grain Proteins ?
[3]

31
Terpenoids
LDI
(-)
Hypericum
leaf, placenta,
stamen and
stylus
Naphthodianthron
es
cryosecting of
placenta ( 60 µm)
[56]
DESI
(-)
MeOH:H2O, 1:1,
+1% ammonium
Hypericum
perforatum
Hyperforin
Hypericin imprinting on
porous Teflon
[42]
DESI
(-)
100 uM NH4Cl in
MeOH
Bromophycolide
A and B
preserved with 10%
formalin in seawater
and kept moist with
seawater
[50]
Alkaloids
MALDI
(+)
Saturated HCCA
(in methanol) Capsicum fruit Capsaicin
cryosectioning ( -
20oC, 70 µm)
matrix applied with
airbrush
thaw-mounted
[57]
DESI
(-)
MeOH:H2O, 9:1 Myristica
malabarica
seed
Malabaricone C imprinting on
printer paper
[45]
MALDI
(+)
DHB, 30mg/ml
(in MeOH:H2O,
1:1+1%TFA)
Fruiting bodies
of M. metata*
6-
Hydroxymetataca
rboline D
freeze-dried
matrix applied with
ImagePrep
double sided tape
mounting
[52]
Phenolics
GALDI
(-)
Colloidal graphite
(in 2-propanol)
A. thaliana
leaf , flower
and stem
Favonoids
vacuum dried (for
leaf and flower, ~50
Torr, 30 min) &
cryosectioning (for
stem)
[23, 41]
MALDI
(+)
DHB, 50 mg/mL
(in MeOH:H2O,
7:3)
Black rice
seed
(Oryza sativa
L.)
Anthocyanins
cryosectioning
(freeze-embedded
with 2% CMC at -
80oC, 10 µm )
matrix applied with
airbrush
doubly sided tape
mounting
[14]

32
MALDI
(+)
DHB, 50 mg/mL
(in MeOH:H2O,
7:3)
Rabbiteye
blueberry
(Vaccinium
ashei)
Anthocyanins
cryosectioning (50
µm)
matrix applied with
airbrush
thaw-mounted and
air dried
[58]
CHCA: α-Cyano-4-hydroxycinnamic acid; DHB: 2,5-dihydroxybenzoic acid; SA: sinapinic acid; 230 ACN: acetonitrile; FA: formic acid; TFA: Trifluoroacetic acid 231
*M. metata is not classified as plant 232
2.3.1 Primary metabolites 233
2.3.1.1 Carbohydrates 234
Distribution of carbohydrates has been mapped by UV-MALDI imaging in several plant systems 235
[18, 19, 53], in which DHB and CHCA are the common matrices for most types of carbohydrates, 236
and DHB is proved slightly better than CHCA in detecting the small oligosaccharides such as 237
glucose and sucrose [26]. Colloidal graphite is proposed as an alternative matrix for imaging the 238
small oligosaccharides as it largely reduced the matrix interference in small mass region (m/z < 239
500). Besides, IR-MALDI is also used for imaging carbohydrates in different plants, such as 240
strawberry [36] and lily flower [37]. Carbohydrates are mostly detected in MALDI imaging 241
under positive mode. 242
Only one case on DESI imaging of carbohydrates in plants has reported [42], partially because of 243
its low selectivity and sensitivity for carbohydrates. Yet 3-nitrophenylboronic acid and N-244
methyl-4-pyridineboronic have been suggested as effective reagents added in DESI spray solvent 245
for in-situ derivatization of sugars (reactive-DESI), which therefore largely improves both 246
selectivity and sensitivity of intact sugars in complicated biological matrices [59]. 247
2.3.1.2 Lipids and Fatty Acids 248
Localization of various unsaturated lipids have been mapped in rice [13] and cotton seeds by 249
MALDI MSI [54]. In these tissues, they are readily detected as multiple adducted ions (primarily 250
H+, Na
+ and K
+) under positive ion mode by using DHB as matrix. MALDI imaging of saturated 251
hydrocarbons (Hcs) is more challenging as they do not contain any polar groups neither 252
susceptible to protonation nor to which a cation or an anion can be easily attached [60]. 253

33
Monovalent cations of transition metals (e.g. Fe, Mn, Cu), when co-deposited on the MALDI 254
target with Hcs, can give cationized species which can be detected in a mass spectrometer. Due 255
to the high reactivity of transition metals, Hcs are highly fragmented during analysis, and 256
molecule identification is thus limited [60]. The reactivity of silver with Hcs is lower than that of 257
any other transition metals and it usually generates intact silver adduct ions. MALDI imaging of 258
epicuticular wax in Arabidopsis has been successfully reported by using silver colloid as matrix, 259
in which 14 cuticular wax compounds are identified in Arabidopsis wild-type (Ler) and CS8 260
mutant leaves [39]. The pitfall is that silver is present with similar abundance of the two stable 261
isotope. Each molecule produces a group of silver adduct ion peaks including two major ions 262
[monoisotopic mass of the metabolite + 107
Ag or 109
Ag]+, making compound identification and 263
quantification difficult [39, 60]. Another report on MALDI imaging of saturated wax esters in 264
Arabidopsis and date palm leaves by using LiDHB suggests that LiDHB is the most versatile 265
matrix for detection of a majority of neutral lipids and it can potentially replace currently used 266
silver salts [55]. 267
DESI imaging of lipids is the most frequent application of DESI MSI in mammalian tissues, 268
while DESI imaging of lipids in plants has not yet been reported. Since lipids are more readily 269
ionized by DESI, DESI will be a complimentary to MALDI for imaging lipids in plants where 270
high spatial resolution is not required. In mammalian tissues, mixtures of water and methanol 271
acetonitrile, with or without an acidic modifier are the most commonly used spray solvents DESI 272
imaging of lipids [61]. 273
2.3.1.3 Proteins and Peptides 274
Only few MSI of proteins and peptides have been reported in plants ad this is probably due to 275
several concurring reasons. 276
Difficulties in plant protein identification: protein identification relays heavily on the 277
complete protein databases but to date only few plant genomes are fully sequenced [3]; 278
Challenges in sample preparations: sample preparation for proteins is more sophisticated 279
than for other molecules. Several additional washing steps are required to remove the 280
contaminate salts and sugars, to ensure tissue dehydration and fixation, and to prevent 281

34
proteolysis [17]. The wash procedure varies in solvent composition, temperature and 282
duration among different tissues, which needs to be optimized accordingly. 283
Detection limit: Proteins larger than 25KD are not routinely detectable by MALDI MSI, 284
as they are not efficiently stabilized in the matrix solution and are not extractable from 285
the tissue [62]. On-tissue digestion of large proteins enables their detection and 286
identification in MSI while the treatment with proteolytic enzymes will enhance analyte 287
diffusion and thus reduce the spatial resolution [3]. The application of MSI of proteins in 288
plants has, however, been illustrated by two examples. MALDI imaging of proteins in 289
developing barley grain [3] and in soybean cotyledon [2], where tissue-specific and 290
color-specific protein expression patterns have been revealed. A detailed protocol is also 291
attached in the latter example, in which sinapinic acid (SA) is suggested as matrix for 292
MALDI imaging of proteins (>3000 Da), and CHCA and DHB for Peptides (< 3000 Da). 293
2.3.2 Secondary metabolites 294
2.3.2.1 The terpenoids 295
Distribution of terpenoids in Hypericum perforatum have been studied by LDI imaging on fresh 296
tissues [56] and DESI imaging on tissue imprints [42], respectively. Results of those two studies 297
from different MSI ion sources are in complete agreement that hyperforin and adhyperforin are 298
found in translucent glands, and hypericin, pseudohypericin, protopseudohypericin, and 299
protohypericin are exclusively located in dark glands in leaves. In particular, since they are 300
highly UV absorbing compounds, application of a matrix is not necessary thus LDI removes the 301
barriers of matrix for spatial resolution, and a 10 um resolution is achieved under the 10 x 10 um 302
laser focus setting. Understanding the true biological function of a natural product requires direct 303
fine-scale evaluation in the producing organism's tissues [63]. MSI provides a definitive 304
measurement of the physical location of natural products with semi-quantitative information, 305
which would facilitate our understanding in chemically-mediated biological processes. One 306
example is the DESI imaging of a tropical red alga tissue surface, where bromophycolide A and 307
B are found exclusively distributed in association with distinct surface patches at concentrations 308
sufficient to inhibit the detrimental Lindra thalassiae fungus [50]. Notice that all those terpenoids 309
in the above examples are imaged under negative ion mode. 310

35
2.3.2.2 The Alkaloids 311
Alkaloids are often highly present in particular medicinal plant organs, namely ‘medicinal part’ 312
[64]. Knowing their localization is valuable not only to understand their metabolic origins, but 313
also for the optimization of isolation process since the extraction can be focused on compound 314
containing parts. Rapid profiling of alkaloids have been studied in several plants by DESI and 315
MALDI, such as DESI profiling of alkaloids in Conium maculatum, Datura stramonium and 316
Atropa belladonna [65], and MALDI profiling of alkaloids in several medicinal herbs, including 317
Radix Aconiti Lateralis Preparata, Rhizoma Coptidis and Strychnos nux-vomica L. [66]. This 318
type of studies provides potential protocols for the application of MSI of alkaloids in plants. 319
Distribution of alkaloids has been mapped for several purposes. For example, MALDI imaging 320
of capsaicin in capsicum fruits [57] and DESI imaging of malabaricone C. in Myristica 321
malabarica seed [45] to study their metabolic origin; MALDI imaging of fruiting bodies of a 322
mushroom to screen for new metabolites [52]. All the above studies are performed under positive 323
mode in DESI and MALDI, and alkaloids are detected mainly as [M+H]+, and some salt adducts, 324
such as [M+K]+. 325
2.3.2.3 The Phenolics 326
Distribution of phenolics have been mapped in several plants including strawberry [26], apple 327
[20, 26], Arabidopsis [23, 56], rice [14] and blueberry [58] by using MALDI, GALDI and LDI 328
imaging. Flavonols are mainly detected as [M-H]-
at negative mode, while anthocyanins are 329
primarily identified under positive mode as [M]+. Both CHCA and DHB are common matrices in 330
MALDI imaging of phenolics in plants. DESI imaging is recently applied to localize flavonols in 331
gingo leaves under negative mode, and anthocyanins in strawberry under positive mode [46]. 332
MSI also can be utilized to understand the gene expression pattern. One good example is the LDI 333
imaging of flavonoids on the wild-type and mutant (tt7) Arabidopsis flowers. Arabidopsis TT7 334
mutant effectively blocks the production of quercetin and isorhamnetin and their glycoside 335
derivatives, but leads to the accumulation of kaempferol and its glycoside glycosides. By 336
comparing distribution of various flavonoids on the flower of the wild-type and mutant (tt7) 337
Arabidopsis, results strongly suggests that the expression of the TT7 gene is localized on the 338

36
proximal part of the petal while the other genes in the upper stream pathway are evenly 339
expressed throughout the petal [41]. 340
References 341
1. Peukert, M., et al., Spatially resolved analysis of small molecules by matrix-assisted laser 342 desorption/ionization mass spectrometric imaging (MALDI-MSI). New Phytol, 2012. 193(3): p. 343 806-815. 344
2. Grassl, J., N.L. Taylor, and A.H. Millar, Matrix-assisted laser desorption/ionisation mass 345 spectrometry imaging and its development for plant protein imaging. Plant Methods, 2011. 7(1): 346 p. 21. 347
3. Kaspar, S., et al., MALDI-imaging mass spectrometry - An emerging technique in plant biology. 348 Proteomics, 2011. 11(9): p. 1840-1850. 349
4. Goodwin, R.J., S.R. Pennington, and A.R. Pitt, Protein and peptides in pictures: imaging with 350 MALDI mass spectrometry. Proteomics, 2008. 8(18): p. 3785-3800. 351
5. Lee, Y.J., et al., Use of mass spectrometry for imaging metabolites in plants. The Plant Journal, 352 2012. 70(1): p. 81-95. 353
6. Goodwin, R.J., Sample preparation for mass spectrometry imaging: small mistakes can lead to 354 big consequences. J Proteomics, 2012. 75(16): p. 4893-4911. 355
7. Pol, J., et al., Molecular mass spectrometry imaging in biomedical and life science research. 356 Histochem Cell Biol, 2010. 134(5): p. 423-443. 357
8. Zaima, N., et al., Matrix-assisted laser desorption/ionization imaging mass spectrometry. Int J 358 Mol Sci, 2010. 11(12): p. 5040-5055. 359
9. Goto-Inoue, N., et al., Imaging mass spectrometry visualizes ceramides and the pathogenesis of 360 dorfman-chanarin syndrome due to ceramide metabolic abnormality in the skin. PLoS One, 2012. 361 7(11): p. e49519. 362
10. Chen, R.B., et al., Three Dimensional Mapping of Neuropeptides and Lipids in Crustacean Brain 363 by Mass Spectral Imaging. J Am Soc Mass Spectrom, 2009. 20(6): p. 1068-1077. 364
11. Khatib-Shahidi, S., et al., Direct molecular analysis of whole-body animal tissue sections by 365 imaging MALDI mass spectrometry. Anal Chem, 2006. 78(18): p. 6448-6456. 366
12. Nelson, K.A., et al., Optimization of whole-body zebrafish sectioning methods for mass 367 spectrometry imaging. J Biomol Tech, 2013. 24(3): p. 119-127. 368
13. Zaima, N., et al., Application of imaging mass spectrometry for the analysis of Oryza sativa rice. 369 Rapid Commun Mass Spectrom, 2010. 24(18): p. 2723-2729. 370
14. Yoshimura, Y., et al., Different localization patterns of anthocyanin species in the pericarp of 371 black rice revealed by imaging mass spectrometry. PLoS One, 2012. 7(2): p. e31285. 372
15. Kawamoto, T., Use of a new adhesive film for the preparation of multi-purpose fresh-frozen 373 sections from hard tissues, whole-animals, insects and plants. Archives of Histology and Cytology, 374 2003. 66(2): p. 123-143. 375
16. Nimesh, S., et al., Current status and future perspectives of mass spectrometry imaging. Int J Mol 376 Sci, 2013. 14(6): p. 11277-11301. 377
17. Schwartz, S.A., M.L. Reyzer, and R.M. Caprioli, Direct tissue analysis using matrix-assisted laser 378 desorption/ionization mass spectrometry: practical aspects of sample preparation. Journal of 379 Mass Spectrometry, 2003. 38(7): p. 699-708. 380
18. Lunsford, K.A., G.F. Peter, and R.A. Yost, Direct matrix-assisted laser desorption/ionization mass 381 spectrometric imaging of cellulose and hemicellulose in Populus tissue. Anal Chem, 2011. 83(17): 382 p. 6722-6730. 383

37
19. Robinson, S., et al., Localization of water-soluble carbohydrates in wheat stems using imaging 384 matrix-assisted laser desorption ionization mass spectrometry. The New phytologist, 2007. 385 173(2): p. 438-444. 386
20. Franceschi, P., et al., Combining intensity correlation analysis and MALDI imaging to study the 387 distribution of flavonols and dihydrochalcones in Golden Delicious apples. J Exp Bot, 2012. 63(3): 388 p. 1123-1133. 389
21. Sugiura, Y., S. Shimma, and M. Setou, Thin Sectioning Improves the Peak Intensity and Signal-to-390 Noise Ratio in Direct Tissue Mass Spectrometry. Journal of the Mass Spectrometry Society of 391 Japan, 2006. 54(2). 392
22. Takats, Z., J.M. Wiseman, and R.G. Cooks, Ambient mass spectrometry using desorption 393 electrospray ionization (DESI): instrumentation, mechanisms and applications in forensics, 394 chemistry, and biology. Journal of Mass Spectrometry, 2005. 40(10): p. 1261-1275. 395
23. Cha, S., et al., Direct profiling and imaging of plant metabolites in intact tissues by using colloidal 396 graphite-assisted laser desorption ionization mass spectrometry. Plant J, 2008. 55(2): p. 348-360. 397
24. Jun, J.H., et al., High-spatial and high-mass resolution imaging of surface metabolites of 398 Arabidopsis thaliana by laser desorption-ionization mass spectrometry using colloidal silver. Anal 399 Chem, 2010. 82(8): p. 3255-3265. 400
25. Ayorinde, F.O., K. Garvin, and K. Saeed, Determination of the fatty acid composition of 401 saponified vegetable oils using matrix-assisted laser desorption/ionization time-of-flight mass 402 spectrometry. Rapid Communications in Mass Spectrometry, 2000. 14(7): p. 608-615. 403
26. Zhang, H., S. Cha, and E.S. Yeung, Colloidal graphite-assisted laser desorption/ionization MS and 404 MS(n) of small molecules. 2. Direct profiling and MS imaging of small metabolites from fruits. 405 Analytical chemistry, 2007. 79(17): p. 6575-6584. 406
27. Cha, S. and E.S. Yeung, Colloidal graphite-assisted laser desorption/ionization mass spectrometry 407 and MSn of small molecules. 1. Imaging of cerebrosides directly from rat brain tissue. Anal Chem, 408 2007. 79(6): p. 2373-2385. 409
28. Ronci, M., et al., Mass spectrometry imaging on porous silicon: investigating the distribution of 410 bioactives in marine mollusc tissues. Anal Chem, 2012. 84(21): p. 8996-9001. 411
29. Shroff, R., et al., Acid-base-driven matrix-assisted mass spectrometry for targeted metabolomics. 412 Proc Natl Acad Sci U S A, 2009. 106(25): p. 10092-10096. 413
30. Vegvari, A., et al., Essential tactics of tissue preparation and matrix nano-spotting for successful 414 compound imaging mass spectrometry. J Proteomics, 2010. 73(6): p. 1270-1278. 415
31. Hankin, J.A., R.M. Barkley, and R.C. Murphy, Sublimation as a method of matrix application for 416 mass spectrometric imaging. J Am Soc Mass Spectrom, 2007. 18(9): p. 1646-1652. 417
32. Puolitaival, S.M., et al., Solvent-free matrix dry-coating for MALDI imaging of phospholipids. J Am 418 Soc Mass Spectrom, 2008. 19(6): p. 882-886. 419
33. Badu-Tawiah, A., et al., Non-Aqueous Spray Solvents and Solubility Effects in Desorption 420 Electrospray Ionization. J Am Soc Mass Spectrom, 2010. 21(4): p. 572-579. 421
34. Green, F.M., et al., The effect of electrospray solvent composition on desorption electrospray 422 ionisation (DESI) efficiency and spatial resolution. Analyst, 2010. 135(4): p. 731-737. 423
35. Manicke, N.E., et al., Desorption electrospray ionization (DESI) mass spectrometry and tandem 424 mass spectrometry (MS/MS) of phospholipids and sphingolipids: ionization, adduct formation, 425 and fragmentation. J Am Soc Mass Spectrom, 2008. 19(4): p. 531-543. 426
36. Li, Y., B. Shrestha, and A. Vertes, Atmospheric pressure molecular imaging by infrared MALDI 427 mass spectrometry. Anal Chem, 2007. 79(2): p. 523-532. 428
37. Li, Y., B. Shrestha, and A. Vertes, Atmospheric pressure infrared MALDI imaging mass 429 spectrometry for plant metabolomics. Anal Chem, 2008. 80(2): p. 407-420. 430

38
38. Shrestha, B., J.M. Patt, and A. Vertes, In situ cell-by-cell imaging and analysis of small cell 431 populations by mass spectrometry. Anal Chem, 2011. 83(8): p. 2947-2955. 432
39. Cha, S., et al., Direct profiling and imaging of epicuticular waxes on Arabidopsis thaliana by laser 433 desorption/ionization mass spectrometry using silver colloid as a matrix. Anal Chem, 2009. 81(8): 434 p. 2991-3000. 435
40. Li, B., et al., Characterization of barley leaf tissue using direct and indirect desorption 436 electrospray ionization imaging mass spectrometry. Journal of Mass Spectrometry, 2011. 46(12): 437 p. 1241-1246. 438
41. Korte, A.R., et al., Mass spectrometric imaging as a high-spatial resolution tool for functional 439 genomics: Tissue-specific gene expression of TT7 inferred from heterogeneous distribution of 440 metabolites in Arabidopsis flowers. Analytical Methods, 2012. 4(2): p. 474-481. 441
42. Thunig, J., S.H. Hansen, and C. Janfelt, Analysis of secondary plant metabolites by indirect 442 desorption electrospray ionization imaging mass spectrometry. Anal Chem, 2011. 83(9): p. 3256-443 3259. 444
43. Li, B., et al., Visualizing metabolite distribution and enzymatic conversion in plant tissues by 445 desorption electrospray ionization mass spectrometry imaging. Plant J, 2013. 446
44. Muller, T., et al., Direct plant tissue analysis and imprint imaging by desorption electrospray 447 ionization mass spectrometry. Anal Chem, 2011. 83(14): p. 5754-5761. 448
45. Ifa, D.R., et al., Tissue imprint imaging by desorption electrospray ionization mass spectrometry. 449 Analytical Methods, 2011. 3(8): p. 1910-1912. 450
46. Cabral, E.C., et al., Blotting Assisted by Heating and Solvent Extraction for DESI-MS Imaging. J Am 451 Soc Mass Spectrom, 2013. 452
47. Jones, E.A., N.P. Lockyer, and J.C. Vickerman, Mass spectral analysis and imaging of tissue by 453 ToF-SIMS—The role of buckminsterfullerene, C60
+, primary ions. International Journal of Mass 454 Spectrometry, 2007. 260(2): p. 146-157. 455
48. Matros, A. and H.P. Mock, Mass spectrometry based imaging techniques for spatially resolved 456 analysis of molecules. Front Plant Sci, 2013. 4: p. 89. 457
49. Hamm, G., et al., Determination and imaging of metabolites from Vitis vinifera leaves by laser 458
desorption/ionisation time‐of‐flight mass spectrometry. Rapid Communications in Mass 459 Spectrometry, 2010. 24(3): p. 335-342. 460
50. Lane, A.L., et al., Desorption electrospray ionization mass spectrometry reveals surface-mediated 461 antifungal chemical defense of a tropical seaweed. Proc Natl Acad Sci U S A, 2009. 106(18): p. 462 7314-7319. 463
51. Shroff, R., et al., Nonuniform distribution of glucosinolates in Arabidopsis thaliana leaves has 464 important consequences for plant defense. Proc Natl Acad Sci U S A, 2008. 105(16): p. 6196-6201. 465
52. Jaeger, R.J., et al., HR-MALDI-MS Imaging Assisted Screening of beta-Carboline Alkaloids 466 Discovered from Mycena metata. J Nat Prod, 2013. 467
53. Jung, S., et al., Direct analysis of cellulose in poplar stem by matrix-assisted laser 468 desorption/ionization imaging mass spectrometry. Rapid Commun Mass Spectrom, 2010. 24(22): 469 p. 3230-3236. 470
54. Horn, P.J., et al., Spatial Mapping of Lipids at Cellular Resolution in Embryos of Cotton. Plant Cell, 471 2012. 24(2): p. 622-636. 472
55. Vrkoslav, V., et al., MALDI imaging of neutral cuticular lipids in insects and plants. J Am Soc Mass 473 Spectrom, 2010. 21(2): p. 220-231. 474
56. Holscher, D., et al., Matrix-free UV-laser desorption/ionization (LDI) mass spectrometric imaging 475 at the single-cell level: distribution of secondary metabolites of Arabidopsis thaliana and 476 Hypericum species. Plant Journal, 2009. 60(5): p. 907-918. 477

39
57. Shu Taira* , Shuichi Shimma 2 , Issey Osaka 3 , Daisaku Kaneko 1 , Yuko Ichiyanagi 4,5 , Ryuzo 478 Ikeda 1 , Yasuko Konishi-Kawamura 6 , Shu Zhu 7 , Koichi Tsuneyama 8 and Katsuko Komatsu 7, 479 Mass Spectrometry Imaging of the Capsaicin Localization in the Capsicum Fruits 2012. 480
58. Yoshimura, Y., et al., Visualization of anthocyanin species in rabbiteye blueberry Vaccinium ashei 481 by matrix-assisted laser desorption/ionization imaging mass spectrometry. Anal Bioanal Chem, 482 2012. 403(7): p. 1885-1895. 483
59. Zhang, Y. and H. Chen, Detection of saccharides by reactive desorption electrospray ionization 484 (DESI) using modified phenylboronic acids. International Journal of Mass Spectrometry, 2010. 485 289(2-3): p. 98-107. 486
60. Cvacka, J. and A. Svatos, Matrix-assisted laser desorption/ionization analysis of lipids and high 487 molecular weight hydrocarbons with lithium 2,5-dihydroxybenzoate matrix. Rapid Commun 488 Mass Spectrom, 2003. 17(19): p. 2203-2207. 489
61. Eberlin, L.S., et al., Desorption electrospray ionization mass spectrometry for lipid 490 characterization and biological tissue imaging. Biochim Biophys Acta, 2011. 1811(11): p. 946-491 960. 492
62. Franck, J., et al., MALDI mass spectrometry imaging of proteins exceeding 30,000 daltons. Med 493 Sci Monit, 2010. 16(9): p. BR293-299. 494
63. Esquenazi, E., P.C. Dorrestein, and W.H. Gerwick, Probing marine natural product defenses with 495 DESI-imaging mass spectrometry. Proc Natl Acad Sci U S A, 2009. 106(18): p. 7269-7270. 496
64. Shitan, N. and K. Yazaki, Accumulation and membrane transport of plant alkaloids. Curr Pharm 497 Biotechnol, 2007. 8(4): p. 244-252. 498
65. Talaty, N., Z. Takats, and R.G. Cooks, Rapid in situ detection of alkaloids in plant tissue under 499 ambient conditions using desorption electrospray ionization. Analyst, 2005. 130(12): p. 1624-500 1633. 501
66. Lu, L., et al., Rapid Profiling of Alkaloids in Several Medicinal Herbs by Matrix-assisted Laser 502 Desorption/Ionization Mass Spectrometry. Chemical Research in Chinese Universities, 2010. 503 26(1): p. 11-16. 504
505

40
Chapter 3 1
Combining intensity correlation analysis and MALDI 2
imaging to study the distribution of flavonols and 3
dihydrochalcones in Golden Delicious apples 4
Pietro Franceschi1, Yonghui Dong
1, Kerstin Strupat
2, Urska Vrhovsek
1 and Fulvio Mattivi
1 5
6 7 1Fondazione E. Mach–Research and Innovation Centre, Via Edmund Mach 1, 38010 San 8
Michele all’Adige (TN), Italy 9
2Thermo Fisher Scientific (Bremen) GmbH, Hanna-Kunath-Str. 11, D-28199 Bremen, 10
Germany 11
12
Notes: 13
This chapter is adapted from the manuscript entitled ‘Combining intensity correlation analysis 14
and MALDI imaging to study the distribution of flavonols and dihydrochalcones in Golden 15
Delicious apples’, which has been published in Journal of Experimental botany. Dong Y. 16
conducted part of the experiment, wrote the introduction and materials and methods in the 17
manuscript; Franceschi P. conceived and designed the experiment, conducted part of the 18
experiment, performed the data analysis, wrote the results and discussion in the manuscript, 19
and approved the final manuscript; Strupat K. conducted part of the experiment; Vrhovsek U 20
and Mattivi F approved the final manuscript. 21

41
3.1 Introduction 22
Assessment of the spatial and temporal distribution of metabolites in tissues is important for 23
rationalizing many biological processes occurring in plants. Qualitative or semi-quantitative 24
imaging techniques are thus ideal for complementing the expanding field of metabolomics, 25
when studying the tissue specific distribution of metabolic biomarkers. 26
Of the various imaging techniques, mass spectrometry (MS) based technologies would seem 27
to be particularly promising, due to their sensitivity, broad response and speed. Matrix 28
Assisted Laser Desorption Ionization Imaging (MALDI-MSI) [1] in particular has become 29
one of the most important molecular histology methods for understanding the spatial 30
complexity of biological samples, and has been demonstrated to be applicable to different 31
kinds of animal and plant tissues [2]. 32
As far as the imaging of small molecules is concerned, the performance of MALDI is 33
hindered by the presence of ions resulting from matrix ionization at the lower end of the mass 34
spectrum [3]. There are different approaches to dealing with the matrix background produced 35
by MALDI or related techniques, mainly relying on specific laser absorbing media (such as 36
graphite or colloidal silver) [4-7] or on matrix-free approaches [8]. However, due to the 37
robustness and widespread use of conventional MALDI protocols, there is definitive interest 38
in developing tools to use them in metabolic imaging applications. 39
In these MS based technologies the unique chemical identification of the ions is a major 40
challenge, in absence of separative techniques applied to neutral molecules (e.g. Liquid 41
Chromatography). The use of high resolution spectrometers is of great help to reduce the set 42
of possible molecular formulas [2], but more detailed structural information has to be obtained 43
from fragmentation experiments [5, 6]. 44
In fragmentation experiments, however, primary ions have to be selected according to their 45
mass-to-charge ratio, so acquisition time, isolation width and progressive matrix depletion 46
represent a limit to the information yield of MS/MS which can be performed on a specific 47
tissue section. Of these factors, analysis time is particularly relevant, considering that a 48
MALDI imaging run composed of a full scan spectrum and a few fragmentation experiments 49
can easily last 20 to 30 hours. 50

42
In conclusion, although full scan MALDI would be suitable for untargeted profiling, in 51
practice it is often necessary to make an a priori choice of the molecules of interest, thus 52
reducing the profiling potential of the technique. 53
Due to the dynamics of the MALDI process, however, in-source fragmentation is ubiquitous 54
and fragmentation information is already embedded in a full scan spectrum. The development 55
of tools optimized for its extraction would then represent a key step for the full exploitation of 56
MALDI profiling. To take advantage of such information it is necessary to develop and 57
validate a framework to compare the “localization” of primary and fragment ions. A visual 58
approach, indeed, is not optimal because its results are likely to depend very much on the 59
experimenter and manual inspection cannot be applied over an extensive database of 60
biomarkers as should be required in untargeted experiments. All these considerations, push 61
towards the development of bioinformatic tools to treat MALDI-MSI datasets, but the topic is 62
particularly challenging, considering the size and the complexity of the data files. To date, 63
bioinformatic algorithms have been developed to perform reduction and image segmentation 64
for biomarker discovery [9] and to measure the correlation of different ion images [10]. 65
In this chapter we propose an approach for applying conventional untargeted MALDI 66
profiling and advanced data analysis to perform imaging of metabolites in apple tissues, 67
developing an unique framework taking advantage of the in-source fragmentation information 68
to increase the chemical selectivity of the technique. With the proposed pipeline, co-69
localization between parent and fragment ions is assessed, validated and exploited to 70
reconstruct compound-specific images which can be used for interpretation purposes. 71
In our experiment, MALDI-MSI data were acquired using a high resolution mass 72
spectrometer. An algorithm based on Intensity Correlation Analysis (ICA) was developed to 73
study the co-localization between parent and fragment ions, thus visualizing the distribution 74
of specific metabolites in tissues. 75
To perform our experiment, we set up a simple sample preparation protocol to optimize the 76
sectioning of the apple tissues, while minimizing the negative effects of oxidation of the 77
molecules concerned. 78
The proposed approach was applied to study the distribution of some relevant glycosylated 79
flavonols and dihydrochalcones in apple sections. This latter class of molecules is challenging 80
from the spectrometric point of view. Indeed, polyphenol glycosides easily fragment in nearly 81

43
all ionization sources losing primarily their sugar subunits. Furthermore, they show relevant 82
UV absorption in the wavelength region typical of nitrogen lasers and for this reason, they 83
have been proposed as MALDI matrices [11], and have been analyzed in imaging applications 84
in matrix-free conditions [8]. In this class of molecules, then, ionization and fragmentation 85
happen at the same time in the laser desorption process, making them suitable for the 86
application of the proposed bioinformatic approach. 87
The distribution this particular class of metabolites in plant tissues can be also visualized by 88
optical/UV microscopy, possibly in combination with histological staining [12, 13]. Several 89
families of phenolic compounds like hydroxycinnamic acids, coumarins, stilbenes, and styryl 90
pyrones, for example, are, strongly autofluorescent when irradiated with UV or blue light [13], 91
while non-fluorescent phenolyc compound can be stained with chromogenic reagents, like in 92
the case of proanthocyanidins with dimethylamino-cinnamaldehyde [14] or vanillin-HCl [15]. 93
In terms of spatial resolution, however, these methods show a definitive advantage over MS-94
based approaches. In fact, with optimized sample preparation protocols, it is possible to 95
achieve subcellular resolution [12], still beyond the capabilities of the majority of MS-based 96
imaging platforms. 97
In terms of generality and selectivity, however, MS show some relevant advantages. 98
Metabolites are identified on the bases of their mass spectra, often allowing the reconstruction 99
of molecule-specific pictures. In addition, these techniques can be applied to the analysis of 100
many different classes of metabolites, permitting a more comprehensive profiling of the tissue 101
sections. 102
From a biological point of view, this particular class of molecules is known to have important 103
and diverse key functions in plant growth, development and protection, while antioxidant 104
activity is relevant to food and nutrition [16]. The tissue-specific synthesis of glycosylated 105
polyphenols in apples has already been proposed on the basis of High Performance Liquid 106
Chromatography Diode Array Detection (HPLC-DAD) studies and has been suggested by a 107
Graphite assisted Laser Desorption Ionization study [5]. The availability of this background 108
knowledge is of fundamental importance for the overall validation of the proposed 109
methodology. 110
3.2 Material and Methods 111
3.2.1 Reagents 112

44
α-cyano-4-hydroxycinnamic acid (CHCA) and 2,5-dihydrobenzoic acid (DHB) were 113
purchased from Sigma-Aldrich (Steinheim, Germany), L(+)-ascorbic acid from VWR 114
international (Geldenaaksebaan, Leuven, Belgium), while acetonitrile was of LC-MS 115
Chromasolv grade (Sigma-Aldrich, Steinheim, Germany). 116
3.2.2 Preparation of apple sections 117
Apples (Golden Delicious) were purchased locally. Metabolite localization was tested in three 118
types of sections; their position within the fruit is presented in Figure 1, with a schematic view 119
of the anatomy of the fruit [17, 18]. The central part of a longitudinal section of the fruit was 120
used to investigate the pericarp (20 mm x 20 mm), while two other different types of cross 121
sections were selected to study the transition region between the skin and the hypanthium 122
(aroud 6.6 x 6.6 mm). In relation to the skin, sectioning was performed orthogonally and 123
obliquely (Figure 1). In this second type of sectioning, cell layers just below the skin were cut 124
with a favourable projection, enhancing the histological resolution of the MSI images. 125
126
45
Figure 1. Graphic representation of the different sections considered in the study. The 127
schematic view of the apple anatomy is reconstructed from Trentham (2008) and Tukey and 128
Young (1942). The pericarp is the fruit wall developed from the ovary; it can be subdivided in 129
endocarp, mesocarp and exocarp. 130
Apple sections for MALDI-MSI were obtained by manual cutting of slices (around 0.5 mm 131
thick) using a razor blade. The sections were mounted on a glass slide and immediately 132
sprayed with ascorbic acid (10 mmolL-1
) to prevent oxidation during handling and 133
dehydration. After vacuum drying (12 h), the sections were regularized using a razor blade. 134
Regularization was necessary due to shrinkage differences within the tissue during drying. 135
Vacuum drying was necessary considering the high water content of the sections; during this 136
stage volatile molecules are likely to be removed from the section, but the same would happen 137
inside the low vacuum MALDI interface. However, the majority of metabolites are not 138
expected to be affected by the same phenomenon due to its low vapour pressure. This 139
observation is also confirmed by the consistency MALD-MSI results of experiments 140
performed in a wide range of drying conditions and MALDI acquisition times. 141
Optical images of apple sections were obtained using a photo scanner (HP Scanjet G4050) at 142
600 dpi. High resolution scans were acquired using the optical scanner embedded in the MS 143
Instrument via the xy stage, holding the MALDI MSI sample and the camera to examine the 144
sample optically. 145
3.2.3 MALDI Imaging 146
MALDI spectra were acquired by using α-cyano-4-hydroxycinnamic acid (CHCA) as the UV-147
absorbing matrix. Standard MALDI conditions were preferred over matrix free solutions for 148
two reasons: a) to avoid an almost complete fragmentation of the UV-absorbing metabolites; 149
b) to increase the profiling efficiency of the acquisition, by increasing the efficency towards 150
non UV-absorbing metabolites. According to the ImagePrep protocols, both CHCA and 2,5-151
dihydrobenzoic acid (DHB) were tested as possible MALDI matrices. The former was 152
selected since its regular crystallization produces higher quality images. Matrix solution (7 153
g/L CHCA in 50 % acetonitrile) was sprayed uniformly over the sections using an ImagePrep 154
station (Bruker Daltonics, Germany) adopting the following program: 22 spray cycles, 75 % 155
sprayer power, 0 % modulation, 1s spray, 2s incubation, and 70s dry time. The matrix 156
deposition program was optimized to minimize the wetting of the samples, because this would 157

46
result in metabolite delocalization and possibly in the reactivation of oxidative degradation. 158
The ImagePrep station performs the entire spraying process under nitrogen flux, which 159
prevents oxidation of the sections during matrix deposition. 160
MALDI-MSI analysis was performed using a MALDI LTQ Orbitrap XL mass spectrometer 161
(Thermo Fisher Scientific (Bremen), GmbH, Germany) with a resolution of 60,000 (at m/z 162
400, FWHM). Positive and negative ion modes were evaluated. The latter was preferred 163
because, in negative mode, the ions resulting from the ionization of the matrix were less in 164
quantity and intensity. 165
FTMS full scans from m/z 120 to m/z 1000 were acquired using the Instrument Control 166
Software (LTQ Tune Plus 2.5.5 SP1) and Xcalibur 2.1. The same software was used to 167
automatically raster the laser beam across the sectioned surface in x and y dimensions. The 168
Automatic Gain Control mode of the spectrometer was used to optimize the number of laser 169
shots for every pixel. Typical values were varying from 10 to 80 laser shots depending on the 170
ion yield. In the case of the skin sections, each spectrum were obtained by averaging two full 171
scan spectra, while only one spectrum was acquired for the pericarp section presented in this 172
chapter. Due to this setting, the acquisition time is different for every pixel, while the scan 173
time for the spectrometer is determined by the resolution at around 0.7 s. 174
The laser step size between adjacent x/y positions was set at 150, 100 and 75 μm. The 175
pericarp section presented in this chapter was analyzed with a step of 150 μm, leading to an 176
image of 125 X 136 pixels (17000 steps). In the case of the skin region the two sections were 177
acquired with a step of 100 and 75 μm resulting in images with 90 x 69 (6210 steps) and 67 x 178
68 (4556) pixels. Total acquisition times for the images were 9 h for the pericarp section and 6 179
and 7 hours for the skin sections, respectively. 180
The Orbitrap was calibrated prior to mass analysis by external calibration using standard 181
peptide mixtures (ProteoMass MALDI calibration kit for LTQ XL and LTQ hybrids, Sigma-182
Aldrich) for the normal mass range. To increase the accuracy of the acquisition, the spectra 183
were internally calibrated at m/z 333.088, the matrix dimer having undergone a loss of CO2 184
([2CHCA - CO2 -H]-]). 185
3.2.4 Data Analysis 186

47
Data files were converted into open-source CDF format using Xcalibur Software. The 187
analysis and visualization pipeline was developed in Python version 2.5 188
(http://www.python.org/). To correct any uneven responses in the sample, the total ion current 189
of each pixel was normalized to one. Extracted ion chromatograms (XICs) were extracted 190
from the full scan data with different levels of tolerance depending on the mass range. Mass 191
selected images were reconstructed from these traces. Plots were produced by using the 192
interactive Ipython shell (http://ipython.scipy.org) with Scipy (http://www.scipy.org/) and 193
Matplot (http://matplotlib.sourceforge.net/) libraries. 194
Intensity Correlation Analysis (ICA) – originally developed to assist the analysis and 195
interpretation of immunohystochemical images [19] – was selected as a strategy to compare 196
the co-distribution of ions in the image. The starting point of ICA is comparison of the 197
intensities of two ions within the same pixel. For each pixel i in the image, the Intensity 198
Correlation Factor (ICi) between two ions at m/z a and b is calculated according to the 199
following relation. 200
201
iiiii IbIbIaIaIC 202
Here ion of m/z ratio a has an intensity Iai at position pixel i and ion of m/z ratio b has an 203
intensity Ibi at pixel i, while iIa and iIb are the averages of the intensities of ions a and b over 204
the whole rastered area. 205
The rationale behind this approach is that ICi is positive for a given pixel i, if both intensities 206
are on the same side of their respective mean values on the image. If the ions at m/z a and m/z 207
b are correlated – as in the case of a fragmentation occurring during ionization – their 208
intensities should vary “in tune” almost in every pixel resulting in a set of positive IC factors. 209
The intensity correlation framework was adapted to the specific characteristics of MS images 210
acquired using a FTMS instrument. First of all, the intensity range of ion signals spanned 211
several orders of magnitude (up to 4 or 5) so logarithmic scaling of the normalized intensities 212
was performed. This type of scaling also had the positive effect of making the distribution of 213
the intensities less skewed. Co-localization is only meaningful when both species are present, 214
so ICA analysis was only performed on pixels where the intensities of m/z a and m/z b were 215
different from zero. 216

48
A strategy to validate the results of ICA analysis was also developed to evaluate the 217
probability of obtaining only by chance a given set of IC factors. If one considers how IC 218
factors are calculated, their distribution for two uncorrelated species should be symmetric 219
around zero. Any asymmetry in the distribution towards positive values is therefore an 220
indication of intensity correlation between the two ion traces, which indicates the presence of 221
significant co-localization. To validate the asymmetry in ICs it is then possible to consider the 222
distance between the medians of the distributions of positive and negative IC values ((med+)-223
(med-)). The significance of this parameter was tested by checking its variability in a series of 224
random permutations of pixel intensities for either m/z a or m/z b. In this way it was possible 225
to probe the intrinsic variability of IC factors distribution, calculating the likelihood of 226
obtaining the actual asymmetry by chance. This validation strategy also had the advantage of 227
being non-parametric, not requiring any a priori hypotheses regarding the distribution of IC 228
factors. 229
If ICA analysis is performed on two ion traces which can be the result of an in-source 230
fragmentation process – such as glycoside and its corresponding aglycone –, the presence of 231
significant intensity correlation confirms the chemical identification of the parent ion. On the 232
other hand, the presence of correlation between ions relative to two different metabolites 233
suggests that the two species could be biologically related, since, on average, they show the 234
same trend in relation to their means. 235
The results of the IC analysis were used to reconstruct maps showing the spatial distribution 236
of highly correlated pixels. These images were then used for interpretation purposes. 237
3.3 Results and Discussion 238
In this section the results of applying the proposed framework to the MALDI MSI of Golden 239
Delicious apple are presented. In the first paragraph, the effectiveness of the sample 240
preparation protocol and high resolution MS analysis is assessed by studying the distribution 241
of some metabolites known to be present in apple. Subsequently, IC analysis will be applied 242
to study the distribution of flavonoid glycosides in apples, focusing on the pericarp and on the 243
skin. 244
3.3.1 Imaging of test metabolites 245

49
The reconstructed images for malic acid (C4H6O5), detected as C4H5O5 ((M-H)- ions at m/z = 246
133.014) are shown in Figure 2(B). 247
248
Figure 2. Spatial distribution of some metabolites known to be present in apples. The color 249
scale goes from blue to red (linear scaled plots). MS images have been acquired with a raster 250
step of 100 µm. (A) Optical Image. (B) Image reconstructed from XIC at m/z 133.014, 251
identified as malic acid. (C) Intensity profile of m/z 575.119 along the dotted line. (D) Image 252
reconstructed from XIC at m/z 575.119, identified as a procyanidin-related ion. 253
Malic acid was detected inside apple hypanthium with an almost constant concentration. 254
Malic acid, as its name suggests, accounts for 90 % of total organic acids in apple 255
(Ackermann et al., 1992). Figure 2(D) shows the same graphic representation for an ion 256
detected at m/z = 575.119. Among the possible molecular formulas for this ion, C30H23O12 can 257
be related to procyanidin B (C30H26O12 detected as (M-H2-H)
-). The observed ion is 258
compatible either with the direct ionization of procyanidin B or with UV induced 259
fragmentation of higher order procyanidins. Procyanidins – polymeric flavonoids made up of 260
catechin/epicatechin units – are known to be abundant in apples, where they can account for a 261
significant fraction of overall phenolic content [2]. The ion image presented in Figure 2(D) is 262
reconstructed from a trace extracted with a 10 ppm window, corresponding to 0.005 mDa. 263

50
Figure 2(C) displays the intensity profile of the signal along a line crossing the skin. The 264
images indicate that the metabolite was more concentrated in the cell layers just below the 265
cuticle and that its concentration decreased inside the fruit. This trend agrees with the 266
relatively high content of procyanidin B2 in Golden Delicious hypanthium reported in a 267
previous HPLC-DAD study [20] where a 1-2 mm thick “peel” fraction was analyzed. The 268
intensity of the 575.119 ion decreased by approximately a factor of five moving from the 269
external hypanthium cells towards the inner hypanthium (Figure 2(C)). This particular 270
localization could explain the much lower content of procyanidin B2 in “pulp” reported by 271
Chinnici et al. [21], since in this experiment a 5 mm thick “peel” fraction was sampled, which 272
was also including the procyanidin/rich cells present below the skin. This example 273
demonstrates the capability of MS-imaging to provide semiquantitative information, 274
complementary to those obtained from the analysis of extracts or homogenates. 275
3.3.2 Imaging of selected polyphenol glycosides 276
The polyphenol glycosides detected in different apple sections are listed in Table 1. The table 277
displays also the molecular formulas and their main ions observed in the spectra. In all tested 278
sections, diglycosides were not detected or were close to the detection limit, so they were not 279
taken into account. 280
Table 1. Polyphenol glycosides considered in our investigation, with their respective 281
aglycones. 6S stands for 6 carbon sugars, excluding rhamnose. Likewise, 5S stands for all the 282
5 carbon sugars. 283
Name Molecular Formula Ion observed Theoretical m/z
Quercetin C15H10O7 [M-2H]-• 300.028
Kaempferol C15H10O6 [M-H]- 285.040
Phloretin C15H14O5 [M-H]- 273.076
quercetin-hexoside [querc-6S] C21H20O12 [M-H]- 463.088
quercetin-rhamnoside [querc-rham] C21H20O11 [M-H]- 447.093
kaempferol-hexoside [kaemp-6S] C21H20O11 [M-H]- 447.093

51
phloretin-hexoside [phlor-6S] C21H24O10 [M-H]- 435.129
quercetin-pentoside [querc-5S] C20H18O11 [M-H]- 433.077
kaempferol-pentoside [kaemp-5S] C20H18O10 [M-H]- 417.082
284
Most of the molecules concerned were detected as [M-H]- ions, while quercetin was mainly 285
detected as [M-2H]-• radical anion. The production of such an anion in the ionization was 286
checked in the MALDI analysis of a standard. The formation of radical anions in the 287
fragmentation of flavonoid glycosides has already been reported [22]. Even though the two 288
experiments cannot be directly compared due to the different ionization interfaces, the ESI 289
experiments suggest that the collision induced fragmentation of the flavonoid glycoside parent 290
ions can produce radical anions. These phenomenons can also occur during the extraction of 291
the ions within the MALDI source. 292
Table 1 shows the expected m/z value for the metabolites of interest. These values have been 293
used to extract the XICs necessary for ICA analysis (10 ppm tolerance). The experimentally 294
measured m/z values for the metabolites identified in each tissue section are presented in the 295
Appendix one (Table S1). The values obtained in the different sections are slightly different 296
as can be expected for acquisitions running over several days; however measured values are 297
always very close to the theoretical ones. 298
As discussed in the introduction the presence of the mass in Table 1 in the spectra is not 299
sufficient to assess the distribution of the corresponding metabolite in the tissue. To increase 300
the chemical selectivity of the analysis it is necessary to run a co-localization analysis 301
between the ions in Table 1 and a characteristic fragment. 302
It has already been pointed out that this class of molecules undergoes fragmentation during 303
ionization so aglycones show generally high intensity profiles, and were therefore selected as 304
characteristic fragments for the running of the ICA analysis. The aglycons of dihydrochalcons 305
(i.e. phloretin) are absent in apple tissues and only traces of those of flavonols are present [23], 306
thus supporting this specific choice. In Table 1 the abbreviation 6S refers to the six carbon 307
sugars, excluding rhamnose, which is not isobaric as it is a deoxy-hexose, while 5S indicates 308
all the pentoses attached to the specific polyphenols. Isomeric forms are indeed difficult to 309
distinguish by mass spectrometry. Full scan information alone cannot help, but MS/MS or 310

52
higher order MS studies possibly could provide structural and linkage information helping to 311
differentiate isoforms. The only phloretin hexoside in apples is the phloretin-2-glucoside 312
(phloridzin), while the main known quercetin-hexosides in Golden Delicious apples are (in 313
decreasing order) quercetin 3-galactoside and quercetin 3-glucoside. The quercetin-pentosides 314
are quercetin 3-arabinoside and quercetin 3-xyloside [23]. Kaempferol is not usually reported 315
in apples. It was recently reported as 3-glucoside [24] or as aglycon. 316
3.3.2.1 Apple pericarp 317
The distribution of masses corresponding to flavonoid hexosides in the apple pericarp is 318
presented in Figure 3. 319
320
Figure 3: Spatial distribution of flavonoid glycosides (Table 1) in apple pericarp. The 321
intensities were calculated as the logarithm of the normalized ion trace. The color scale ranges 322

53
from blue (low) to red (high). MS images have been acquired with a raster step of 150 µm. (A) 323
Optical image. (B) Image reconstructed from XIC at m/z 447.093. This mass can be assigned 324
either to quercetin-rhamnoside or kaempferol-6S. (C) Image reconstructed from XIC at 325
435.129 (phloretin-6S). (D) Image reconstructed from XIC at 463.088 (quercetin-6S). 326
The experimental results indicated that the ion at m/z 447.093 was distributed over the tissue 327
with a maximal intensity on the sepal bundle. The ion at m/z 435.129, was detected at both 328
locations, the sepal bundle and the rims of the endocarp. The yield of the ion at m/z 463.088 329
was low, showing a slight increase towards the sepal bundle. Table1 indicates that the ion at 330
m/z 447.093 can be related to the presence of both quercetin-rhamnoside and kaempferol-6S, 331
while the ions at m/z 435.129 and m/z 463.088 can be assigned to phloretin-6S and quercetin-332
6S, respectively. To discriminate between the two contributions in the ion trace of m/z 333
447.093 and to confirm the chemical origin of the ions, ICA analysis of these ions and the 334
relative aglycones was performed. The results of this analysis for m/z ratios 447.093, 300.028 335
and 285.040 are summarized in Figure 4. The results of ICA analysis are presented in the two 336
plots on the left (A,B): each point in the plot represents a pixel of the image in which two 337
masses were related, m/z 447.093 and m/z 300.028 in the case of (A). IC factors are displayed 338
on the horizontal coordinate, while the mean centered value of the ion intensity is used as 339
vertical coordinate[19]. In this representation, pixels showing positive intensity correlation 340
show up in the right hand plane, with the high intensity pixels occupying the top right 341
quadrant. A significant skew in the distribution of the IC factors towards the right therefore 342
indicates that the two m/z traces are positively intensity-correlated, and this allows to 343
conclude that the two ions are significantly co-localized. This is clearly visible on the first 344
scatter plot (A), in which the high correlation tail is clearly directed towards the top right. 345
Validation was performed with the permutation test discussed in the previous section and the 346
results are summarized in Figure 4(C). The two histograms show the variability of the 347
(med+)-(med-) parameter over 1000 permutations, while the vertical lines indicate the values 348
obtained from the measured values. For both IC analyses, validation indicated that the null 349
hypothesis should be discarded at a 0.001 level of confidence, indicating significant co-350
localization of the two ion traces. 351

54
352
Figure 4. Graphic representation of the ICA for m/z 447.093/300.028 and m/z 353
447.093/285.040. (A,B) Position of each pixel in the IC/intensity plane. The intensity of mass 354
447.093 was mean centered. (C) Validation of the ICA between m/z 447.093/300.028 (gray) 355
and m/z 447.093/285.040 (black). The histograms show the variability of the ((med+)-(med-)) 356
parameter with 1000 permutations of the intensities. Vertical lines indicate the measured 357
values. 358
For interpretative purposes, it is helpful to reconstruct the spatial distribution of the pixels 359
showing positive IC. This image is also included in Figure 5(C,D), where positive IC pixels 360
are displayed with colors ranging from gray to red depending on the IC value. The image 361
shows that, for pixels where m/z 447.093 was present, a part – mainly distributed in the 362
central part of the endocarp – could not be co-localized neither to m/z 300.028 nor to m/z 363
285.040, thus suggesting that, in this region, the signal at m/z 447.093 was likely to come 364
from a neutral molecule not listed in Table 1. Of the other pixels, maximal co-localization – in 365
correspondence of the pixels with the highest IC factors –, was found almost exclusively 366
along the sepal bundle. This was mainly true for m/z 300.028, while correlation with the ion 367
at m/z 285.040 was less strong. Due to the choice of ions – glycoside and aglycones here – the 368
presence of high intensity correlation confirmed the chemical assignment of the ion at m/z 369
447.093, while the spatial distribution of the high IC pixels showed highly localized presence 370
of both metabolites in the tissue. 371

55
372
Figure 5. Results of the ICA on the ion at m/z 447.093. (A) Optical image. MS images have 373
been acquired with a raster step of 150 µm. (B) Mask showing the distribution of the ion at 374
m/z 447.093 not correlated with m/z 300.028 or m/z 285.040. (C,D) Images reconstructed 375
from the pixels showing positive IC factors between m/z 447.093/300.028 (C) and m/z 376
447.093/300.028 (D). Color scale ranges from gray (low) to red (high). 377
The same pipeline was applied to analyze the couple of masses at m/z 435.129 and 273.076, 378
which correspond to phloretin-6S and phloretin, respectively. The results are presented in 379
Appendix one (Figure S1). Here, the distribution of intensity correlation factors peaks 380
noticeably towards the right side of the plot, indicating that the intensities of these two masses 381
were correlated almost everywhere, speaking of an almost perfect co-localization. This result 382
would be expected if the smaller m/z ion is produced in the fragmentation of the larger one, so 383
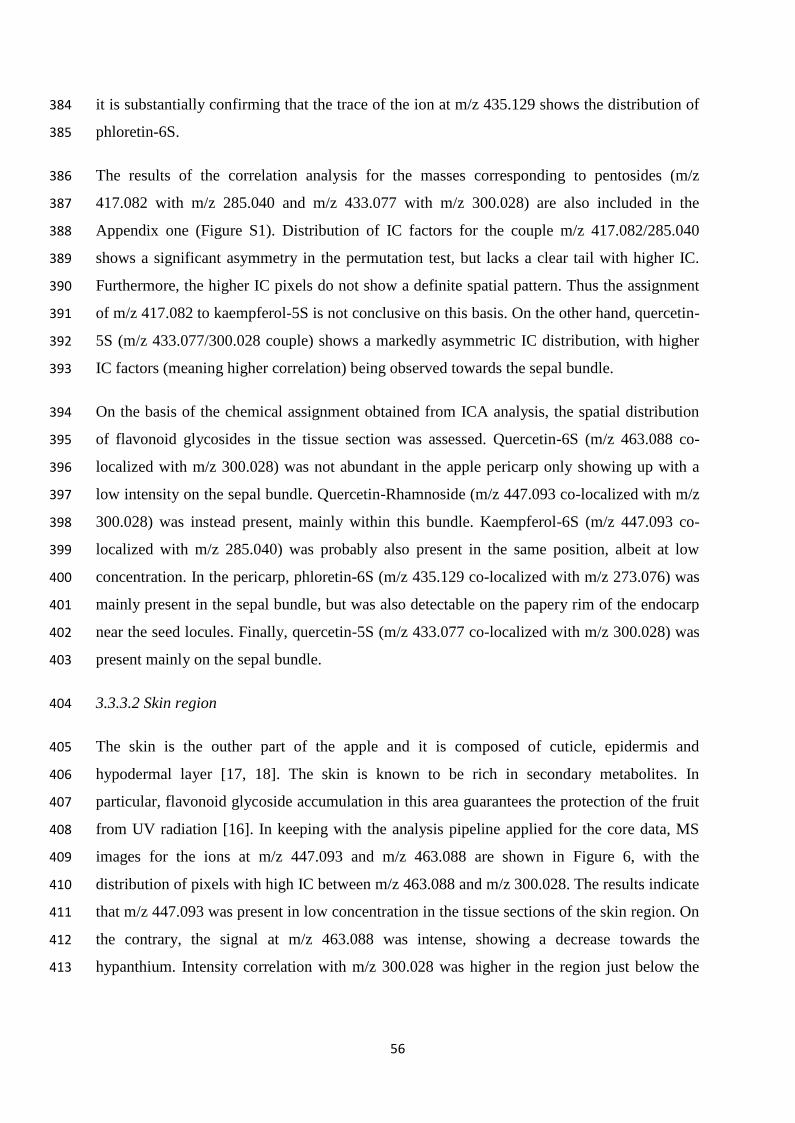
56
it is substantially confirming that the trace of the ion at m/z 435.129 shows the distribution of 384
phloretin-6S. 385
The results of the correlation analysis for the masses corresponding to pentosides (m/z 386
417.082 with m/z 285.040 and m/z 433.077 with m/z 300.028) are also included in the 387
Appendix one (Figure S1). Distribution of IC factors for the couple m/z 417.082/285.040 388
shows a significant asymmetry in the permutation test, but lacks a clear tail with higher IC. 389
Furthermore, the higher IC pixels do not show a definite spatial pattern. Thus the assignment 390
of m/z 417.082 to kaempferol-5S is not conclusive on this basis. On the other hand, quercetin-391
5S (m/z 433.077/300.028 couple) shows a markedly asymmetric IC distribution, with higher 392
IC factors (meaning higher correlation) being observed towards the sepal bundle. 393
On the basis of the chemical assignment obtained from ICA analysis, the spatial distribution 394
of flavonoid glycosides in the tissue section was assessed. Quercetin-6S (m/z 463.088 co-395
localized with m/z 300.028) was not abundant in the apple pericarp only showing up with a 396
low intensity on the sepal bundle. Quercetin-Rhamnoside (m/z 447.093 co-localized with m/z 397
300.028) was instead present, mainly within this bundle. Kaempferol-6S (m/z 447.093 co-398
localized with m/z 285.040) was probably also present in the same position, albeit at low 399
concentration. In the pericarp, phloretin-6S (m/z 435.129 co-localized with m/z 273.076) was 400
mainly present in the sepal bundle, but was also detectable on the papery rim of the endocarp 401
near the seed locules. Finally, quercetin-5S (m/z 433.077 co-localized with m/z 300.028) was 402
present mainly on the sepal bundle. 403
3.3.3.2 Skin region 404
The skin is the outher part of the apple and it is composed of cuticle, epidermis and 405
hypodermal layer [17, 18]. The skin is known to be rich in secondary metabolites. In 406
particular, flavonoid glycoside accumulation in this area guarantees the protection of the fruit 407
from UV radiation [16]. In keeping with the analysis pipeline applied for the core data, MS 408
images for the ions at m/z 447.093 and m/z 463.088 are shown in Figure 6, with the 409
distribution of pixels with high IC between m/z 463.088 and m/z 300.028. The results indicate 410
that m/z 447.093 was present in low concentration in the tissue sections of the skin region. On 411
the contrary, the signal at m/z 463.088 was intense, showing a decrease towards the 412
hypanthium. Intensity correlation with m/z 300.028 was higher in the region just below the 413

57
cuticle, with an increase in correspondence with one of the bundles of the cortical vascular 414
system, visible as a high intensity spot within the apple flesh. 415
416
Figure 6. MS Imaging of the oblique section of the skin region. MS images have been 417
acquired with a raster step of 75 µm. (A) Optical Image. (B,C) Images reconstructed from 418
XIC at m/z 447.093 (assigned to quercetin-rhamnoside) and m/z 463.088 (assigned to 419
quercetin-6S). Logaritmic scaling. The color scale ranges from blue to red. (D) Images 420
reconstructed from the pixels showing positive intensity correlation between m/z 463.088 and 421
m/z 300.028. Color scale from gray (low) to red (high). 422
In this area of the apple, the ion at mass m/z 435.129 was not detected, while the intensity of 423
the ion at m/z 273,076 was low, showing a decreasing profile towards the hypanthium (see 424
Figure S2 in Appendix one). As far as the m/z 433.077/300.028 couple is concerned, ICA 425
analysis identified the co-localization region right below the skin. As before, the situation for 426

58
the pair at m/z 417.082/285.040 was not clear cut and ICA analysis resulted in a relatively 427
symmetric distribution. Pixels showing higher correlation were located in the skin region but, 428
interestingly, they were not found where the intensities of the ions at m/z 417.082 and m/z 429
285.040 were higher. In this specific case the results of ICA analysis were not conclusive for 430
assignment of the ion at m/z 417.082 to kaempferol-5S, in agreement with the fact that its 431
presence in the apple has never been reported to date. 432
The same analysis pipeline was applied to the orthogonal section: results for masses at m/z 433
447.093 and m/z 463.088 are presented in the Appendix one (Figure S3). In this case, MS 434
images show a picture consistent with the one just discussed. The same consideration applies 435
to the ions at m/z 273.076, 417.082 and 433.077 observed by MALDI MSI of the orthogonal 436
section. 437
The experiments performed to characterize the apple skin region indicate that quercetin-6S 438
(m/z 463.088 co-localized with m/z 300.028) was strongly concentrated in the region just 439
below the cuticle. With a rastering step of 75 μm, the width of the high concentration region 440
can be estimated to be around 150 μm. This evidence is supported by previous HPLC analysis 441
which indicated quercetin-galactoside as the main glucoside present in the skin [21]. In 442
contrast to the pericarp, quercetin-rhamnoside was less abundant. In none of the skin sections 443
a clear signature of phloretin-glycosides was detected, though a weak phloretin signal was 444
detectable. Considering that the signals of aglycone fragment ions are more intense than the 445
corresponding glycosides, this observation did not rule out the presence of a low 446
concentration of phloretin-glycosides below the cuticle. This hypothesis is supported by the 447
observation that the phloretin signal, decreased in the hypanthium: in accordance to what was 448
observed for phloridzin in HPLC-DAD measurements [21]. 449
As far as pentosides were concerned, the results of ICA analysis made it possible to conclude 450
that quercetin-5S was present in higher concentrations just below the cuticle, dropping rapidly 451
in the hypanthium. Interestingly, flavonoid glycosides also showed a higher concentration in 452
correspondence of the cortical vascular system. 453
3.4 Conclusions 454
In a biological context, our study supports the idea of tissue-specific biosynthesis of flavonoid 455
glycosides in the apple, in agreement with what has already been proved in Arabidopsis at the 456
genetic expression level [25]. Major differences were found in the distributions of quercetin-457

59
6S – present mainly below the cuticle – and quercetin-rhamnoside and phloretin-6S, detected 458
in the pericarp. 459
In the skin region, glycosides were more concentrated in the cell layers lying just below the 460
cuticle – the thickness of the polyphenol-rich layer was about 150 μm –, while in the pericarp 461
they were located mainly in correspondence with the vascular system. 462
As a general rule, the distribution of glycosides was very much localized. This makes the 463
study of their spatial tissue-specific biosynthesis a challenge using more conventional 464
analytical methods. In particular, great care must be taken in studies involving the analysis of 465
peel and pulp after mechanical separation, in the light of the critical concentration of some 466
important metabolites in tissues close to the cuticle. This specific observation also has 467
important practical implications, in view of the industrial production of foods with an 468
increased content of beneficial compounds. 469
The experimental results discussed so far indicate that the proposed pipeline based on the 470
application of ICA to study co-localization in high resolution MALDI spectra is effective for 471
studying the distribution of polyphenol glycosides in apples. Substantial agreement with 472
previous HPLC studies validated this approach, which showed a higher potential for 473
ascertaining detailed metabolite localization. Intensity Correlation Analysis proved to be of 474
great help in assessing co-localization and extracting and interpreting fragmentation profiles 475
from un-targeted MALDI profiles, by increasing the selectivity of high resolution spectra. 476
477
References 478
1. Caprioli, R.M., T.B. Farmer, and J. Gile, Molecular imaging of biological samples: Localization 479 of peptides and proteins using MALDI-TOF MS. Analytical chemistry, 1997. 69(23): p. 4751-480 4760. 481
2. Vrkoslav, V., et al., MALDI imaging of neutral cuticular lipids in insects and plants. J Am Soc 482 Mass Spectrom, 2010. 21(2): p. 220-231. 483
3. Krutchinsky, A.N. and B.T. Chait, On the nature of the chemical noise in MALDI mass spectra. J 484 Am Soc Mass Spectrom, 2002. 13(2): p. 129-134. 485
4. Jun, J.H., et al., High-spatial and high-mass resolution imaging of surface metabolites of 486 Arabidopsis thaliana by laser desorption-ionization mass spectrometry using colloidal silver. 487 Anal Chem, 2010. 82(8): p. 3255-3265. 488
5. Zhang, H., S. Cha, and E.S. Yeung, Colloidal graphite-assisted laser desorption/ionization MS 489 and MS(n) of small molecules. 2. Direct profiling and MS imaging of small metabolites from 490 fruits. Analytical chemistry, 2007. 79(17): p. 6575-6584. 491

60
6. Cha, S., et al., Direct profiling and imaging of plant metabolites in intact tissues by using 492 colloidal graphite-assisted laser desorption ionization mass spectrometry. Plant J, 2008. 55(2): 493 p. 348-360. 494
7. Cha, S., et al., Direct profiling and imaging of epicuticular waxes on Arabidopsis thaliana by 495 laser desorption/ionization mass spectrometry using silver colloid as a matrix. Anal Chem, 496 2009. 81(8): p. 2991-3000. 497
8. Holscher, D., et al., Matrix-free UV-laser desorption/ionization (LDI) mass spectrometric 498 imaging at the single-cell level: distribution of secondary metabolites of Arabidopsis thaliana 499 and Hypericum species. Plant Journal, 2009. 60(5): p. 907-918. 500
9. McCombie, G., et al., Spatial and spectral correlations in MALDI mass spectrometry images by 501 clustering and multivariate analysis. Analytical chemistry, 2005. 77(19): p. 6118-6124. 502
10. McDonnell, L.A., et al., Mass spectrometry image correlation: Quantifying colocalization. J 503 Proteome Res, 2008. 7(8): p. 3619-3627. 504
11. Petkovic, M., et al., Flavonoids as matrices for MALDI-TOF mass spectrometric analysis of 505 transition metal complexes. International Journal of Mass Spectrometry, 2010. 290(1): p. 39-506 46. 507
12. Abeynayake, S.W., et al., A high-resolution method for the localization of proanthocyanidins 508 in plant tissues. Plant Methods, 2011. 7. 509
13. Hutzler, P., et al., Tissue localization of phenolic compounds in plants by confocal laser 510 scanning microscopy. J Exp Bot, 1998. 49(323): p. 953-965. 511
14. Feucht, W., D. Treutter, and E. Christ, The Precise Localization of Catechins and 512 Proanthocyanidins in Protective Layers around Fungal-Infections. Zeitschrift Fur 513 Pflanzenkrankheiten Und Pflanzenschutz-Journal of Plant Diseases and Protection, 1992. 514 99(4): p. 404-413. 515
15. Liu, Y., et al., Investigation of the Site-Specific Accumulation of Catechins in the Tea Plant 516 (Camellia sinensis (L.) O. Kuntze) via Vanillin− HCl Staining. J Agric Food Chem, 2009. 57(21): p. 517 10371-10376. 518
16. Andersen, O.M. and K.R. Markham, Flavonoids: chemistry, biochemistry and applications. 519 2010: CRC Press. 520
17. Trentham, W.R., C.E. Sams, and W.S. Conway, Histological effects of calcium chloride in 521 stored apples. Journal of the American Society for Horticultural Science, 2008. 133(4): p. 487-522 491. 523
18. Tukey, H. and J.O. Young, Gross morphology and histology of developing fruit of the apple. 524 Botanical Gazette, 1942: p. 3-25. 525
19. Li, Q., et al., A syntaxin 1, Gαo, and N-type calcium channel complex at a presynaptic nerve 526 terminal: analysis by quantitative immunocolocalization. The Journal of neuroscience, 2004. 527 24(16): p. 4070-4081. 528
20. Tsao, R., et al., Polyphenolic profiles in eight apple cultivars using high-performance liquid 529 chromatography (HPLC). J Agric Food Chem, 2003. 51(21): p. 6347-6353. 530
21. Chinnici, F., et al., Radical scavenging activities of peels and pulps from cv. Golden Delicious 531 apples as related to their phenolic composition. J Agric Food Chem, 2004. 52(15): p. 4684-532 4689. 533
22. Hvattum, E. and D. Ekeberg, Study of the collision‐induced radical cleavage of flavonoid 534 glycosides using negative electrospray ionization tandem quadrupole mass spectrometry. 535 Journal of Mass Spectrometry, 2003. 38(1): p. 43-49. 536
23. Vrhovsek, U., et al., Quantitation of polyphenols in different apple varieties. J Agric Food 537 Chem, 2004. 52(21): p. 6532-6538. 538
24. Feliciano, R.P., et al., Characterization of traditional and exotic apple varieties from Portugal. 539 Part 1–Nutritional, phytochemical and sensory evaluation. Journal of Functional Foods, 2010. 540 2(1): p. 35-45. 541

61
25. Pourcel, L., et al., TRANSPARENT TESTA10 encodes a laccase-like enzyme involved in oxidative 542 polymerization of flavonoids in Arabidopsis seed coat. The Plant Cell Online, 2005. 17(11): p. 543 2966-2980. 544
545

62
Chapter 4 1
Tissue surface properties jeopardize quantitative 2
detection of metabolites in DESI imaging 3
Yonghui Dong, Graziano Guella, Fulvio Mattivi, Pietro Franceschi 4
Notes: 5
This chapter has been prepared for submission. Dong Y. conceived and designed the experiment, 6
conducted the experiment, performed data analysis and wrote the draft; Guella G. and Mattivi F. 7
designed the experiment and approved the final manuscript; Franceschi P. conceived and 8
designed the experiment, revised and approved the final manuscript. 9

63
4.1 Introduction 10
Mass spectrometry imaging (MSI) enables direct analyses to be made of both the distribution and 11
abundance of metabolites on the surfaces of a large variety of samples. The most widely used 12
MSI ionization sources for biological applications are secondary ion mass spectrometry (SIMS), 13
matrix-assisted laser desorption ionization (MALDI), and desorption electrospray ionization 14
(DESI) [1, 2]. Although spatial resolution is still low (~ 200 µm), DESI can be performed under 15
ambient conditions with minimal or no sample preparation [3],making it a fast analytical tool 16
for investigating the anisotropic distribution of metabolites in biological matrices with enormous 17
potential in high throughput applications. DESI imaging has gained popularity in mapping drugs 18
and metabolites in animal tissues [4, 5], but has only very recently been applied in plant sciences. 19
Several studies have demonstrated that the chemical properties and texture of the surface can 20
have a strong effect on the desorption process in DESI [6-9], although the impact of these 21
phenomena on imaging applications has not yet been investigated. When imaging heterogeneous 22
tissues, such as those commonly found in plants, differences in surface effects could mask the 23
real distribution of metabolites, potentially undermining the biological significance of DESI 24
measurements. 25
In this chapter we present the results of an extensive study on the impact of surface effects on 26
DESI imaging of small organic acids in tissues of Vitis vinifera. Organic acids are an important 27
class of metabolites playing a fundamental role in plant biology and wine production [10-13]. 28
Previous work on grapevine has shown that there are spatial gradients of organic acids in grape 29
berry [14], suggesting anisotropic distribution of metabolites within and across different 30
grapevine tissues. 31
In the first part of the chapter the results of DESI imaging experiments on several endogenous 32
organic acids in grapevine stem are critically assessed by comparing them with the results of 33

64
spatially resolved ion chromatography (IC) analysis. The effects of sample surface are further 34
investigated by imaging grapevine stem sections enriched in exogenous organic acids. Possible 35
strategies for minimizing surface effects are critically evaluated. 36
The second part of the chapter investigates the effects of surface textures on DESI detection of 37
organic acids by means of a series of MS measurements performed on Teflon (PTFE) surfaces of 38
varying porosities. 39
4.2 Experimental 40
4.2.1 Chemicals and Reagents 41
Acetonitrile (LC-MS grade) was purchased from Sigma-Aldrich (Italy), water was purified using 42
a Milli-Q water purification system (Sartorius Stedim Biotech Gmbh, Germany). Succinic 43
(>99.5%), malic (99%) and tartaric acids (>99.7%) were purchased from Sigma-Aldrich (Italy), 44
adipic (>99.5%) and glutaric (>99.0%) acids from Fluka AG (Germany). Three types of PTFE 45
sheet, flat PTFE, porous PTFE1 (pore size 1-3 μm, porosity 25-30%) and PTFE14 (pore size 7-46
14 μm, porosity 45-50%) were obtained from the Porex Corporation (Germany). One-year-old 47
grapevine stems were obtained (at post-veraison in 2 growing seasons) from Cabernet Sauvignon 48
vines (Vitis vinifera L.) planted in the vineyard of the Fondazione Edmund Mach, San Michele 49
all'Adige, Italy (Coordinates: 46° 11' 42" N, 11° 8' 15" E; Elevation: 250 m). 50
Instrumentation 51
Mass spectra were collected with a Thermo-Fisher Scientific LTQ Orbitrap XL mass 52
spectrometer (Bremen, Germany) equipped with an OmniSprayTM
2D ion source from Prosolia 53
Inc. (Indianapolis, IN). Optimized instrumental parameters were: -100 V tube lens voltage, -10 V 54
capillary voltage, 3 kV spray voltage, 200 oC capillary temperature, 2 micro scans, 200 ms MS 55
injection time, AGC mode off. Mass spectra were acquired in full scan at negative mode over an 56

65
m/z range of 50-200. DESI source parameters were: 55 degree spray angle, 1-1.5 mm tip-to-57
surface distance, 4 mm tip-to-inlet distance, 10o collection angle, 8 bar nitrogen carrier gas 58
pressure. A mixture of Milli-Q water and acetonitrile (1:4, vol/vol) was used as spray solvent and 59
was delivered at a flow rate of 3 μl/min. Unless otherwise stated, the instrumental and ion source 60
parameters were constant for all the experiments in this study. 61
4.2.2 DESI imaging and profiling 62
Four imaging experiments were performed: (a) DESI imaging of endogenous organic acids 63
(malic, tartaric and citric acids) in grapevine stems, both fresh and vacuum dried (1h at 50 torr); 64
as no significant differences in the quantitative distribution of the three targeted organic acids 65
were observed, vacuum dried grapevine stems were preferred in order to avoid sample shrinkage 66
during the imaging process. (b) DESI imaging of exogenous organic acids (glutaric and adipic 67
acids) in grapevine stem. Fresh grapevine stem sections were dipped into an adipic and glutaric 68
acid aqueous solution (2.5 mM, 1h, 50 torr) then dried under the same vacuum conditions for 1 h. 69
The uppermost layer of the grapevine stem was cut away with a razor blade to remove any 70
inhomogeneous glutaric and adipic acid crystallization following vacuum dehydration. (c) DESI 71
imaging experiment in which glutaric and adipic acids were added to the spray solvent to a final 72
concentration of 0.5 mM. DESI imaging was then performed on vacuum dried grapevine stems 73
to see whether surface characteristics affect detection of glutaric and adipic acids. (d) Indirect 74
DESI imaging of endogenous organic acids (malic, tartaric and citric) in grapevine leaf. Leaf 75
blade was imprinted on a porous PTFE sheet (pore size 7-14 μm, porosity 45-50%) following a 76
previously described protocol [15]. The imprints were made by pressing a sandwich consisting of 77
a porous PTFE sheet, the plant material with its abaxial surface facing the PTFE surface, and a 78
few layers of filter paper. A 10 mL round-bottomed flask was used as a plunger to imprint the 79

66
leaf sap onto the porous PTFE surface. After a few minutes of vacuum desiccation, the imprints 80
were ready to use. For DESI Imaging, the sample was scanned at a velocity of 200 μm/s in x 81
direction and 200 μm step size in y direction until the entire sample was analyzed. The thickness 82
of grapevine stem sections was ~200 μm. 83
For the DESI profiling experiments, an organic acid solution containing equimolar amounts of 84
the 5 organic acid standards (2.5 mM), namely malic, tartaric, citric, glutaric and adipic acids, 85
was prepared by dissolving them in a 1:4 (v/v) water/acetonitrile mixture. Three microliters of 86
this solution was spotted onto the three PTFE surfaces. The deposits were air dried before 87
analysis. Each analysis was repeated 10 times with an acquisition time of 1 min. 88
4.2.3 Quantification of organic acids 89
Endogenous organic acids (malic, tartaric and citric acids) were quantified in the pith and outer 90
pith regions of grapevine stem, and in leaf lamina and leaf vein of grapevine leaf blade by IC 91
following the method recommended by Thermo Scientific [16]. Detailed sample preparation and 92
analytical methods are described in the Appendix 2. Exogenous organic acids (glutaric and 93
adipic acids) were quantified by direct infusion ESI-MS in the pith and outer pith region. 94
Detailed sample preparation and analytical methods are described in the Appendix 2. 95
4.2.4 Data processing and data analysis 96
The mass spectra files (.raw) were converted into common data format (CDF) by XcaliburTM
2.1 97
(Thermo Fisher Scientific). The CDF files were then analyzed and converted into 2-D ion maps 98
using an in-house R package [17]. Each pixel was normalized over the total ion count (TIC), and 99
visualization was improved with 2-D median smoothing over each ion map. Figures were 100
produced with R package ggplot2 [18] and lattice [19]. 101

67
4.3 Results and Discussion 102
4.3.1 DESI Imaging of Vitis vinifera tissues 103
DESI imaging revealed uneven distribution of organic acids in grapevine stem 104
In total, eight organic acids were detected in the different grapevine tissues using negative ion 105
mode ESI. Identification was confirmed by high resolution mass measurements carried out on 106
the corresponding [M-H]- parent ions and by comparing their MS/MS spectra with those of the 107
corresponding pure standards (table S1). We focused our attention on the results obtained for the 108
3 major endogenous organic acids (malic, tartaric and citric) on grapevine stem to investigate 109
surface effects on parent ion detection and to establish a rough quantitative estimate. Grapevine 110
stem was selected as reference because it is structurally highly heterogeneous and gives 111
reproducible DESI imaging results (the imaging experiments were repeated on 10 stem sections, 112
each from 1 of 10 different plants). From a histological point of view, one-year-old grapevine 113
stem is mainly composed of pith, xylem, phloem and cortex [20] and its structural heterogeneity 114
can be readily discerned, for example, the pith is a brown, sponge-like area in the middle of a 115
transverse grapevine stem section, while xylem is distinguished by its xylem vessels (black pores) 116
and rays (Fig 1). 117

68
118
Fig 1 Microscope image of a cross section of a one-year-old grapevine stem clearly showing its 119
structural heterogeneity. Pith, containing large parenchyma cells and brown in color, is located at 120
the center of the stem; secondary xylem (SX) is distinguished by its xylem vessels (black pores) 121
and rays; surrounding the secondary xylem is the secondary phloem (SP), a dark green ring; 122
cortex (C) is the outmost brown layer. 123
Typical results of the imaging experiments are shown in figure 2a. Malic and citric acids were 124
detected in the outer pith region with a rather homogeneous distribution; in contrast, tartaric acid 125
was distributed over the entire grapevine stem but with a higher concentration in the pith. It is 126
noteworthy that no traces of any of the organic acids investigated could be found in the xylem, 127
phloem and cortex. We were able to perform a semi-quantitative comparison of the 128
concentrations of the three organic acids in the different grapevine tissues [4, 21] from the 129
reconstructed ion images. 130
In order to validate the semi-quantitative potential of DESI, the outer parts of the grapevine stem 131
(xylem + phloem + cortex), termed the outer pith region, were separated from the pith, and the 132

69
quantities of malic, tartaric and citric acids in the two sample types were measured by IC. The 133
results are shown in Figure 2b. A Wilcoxon signed-rank test (p<0.01) clearly show that malic 134
acid is present in comparable concentrations in the pith and outer pith region, while citric acid 135
and tartaric acid are present in significantly different concentrations (citric acid is more abundant 136
in the outer pith region and tartaric acid is present in greater concentrations in the pith (Fig 2b)). 137
The IC results are therefore in agreement with DESI for tartaric and citric acid, but they do not 138
confirm the quantitative distribution of malic acid. DESI is a surface analysis technique, while IC 139
measures averaged concentrations (‘bulk’ mainly) of the same metabolites, so it could be argued 140
that comparison of the two methods is unfair. We therefore designed an imaging experiment in 141
which the grapevine stem tissue sections were uniformly enriched in two xenobiotic compounds 142
(adipic and glutaric acids) with physico-chemical properties quite similar to the endogenous 143
acids under investigation (see Materials and Methods). 144
145

70
Fig 2 Quantitative mapping of three major organic acids, malic, tartaric and citric acids, in one-
year-old grapevine stem. (a) DESI imaging of the three organic acids at negative ion mode. The
color bar represents TIC normalized ion intensity from 0 (blue) to 1 (red). (b) IC quantification
of the three organic acids in the pith and outer pith region of one-year-old grapevine stem.
Values represent mean+SD (n=3). Statistical differences were calculated using a
Wilcoxon signed-rank test. Asterisks denote significant differences (P<0.01) in the organic acids
between the pith and outer pith region.
Before proceeding to the DESI imaging, uniformity of enrichment of the stem sections was 146
checked by ESI-MS. The pith and outer pith region of several stems were manually separated 147
and the relative concentrations of glutaric and adipic acids in the extracts were measured by 148
Direct Infusion ESI-MS (see Appendix 2). The results, shown in Figure 3b, show that there are 149
no statistically significant differences between the quantities of the two xenobiotics in the 150
different parts of the grapevine stem, confirming that the samples were uniformly enriched in 151
adipic and glutaric acids. 152
The enriched stem sections were then imaged by DESI. The results, shown in Figure 3a, revealed 153
that glutaric and adipic acids were detected to a lesser extent in the pith region compared with 154
the remaining part of the stem. As discussed in ‘Materials and Methods’, the different DESI 155
imaging scans were normalized to the corresponding Total Ion Current (TIC) to account for local 156
changes in overall ionization efficiency. These results show that in DESI imaging measurements, 157
the matrix effect due to the different physico-chemical properties of the tissue surface has a 158
strong impact on the desorption response factors of the metabolites and hence on their semi-159
quantitative detection. 160

71
161
Fig 3 Quantitative mapping of exogenous glutaric and adipic acids in one-year-old grapevine
stem. (a) DESI imaging of the two organic acids at negative ion mode in one-year-old grapevine
stem enriched in glutaric and adipic acids. The color bar represents TIC normalized ion intensity
from 0 (blue) to 1 (red). (b) Quantification through direct infusion ESI-MS of the two organic
acids in the pith and outer pith region of one-year-old stem enriched in glutaric and adipic acids.
Values represent mean+SD (n=3). No statistical differences were found between pith and outer
pith region (P<0.01) for both organic acids according to a Wilcoxon signed-rank test.
Strategies to correct for surface effects 162
Going one step further, we investigated how these surface effects could be minimized. Since, as 163
already discussed, TIC normalization is not a suitable solution to this problem, the addition of 164

72
internal standards was considered. When making DESI measurements, internal standards can be 165
added to the DESI spray solvent, an approach already reported in the literature to improve 166
quantification accuracy [9]. We tested this approach in imaging applications by adding glutaric 167
and adipic acids (0.5 mM) to the solvent spray. For this to be a useful tool for avoiding and/or 168
measuring surface effects, the signal of these standards should change during acquisition 169
depending on local tissue physico-chemical properties. The images reconstructed for the internal 170
standards are shown in Figure 4 and show a rather uniform distribution of glutaric and adipic 171
acids, indicating that the signals of the two acids are not highly dependent on the characteristics 172
of the surface. These results contrast with those observed when the two acids were ‘added’ to the 173
grapevine stem and tell us that differences in surface effects cannot be controlled by simply 174
adding a “calibrant” to the spray solvent. This could be explained by the fact that desorption is 175
not necessary in the ionization process when internal standards are sprayed in DESI solvent. 176
177
Fig 4 DESI imaging of glutaric and adipic acids added to the spray solvent. The color bar
represents TIC normalized ion intensity from 0 (blue) to 1(red).
An attractive alternative, especially in untargeted DESI experiments, to minimize surface effects 178
on the efficiency of metabolite desorption is to ‘imprint’ the tissues on a uniform surface while 179
preserving the original distribution of the metabolites. This indirect DESI imaging has been 180
applied in several contexts using porous Teflon [21-23], PTFE [15], print paper or TLC plate 181
[24]. 182

73
To verify the ability of imprinting in compensating the surface effects, the ideal way is to map 183
the distribution of organic acids from the imprint of grapevine stem on PTFE surfaces, and then 184
compare the results with the direct DESI imaging results. We have tried imprinting grapevine 185
stem onto the PTFE surface but the results are not satisfying. The reasons are: 1). the grapevine 186
stems used in our experiment were harvested at post-veraison stage and the water content in the 187
grapevine stem at that time is too low to allow adequate organic acid transfer. 2). although 188
increasing the pressure during imprinting improves the organic acid transfer efficiency but 189
meanwhile the transfer efficiency difference between pith and outer pith region is also increased 190
as their structures differ significantly (pith is spongeous and soft and outer pith region is hard and 191
woody). 3). a recent study demonstrated that metabolite transfer efficiency can be improved with 192
the assistance of solvent extraction and/or heating during imprinting, while ion intensity varies 193
significantly under different solvent and/or heating conditions [26]. To avoid bias and exclude 194
the possible effect brought by the organic acid transfer efficiency differences between pith and 195
outer pith region on our DESI imaging results, we used grapevine leaf (Fig 5a) in our experiment 196
as it is water-rich and the structural difference between leaf lamina and vein is minimum (the 197
organic acid transfer efficiency difference is also minimum). As before, semi-quantitative 198
distribution of malic, tartaric and citric acids in the grapevine leaf obtained from DESI images 199
was compared with IC by separating the lamina and vein of leaves. DESI images revealed no 200
differences between leaf lamina and leaf vein for the three organic acids (Fig 5b), consistent with 201
the results obtained by IC (Fig 5c). Although we focused on a small number of compounds in 202
only one tissue type, our results suggest that imprinting might be useful in minimizing desorption 203
differences due to surface effects in structurally or biologically heterogeneous tissue. However, it 204
is important to point out that this method is more suitable for water-rich samples and does not 205

74
yield good outputs for harder tissues like grapevine stem. A recent study demonstrated that 206
metabolite transfer efficiency can be improved with the assistance of solvent extraction and/or 207
heating during imprinting, while ion intensity varies significantly under different solvent and/or 208
heating conditions [25]. Spatial resolution is another concern, as metabolites could be smeared 209
during pressing [1]. Furthermore, we cannot exclude the possibility that homogeneous detection 210
of the three organic acids over the grapevine leaf blade might be due to the fact that differences 211
in their concentrations between leaf lamina and vein are averaged out during pressing. It is our 212
opinion, therefore, that imprinting could be a promising technique to minimize surface effects, 213
although it should be borne in mind that the overall approach needs further validation. 214
215

75
Fig 5 Quantitative mapping of three major organic acids (malic, tartaric and citric acids) in
grapevine leaf blade. (a) Optical images of the grapevine leaf (1) and its imprint on a PTFE
surface (2). (b) DESI imaging of the three organic acids at negative ion mode. The color bar
represents TIC normalized ion intensity from 0 (blue) to 1(red). (c) IC quantification of the three
organic acids in leaf lamina and leaf vein. Values represent mean+SD (n=3); values for citric
acid are increased 10 times for better visualization. No statistical differences were found between
leaf blade and leaf vein (P<0.01) for each organic acid according to a Wilcoxon signed-rank test.
4.3.2 DESI Profiling on PTFE 216
In the previous section, the role of surface effects on the output of DESI imaging experiments 217
was investigated. These phenomena are likely due to differences in the local physico-chemical 218
properties of the tissue surfaces. To understand how these properties affect the desorption 219
process, we performed a series of DESI profiling experiments on PTFE surfaces with different 220
porosities. Three surfaces, a) flat PTFE, b) PTFE with a pore size of 1-3 µm, 25-30% porosity 221
(PTFE1), and c) PTFE with a pore size of 7-14 µm, 45-50% porosity (PTFE14), were used to 222
mimic a heterogeneous sample tissue. A solution (2.5 mM) of five organic acids was spotted on 223
the surfaces and analyzed by DESI. 224
Results of the DESI analysis are shown in Figure 6. The six plots in Figure 6a show how the 225
absolute ion intensity of the 5 organic acids varies over time on the three different surfaces. 226
Figure 6b, on the other hand, displays the absolute integrated signal over 1 minute (note that the 227
relative abundances of the 5 organic acids vary with different integration times as they do not 228
decay at the same rate (Fig S2)). Although deposited in equimolar amounts, ion intensities vary 229
widely among the 5 organic acids. The integrated ion intensities for citric acid, for example, are 230
at least 20 times higher than those for adipic acid on all three PTFE surfaces. This result is not 231

76
unexpected and is primarily due to their intrinsic pKa1 differences which largely determine their 232
ionization efficiencies [26], the pKa1 values of citric acid being the lowest and adipic acid the 233
highest [27, 28]. Figure 6b shows that, in terms of absolute response, PTFE14 gives optimum 234
performance, followed by PTFE1 then flat PTFE. In terms of signal decay over time, figure 6a 235
shows that the ion intensity of each organic acid is relatively stable on PTFE1, while flat PTFE 236
has the poorest signal stability, the signals of glutaric and adipic acids disappearing after 1.5 min 237
(data not shown). As expected, the compounds are more readily washed away from the flat 238
surface, and this also affects the absolute intensity of the signal over 1 minute. On the other hand, 239
PTFE1 porosity seems better able to ‘cage’ the metabolites on its surface and to therefore 240
produce a more stable signal. More generally, it is known that surface roughness and porosity 241
affect the degree of sample spreading upon spotting as well as the degree of washing away upon 242
spay solvent splashing [6-9]. 243
244
Fig 6 Absolute ion intensity of malic, tartaric, citric, glutaric and adipic acids detected on 3
different surfaces, PTFE0 (flat PTFE), PTFE1 (PTFE with pore size 1-3 µm) and PTFE14 (PTFE
with pore size 7-14 µm), at negative mode. (a) Absolute ion intensity of each organic acid as a
function of time. (b) Integrated ion intensity of each organic acid for 1 min.

77
As the model PTFE surfaces are chemically inert to the organic acids and DESI solvent, DESI 245
profiling results on the PTFE surfaces suggest that the local physical properties of the tissue 246
surfaces strongly affect the desorption process as well as their relative quantitative detection (in 247
terms of integrated ion intensity). 248
Conclusions 249
It is known that sample surface properties affect the desorption processes in MSI, while it is 250
often ignored that different surface properties within a structurally/biologically heterogeneous 251
sample tissue can largely affect the quantitative detection of analytes, and may result in the MS 252
images misrepresenting their true distribution. This phenomenon has also been reported in 253
MALDI [29] and SIMS imaging [30]. Attention should be paid in interpreting biologically 254
related questions when using this type of imaging information, as differences in the quantitative 255
distribution of a metabolite in a sample tissue might simply reflect differences in specific 256
physico-chemical interactions with the matrix and not differences in relative amounts. 257
Our investigation suggests that imprinting could be a solution for minimizing these surface 258
effects, although the effectiveness of this strategy requires further investigation. As far as the 259
addition of external standards is concerned, our results clearly indicate that the addition of a 260
reference compound to the DESI spray has no significant effect, but enrichment of the samples 261
with close analogues or stable isotope labeled compounds could be the way to go, similarly to 262
what is normally done in MALDI [31, 32] and DESI [33]. It is important to point out, however, 263
that this solution is expected to be optimal only in the case of targeted analysis because the ‘local 264
environment’ can affect different metabolites in different ways. This observation de facto limits 265
the value of untargeted imaging studies if their outcomes are not suitably validated. 266

78
The results of our imaging experiments, however, were highly reproducible, and showed 267
consistent spatial distributions of organic acids in several stems of different plants collected in 268
two growing seasons. Even where grapevine stems were dipped in an adipic and glutaric acid 269
solution for 1 h, the distributions of malic, tartaric and citric acids did not alter significantly (Fig 270
S3). Our results suggest that ion intensity in a DESI image is a function of metabolite 271
concentration and tissue surface properties when instrumental and ion source parameters are 272
constant. This ion intensity can be used as a characteristic descriptor of tissue type since both 273
metabolite content and tissue surface are tissue specific. This information is potentially useful in 274
distinguishing both intra- (as shown in grapevine stem) and inter-sample tissue differences, 275
which are often impossible to resolve with a microscope. In this study, we successfully 276
distinguished 6 different grapevine tissue types using Principal Component Analysis on ion 277
intensities of 8 organic acids directly extracted from DESI images (Fig S4). 278
Reference 279
1. Lee, Y.J., et al., Use of mass spectrometry for imaging metabolites in plants. The Plant Journal, 280 2012. 70(1): p. 81-95. 281
2. Svatos, A., Mass spectrometric imaging of small molecules. Trends Biotechnol, 2010. 28(8): p. 282 425-434. 283
3. Takats, Z., et al., Mass spectrometry sampling under ambient conditions with desorption 284 electrospray ionization. Science, 2004. 306(5695): p. 471-473. 285
4. Wiseman, J.M., et al., Desorption electrospray ionization mass spectrometry: Imaging drugs and 286 metabolites in tissues. Proc Natl Acad Sci U S A, 2008. 105(47): p. 18120-18125. 287
5. Miura, D., Y. Fujimura, and H. Wariishi, In situ metabolomic mass spectrometry imaging: recent 288 advances and difficulties. J Proteomics, 2012. 75(16): p. 5052-5060. 289
6. Manicke, N.E., et al., Desorption electrospray ionization (DESI) mass spectrometry and tandem 290 mass spectrometry (MS/MS) of phospholipids and sphingolipids: ionization, adduct formation, 291 and fragmentation. J Am Soc Mass Spectrom, 2008. 19(4): p. 531-543. 292
7. Ifa, D.R., et al., Quantitative analysis of small molecules by desorption electrospray ionization 293 mass spectrometry from polytetrafluoroethylene surfaces. Rapid Communications in Mass 294 Spectrometry, 2008. 22(4): p. 503-510. 295
8. Douglass, K.A., et al., Deconstructing Desorption Electrospray Ionization: Independent 296 Optimization of Desorption and Ionization by Spray Desorption Collection. J Am Soc Mass 297 Spectrom, 2012. 23(11): p. 1896-1902. 298

79
9. Takats, Z., J.M. Wiseman, and R.G. Cooks, Ambient mass spectrometry using desorption 299 electrospray ionization (DESI): instrumentation, mechanisms and applications in forensics, 300 chemistry, and biology. Journal of Mass Spectrometry, 2005. 40(10): p. 1261-1275. 301
10. Abadia, J., et al., Organic acids and Fe deficiency: a review. Plant and Soil, 2002. 241(1): p. 75-86. 302 11. Ma, J.F., P.R. Ryan, and E. Delhaize, Aluminium tolerance in plants and the complexing role of 303
organic acids. Trends Plant Sci, 2001. 6(6): p. 273-278. 304 12. Choi, Y.H., et al., Are natural deep eutectic solvents the missing link in understanding cellular 305
metabolism and physiology? Plant Physiol, 2011. 156(4): p. 1701-1705. 306 13. Kupina, S.A., C.A. Pohl, and J.L. Gannotti, Determination of Tartaric, Malic, and Citric Acids in 307
Grape Juice and Wine Using Gradient Ion Chromatography. American Journal of Enology and 308 Viticulture, 1991. 42(1): p. 1-5. 309
14. D.R.E Possner , W.M.K., The localization of acids, sugars, potassium and calcium in developing 310 grape berries. Vitis, 1985. 24: p. 11. 311
15. Muller, T., et al., Direct plant tissue analysis and imprint imaging by desorption electrospray 312 ionization mass spectrometry. Anal Chem, 2011. 83(14): p. 5754-5761. 313
16. Scientific, T., Higher Resolution Separation of Organic Acids and Common Inorganic Anions in 314 Wine 2011: p. 8. 315
17. Team, R.C., R: A Language and Environment for Statistical Computin. R Foundation for Statistical 316 Computing, Vienna, Austria., 2013. 317
18. Wickham, H., ggplot2: elegant graphics for data analysis. Springer New York, 2009. 318 19. Sarkar, D., Lattice: multivariate data visualization with R. 2008: Springer. 319 20. Pratt, C., Vegetative Anatomy of Cultivated Grapes--A Review. American Journal of Enology and 320
Viticulture, 1974. 25(3): p. 19. 321 21. Li, B., et al., Characterization of barley leaf tissue using direct and indirect desorption 322
electrospray ionization imaging mass spectrometry. Journal of Mass Spectrometry, 2011. 46(12): 323 p. 1241-1246. 324
22. Thunig, J., S.H. Hansen, and C. Janfelt, Analysis of secondary plant metabolites by indirect 325 desorption electrospray ionization imaging mass spectrometry. Anal Chem, 2011. 83(9): p. 3256-326 3259. 327
23. Li, B., et al., Visualizing metabolite distribution and enzymatic conversion in plant tissues by 328 desorption electrospray ionization mass spectrometry imaging. Plant J, 2013. 329
24. Ifa, D.R., et al., Tissue imprint imaging by desorption electrospray ionization mass spectrometry. 330 Analytical Methods, 2011. 3(8): p. 1910-1912. 331
25. Cabral, E.C., et al., Blotting Assisted by Heating and Solvent Extraction for DESI-MS Imaging. J Am 332 Soc Mass Spectrom, 2013. 333
26. Oss, M., et al., Electrospray ionization efficiency scale of organic compounds. Anal Chem, 2010. 334 82(7): p. 2865-2872. 335
27. Kakola, J. and R. Alen, A fast method for determining low-molecular-mass aliphatic carboxylic 336 acids by high-performance liquid chromatography-atmospheric pressure chemical ionization 337 mass spectrometry. J Sep Sci, 2006. 29(13): p. 1996-2003. 338
28. Hano, T., et al., Extraction Equilibria of Organic-Acids with Tri-N-Octylphosphineoxide. Journal of 339 Chemical Engineering of Japan, 1990. 23(6): p. 734-738. 340
29. Peukert, M., et al., Spatially resolved analysis of small molecules by matrix-assisted laser 341 desorption/ionization mass spectrometric imaging (MALDI-MSI). New Phytol, 2012. 193(3): p. 342 806-815. 343
30. Jones, E.A., N.P. Lockyer, and J.C. Vickerman, Mass spectral analysis and imaging of tissue by 344 ToF-SIMS—The role of buckminsterfullerene, C60
+, primary ions. International Journal of Mass 345 Spectrometry, 2007. 260(2): p. 146-157. 346

80
31. Reyzer, M.L., et al., Direct analysis of drug candidates in tissue by matrix-assisted laser 347 desorption/ionization mass spectrometry. Journal of Mass Spectrometry, 2003. 38(10): p. 1081-348 1092. 349
32. Landgraf, R.R., et al., Considerations for quantification of lipids in nerve tissue using matrix-350 assisted laser desorption/ionization mass spectrometric imaging. Rapid Commun Mass Spectrom, 351 2011. 25(20): p. 3178-3184. 352
33. Lanekoff, I., et al., Imaging nicotine in rat brain tissue by use of nanospray desorption 353 electrospray ionization mass spectrometry. Analytical chemistry, 2013. 85(2): p. 882-889. 354
355

81
Chapter 5 1
High production of small organic dicarboxylate dianions 2
by DESI and ESI 3
Yonghui Dong, Graziano Guella, Fulvio Mattivi, Pietro Franceschi 4
5
Notes: 6
This chapter has been prepared for submission. Dong Y. conducted the experiment, performed 7
data analysis and wrote the draft; Guella G. designed the experiment, revised and approved the 8
final manuscript; Mattivi F. approved the final manuscript; Franceschi P. conceived and design 9
the experiment, revised and approved the final manuscript. 10

82
5.1 Introduction 11
Small organic dicarboxylic acids (SODAs) play an important role in many biological systems. In 12
the specific case of plants they are key intermediates in carbon metabolism and can be present in 13
high concentrations - often stored as K+ salts - with important implications for the production of 14
beverages like juices or wine. 15
Since dicarboxylic acids (H2DCA) such as succinic, glutaric, adipic, malic and tartaric acid have 16
pKa2 values in water lower than 6, in alkaline aqueous solutions they are expected to be present 17
mostly as dicarboxylate anions (DCA2-
) followed by minor relative amount of the 18
monoprotonated species HDCA-. However, DCA
2- species are rarely (and scarcely) detected by 19
mass spectrometric techniques no matter of the used ionization source used to carry these ions in 20
the final gas phase [1]; in fact, due to their high gas phase proton affinity they easily tend a) to be 21
protonated during solvent evaporation leading to HDCA- or b) to lose one electron leading to the 22
corresponding radical anion or c) to dissociate into singly charged adduct ions and neutral 23
fragments. For a given carbon backbone, the gas phase stability of DCA2-
can be increased by 24
introducing additional functional groups which allow charge delocalization and/or favour 25
intramolecular hydrogen bonding, as in the case of tartaric acid [2]. This complex behaviour 26
coupled with a relatively simple structure has made SODAs an ideal system to study 27
fundamental molecular phenomena like Coulomb repulsions [3] and solute-solvent interactions 28
[4, 5]. From an experimental point of view, ESI should be the technique of election to produce 29
gas phase DCA2-
, but it has been always quite difficult to produce these ionic species in 30
significant amount, at least for H2DCA with low molecular weight. In particular, a recent work 31
by Tonner et al. demonstrates that the tartaric dianion (TA2-
) can be produced by ESI, albeit with 32
low efficiency, only under restricted experimental conditions by hindering their spontaneous 33
thermodynamic decomposition [2]. 34
Since it is widely accepted that DESI follows an ESI-like dynamics [6, 7], the production of TA2- 35
specie in DESI-MS spectra was expected to be also highly inefficient. However, during 36
Desorption Electrospray Ionization (DESI) imaging of SODAs in grape tissues (Figure 1), we 37
have observed a relatively strong signal at m/z 72 attributable to this tartrate dianion, thus 38
demonstrating that it can be produced in good yields also in standard MS conditions. As a 39
consequence, this outcome seems to suggest the presence of significant and subtle differences 40
between DESI and ESI ionization mechanisms. 41

83
In order to understand the mechanism of formation of DCA2-
, we designed a series of DESI and 42
ESI experiments on SODAs differing for the length of the carbon backbone and the number of 43
hydroxyl groups. In particular, we analyzed a) 3 H2DCA acids of general structural formula 44
HOOC-(CH2)n-COOH, i.e. succinic (n=2,H2SA), glutaric (n=3,H2GA) and adipic acid (n=4, 45
H2AA) and b) two hydroxylated dicarboxylic acids, malic (HOOC-CH2-CHOH-COOH, H2MA) 46
and meso-tartaric acid (HOOC-CHOH-CHOH-COOH, H2TA) (see Figure 1). 47
Since in grape tissue SODAs are often stored as potassium salts [8], different SODA potassium 48
salts were used as starting point of all the MS experiments as prepared by titration of the 49
corresponding acid with KOH (potassium hydroxide); in order to investigate any possible role 50
played by counter-ions, we prepared (by titration with NaOH and LiOH) the corresponding 51
sodium and lithium salts (for the details see the Experimental Section). DESI analysis was 52
carried out on SODA aqueous solutions deposited and air dried on a chemically inert porous 53
Teflon surface. For ESI measurements, the same SODA aqueous solutions were directly injected 54
into the ion source by a syringe pump. To minimize possible differences due to different 55
composition of needle-sprayers, the DESI sprayer was also used as ESI source by adjusting the 56
source geometry (see Experimental Section). 57
Experimental section 58
Acetonitrile was purchased from Sigma-Aldrich (Italy), water was purified using a Mili-Q water 59
purification system (Sartorius Stedim biotech Gmbh, Germany). Succinic (>99.5%), malic 60
(>99.5%), glutaric (>99.0%) and adipic acids (>99.5%) were purchased from Fluka AG 61
(Germany), L-tartaric acid (99.5%), lithium hydroxide monohydrate (99%), sodium hydroxide 62
(>97%) and potassium hydroxide (>85%) were from Sigma Aldrich (Italy). 63
The dicarboxylate salts were produced by mixing equal volumes (20 mL, water/acetonitrile 1:4) 64
of 0.5 mM aqueous solutions of each H2DCA (succinic, malic, tartaric, glutaric and adipic acids) 65
a) with a molar excess (1.5 mM) of alkali hydroxides (LiOH, NaOH, KOH) or b) with 2 mol 66
equivalent (1.0 mM) of the same hydroxides. Three microliter of each solution was deposited on 67
a porous PTFE sheet (pore size 1-3 μm, porosity 25-30%, Porex Corporation, Germany) and then 68
was air dried before DESI analysis. Each solution was analysed 6 times with an acquisition time 69
of 1 min. 70
All the MS experiments were performed using a Thermo-Fisher Scientific LTQ-Orbitrap XL 71
mass spectrometer (Bremen, Germany) equipped with an OmniSprayTM
ion source from Prosolia 72

84
Inc. (Indianapolis, IN). The typical instrumental parameters for standard DESI were: -100 V tube 73
lens voltage, -10 V capillary voltage, 5 kV spray voltage, 200 oC capillary temperature, 2 micro 74
scans, 200 ms MS injection time. Mass spectra were acquired in full scan negative mode over the 75
m/z range of 50-200. The DESI source parameters used were: 55 degree spray angle, 1-1.5 mm 76
tip-to-surface distance, ~ 4 mm tip-to-inlet distance, 10o collection angel, 8 bar nitrogen carrier 77
gas pressure. A mixture of Milli-Q water and acetonitrile (1:4, vol/vol) was used as spray solvent 78
and delivered at the flow rate of 3 μl min-1
. 79
ESI measurements were carried out by simply changing the DESY spray angle close to 45 80
degree, while keeping other instrumental and ion source parameters constant. Analyte solutions 81
were injected directly into the inlet at the flow rate of 3 μl min-1
. Each solution was analyzed 6 82
times with an acquisition time of about 1 min.; ion source was washed by spraying Milli-Q 83
water/acetonitrile 1:4 (v/v) for about 10 min at the flow-rate of 8 μl min-1
. 84
5.2 Results and Discussion 85
The outcomes of the complete set of our experiments is summarized in Figure 1 which shows the 86
intensity of the DCA2-
ion with respect to the intensity of the corresponding base peak ([M-H]-, 87
always the most intense peak in the MS spectra). Only the results for K2DCA salts are shown, 88
but similar data were obtained for the corresponding sodium and lithium salts (see Figure 2S and 89
Figure 3S in Appendix 3 for Na2DCA and Li2DCA salts, respectively). 90

85
91
Figure 1. DCA2-
ion yields as observed in ESI and DESI ion-sources for K2DCA aq. solutions. 92
Dianion yields were calculated by the ratio of abundance of dianions to those of their respective 93
deprotonated singly charged ions. Values represent mean ± SD (n=6). ‘3:1’ represent salts 94
obtained from DCA by using molar excess (3:1) of KOH whilst ‘2:1’ represent salts obtained 95
from DCA by using two molar equivalents (2:1) of KOH. 96
Each panel of the plot displays the results relative to SODAs with a different carbon backbone 97
(first column) bearing a different number of hydroxyl groups (first row). The leftmost barplot 98
illustrates the results obtained with aqueous solutions prepared by KOH/DCA in 3:1 ratio. In this 99
condition for both sources, DCA2-
starts to be detectable for a carbon chain of at least five carbon 100
atoms and the relative intensity, as expected, increases with the number of carbons. A longer 101
chain, indeed, means a bigger separation between the two charges and the subsequent reduction 102
of Coulomb repulsion stabilizes the doubly charged ion. Our findings are in keeping with 103
previous investigations, which demonstrated that HOOC-(CH2)2-COOH is not stable in the gas 104
phase [5, 9]. A simple calculation of the Coulomb repulsion energy Erep= e2/4πε0r between two 105
electrons, at a distance r, suggests that the two negative charges in a molecule with a mutual 106

86
electron affinity of 3eV (electron affinity of carboxylate radical anions is about 3eV) can be 107
stable when they are more than 5Å apart [2, 10]. The charge separation distance of 5.3Å for 108
succinate estimated by Wang and co-workers [3] rationalizes why bare succinate dianion is not 109
observable in the gas phase. In our conditions, the increase in the relative intensity with 110
increased length of the chain is remarkable: for HOOC-(CH2)4-COOH the DCA2-
is as high as 60% 111
of the deprotonated singly charged ion DCA-. ESI and DESI seem to give qualitatively 112
comparable results, even if the ESI relative yield was found a bit higher for HOOC-(CH2)3-113
COOH. 114
The role of the hydroxyl groups on the four carbon backbone is displayed in the first row of 115
Figure 1. In our measurements, only H2TA (bearing 2 hydroxyl groups) shows efficient 116
production of DCA2-
ions in both DESI and ESI. Again, this result is in agreement with 117
experiments and ab-initio calculations carried out by Tonner and co-workers [2], who 118
demonstrated that TA2-
is the smallest dicarboxylate stable in the gas phase. Interestingly, 119
however, in our experiments we have been able to produce a much stronger signal for the TA2-
at 120
m/z 72 (around 8% of TA-) than that reported in recent literature [2] where this species has been 121
barely detected only under highly restricted ESI conditions. The observed strong DCA2-
ion yield 122
is difficult to rationalize, we only have the experimental hint that ESI/DESI DCA2-
ion yield is 123
higher on strongly alkaline solutions prepared by using a molar excess of metal hydroxides. 124
From one side the expected higher pH of these solutions ensures higher molar fraction of TA2- 125
species even because the pKa2 of H2TA in acetonitrile/water solution (4:1, v/v) should be much 126
higher (at least of 5 magnitude order) than in aqueous solution. From the other side, however, 127
higher concentration of the metal cations should lead, during ESI/DESI processes, to relevant 128
formation of neutral (such as K+--TA
2- --K
+) or singly charged
(TA
2- --K
+)
ion-pairs. The results 129
seem to suggest that during ionization the metal ions can be selectively and efficiently “caged” 130
by hydroxyl groups and they are not available to partially (or completely) neutralize the most 131
abundant DCA2-
species in strong alkaline conditions. 132
To confirm the role of the free OH- present in solution we reduced their amount, by using double 133
metal salts to prepare the initial solution. The results of the experiments performed in these new 134
conditions are summarized in the right barplot in Figure 1 (2:1). The effect of the reduction of 135
free OH- on the ESI spectra is striking: DCA
2- is practically undetectable in all cases. A minor 136
signal is still visible (0.075% for TA, 0.006% for AA), but it is almost comparable with the 137

87
chemical noise and in line with that observed in literature [2]. This experiment highlights the 138
role of OH- in promoting the production of the dianions: obviously their presence is not affecting 139
the molecular properties of the OAs, but it can reduce the extent of ion pairing K+-- DCA
2- --K+ 140
in ESI conditions. 141
The situation in DESI, however, is now different. The DCA2-
yield is indeed lowered, but the 142
signals are still clearly present, indicating that in DESI, DCA2-
can be efficiently produced also 143
when free from OH- groups. A straightforward way to account for this observation is to suppose 144
that in DESI there is another active “caging” mechanism which mimics the effects of the free 145
OH- excess. The particular nature of DESI suggests a possible solution. It is known that DESI 146
involves the landing and releasing of charges on the surface [11], but when the surface is an 147
insulator this will produce a local charge accumulation. In negative ion mode, the surface is 148
expected to be negatively charged and it can attract and cage the K+ ions thus favoring the 149
formation of DCA2-
ions in the gas phase. 150
5.3 Conclusions 151
We have proposed a simple and efficient method to produce DCA2-
in DESI and ESI by 152
introducing an excess amount of OH- in dicarboxylate solutions. Although the ionization 153
dynamics is similar in DESI and ESI, our results indicate that the surface in DESI play a crucial 154
role in determining the nature of the observed gas-phase ions. Our results have been obtained on 155
a PTFE model surface, but the same phenomena are expected to happen if DESI is used to 156
analyze plant tissue sections. There, the large amount of OH-rich polymers is expected to bind 157
metal ions, favoring the formation of DCA2-
observed during our imaging experiments. From the 158
analytical point of view, our study suggests that DCA2-
signal could be used in MS imaging 159
experiments as a proxy to measure the distribution of SODA salts in plant tissues. The possible 160
application of this idea will be the subject of further investigations. 161
Reference 162
1. Wang, G.D. and R.B. Cole, Effects of solvent and counterion on ion pairing and observed charge 163 states of diquaternary ammonium salts in electrospray ionization mass spectrometry. J Am Soc 164 Mass Spectrom, 1996. 7(10): p. 1050-1058. 165
2. Tonner, R., et al., Stability of gas-phase tartaric acid anions investigated by quantum chemistry, 166 mass spectrometry, and infrared spectroscopy. Journal of Physical Chemistry A, 2012. 116(19): p. 167 4789-4800. 168

88
3. Wang, L.S., et al., Probing the potential barriers and intramolecular electrostatic interactions in 169 free doubly charged anions. Physical Review Letters, 1998. 81(13): p. 2667-2670. 170
4. Yang, X., et al., Solvent-mediated folding of a doubly charged anion. Journal of the American 171 Chemical Society, 2004. 126(3): p. 876-883. 172
5. Ding, C.F., X.B. Wang, and L.S. Wang, Photoelectron spectroscopy of doubly charged anions: 173 Intramolecular Coulomb repulsion and solvent stabilization. Journal of Physical Chemistry A, 174 1998. 102(45): p. 8633-8636. 175
6. Nefliu, M., et al., Internal energy distributions in desorption electrospray ionization (DESI). J Am 176 Soc Mass Spectrom, 2008. 19(3): p. 420-427. 177
7. Takats, Z., J.M. Wiseman, and R.G. Cooks, Ambient mass spectrometry using desorption 178 electrospray ionization (DESI): instrumentation, mechanisms and applications in forensics, 179 chemistry, and biology. Journal of Mass Spectrometry, 2005. 40(10): p. 1261-1275. 180
8. W. Mark Kliewer, L.H.a.M.O., Concentrations of Tartaric Acid and Malic Acids and Their Salts in 181 Vitis Vinifera Grapes. Am. J. Enol. Vitic, 1967. 18(1): p. 13. 182
9. Herbert, J.M. and J. Ortiz, Ab initio investigation of electron detachment in dicarboxylate 183 dianions. The Journal of Physical Chemistry A, 2000. 104(50): p. 11786-11795. 184
10. Maas, W.P.M. and N.M.M. Nibbering, Formation of Doubly Charged Negative-Ions in the Gas-185 Phase by Collisionally-Induced Ion-Pair Formation from Singly Charged Negative-Ions. 186 International Journal of Mass Spectrometry and Ion Processes, 1989. 88(2-3): p. 257-266. 187
11. Basile, F., et al., Analysis of lipids from crude lung tissue extracts by desorption electrospray 188 ionization mass spectrometry and pattern recognition. Analytical Biochemistry, 2011. 408(2): p. 189 289-296. 190
191

89
Chapter 6 1
Conclusions and Future Work 2
6.1 Conclusions 3
In this thesis some of the central issues which have to be faced for the fruitful application of MSI 4
to plant tissues have been addressed by using MALDI and DESI, for mapping the distribution of 5
small metabolites in apple and grape, respectively. 6
High spatial resolution MALDI ion source coupled with high mass resolution Orbitrap was used 7
to image the distribution of flavonols and dihydrochalcones in different parts of apple. To 8
increase the chemical selectivity of this type of experiments, a novel data analysis approach 9
based on Intensity Correlation Analysis has been also developed. 10
DESI imaging was used as a fast technique because it allows rapid analysis under ambient 11
conditions without or with limited sample preparation. For this reason we have been using it to 12
map the distribution of small organic acids in different grape tissues. Our investigation has 13
demonstrated that the technique is reproducible and fast, but the sample surface properties 14
largely affect the ionization process of organic acids. Furthermore, different surface properties in 15
a structurally/biologically heterogeneous sample influence the ionization of target analytes at 16
different degrees, resulting in the MS images misrepresenting their true distribution. The use 17
Hyphenated mass spectrometry quantification methods such as GC-MS or LC-MS was necessary. 18
Our experiments suggest that the impact of these phenomena could be reduced by tissue 19
imprinting, but the potential of this approach will need further validation on different tissues and 20
different analytes. 21
Our DESI experiments have been the occasion to investigate the mechanistic details of DESI 22
ionization by studying the formation of small doubly charged anions in analytical conditions. It 23
has been generally accept that ionization in DESI occurs by ESI mechanism, during our DESI 24
imaging of tartrate in grape stem, we have observed a strong ion signal corresponding to the 25
doubly charged anion of tartrate, while an ESI-based study failed to observe the bare tartrate 26
dianion. This leads our interest to study the factors that can stabilize dianions in DESI. Our 27

90
results on several dicarboxylates using DESI and ESI suggest that the surface charging in DESI 28
could trap the counterions, thus enhancing the doubly charged ion production. 29
6.2 Future directions 30
MSI is becoming an indispensable tool for molecular imaging of plants. It has been applied to 31
study plant development, plant-environment interactions and functional genomics, but most of 32
the studies are still focused on method development and technological application. Several 33
factors are responsible for this situation. First of all experiments are time consuming so it is 34
indeed difficult to analyze tissues in a real high throughput manner. Chemical sensitivity and 35
low chemical specificity are another concern and this often requires the use of more standard 36
validation analytical tools like GC-MS and LC-MS. The algorithms/software used for data 37
analysis is another limiting factor: the use of MSI to foster biological interpretation requires 38
being able to go beyond the sole production of nice pictures, making the analysis automatic and 39
reproducible. 40
To make MSI an “off the shelf” tool which can be used to efficiently solve biological problems, 41
advancements are then needed in several areas. 42
6.2.1 Sample preparation 43
Sample preparation is crucial to ensure the true distribution of analytes of interest. Small 44
mistakes in sample preparation might significantly alter the quantitative detection of analyte 45
molecules, resulting in misleading biological conclusions. Although many of the current standard 46
MSI sample preparation methods have not changed significantly from those initially reported, 47
plant sample preparation methods should be specifically investigated according to characteristics 48
of the MSI instrument, nature of sample tissues and analytes of interest. In addition, sample 49
preparation should be developed to be able to introduce the possibility of in vivo imaging with 50
high temporal resolution (i.e. developing more ‘soft’ spray solvent system for DESI imaging). 51
6.2.2 Data analysis 52
Although a number of software packages are available for MSI image construction and/or MS 53
imaging data analysis, there are many challenges to be overcome. For example, the large dataset 54

91
produced in MSI (i.e. a typical MALDI imaging dataset is comprised of 5,000-50,000 spectra, 55
each having 10,000-100,000 intensity values) requires more time and memory efficient methods. 56
Most of the current data processing methods are directly adopted from conventional mass 57
spectrometry data analysis approaches. There are a lot to be done for MSI ion source and MSI 58
dataset specific data analysis algorithm development. In addition, strategy regarding how to 59
effectively co-register and MSI images and optical image is needed. 60
6.2.3 Quantitative imaging 61
There are many issues associated with semi-quantitation of MSI. Matrix effects, ion suppression 62
(for MALDI), spray solvent system (for DESI), ionization efficiency and sample surface 63
properties (for all MSI methods) are all factors that limit measured signal intensity truly 64
representing target compound concentration. In particular, sample surface property differences 65
over the sample tissue might mask the true distribution of analytes of interest as ionization 66
efficiency is strongly affected by sample surface characteristics. Due to this reason, other 67
quantification methods should be used to validate the MSI results. Isotopically labeled 68
compound could be used for targeted MSI quantification by spraying it homogeneously over the 69
sample surface prior MS imaging, while quantification for untargeted MSI is still challenging. 70
One might subject the sample for LC-MS or GC-MS analysis to search for potential analytes of 71
interest, and then use targeted MSI quantification strategy to acquire their exact quantitative 72
distribution. However there are several limitations for this approach; it requires more samples, 73
and the biomarkers are difficult to found if they are only highly localized in a small sample 74
region. More versatile quantification methods for untargeted MSI are required. 75
6.2.4 High spatial resolution MSI 76
SIMS imaging is superior for high spatial resolution imaging of elements and small molecules at 77
organelle level. However, it lacks the sensitivity of the mass range over m/z 1000 due to in-78
source fragmentation and molecular identification ability due to MS/MS incapability. The spatial 79
resolution of MALDI imaging is partially limited by the size of matrix crystal, and DESI by the 80
plume of spray solvent. Besides the efforts toward novel ion sources development, future work 81
need to focus on new matrix development (for MALDI), spray solvent system (for DESI), and 82
sample method to improve both spatial resolution and chemical sensitivity. 83

92
Appendix 1:
Figure S1: Pericarp region. MS images have been acquired with a raster step of 150 µm. (A,B,C)
Intensity Correlation Analysis for masses at m/z 435.129 (assigned to phloretin-6S) and m/z
273.076 (assigned to phloretin). (A) ICA plot. (B) Image reconstructed from XIC at m/z 435.129
(logaritmic scaling, intensity from blue (low) to red (high)). (C) Image reconstructed from the
pixels showing positive intensity correlation (scale from gray (low) to red (high). (D,E,F) ICA
analysis for the ions at m/z 433.077 (assigned to quercetin-5S) and m/z 300.028 (assigned to
quercetin). (G,H,I) ICA analysis for the ions at m/z 417.082 (assigned to kaempferol-5S) and m/z
285.040 (assigned to kaempferol).

93
Figure S2: Skin region. MS images have been acquired with a raster step of 75 µm. (A) Optical
Image. (B) Image reconstructed from XIC of m/z 273.076 (assigned to phloretin). (C,D,E) ICA
analysis for the ions at m/z 433.077 (assigned to quercetin-5S) and m/z 300.028 (assigned to
quercetin). (F,G,H) ICA analysis for the ions at m/z 417.082 (assigned to kaempferol-5S) and
m/z 285.040 (assigned to kaempferol).

94
Figure S3: Skin region. MS images have been acquired with a raster step of 100 µm. (A) Optical
Image. (B) Image reconstructed from XIC of m/z 447.093 (assigned to quercetin-rhamnoside).
(C) Image reconstructed from the XIC of m/z 273.076 (assigned to phloretin). Note the higher
intensity spot in correspondence of the cortical vascular system. (D,E,F) ICA analysis for the
ions at m/z 463.088 (assigned to quercetin-6S) and m/z 300.028 (assigned to quercetin). (G,H,I)
ICA analysis for the ions at m/z 433.077 (assigned to quercetin-5S) and m/z 300.028 (assigned to
quercetin).

95
Table S1: Differences in ppm between the theoretical and the measured mass for the polyphenol
glycosides detected in the three tissue sections (see Table 1). In the table only the metabolites
with confirmed assignment are included. The value for the observed mass is obtained by
combining all the spectra measured during the rastering of each tissue section.
Compound Theoretical Mass Observed Mass Mass difference (ppm)
Endocarp Region
Quercetin 300.0276 300.0270 2
kaempferol 285.0405 285.0397 2.7
Phloretin 273.0768 273.0759 3.3
phlor-6S 435.1297 435.1320 5.2
querc-rham 447.0933 447.0911 4.9
querc-5S 433.0776 433.0785 2.08
Skin Region: oblique section
Quercetin 300.0276 300.0276 0
kaempferol 285.0405 285.0404 0.35
Phloretin 273.0768 273.0767 0.37
querc-5S 433.0776 433.0755 4.8
querc-6S 463.0882 463.0857 5.4
Skin Region: transverse section
Quercetin 300.0276 300.0281 1.7
kaempferol 285.0405 285.0404 0.35

96
Phloretin 273.0768 273.0771 1.1
querc-5S 433.0776 433.0788 2.6
querc-6S 463.0882 463.0862 4.4

97
Appendix 2:
Quantification of malic, tartaric and citric acids in grape stem and grape leaf blade
Pith and out-pith-region (including xylem, phloem and periderms) were carefully separated, flash
frozen in liquid nitrogen, and ground in a cryo-mill (Retsch, Haan, Germany) respectively. One
gram of each was suspended in a fresh prepared extraction solution containing 1.2 ml
methanol/water (2:1, vol/vol) and 0.8 ml chloroform. The extract was mixed by vortex for 10 s
and sonicated for 10 min. The homogenate was centrifuged for 5 min at 5000 rpm at 4 oC. The
supernatant was transferred through a 0.22 µm PVDF filter (Millipore Corporation, USA),
leaving 1.5 ml total volume to a LCMS certified vials. Same method was used for extraction of
the three organic acids in grape leaf lamina and leaf vein.
Organic acids were analyzed using high performance anion exchange chromatography (HPAEC)
with suppressed conductivity detection (Dionex ICS-5000, Thermo Scientific). Briefly, An ion-
exchange OmniPac Pax100 column (4 x 250 mm) and OmniPac Pax100 (4 x 50 mm) guard
column were used to separate organic acids. A gradient mobile phase with a flow rate of 1.0
mL/min was applied using the following eluents: (A) a mixture of methanol (12%), ethanol (16%)
in DI water, (B) 0.1 M NaOH in DI water and (C) 1 M NaOH in DI water. Prior to organic acids
detection, eluents were suppressed by an anion suppressor (ASRS®
300, 4 mm, Thermo
Scientific). Pure organic acid standards were used to create the calibration curves for peak
identification and quantification.
Direct infusion ESI-MS of glutaric and adipic acids in grape stem
Six calibrant solutions were prepared by a series of 10 time-fold dilution of a mother solution
containing 2.5 μM/ml of glutaric and adipic acids. The 6 calibrant solutions were analyzed by a
Thermo-Fisher Scientific LTQ-Orbitrap XL mass spectrometer (Bremen, Germany) coupled with
an ESI source (Bremen, Germany). Typical instrumental parameters included: -120 V tube lens
voltage, -10 V capillary voltage, 2 kV spray voltage, 275 oC capillary temperature, 6 sheath gas
flow rate (arb), 2 micro scans, 200 ms MS injection time. Mass spectra for each calibrant were
acquired in full scan at negative mode over the m/z range of 50-200 for 0.5 min, with an
injection rate of 6 μl/s. Each calibrant was analyzed 6 times. Linear dynamic range for each

98
organic acid was determined by plotting its log-transformed concentration versus log-
transformed average signal intensity at each concentration. These curves were fit to a least
squares linear regression for each organic acid, the most linear R2
>0.999 (Fig S1).
Glutaric and adipic acids enriched grape stems were prepared as described in DESI imaging
experiment (b). Their extractions were performed as described for IC analysis. The extracts were
diluted until their signal intensities fell within the defined linear range, their concentrations in
pith and out pith were then estimated from the standard curves.
DESI imaging of organic acids in various grape tissues
Leaf blade, petiole, stem, node, rachis and receptacle were collected from the same shoot at post-
veraison stage for DESI imaging, in which leaf blade was imaged by imprinting method and the
other grape tissue types by direct DESI imaging. Sample preparation method for direct DESI
imaging was similar as described for grape stem except that the vacuum dehydration time varied
from 20 min to 1h depending on the tissue type. Totally 8 organic acids, including succinic,
malic, theronic, tartaric, shikimic, ascorbic and citric acids were imaged. Those 8 organic acids
have been confirmed both by their exact m/z by Orbitrap with the resolution set at 60,000 and by
comparison of their MS/MS to those of their standards (table S1). Instrumental and DESI source
settings were the same as described in DESI imaging of organic acids in grape stem.
Ion intensities of the 8 organic acids were extracted directly from DESI images of various grape
tissue samples, and were normalized against the sum of their ion intensities. Principal
Component Analysis was performed on normalized ion intensities of the 8 organic acids with
ChemometricsWithR package [1] to distinguish different tissue types.
References
1. Ron W. P. Chemometrics With R: Multivariate Data Analysis in the Natural Sciences and Life
Sciences. Springer press: Heidelberg, Germany.

99
Table S1. List of organic acids directly detected from grape tissue samples
Organic acids Molecular
formula
Measured m/z Theoretical m/z Mass accuracy
(ppm)
MS/MS
confirmed
Succinic [C4H6O4-H]- 117.01919 117.01933 -1.213 Yes
Malic [C4H6O5-H]- 133.01392 133.01425 -2.455 Yes
Threonic [C4H8O5-H]- 135.02968 135.02990 -1.604 Yes*
Tartaric [C4H6O6-H]- 149.00881 149.00916 -2.357 Yes
Shikimic [C7H10O5-H]- 173.04537 173.04555 -1.021 Yes
Ascorbic [C6H8O6-H]- 175.02480 175.02481 -0.034 Yes
Citric [C6H8O7-H]- 191.01930 191.01973 -2.229 Yes
Gluconic [C6H12O7-H]- 195.05059 195.05103 -2.235 Yes
*Due to the unavailability of threonic acid standard, the MS/MS data for this acid were compared with
those in literature

100
Figure S1. Dynamic ranges of glutaric and adipic acids obtained by direct infusion ESI-MS
method. The signal intensity and concentration are both log-transformed. Linear dynamic ranges
for both organic acids are between 10-4
and 10-1
dilution of 2.5 μM/ml mother solution.
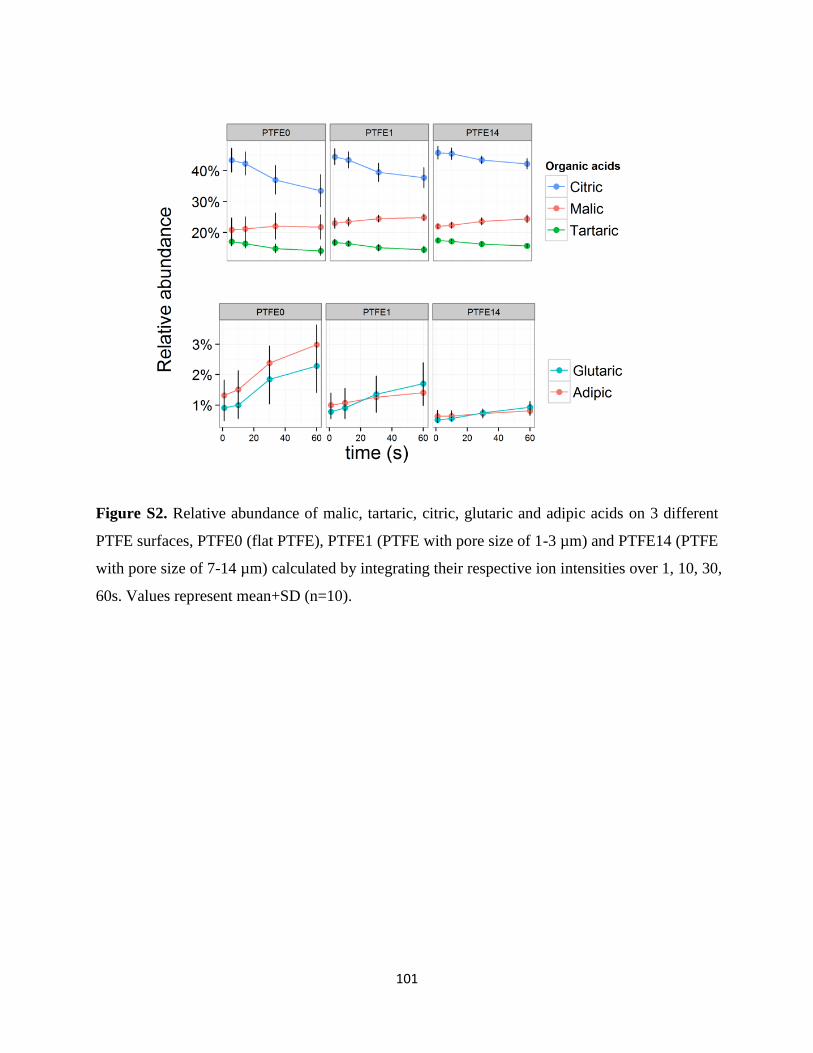
101
Figure S2. Relative abundance of malic, tartaric, citric, glutaric and adipic acids on 3 different
PTFE surfaces, PTFE0 (flat PTFE), PTFE1 (PTFE with pore size of 1-3 µm) and PTFE14 (PTFE
with pore size of 7-14 µm) calculated by integrating their respective ion intensities over 1, 10, 30,
60s. Values represent mean+SD (n=10).

102
Figure S3. DESI imaging of malic, tartaric and citric acids at negative mode in a one-year-old
grape stem which has been dipped into a glutaric and adipic acid solution for 1h. The color bar
represents TIC normalized ion intensity from 0 (blue) to 1(red).

103
Figure S4. Principal Component Analysis of data from eight organic acids extracted from DESI
images in 6 different grape tissue types (n=6). The first 2 PCs were selected for the best
visualization of grape tissue separations; together they accounted for 98.1% of the total variance.
Blue arrows show the projections of the three most important organic acids in defining the tissue
separations into the 2 PCs.

104
Appendix 3:
Figure S1. DESI images of tartrate in grape stem. M-2H denotes doubly charged tartrate dianions,
M-H singly deprotonated ion and M-2H+K potassium adduct ions.

105
Figure S2. DCA2-
yields as observed in ESI and DESI ion-sources with Na+ being the counterion.
Dianion yields were calculated by the ratio of abundance of dianions to those of their respective
deprotonated singly charged ions. Values represent mean±SD (n=6). ‘OH-
yes’ is OH-
excess
group (KOH:DCA, 3:1,mol/mol) and ‘OH-
no’ is no excess OH- group (KOH:DCA, 2:1,
mol/mol).

106
Figure S3. DCA2-
yields as observed in ESI and DESI ion-sources with Li+ being the counterion.
Dianion yields were calculated by the ratio of abundance of dianions to those of their respective
deprotonated singly charged ions. Values represent mean±SD (n=6). ‘OH-
yes’ is OH-
excess
group (KOH:DCA, 3:1,mol/mol) and ‘OH-
no’ is no excess OH- group (KOH:DCA, 2:1,
mol/mol).
.