marketo investor update -...
TRANSCRIPT
© Copyright 2015. Marketo, Inc. All rights reserved.
Marketo Investor UpdateFebruary 2015
© Copyright 2015. Marketo, Inc. All rights reserved.
Safe HarborThis presentation contains forward-looking statements. These forward-looking statements include general statements about our opportunities for growth, our achievement of long-term objectives and specific statements about our GAAP and non-GAAP financial targets. The achievement or success of the matters covered by such forward-looking statements involves risks, uncertainties and assumptions. If any such risks or uncertainties materialize or if any of the assumptions prove incorrect, the company’s results could differ materially from the results expressed or implied by the forward-looking statements we make.
The risks and uncertainties that could cause actual results to differ from the results predicted include, but are not limited to, risks associated with: possible fluctuations in the company’s financial and operating results; the company’s rate of growth and anticipated revenue run rate, including the company’s ability to convert deferred revenue and unbilled deferred revenue into revenue and, as appropriate, cash flow, and the continued growth and ability to maintain deferred revenue and unbilled deferred revenue; errors, interruptions or delays in the company’s service or the company’s Web hosting; the company’s ability to maintain and expand its customer base; breaches of the company’s security measures; the financial impact of any previous and future acquisitions; the nature of the company’s business model; the company’s ability to continue to release, and gain customer acceptance of, new and improved versions of the company’s service; successful customer deployment and utilization of the company’s existing and future services; changes in the company’s sales cycle; competition; relationships with platform providers; various financial aspects of the company’s subscription model; unexpected increases in attrition or decreases in new business; the markets in which the company operates, including emerging and other international markets; unique aspects of entering or expanding in international markets, the company’s ability to hire, retain and motivate employees and manage the company’s growth; changes in the company’s customer base; technological developments; regulatory developments; litigation related to intellectual property and other matters, and any related claims, negotiations and settlements; unanticipated changes in the company’s effective tax rate; fluctuations in the number of shares we have outstanding and the price of such shares; foreign currency exchange rates; collection of receivables; interest rates; factors affecting our deferred tax assets and ability to value and utilize them; the risks and expenses associated with the company’s real estate and office facilities space; and general developments in the economy, financial markets, and credit markets.
Further information about factors that could affect the company’s financial results is included in the reports on Forms 10-K, 10-Q and 8-K and in other filings the company makes with the Securities and Exchange Commission from time to time.
Marketo assumes no obligation and does not intend to update these forward-looking statements, except as required by law.
2
© Copyright 2015. Marketo, Inc. All rights reserved.
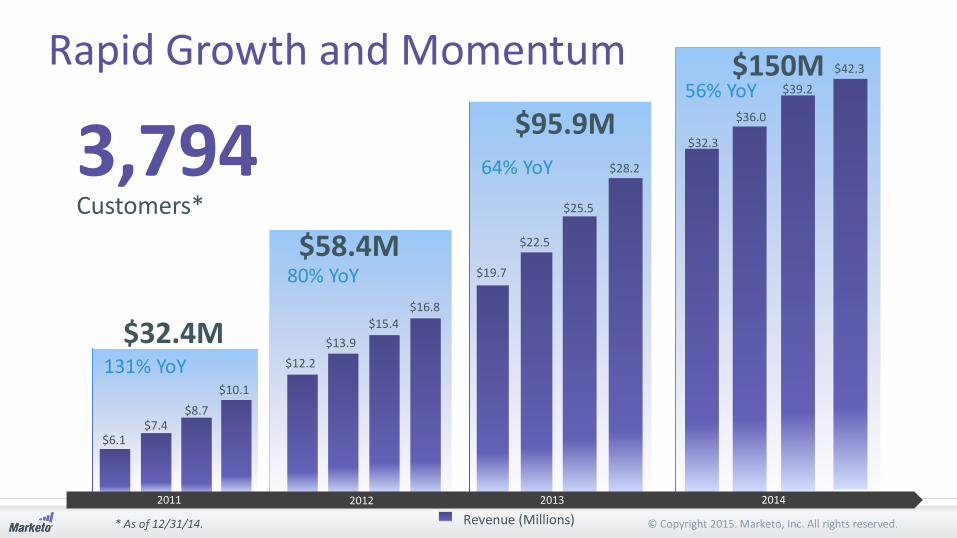
Rapid Growth and Momentum
3,794Customers*
Revenue (Millions)
$6.1$7.4
$8.7
$10.1
$12.2
$13.9
$15.4
$16.8
$19.7
$58.4M
$32.4M
2012
131% YoY
80% YoY
$22.5
$25.5
$28.2
$95.9M
64% YoY
$32.3
56% YoY$36.0
$39.2
$42.3$150M
2011 2013 2014
* As of 12/31/14.
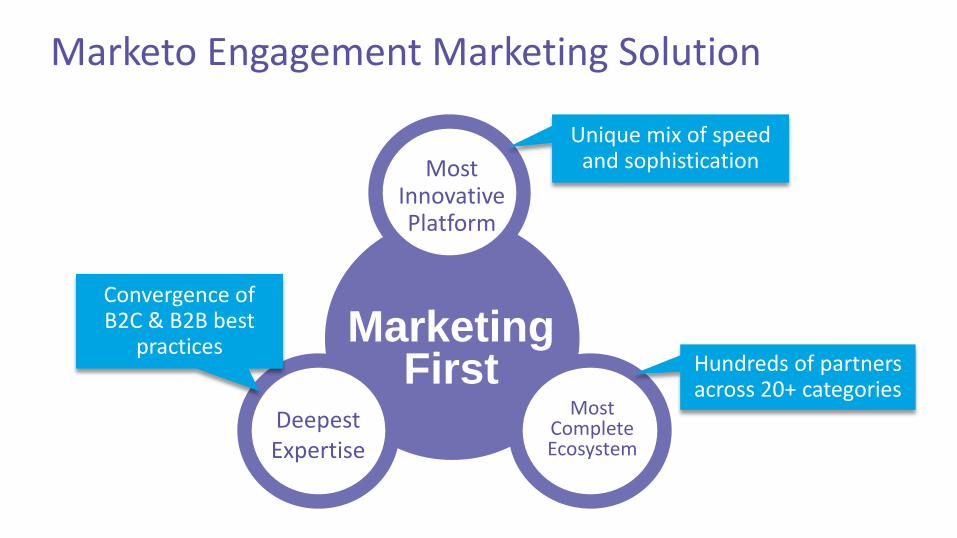
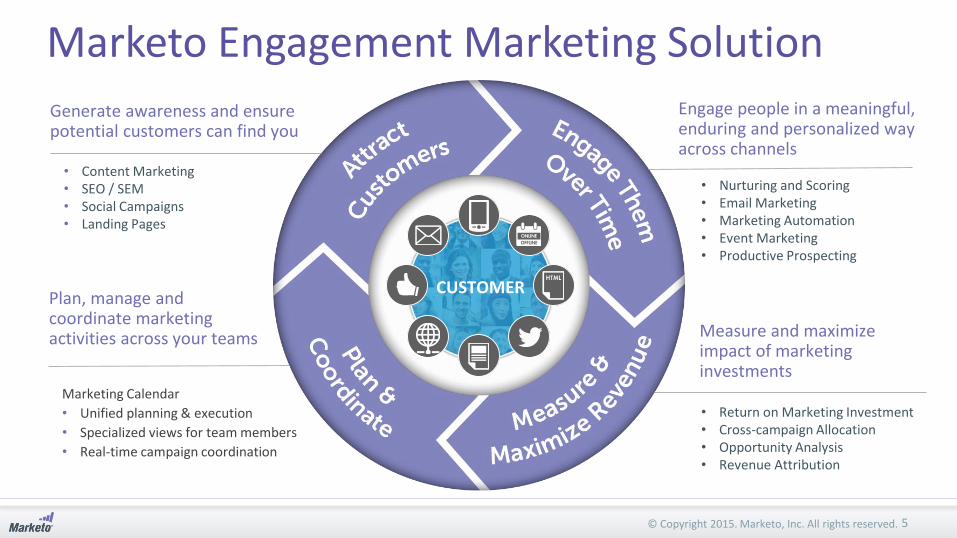
Marketo Engagement Marketing Solution
MarketingFirst
Most CompleteEcosystem
Most Innovative Platform
DeepestExpertise
Unique mix of speed and sophistication
Convergence of B2C & B2B best
practices Hundreds of partners across 20+ categories
© Copyright 2015. Marketo, Inc. All rights reserved.
CUSTOMER
Marketo Engagement Marketing SolutionEngage people in a meaningful, enduring and personalized way across channels
Measure and maximize impact of marketing investments
Generate awareness and ensure potential customers can find you
Plan, manage andcoordinate marketing activities across your teams
Marketing Calendar
• Unified planning & execution
• Specialized views for team members
• Real-time campaign coordination
• Content Marketing• SEO / SEM• Social Campaigns• Landing Pages
• Nurturing and Scoring• Email Marketing• Marketing Automation• Event Marketing• Productive Prospecting
• Return on Marketing Investment• Cross-campaign Allocation• Opportunity Analysis• Revenue Attribution
5
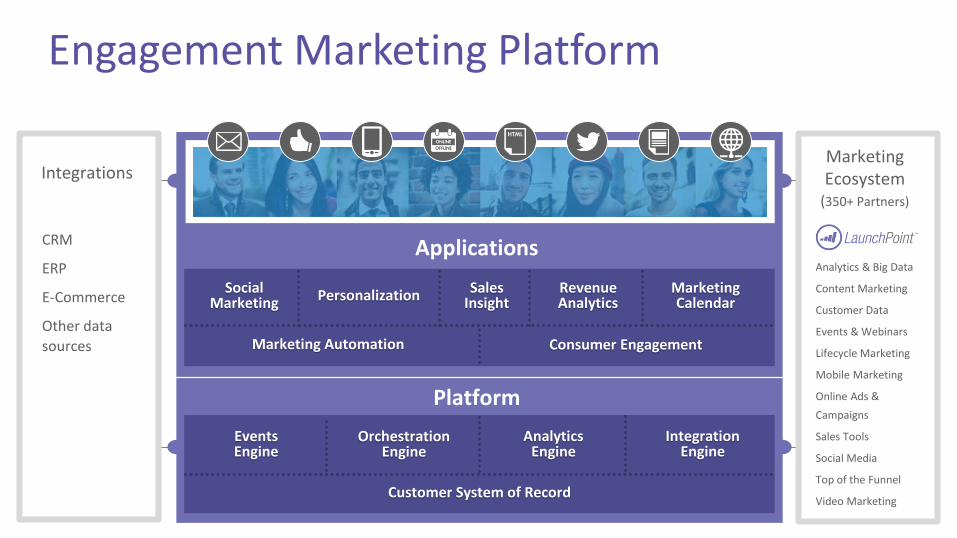
Engagement Marketing Platform
Integrations
CRM
ERP
E-Commerce
Other data
sources
PersonalizationSocial Marketing
Revenue Analytics
Customer System of Record
Marketing Automation Consumer Engagement
Events Engine
OrchestrationEngine
AnalyticsEngine
IntegrationEngine
Applications
Platform
Marketing Calendar
Sales Insight
MarketingEcosystem
(350+ Partners)
Analytics & Big Data
Content Marketing
Customer Data
Events & Webinars
Lifecycle Marketing
Mobile Marketing
Online Ads &
Campaigns
Sales Tools
Social Media
Top of the Funnel
Video Marketing
© Copyright 2015. Marketo, Inc. All rights reserved.
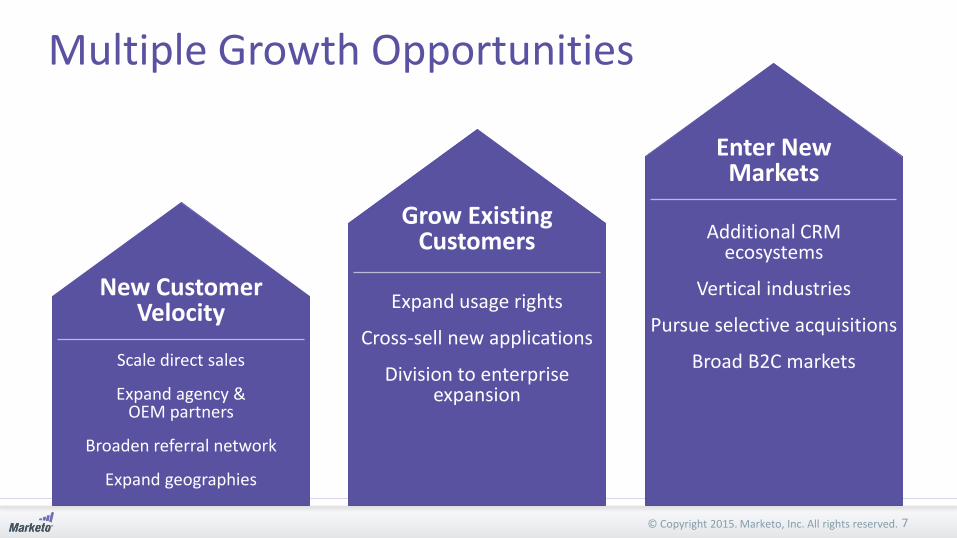
Multiple Growth Opportunities
Scale direct sales
Expand agency & OEM partners
Broaden referral network
Expand geographies
New CustomerVelocity
Grow ExistingCustomers
Expand usage rights
Cross-sell new applications
Division to enterprise expansion
Enter NewMarkets
Additional CRM ecosystems
Vertical industries
Pursue selective acquisitions
Broad B2C markets
7
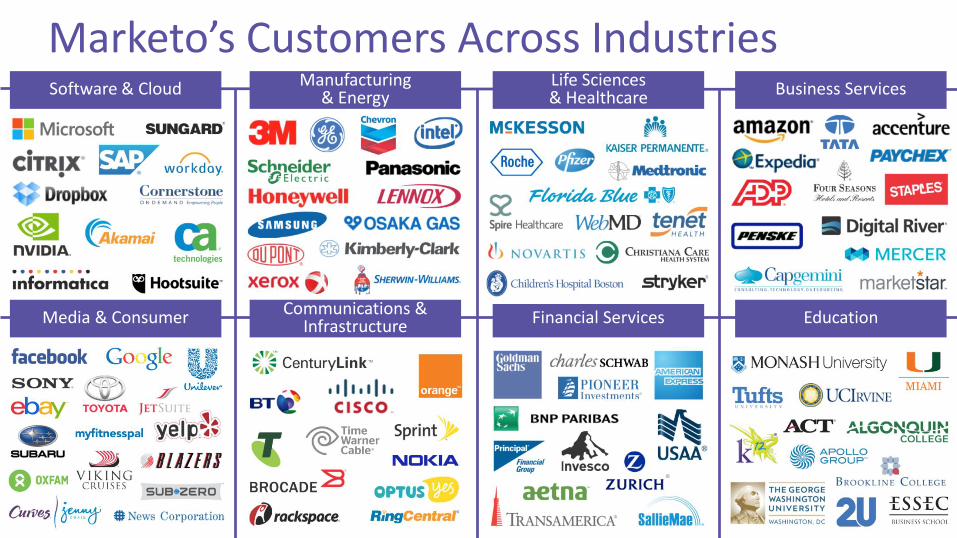
Marketo’s Customers Across IndustriesLife Sciences & Healthcare
Manufacturing & EnergySoftware & Cloud Business Services
Financial ServicesCommunications & InfrastructureMedia & Consumer Education
© Copyright 2015. Marketo, Inc. All rights reserved.
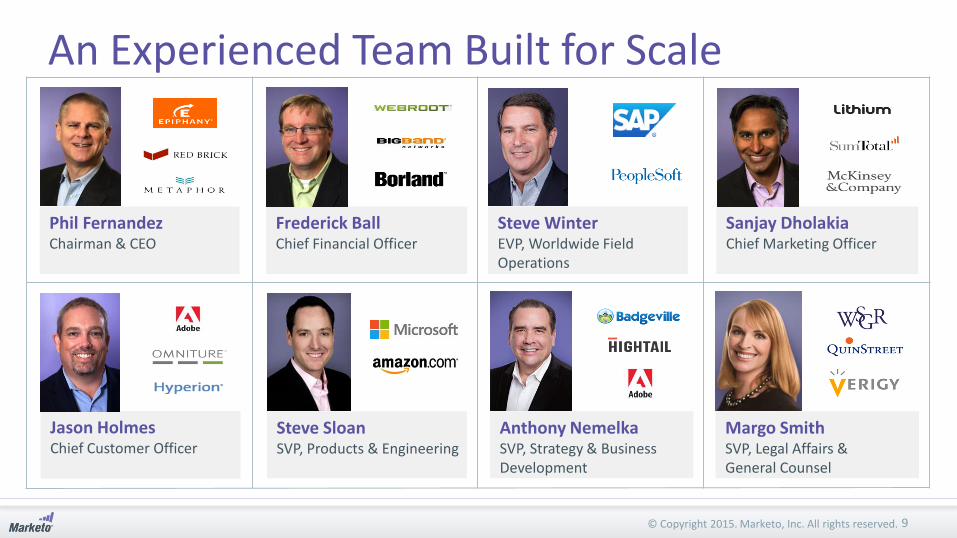
Phil Fernandez Chairman & CEO
An Experienced Team Built for Scale
Jason HolmesChief Customer Officer
Frederick BallChief Financial Officer
Steve SloanSVP, Products & Engineering
Sanjay DholakiaChief Marketing Officer
Anthony NemelkaSVP, Strategy & Business Development
Margo SmithSVP, Legal Affairs & General Counsel
Steve WinterEVP, Worldwide Field Operations
9
© Copyright 2015. Marketo, Inc. All rights reserved.
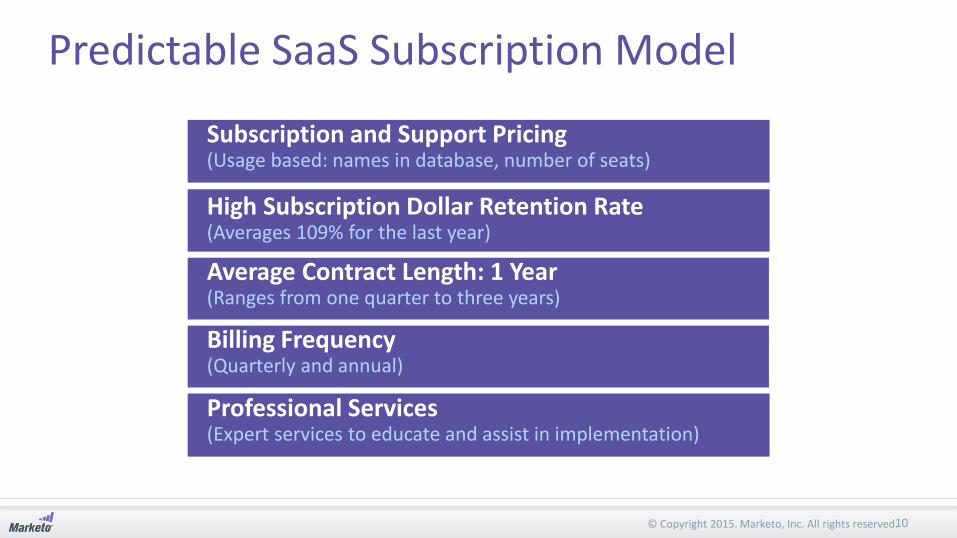
Predictable SaaS Subscription Model
Average Contract Length: 1 Year (Ranges from one quarter to three years)
Billing Frequency (Quarterly and annual)
Subscription and Support Pricing (Usage based: names in database, number of seats)
High Subscription Dollar Retention Rate (Averages 109% for the last year)
Professional Services (Expert services to educate and assist in implementation)
10

Revenue Measures
SMB / Enterprise Subscription Mix International Contribution
0%
2%
4%
6%
8%
10%
12%
14%
16%
18%
20%
$0
$5
$10
$15
$20
$25
$30
$35
$40
In M
illio
ns
SMB Enterprise
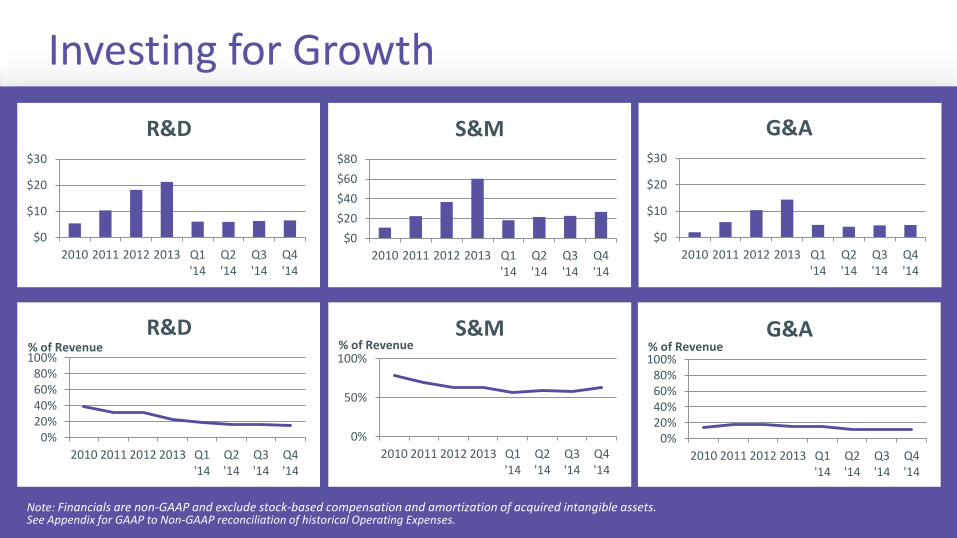
Investing for Growth
% of Revenue
Note: Financials are non-GAAP and exclude stock-based compensation and amortization of acquired intangible assets.See Appendix for GAAP to Non-GAAP reconciliation of historical Operating Expenses.
$0
$10
$20
$30
2010 2011 2012 2013 Q1'14
Q2'14
Q3'14
Q4'14
R&D
$0
$20
$40
$60
$80
2010 2011 2012 2013 Q1'14
Q2'14
Q3'14
Q4'14
S&M
$0
$10
$20
$30
2010 2011 2012 2013 Q1'14
Q2'14
Q3'14
Q4'14
G&A
0%20%40%60%80%
100%
2010 2011 2012 2013 Q1'14
Q2'14
Q3'14
Q4'14
R&D
0%
50%
100%
2010 2011 2012 2013 Q1'14
Q2'14
Q3'14
Q4'14
S&M% of Revenue
0%20%40%60%80%
100%
2010 2011 2012 2013 Q1'14
Q2'14
Q3'14
Q4'14
G&A% of Revenue

© Copyright 2015. Marketo, Inc. All rights reserved.
Long Term ModelACTUAL
TARGET MODEL2011 2012 2013 2014
Gross Margin 54% 58% 62% 70% 75% - 80%
% of revenue
R&D 32% 31% 22% 17% 12% - 15%
S&M 70% 63% 63% 60% 35% - 40%
G&A 18% 18% 15% 12% 7% - 10%
Income (Loss) from Operations
(65)% (53)% (38)% (19%) 20%
Note: Financials are non-GAAP and exclude stock-based compensation, amortization of acquired intangible assets, litigation settlement and integration costs.See Appendix for GAAP to Non-GAAP reconciliations of historical financial results. Targets reflect long-term goals.
13
© Copyright 2015. Marketo, Inc. All rights reserved.
Marketo Investor UpdateAppendix
© Copyright 2015. Marketo, Inc. All rights reserved.
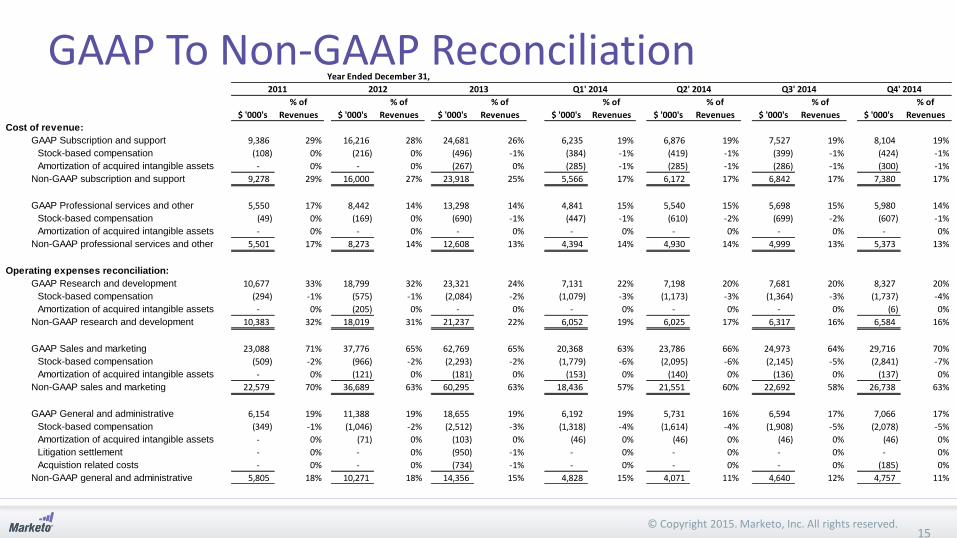
GAAP To Non-GAAP Reconciliation
15
$ '000's
% of
Revenues $ '000's
% of
Revenues $ '000's
% of
Revenues $ '000's
% of
Revenues $ '000's
% of
Revenues $ '000's
% of
Revenues $ '000's
% of
Revenues
Cost of revenue:
GAAP Subscription and support 9,386 29% 16,216 28% 24,681 26% 6,235 19% 6,876 19% 7,527 19% 8,104 19%
Stock-based compensation (108) 0% (216) 0% (496) -1% (384) -1% (419) -1% (399) -1% (424) -1%
Amortization of acquired intangible assets - 0% - 0% (267) 0% (285) -1% (285) -1% (286) -1% (300) -1%
Non-GAAP subscription and support 9,278 29% 16,000 27% 23,918 25% 5,566 17% 6,172 17% 6,842 17% 7,380 17%
GAAP Professional services and other 5,550 17% 8,442 14% 13,298 14% 4,841 15% 5,540 15% 5,698 15% 5,980 14%
Stock-based compensation (49) 0% (169) 0% (690) -1% (447) -1% (610) -2% (699) -2% (607) -1%
Amortization of acquired intangible assets - 0% - 0% - 0% - 0% - 0% - 0% - 0%
Non-GAAP professional services and other 5,501 17% 8,273 14% 12,608 13% 4,394 14% 4,930 14% 4,999 13% 5,373 13%
Operating expenses reconciliation:
GAAP Research and development 10,677 33% 18,799 32% 23,321 24% 7,131 22% 7,198 20% 7,681 20% 8,327 20%
Stock-based compensation (294) -1% (575) -1% (2,084) -2% (1,079) -3% (1,173) -3% (1,364) -3% (1,737) -4%
Amortization of acquired intangible assets - 0% (205) 0% - 0% - 0% - 0% - 0% (6) 0%
Non-GAAP research and development 10,383 32% 18,019 31% 21,237 22% 6,052 19% 6,025 17% 6,317 16% 6,584 16%
GAAP Sales and marketing 23,088 71% 37,776 65% 62,769 65% 20,368 63% 23,786 66% 24,973 64% 29,716 70%
Stock-based compensation (509) -2% (966) -2% (2,293) -2% (1,779) -6% (2,095) -6% (2,145) -5% (2,841) -7%
Amortization of acquired intangible assets - 0% (121) 0% (181) 0% (153) 0% (140) 0% (136) 0% (137) 0%
Non-GAAP sales and marketing 22,579 70% 36,689 63% 60,295 63% 18,436 57% 21,551 60% 22,692 58% 26,738 63%
GAAP General and administrative 6,154 19% 11,388 19% 18,655 19% 6,192 19% 5,731 16% 6,594 17% 7,066 17%
Stock-based compensation (349) -1% (1,046) -2% (2,512) -3% (1,318) -4% (1,614) -4% (1,908) -5% (2,078) -5%
Amortization of acquired intangible assets - 0% (71) 0% (103) 0% (46) 0% (46) 0% (46) 0% (46) 0%
Litigation settlement - 0% - 0% (950) -1% - 0% - 0% - 0% - 0%
Acquistion related costs - 0% - 0% (734) -1% - 0% - 0% - 0% (185) 0%
Non-GAAP general and administrative 5,805 18% 10,271 18% 14,356 15% 4,828 15% 4,071 11% 4,640 12% 4,757 11%
Year Ended December 31,
Q3' 2014 Q4' 2014Q1' 2014 Q2' 20142011 2012 2013