marketing research final presentation - … research final presentation iphone alex negle november...
TRANSCRIPT

Marketing Research Final Presentation
iPhone
Alex Negle
November 31st 2011

Table of Contents
• Overview: – Executive Summary
– Purpose
– Methods
– Findings • Secondary Research
• Primary Research – Qualitative
– Quantitative
– Conclusion

Executive Summary
• The iPhone had 80% unaided awareness in the online survey and 90% in the paper survey
• Ease of use was the most important factor when it came to smart phones
• The iPhone’s weakest quality was affordability

Purpose
• Information found while doing this research is used for Marketing Research (BUS 1535)
• The Information was collected to study consumers attitudes towards the iPhone
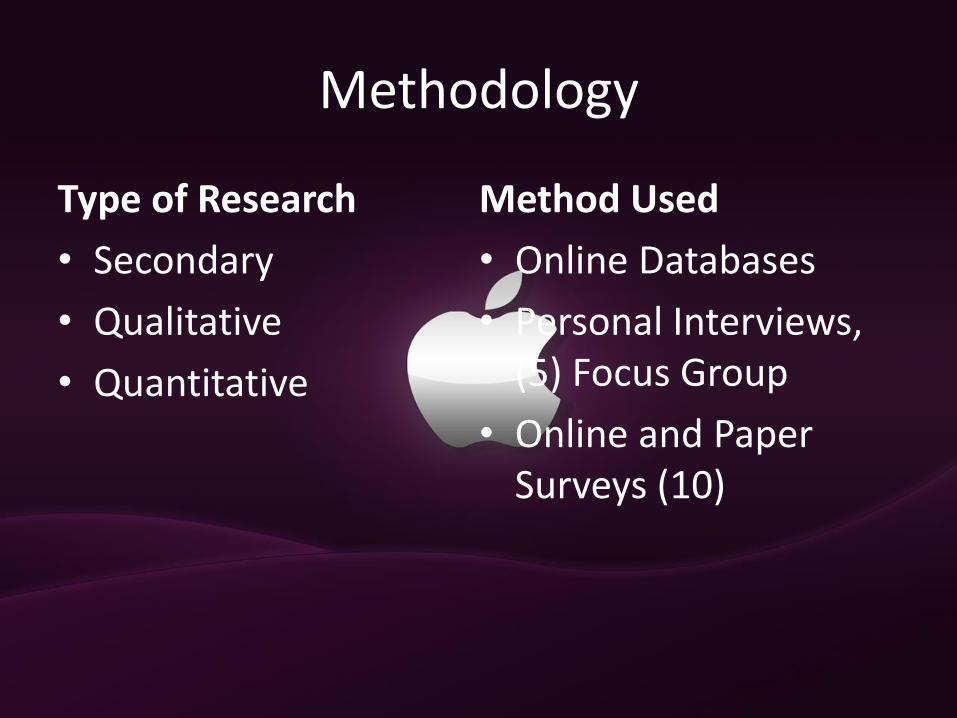
Methodology
Type of Research
• Secondary
• Qualitative
• Quantitative
Method Used
• Online Databases
• Personal Interviews, (5) Focus Group
• Online and Paper Surveys (10)

Findings: Secondary Research
• Headquarters
– Cupertino, California
• Top Competitors:
– HTC
– Research in Motion
– Motorola

5 Year Sales Trends Revenue 2006 2007 2008 2009 2010
Industry (mm)
$169,082 181,937
189,474 191,501 196,044
Apple (mm) $19,315 24,578 37,491 42,905 65,225
iPhone (mm)
$6,742 13,033 25,179
HTC (mm) $104,816 118,579 152,558 144,880 275,046
Android (mm)
$64,694
RIM (mm) $6,009 11,065 14,953
Motorola (mm)
$31,810 23,373 17,099 11,050 11,460
Sources: investor.apple.com/financials Ibisworld.com (NAICS Code: 51332 wireless telecommunications carriers in the US HTC.com RIM.com Motorola.com

5 Year Sales Trends
0
50,000
100,000
150,000
200,000
250,000
300,000
2006 2007 2008 2009 2010
Industry
Apple
HTC
Research In Motion
Motorola
Sources: investor.apple.com/financials Ibisworld.com (NAICS Code: 51332 wireless telecommunications carriers in the US HTC.com RIM.com Motorola.com

Mean and Median
0
20,000
40,000
60,000
80,000
100,000
120,000
140,000
160,000
180,000
200,000
Apple HTC RIM Motorola Industry
37,491
152,558
11,065 17,099
189,474
37,902
158,575
10,675 18,958
151,825
Median
Mean

Market Share
25%
33%
29%
13%
Market Share
Apple
HTC
RIM
Other
www.ibisworld .com

Qualitative Data: Personal Interview (unaided)
• 4 – iPhone
• 1 - Droid
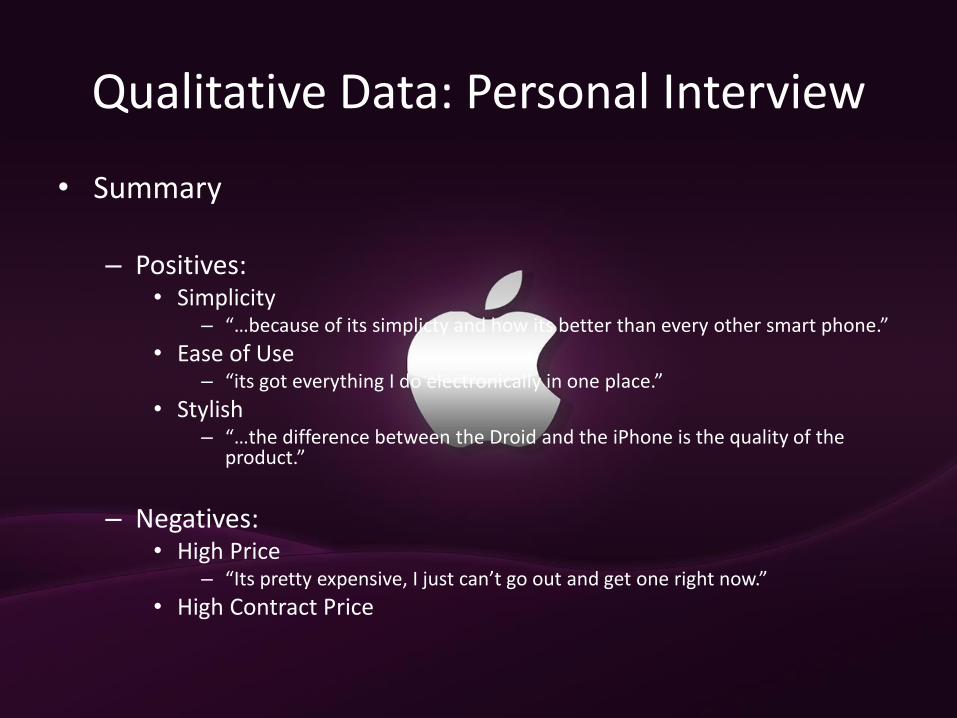
Qualitative Data: Personal Interview
• Summary – Positives:
• Simplicity – “…because of its simplicty and how its better than every other smart phone.”
• Ease of Use – “its got everything I do electronically in one place.”
• Stylish – “…the difference between the Droid and the iPhone is the quality of the
product.”
– Negatives: • High Price
– “Its pretty expensive, I just can’t go out and get one right now.”
• High Contract Price

Qualitative Data: Personal Interview
• Reasons to buy the iPhone – Simplicity
– Quality of Product
– Versatility
• Reasons to not buy the iPhone – Do not already have a smart phone
– Price
• What can Apple do to better the product? – Make it more affordable

Qualitative Data: Focus Group
• Summary – Positives:
• Easy of use • Celebrity Appeal • Brand Image • Geared for fun
– Negatives: • No 3G hotspots • No BBM • Boring shape • Susceptible to breaking

Qualitative Data: Focus Group
• What would you do to change the product?
– Slide out Querty
– Fear of breaking screen
– Differentiate from Ipod Touch and iPad
• “If you have an iPhone why would you buy an iPad, or if you had an iPad why would you buy an iPhone…”
• “I feel like they keep making the same products.”

Quantitative: Traditional and Online Surveys
• Sample Size Estimate – 2010 US population: 220,958,853
• Ages 18 – • Male and Female
– 95% Confidence Interval – +/- 5% Error
• Sample Size Needed: 384
www.census.gov Creative Research Systems

Unaided Awareness
90%
70%
50%
5%
0%
10%
20%
30%
40%
50%
60%
70%
80%
90%
100%
Apple Droid Blackberry Samsung
Awareness
Awareness
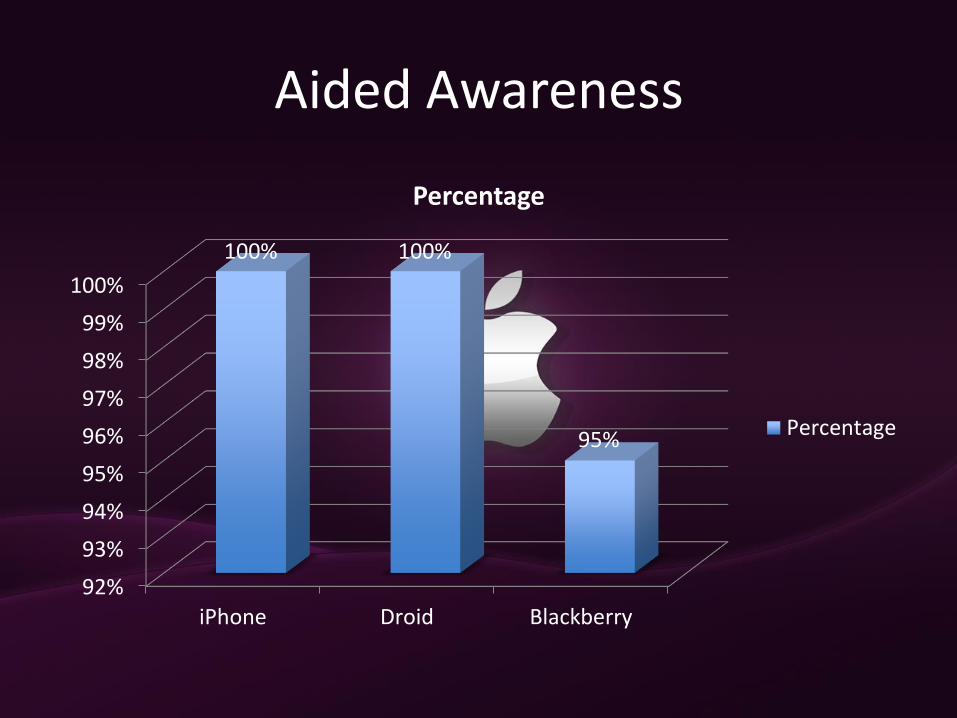
Aided Awareness
92%
93%
94%
95%
96%
97%
98%
99%
100%
iPhone Droid Blackberry
100% 100%
95%
Percentage
Percentage

Have a Smart Phone
85%
15%
Currently Own a Smart Phone
Yes
No

Psychographics
3
2.9
4.1
3.7
0 1 2 3 4 5
Artistic
Conservative
Use Cell Phones Often
Use Social Media Often
Average
Average

Constant Sum (Averages)
15.5
32.5
16.5
23
11.5
0%
10%
20%
30%
40%
50%
60%
70%
80%
90%
100%
Constant Sum
Attractive
Affordable
Stylish
Ease of Use
Image

iPhone Perceptions (1 being the highest, 5 being the
lowest)
2.3
3.19
2.7
2.49
0 0.5 1 1.5 2 2.5 3 3.5
Prefered
Superior
Reasonably Priced
Easier
Average
Average

Rank Order (1 being the highest, 5 being the lowest)
3.55
2.36
1.27
4.82
3
0
1
2
3
4
5
6
Average
Average
The iPhone was the most preferred on paper with mean being 2.3

Average Expected Prices
• iPhone 4
– $293.3
• iPhone 3G
– $135.1
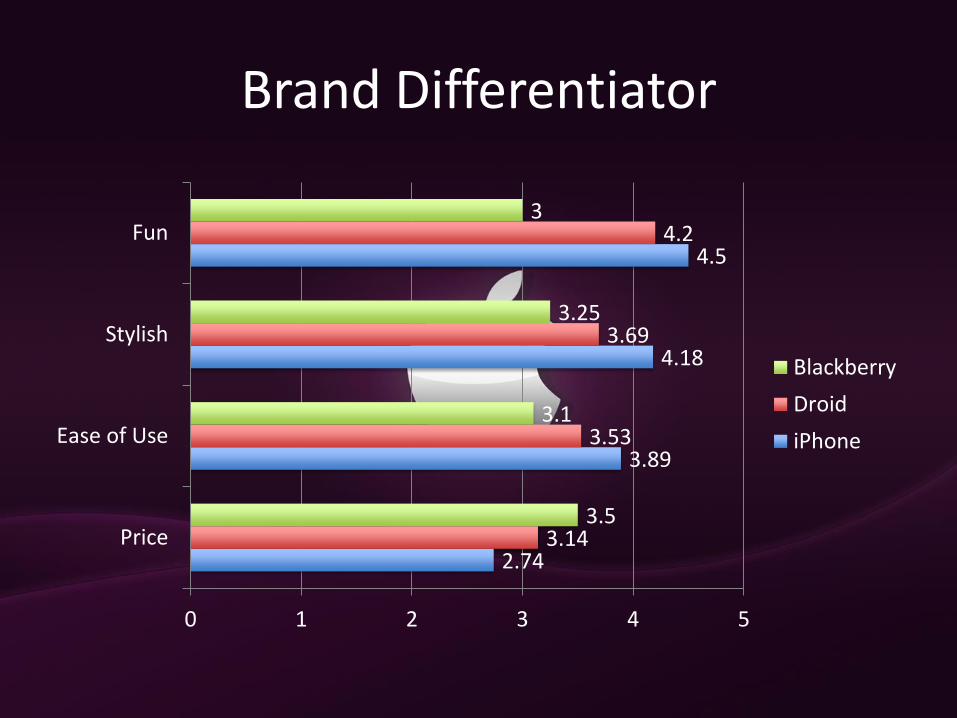
Brand Differentiator
2.74
3.89
4.18
4.5
3.14
3.53
3.69
4.2
3.5
3.1
3.25
3
0 1 2 3 4 5
Price
Ease of Use
Stylish
Fun
Blackberry
Droid
iPhone

Demographics: Gender & Age
16
3
0
2
4
6
8
10
12
14
16
18
Male Female
Responses
Responses
1
2
7
0
1
2
3
4
5
6
7
8
19 20 21
Age
Age
Majors Surveyed
• 2 Education Majors
• 4 Business Majors
• 1 Geology Major
• 2 Engineering Majors
• 1 Communications Major

Demographics: Income
0 0
21%
31%
41%
Income
Under $15,000
$15,000 - $24,999
$25,000 - $34,999
$50,000 - $74,999
$75,000 - $99,999
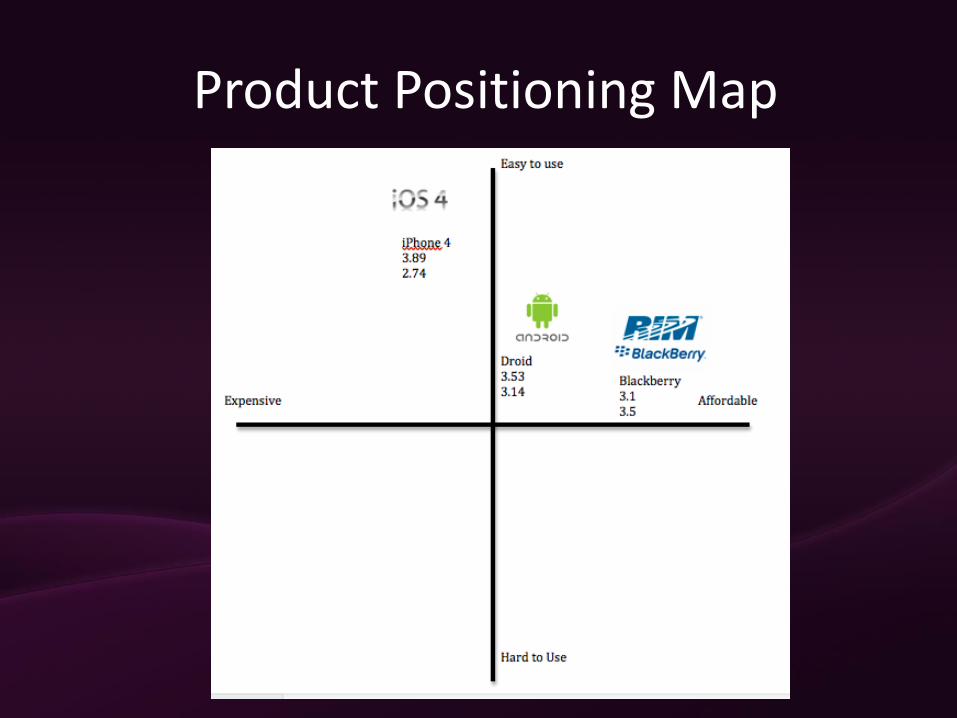
Product Positioning Map

Conclusions and Implications
• The iPhone has outstanding brand awareness
• General attitude is that its too expensive • Believed price - $293
• Actual price - $200
• Ranked significantly Higher in all other category motivators

Appendix
Interview 1 Interview 2 Interview 3
Interview 4 Interview 5 Focus Group

Appendix
• Online Survey
– https://new.qualtrics.com/ControlPanel/?ClientAction=ChangePage&s=UserSurveysSection&ss=&sss
• Smart Phone Survey Results
• IRB Consent Form
• Online Survey Report

Questions?