marketing research
DESCRIPTION
Marketing Research. Aaker, Kumar, Day and Leone Ninth Edition Instructor’s Presentation Slides. Sales data. Marketing data. Advertising data. Surveys. Chapter Five. Standardized Sources of Marketing Data. Growth of Standardized Sources. Contributing Factors:. - PowerPoint PPT PresentationTRANSCRIPT

Marketing ResearchAaker, Kumar, Day and LeoneNinth EditionInstructor’s Presentation Slides

Chapter Five
2
Standardized Sources of Marketing Data
Marketing Research 10th Edition http://www.drvkumar.com/mr10/
Advertisingdata
Sales data
Surveys
Marketingdata

Growth of Standardized Sources
3
Marketing Research 10th Edition http://www.drvkumar.com/mr10/
Contributing Factors:

Audits and Surveys: National Market Audit• Bi-monthly audit focused on products irrespective of
the type of outlet carrying the product
4
Marketing Research 10th Edition http://www.drvkumar.com/mr10/
Retail Store Audits• Every two months a team of auditors from a research firm
visits a sample of stores to count the inventory on hand and record deliveries to the store since the last visit

Nielsen Retail Index• Nielsen’s auditing services cover four reporting groups:
▫ Grocery products
▫ Drugs
▫ Other merchandise
▫ Alcoholic beverages
5
Marketing Research 10th Edition http://www.drvkumar.com/mr10/
• Contents of a Nielsen Store Audit Report
▫ Sales
▫ Distribution
▫ Selling prices
▫ Retailer support
▫ Media advertising
▫ Special analyses

Consumer Purchase PanelsTo cover the gap between store audits/warehouse withdrawal services and actual purchases, two methods of data collection are used:
Home Audit Approach
▫ Panel member agrees to permit an auditor to check the household stocks
of certain product categories at regular intervals
Mail Diary Method
▫ Panel member records the details of each purchase and returns the
diary by mail at regular intervals
6
Marketing Research 10th Edition http://www.drvkumar.com/mr10/

Advantages & Limitations of Consumer Panels
7
Marketing Research 10th Edition http://www.drvkumar.com/mr10/

Scanner Services
Benefits of Scanner-Based Audit Services:
8
Marketing Research 10th Edition http://www.drvkumar.com/mr10/

Scanner Services (cont.)
9
Weekly results from scanner service
Marketing Research 10th Edition http://www.drvkumar.com/mr10/
Weekly results from scanner service
Applying scanner data

RFID• Radio Frequency Identification Technology may replace the
bar codes.
• Utilizes a tiny silicon chip to store information; a small transmitter then sends this information to a scanner.
• Advantages over UPC:
▫ The ability to store more information
▫ The ability to change the information on the tag
▫ The ability to transmit all the information on the chip to a scanner without clear line of sight
10
Marketing Research 10th Edition http://www.drvkumar.com/mr10/

Single-source Systems
• Usually set up in self-contained communities with their own newspapers and cable TV and are roughly representative of the demographics of the country
• A test panel of community households is recruited and monitored for recording exposure to programming and specific commercials
• Each member is provided an identification card for presenting at scanner-equipped stores
11
Marketing Research 10th Edition http://www.drvkumar.com/mr10/
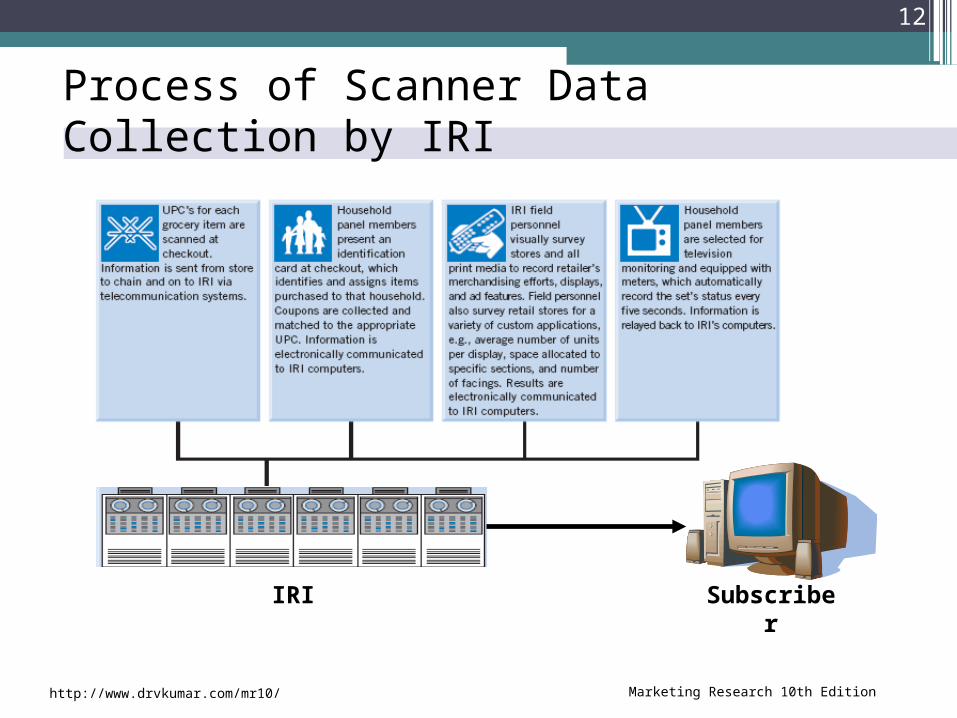
Process of Scanner Data Collection by IRI
12
IRI
Marketing Research 10th Edition http://www.drvkumar.com/mr10/
Subscriber
Advantages and Disadvantages of Single Source Systems
• Advantages ↑ Availability of extensive pre-test records
↑ Immediate availability of test results
↑ Ability to compare purchases of households prior to and after exposure to the message
↑ Ability to control settings
• Disadvantages↓ Can track purchases only at stores equipped with
scanners
↓ No information on whether viewers actually watch or just leave the TV on
↓ Chance of biased results
13
Marketing Research 10th Edition http://www.drvkumar.com/mr10/

Expert Systems Based on Single-source Services• Since users of scanner data are flooded with massive amounts
of data, expert systems are used to help the users understand the data quickly
• Examples of Expert Systems Are:▫ Information Resources, Inc.
Apollo Space Management Software Cover Story Sales Partner
▫ A. C. Nielsen Promotion Stimulator Spotlight Sales Advisor
14
Marketing Research 10th Edition http://www.drvkumar.com/mr10/

Media Related Standardized Sources
15
Marketing Research 10th Edition http://www.drvkumar.com/mr10/

Nielsen Television Index (NTI)
• Rating – Percent of all households that have at least one TV set turned to a program for at least 6 of every 15 minutes that the program is telecast
• Share – Percent of households that have a TV set that is tuned to a specific program at a specific time
16
Marketing Research 10th Edition http://www.drvkumar.com/mr10/
delivered audience target ofNumber
commercial a ofCost CPM
Applications of Standardized Data Sources
17 Marketing Research 10th Edition http://www.drvkumar.com/mr10/
17