market value and spatial structijre of delhi: an econometric...
TRANSCRIPT

CHAPTER-9
MARKET VALUE AND SPATIAL STRUCTIJRE OF DELHI:
AN ECONOMETRIC ANALYSIS
In the previous chapters, the Market Value Rates (MV Rates) were analysed temporally
and spatially. In the present chapter, the relation between MV Rates and spatial structure of Delhi
has been analysed.
A Simple Model Of Urban Spatial Structure
One of the models of urban spatial structure defined in terms of land values is based on
assumptions about spatial interactions that are of typical gravity model form. This postulates a
definite inverse distance effect and is capable of a series of mathematical forms. These forms are
portrayed in the graph given below, which is reproduced from the Dictionary of Human Geography,
ed. R.J.Johnston (1981).
------
----- double log models
--- single log models
..............................
',.,!areto model : loglij = a-b log Dij ......... .......
....... .......
'- log -normal model : log Iij = a-b (log Dij)2
', " ' ' ....... "
....... ' '· ' Square-root exponential model: log Iij = a-b Dij1!2
" " ' '\ " '\ " '\ exponential model : Iij ~ a-b Dij
.......... ' \ normal model : log lij = a-b Dij2 \
~ ', \ untransformed data : Iij = Dij
distance (Dij)
distance -decay curves and transformations
194m

Chapter-9 MARKET VALUE AND SPATIAL STRUCTURE OF DELHI :ANECONOMETRICANALYSJS
It is assumed in the model of structure of land values that all productive activities take
place at the centre within the city and that the periphery of the city is marked by influence of the
' price of agricultural land. The central place is preferred since it has the best accessibility to all
other locations within the city. Hence, the centre commands the highest profitability for all
productive activities which <kpcnd on the urban market. I Ref: Urban Economics-- Analysis and
Policy, R. W. Wickerman ( 1985) p 4 7J.
For all types of land-users, the central sites, therefore, will be more attractive than other
locations. For retailers, the accessibility to their shops enables them to tap the largest possible
potential; for manufacturers, the centrality minimizes the total costs of assembling and distributive
operations; and for householders, the cost of commuting is minimized due to proximity to the
centre.
Geometrically, relatively there will be few central sites in relation to the total space
available. This leads to intense competition for central sites and prices offered for them will be
higher than those offered for peripheral sites. The ground rent accruing to each site may, thus, be
seen simply as a charge for utility of accessibility. I Ref : Urban Social Geography : An
Introduction, by Paul Knox (1987).p 166].
In the above situation, a definite pattern ofland value in relation to the distance from centre
of the city emerges. The pattern describes that land values will be an inverse function of distance
from the centre of the city :
v = f(d) .... (9.1)
where V =land value, d =distance from centre of the city
The highest market value is commanded by the centre of the city or Central Business
District (CBD) and as the distance increses from the centre of the city or CBD, the market value
of land declines.
195

Chapler-9 MARKET VALUE AND SPATIAL STRUCTURE OF DELHI :AN ECONOMETRIC ANALYSIS
Delhi: The Pattern Of Land Values
In the light of above model, the relation between distance from the centre of urban Delhi
, i.e., Con naught Place (CP) and the rate of market value of land acquired has been examined to find
out the spatial structure of Delhi in terms of market values of land.
Spatial Units And Method
The Connaught Place (CP) has been taken as the centre of Delhi and the villages have been
taken as spatial units whose distance and market values have been analysed.
The linear distances (d) of the villages were measured from CP with the help of rural map
of Delhi. These linear distances have been assumed to be representing the actual distances of
villages from CP.
To find out th~ relationship between d and MY Rates, multiple regression analysis was
used. An explanatory variable d2 was used in the analysis to identify whether the relationship was
a linea~ or a non-linear one. Thus, the functional form used for regression analysis was:
V = a + bd + cd2 +u .... (9.2)
where V =Rate of Market Value of land, d =distance from the centre of the city, i.e., Connaught Place (CP), u = stochastic error term, a = intercept and b & c = regression co-efficients.
Intercept dummy variables were used to find out spatial and temporal differentiation in the
Market Value Rates (MV Rates):
V = a1 + ( az - a1 ) D + bd + cd2 .... (9.3)
where dummy variable D = { 1 for group-2 and 0 for group-1 }.
For locating inter-temporal differentiation in MY Rates, the regression model used was
therefore:
.... (9.4)
where Dt = time Dummy and other variables have the same connotation as given above.
196

Chapter-9 MARKET VALUEANDSPATIALSTRUCTUREOF DELHI :AN ECONOMETRIC ANALYSIS
For identifying spatial differentiation, the model used was :
V=at +(a2-<tt)Dt + ....... +(a6-at)D6+u .... (9.5)
where Dt, D2, D3, D4, D.s and Do are spatial Dummies for Shahadara (OS), Mehrauli East (ME), Mehrauli West (MW), Narcla (N), Palam North (PN) and Palam South (PS) regions respectively, and a is the intercept of Delhi (DL) region which has been taken as base region.
Beside MV Rate, the relationships of Rates of Compensation (CRates) and time taken to
draw an award (Award Time) with the distance (d) from C P have been analysed.
MV Rates : An Econometric Analysis
The MV Rates in relation to distance from the CBD have been analysed in two ways.
(i) MV Rates (1948-87) : In the fist case, average MV Rates were calculated from
2362 Awards of land acquisition in respect of 307 villages of Delhi for the period
from 1948 to 1987. Multiple regression analysis was then undertaken in respect of
these MV Rates of 307 villages and thier respective distances from Connught Place
(CP).
The inclusion of both d and d2 within regression model resulted in a very
.low significance level of regression co.:efficients of d. Hence d was dropped and
the model assumed the form given below :
* * MV Rate= 4071.31-2.04116 (d2) .... (9.6)
(12.275) (-3.927)
OF= 305, i:P = 0.04814, d = 20.341
The t-values are given in parentesis and "' indicates significance at 0.01
level.
The results show that average MV Rate is inversely related to the distance
from the centre of Delhi i.e., CP and it is declining at an increasing rate.
197

ChDpkr-9 MARKETVALUEANDSPATIALSTRUCTUREOFDELHI:AN£CONOM£TR/CANALYSJS
The results are in conformity with distance-decay function.
RELATION BETWEEN MV RATE AND DISTANCE DELHI (1948·87)
MV Rate/blgha (Ra)(Thousanda) 5r---~~--------------------------~
4 --
or----------------------------------4 -1~~~~~~~~~~~~~~~~LU~
1 5 10 15 20 25 30 35 40 45
Distance from Connaught Place (1• .8 km)
-Mv Rate
GRAPH 9.5
(ii) MV Rates in the years 1959, 1969, 1979 & 1984 --A Cross- sectional Analysis:
In the second case, to find out the relationship between MV Rates and distance from
CP at different points of time during land acquisition process, a cross-sectional
analysis was undertaken for the years 1959, 1969, 1979 & 1984.
As against the previous sub-section, where MV Rates were averaged for the
period from 1948 to 1987, in the present sub-section, the MV Rates were calculated
village-wise for the years 1959, 1969, 1979 and 1984 separately and their
relationships w~r.e found out with the distance from the centre of the city.
The following results were obtained through multiple regression analysis :
• • • MV Rate (1959) = 13974.58- 1329.25 d + 29.28 d2 .... (9.7)
(6.397) ( -5.007) ( 4.227)
-2 N = 96, d = 12.97, DF = 93, R = 0.23046
198

C~r-9 MARKET VALUE AND SPATIAL STRUCTURE OF DELHI: AN ECONOMETRIC ANALYSIS
RELATION BETWEEN MV RATE AND DISTANCE DELHI (1959)
MV Rate/blgha (Rs) 14.-~~~--------------------------~-,
1= I
-2~----~------~------~------L-----~ 0 10 20 30 40 50
Distance from Connaught Place (1•0.8 km}
- MV Rate(1959)
GRAPH 9.7
* * MV Rate (1969) = 127226_0- 9982.17 d + 177.137 d2
(6.994) (-6.138) (5.379)
..., -z N = 36, d = 25.13, DF = 33, R = 0.02857
RELATION BETWEEN MV RATE AND DISTANCE DELHI (1969)
MV Rale/blgha (Rs) 140,-----------------------------------~
0~----------~~----------~~------~
-20~----~------~------~----~------~
0 10 20 30 40 50
Distance from Connaught Place (1•0.8 km}
~ MV Rate(1969)
GRAPH 9.8
199
* .... (9.8)

Chapter-9 MARKETVALUEANDSPATIALSTRUcnJREOFDELIII :ANECONOMETRICANALYSIS
• • • MV Rate (1979) = 300926.59- 25969.215 d + 528.16 d2
.•.. (9.9) (7.443) (-6.813) (6.143)
- ;:;"2 N = 51, d = 22.29, DF = 48, R = 0.50540
RELATION BETWEEN MV RATE AND DISTANCE DELHI (1979)
MV Rate/blgha (Ra) 300,--, ---'-------------------,
250
I /' ....... .
200
150 .
100 ..
50 .
-50 t_ __ _._ __ __j_ ___ t._ __ _:__ __ __J
0 10 20 30 40 50 Distance 'from Connaught Place (1•0.8 km)
-¥- MV Rate(1979)
GRAPH 9.9
• * * MV Rate (1984) = 106404.089- 8052 d + 158.35 d2
.... (9.10) (4.218) (-3.101) (2.507)
- -z N = 20, d = 19.605, DF = 17, R = 0.44862
200

Chapter-9 MARKET VALUE AND SPATIAL STRUCTURE OF DELHI :AN ECONOMETRIC ANALYSIS
RELATION BETWEEN MV RATE AND DISTANCE DELHI (1984)
MV Rato/blgha (Re) 120 - -
100\
80
60
40
20
oL-----~----~~~~------L-----~ 0 10 20 30 40 50
Distance from Connaught Place (1•0.8 km)
_.,_ MV Rato(1984)
GRAPH 9.10
In all the above four years, the MV Rates were significantly related to the
distance from CP and the nature of relationship was not similar to one discussed
in sub-section (i). The values of intercept and regression coefficients of d & d2 were
all significant at 1% level.
The graphs of four equations show that the MV Rates declined with the
increase in distance during the first phase of the graph but the average value and
rate of change were different in all cases. From 1959 to 1979 the intercept value
and the rate of decline increased with the increase in distance. But in 1984 both, the
intercept and rate of change declined.
Another interesting point that emerges from the above ananlysis is that the
MV Rates after declining up to a certain distance from the CP had a tendency to
increase towards the periphery of Delhi. The graphs also bring out that the curves
showing relation between MV Rates and distance from CP were U-shaped in all
the four years with a degree of variation.
Though the number of observations are different in all the four years and
are not very large comparatively in 1984, the MV Rates may be taken as broad
representative of prevailing market values of land in Delhi. With this qualification,
the results of cross- sectional relation between MV Rates and distance show that
201

Chapter-9 MARKET VALUF: AND SPATIAL STRUCfURE OF DELHI :AN ECONOMETRIC ANALYSIS
land values beyond a certain distance from the CP have a tendency to increase \Vith
increasing distance. It implies that they become relatively higher in suburban Delhi.
This phenomenon may be seen in the growth of farm houses owned by rich urban
class in suburban Delhi.
MV Rates in the years )959, 1969, 1979 & 1984 --A Temporal Analysis :
To find out the extent to which MV Rates differed significantly over time, the data for the
years 1959, 1969, 1979 and 1984 were pooled and then dummy variables in respect of these years
were introduced in the multiple regression model along the lines indicated above in equation (9.5).
The results of regressioon model with time dummies are as follows :
* * * MV Rate (T) = 78835.91 - 8242.497 d + 154.789 d2 +
(7.755) (-7.394) (6.205)
* * * 21341.052 D69 + 31344.705 D79 + 32813.495 D84
(3.319) (5.554) (4.520)
- -z N = 203, d = 18.12, DF = 197, R =0.25918
TEMPORAL DIFFERENTIATION IN MV RATES DELHI (1959, 1969, 1979 & 1984)
MV Rate/bigha (Rs) (Thousands) 120r-----~~~~~~-----------------.
w ro ~ ~ ~ Distance from Connaught place (1•0-~ km)
- MVRate(611) -+- MVRale(811) -+- MVRate(79) -e- MVRate(8.)
GRAPH 9.11
202
.... ( 9.11)

Clrapter-9 MARKET VALUE ANI> SJ'ATIAL STRUCTURE OF DELIII :AN ECONOMETRIC ANALYSIS
The results for I he pooled data of all four years depict nature of relationship between MV
Rates and distance similar to that for years taken individually. The MV Rates declined with the
increase in distance at decreasing rate and after a certain point had a tendency to increase. The
values of intercept, regression coefficients and intercept time dummies for the years 1959, 1969,
1979 & 1984 were significant at 1% level.
In the above analysis, MV Rates relating to years 1969, 1979 & 1984 differed significantly
from the MV Rates in 1959. In 1969, 1979 and 1984, though MV Rates were higher compared to
those in 1959, the increase itself went on declining successively. It implies, temporally, MV Rates
incresed at declining rates. These results may be seen in sharp contrast to the increase in L & DO
Rates in Delhi over these years (discussed in chapter 6) which indicate a high increase in land
values in the wake of fast urbanisation of Delhi.
Real MV Rates in years 1959, 1969, 1979 and 1984-- A Temporal Analysis:
In Delhi, with development over time, the inflation rate also increased. To analyse the
temporal effects in MV Rates after making allowance for inflation, the Real MV Rates were
calculated by deflating nominal MV Rates with their respective Urban Non- Manual Cost Price
Indices (UNMCPI) for the years 1959,1969,1979 and 1984. Multiple regression analysis with time
Dummies was, thereafter, undertaken to identify the temporal differentiation.
The results of the regression estimates are as follows :
* * * Real MV Rate(T) = 42945.07- 4335.43 d + 80.79 d2 +
(9.034) (-8.317) (6.925)
* * * 13068.34 D69 + 13007.59 D79 + 10824.22 Ds4 .... ( 9.12)
( 4.34 7) ( 4. 9290) (3.189)
N =203 d =18.12 DF =197 iP=0.30521
203

MARKET VALUEAND SPATIAL STRUCfURE OF DEUII :AN ECONOMETRIC ANALYSIS
TEMPORAL DIFFERENTIATION - REAL MV RATE DELHI (1959, 1969, 1979 A 1984)
Real MV Rate/blgha (Ra) (Thouunda) 00~~~~~-------------------------,
40 --
30
20
10
or-----~~~~~~~~~~----~ -10
-20L------L------L-----~------~----~
0 10 20 30 40
Distance from Connaught Place (1•0.8 km)
- RL MV Rt(59)
_._ RL MV Rt(79)
-+- RL MV Rt(69)
__.,__ RL MV Rt(84)
GRAPH 9.12
50
The relationship between Real MV Rates and distance from CP is similar to that between
nominal MV Rate and distance. The values of intercept, regression coefficients and time dummies
are statistically significant at 1% level.
The Real MV Rates of 1969, 1979 and 1984 differed significantly from that of 1959. The
Real MV Rate of 1979 was lower than that of 1969 and the Real MV Rate of 1984 was lower than
the Real MV Rates of 1979 as well as of 1969. Interestingly, the intercept time dummies of 1979
and 1984 came out to be lower than that of 1969 implying that after increase in real values up to
1969, they started declining thereafter. In other words, Real MV Rates after 1969 experienced
downward shifts in 1979 and 1984.
Difference in Relationships between MV Rates and Distance from the CP
In the foregoing -analysis, it is observed that the relationship between average MV Rates
for the period from 1948 to 1989 comes out to be different from that of MV Rates taken for the
years 1959, 1969, 1979 & 1984 on the one hand and the distance from CP, on the other hand. In
former case, MV Rates are inversely related to the distance and the rate of decline increases while
going farther from the CBD. In the latter case, MV Rates are inversely related to the distance only
up to a certain distance beyond which they start increasing with increase in distance.
204

Clu;pur-9 MARKETVALUEANDSPATIALSTRUCfUREOFDEUII :ANECONOMETRICANALYSIS
C Rates : An Econometric Analysis
The relation between Rates of Compensation (C Rates) and distance from centre of the
city was analysed for two sets of data.
In the first set of data where average CRates were calculated from 3037 Awards of land
acquisition in respect of 321 villages for the period from 1948 to 1989, the following regression
estimates were obtianed :
* * 2
CRate = 7357.399 - 4.08068 d (9.204) (-3.231)
- -2 N = 321, d = 20.147, DF = 319, R = 0.02865
If/
!:
Relation between C Rate and Distance DELHI (1948-89)
: rmoo"u'l'" Ro~/bloho IRo){Th"u"O.I
I 4~
or-----------------------------~~--~
-2~----~------~------J-------L-----~ 0 10 20 30 40 50
Distance from Connaught Place(1•0.8 km)
-CRate
GRAPH 9.13
.... (9.13)
The average CRates for the period from 1948 to 1989 are inversely related to the distance
from CP and the rate of decline increases as one goes away from the centre. The values of intercept
and regression coefficients are significant at 1% level.
205

ChapUr-9 MARKF:I'VALUEANDSPATIALSTRUCfUREOFDELIII :ANECONOMETRICANALYSIS
In the second set of data where average CRates were calculated from 2362 Awards ofland
acquisition in respect of 307 villages for the period from 1948 to 1987 and where MV Rates
corresponding to CRates were also available, the following regression estimates were obtianed :
* * C Rate = 6594.07 - 3.28623 ( d2)
(11.395) (-3.624)
-2 -DF = 305, R = 0.03814, d = 20.341
RELATION -- MV RATE, CRATE & DISTANCE DELHI (1948-87)
MV Rate,C Rate/blgha (Rs)(Thousands) 7, --+-+-++-+->-...~
6~---···
I 5'-····
I I
! 2~
i 1 r· 01~----------------------------------~
I -1~~~~~~~~~~~~~~~~~~~
1 5 10 15 20 25 30 35 40 45
Distance from Connaught Place (1• .8 km)
-- MV Rate -+- C Rate
GRAPH 9.14
.... (9.14)
In both cases, the model relationship between CRates and distance remains the same with
only difference that in first set of data, the values of intercept and regression coefficients are little
lower than those in second set of data.
The model brings out that CRates while being inversely related to distance from CP decline
at an increasing rate as one moves away from CP.
206

Clupler-9 MARKET VALUE AND SPATIAL STRUCTURE OF DELIII :AN ECONOMETRIC ANALYSIS
A ward Time : An Econometric Analysis
The regression analysis was also undertaken to identify the relation of average time taken
to draw an Award (Award Time) with the distance from centre of the city.
The average time taken to draw an Award was calculated in respect of 321 villages from
3037 awards of land acquisition for the period from 1948 to 1989. Regression analysis was
undertaken with the following results :
* * * Award Time= 3367.29- 136.178 d + 1.649 d2 .... (9.15)
(9.27) (-3.753) (2.051)
- -z N = 321, d = 20.147, DF = 319, R = 0.19191
RELATION BETWEEN AWARD TIME & DISTANCE DELHI (1948·89)
o~----~------L-----~----~------~ 0 10 20 30 40 50
_ .Distance from Connaught Place (1•0.8 km)
-Award Time
GRAPH 9.15
The values of intercept and regression coefficients are significant at 1% level. The Award
time is inversely related to the distance from CP and it declines at a decreasing rate.
207
Chapter-9 MARKETVALUEANDSPATIALSTRUCTUREOFDELIII:ANECONOMETRICANALYSJS
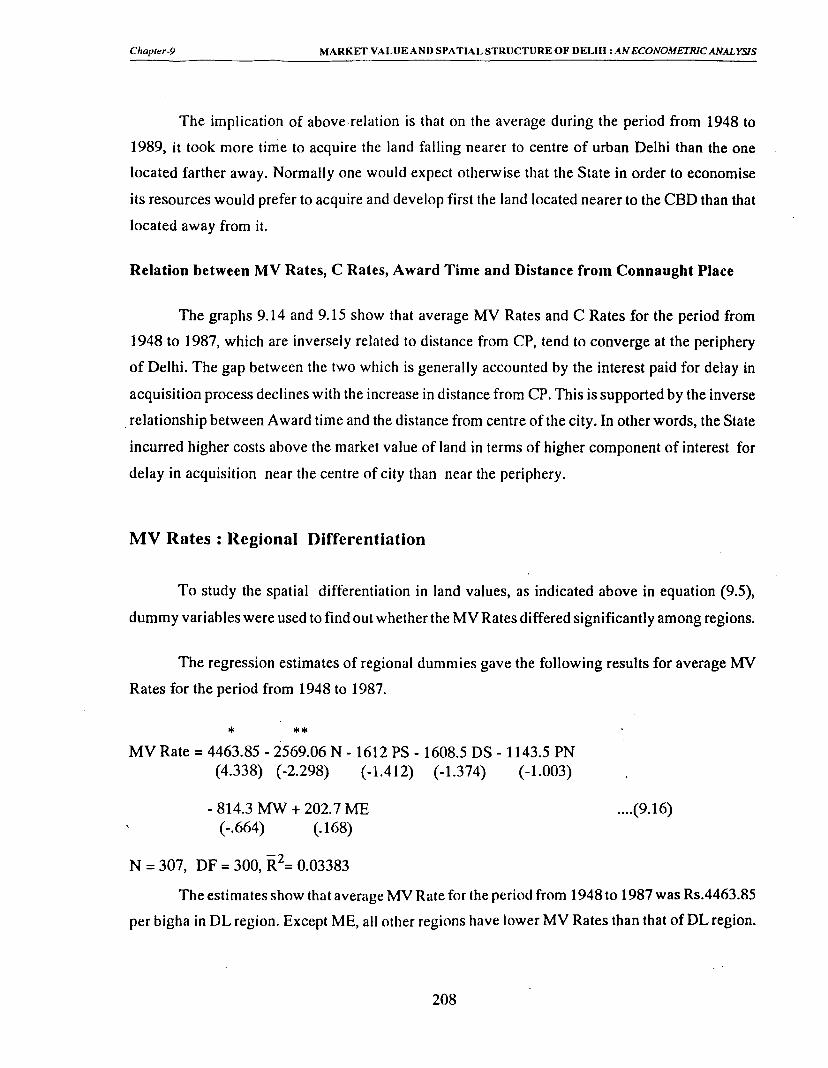
The implication of above relation is that on the average during the period from 1948 to
1989, it took more tinie to acquire the land falling nearer to centre of urban Delhi than the one
located farther away. Normally one would expect otherwise that the State in order to economise
its resources would prefer to acquire and develop first the land located nearer to the CBD than that
located away from it.
Relation between MV Rates, CRates, Award Time and Distance from Connaught Place
The graphs 9.14 and 9.15 show that average MV Rates and C Rates for the period from
1948 to 1987, which are inversely related to distance from CP, tend to converge at the periphery
of Delhi. The gap between the two which is generally accounted by the interest paid for delay in
acquisition process declines with the increase in distance from CP. This is supported by the inverse
. relationship between Award time and the distance from centre of the city. In other words, the State
incurred higher costs above the market value of land in terms of higher component of interest for
delay in acquisition near the centre of city than near the periphery.
MV Rates : Regional Differentiation
To study the spatial differentiation in land values, as indicated above in equation (9.5),
dummy variables were used to find out whether the MY Rates differed significantly among regions.
The regression estimates of regional dummies gave the following results for average MV
Rates for the period from 1948 to 1987.
* ** MY Rate= 4463.85 - 2569.06 N- 1612 PS- 1608.5 DS- 1143.5 PN
(4.338) (-2.298) (-1.412) (-1.374) (-1.003)
-814.3 MW + 202.7 ME .... (9.16) (-.664) (.168)
N = 307, DF = 300, iP= 0.03383
The estimates show that average MY Rate for the period from 1948 to 1987 was Rs.4463.85
per bigha in DL region. Except ME, all other regions have lower MY Rates than that of DL region.
208

Chapter-9 MARKET VAUJEAND SPATIAL STRUCTURE OF DELHI :AN ECONOMETRIC ANALYSIS
However, statistically the differenece was significant only in case of N region where MV Rates
were lower by Rs.2569.09 per bigha than the MV Rates of DL region.
It implies that as far as average MV Rates are concerned, only in caase of N region they
were significantly lower than those of DL region. In all other cases, the MV Rates, on the average
were not significantly different from Rs.4463.85 per bigha.
C Rates : Regional Differentiation
To find out the pattern of regional differentiation in respect of average rates of compensation
(CRates) for the period from 1948 to 1989, the regional dummies were used in regression analysis
with the following results :
* ** CRate= 6229.76 + 5625.74 ME- 2712.67 N- 1935.77 PS
(2.572) (1.971) (-1.028) (-0.716)
- 1561.32 DS- 1152.04 PN- 653.27 MW .... (9.17) (-0.566) (-0.429) (-0.224)
N = 321, DF = 319, iP= o.5006, **=significant at 5% level
The results show that average CRates. in DL Region were Rs 6229.76 per bigha, significant
at 1% level. Except ME Region where the CRates were higher by Rs. 5625.74, significant at 5%
level, in all other regions the CRates had lower values and were statistically insignificant too.
It implies that as far as CRates are concerned they differed significantly.over space in case
of ME only. The CRates were lowest inN Region followed by PS, DS, PN and MW, but not
significantly different from those ofDL Region. Thus over space there was not much differentiation
inC Rates.
The regional differentiation was also examined in cas~ of other sample pertaining to the
period from 1948 to 1987 with the following results:
CRate = 6089.22 + 2690.49 ME - 2758.69 N - 1754.26 PS ( 3.412) (1.282) (-1.423) (-0.884)
209

Chapter-9 MARKET VAl .UE AND SPATIAL STRUCTURE OF DELHI :AN ECONOMETRIC ANALYSIS
- 1551.36 DS- 1019.58 PN- 348.639 MW .... (9.18) (-0.764) (-0.516) (-0.164)
N = 307, DF = 300, R2 = 0.05717, R2 =- 0.03831
The results were similar to the earlier data relating to period from 1948 to 1989 with minor
difference in absolute values. The CRates are significantly higher only in ME Region and in all
other regions, C Rates were lower and insignificant.
The corresponding MV Rates in the same sample show . that the MY Rates of ME Region
were a little higher than those of DL Region whereas the MY Rates of N Region were significantly
lower than the DL Region. In all other regions, the MY Rates were lower than those of DL Region
and were not significant.
210