market - uat.firstmetrosec.com.ph · • smph made commendable gains, as it led the property sector...
TRANSCRIPT
The Market Call - May 2017
1 November 2017
MARKET CALLThe
Capital Markets Research
FMIC and UA&P Capital Markets Research
Macroeconomy 3 Fixed-Income Securities 11 Equity Markets 19Recent Economic Indicators 24 Contributors 26
Economic Indicators(% change, latest month, unless otherwise stated)
Previous Month Latest Month Year-to-Date 2015 (year-
end)2016 (year-
end)2017 FMIC Forecast*
GDP Growth (y-o-y, quarterly) 6.4% 6.5% 6.5% 5.9% 6.8% 6.5-7%
Industrial Output (August) -3.5% 2.8% 6.3% 2.4% 9.0% 9.5%
Inflation Rate (October) 3.4% 3.5% 3.5% 1.4% 1.8% 2.8- 3.2%
Government Spending (September) 13.9% -1.8% 8.2% 12.6% 18.0% 15%
Gross International Reserves ($B) (October) 81.0 80.6 80.6 81.6 80.7 85
PHP/USD rate (October) 51.00 51.34 50.34 45.50 47.49 51
10-year T-bond yield (end-October YTD bps change) 4.61% 4.69% 16.7 4.10% 4.63% 4.8-5.1%
PSEi (end-July YTD % change) 8,171.4 8,365.3 21.9% 6,952.1 6,781.2 8,200
Sources: Philippine Statistics Authority (PSA), Bangko Sentral ng Pilipinas (BSP), Philippine Stock Exchange (PSE), Philippine Dealing System (PDS), and Authors’ Calculations
Executive Summary
Macroeconomy
Bonds Market
PSEi flies to record high seven times in October.Equities Market
Yields in auctions of T-bills fell while rising slightly for T-bonds in both auctions and second-ary market in October. However, trading volume in the secondary market hit year lows and pushed the yield curve slightly upward, as expectations on monetary policy and rising crude oil prices dominated sentiment.
Investor confidence improves as faster disbursements on infrastructure and capital outlays, coupled with 17.4% growth in peso remittances and robust gains in exports, boost the PH economy. We still think that PH GDP growth will hit the 6.5% to 7% target in H2.
• Yields in auctions of T-bills fell by 0.8 bps to 7.5 bps, reflecting higher demand.• Similarly, auctions of 5-year and 7-year T-bonds yielded lower by 24.7 bps and 12 bps, respectively.• GS trading plunged by 47.5% (m-o-m) to 2017’s low due to sparse supply of liquid, long-dated papers and investors
remaining wary of the possible Fed policy rate hikes.• The short-end of the yield curve moved up faster and so the 10-year to 2-year spread shrank by 12 bps.• Tracking the rise in U.S. Treasury bond yields, ROP yields increased for the three liquid tenors.Outlook: The slightly upward trend in yields both here and abroad is to be expected, even as the current low interest environment appears intact. However, domestic savings and relatively low NG domestic borrowing needs for the rest of the year would help limit the upside in bond yields. Locally, the further minimal rise in inflation to 3.5% in October does not provide sufficient incentive for the BSP to hike policy rates this year.
• PSEi has risen significantly to reach 21.9% YTD by October.• It remains the third fastest growing stock index among selected indices.• The Holdings sector lead the boards with a 4.3% gain in October as foreigners pursue large caps.• AC and SM fuel the Holding sector gains with 6.3% and 8.2% increases, respectively.• SMPH made commendable gains, as it led the property sector with a 7.4% gain.• Net foreign buying ended flat in October, as they netted only P84 M.Outlook: With stock price appearing overbought, it may be prudent to take profits. Stocks appear overbought on the basis of the E/P ratio vs 10-year bond yield spread dipping by nearly twice the standard deviation for the 8-year average spread.
• Infrastructure and capital outlays of the National Government expanded by 15.4% in Q3 (y-o-y).• Exports in August still posted a remarkable growth of 9.4% amidst global recovery.• Inflation recorded a minimal uptick to 3.5% in October, but YTD remains well within the target.• Capital goods imports picked up by 10% y-o-y in August, reversing the past two months’ decline.• Peso equivalent of the remittances soared by 17.4% in August due to the 9% y-o-y peso depreciation.Outlook: The above catalysts suggest faster economic expansion in Q3, anchored on the strong domestic demand and the robust spending on major infrastructure projects, and the pick up in exports driven by stronger global eco-nomic growth.
Public construction soared by 12.6% in Q3 growth, while exports of goods and services jump by 17.2%. OFW remittances in both US dollars and peso terms accelerated to 9.4% and 17.4%, respectively in August. Exports’ rise of 9.4% in August further domestic demand. Government bond yields fell in October, amid rise in the secondary market. PSEi maintains its 3rd place standing with YTD surge of 21.6% in October with high of 8,523 by November 6.
GDP growth of 6.9% in Q3 exceeds expectations, bolstered by infrastructure spending and exports, supported by high investor confidence as PSEi chalks up seven records since October.

The Market Call - November 2017
3
Macroeconomy
BETTER-THAN-EXPECTED 6.9% GDP GROWTH IN Q3 WITH STRONG INFRA SPENDING & EXPORTS
Industry led all output gains, increasing by 7.5%, which was largely a result of the 12.6% expansion in infrastructure spending as well as the 9.4% growth in the manufacturing sector. Export growth of 9.4% in August resulted in a smaller trade deficit and was backed by a vibrant global rebound. These enabled the Philippine Gross Domestic Product (GDP) to expand by 6.9% in Q3 and more than 6.5% in H2. The said expansion was also confirmed by the latest indicator releases. Renewed upswing in capital goods imports and a 17.4% surge in Overseas Filipino Workers’ (OFW) peso remittances continue to feed strong domestic demand. This is supported by an acceleration in Meralco electricity sales to 9.4% in September from 6.5% in August. While inflation has speeded a bit to 3.5% in October, the peso depreciation would have minimal effects on inflation in the coming months.
Outlook: National Government (NG) infrastructure, capital goods and consumer spending should pick up further in H2 and together with accelerating exports, propelled by unexpectedly stronger world economy, should enable GDP growth to hit our 6.5% to 7% projection for the full year 2017.
PH GDP Expands by 6.9% in Q3 to beat Market Consensus, ChinaThe PH economy expanded at a rate above the market consensus, hitting a 6.9% year-on-year (y-o-y) growth, the fastest in the last four quarters. Next to Vietnam, the PH outperformed China and the rest of ASEAN-6. As previously anticipated, the still-robust domestic demand and the resurgent external demand propelled the country’s rapid expansion, among others (see October 2017 issue).
ASEAN 6 + 1
Country 2016 Q1-2017 Q2-2017 Q3-2017
China 6.7% 6.9% 6.9% 6.8%
Philippines 6.9% 6.4% 6.7% 6.9%
Vietnam 6.2% 5.1% 6.2% 7.5%
Malaysia 4.2% 5.6% 5.8% 5.1% *
Indonesia 5.0% 5.9% 5.0% 5.1%
Thailand 3.2% 3.3% 3.7% 3.3% *
Singapore 2.0% 2.5% 2.9% 4.6%
*Estimates
Capital Formation), boosted by Durable Equipment spending (+8.3%), added fuel with a 6.5% jump. Higher capital goods spending in 16 out of 20 sectors provided strong gains with investments in mining and construction machineries posting the fastest growth (+59.1%). Government final consumption expenditures accelerated to 8.3% in Q3 (y-o-y) from 7.1% in Q2-2017 and 3% in Q3-2016. The resurgence in the exports of goods and services shown in the double-digit expansion in Q3 (+17.2% y-o-y) amidst the global recovery, likewise, contributed to the fast economic growth. The continuous increase in Consumption spending (+4.5%) brought about by the double-digit gains in the peso-equivalent of the OFW remittances, along with the positive performance in Investment also maintained domestic demand. Thus, Gross National Income (GNI) also shot up by 6.7% in Q3.
In the production side, the Industry sector posted the highest increase to 7.5% due to the stronger manufacturing activities. The Manufacturing sub-sector grew at a faster pace of 9.4% in Q3, than the 7.9% and 7% recorded in Q2-2017 and Q3-2016, respectively. The Services sector remained resilient, recording a 7.1% y-o-y gain in Q3 buoyed by the gains in Financial Intermediation (+8.6%) and Public Administration & Defense, Compulsory Social Security (+8.2%). Meanwhile, growth in the Agriculture sector slowed but remained positive, expanding by 2.5% y-o-y in Q3.
Domestic demand grew above the 5% mark in the last 12 consecutive quarters, driven by stronger NG spending (especially in Q3). The administration’s commitment to ramp up spending on infrastructure and other capital outlay held sway as Public Construction surged by 12.6% despite facing a high base in Q3-2016. Investments (or

The Market Call - November 2017
4
Macroeconomy
With total expenditure overshadowing revenue level (in absolute amount), the NG recorded a budget deficit amounting to P36.9 B, adding up to the country’s deficit totaling to P215.2 B (YTD). The YTD deficit only accounted for 45% of total target deficit for 2017 of P473.1 B (3% of GDP) leaving a 55% fiscal space for the remaining three months.
We maintain our view that NG spending will continue at an elevated pace shown in the consistent gains in the infrastructure spending which posted a YTD expansion of 11.1% from a year ago’s high level.
Meralco Sales Accelerate in September, Manufacturing Picks Up in August Driven by broad-based gains in electricity demand across different customers, Meralco sales in September accelerated, posting a 9.4% y-o-y increase from 6.5% in August.
With Q2 GDP growth revised upward to 6.7%, YTD GDP tracked also at 6.7%. Thus, we think that PH expansion should easily hit our FY 2017 projection of 6.5%-7%, given also our view that investment spending and NG disbursements on infrastructure will further accelerate in the last quarter of the year.
Robust Spending on Infrastructure and Capital Outlays Deja VuDisbursement on capital outlays remained a positive catalyst as the NG continued to ramp up spending on infrastructure and other capital outlays, posting a 6.2% year-on-year (y-o-y) gain in September. This was, however, offset by the 2% decline in the current operating expenditures (i.e. interest payments, MOOE, and subsidies). Thus, NG disbursements in September declined by 1.8%. The decline can also be attributed to a higher base. Nevertheless, total spending in the first nine months totaled to P2 T (+8.3%), which is only P123.3 M shy from the programmed deficit.
Meanwhile, total revenues surged by 20.6% to P200 B, sustained by the remarkable gains from both the Bureau of Internal Revenue (BIR) and Bureau of Customs’ (BoC)collections. The BIR raked in a total of P141.4 B (or 25.2%
Figure 1 - Domestic Demand and GDP Growth, Year-on-Year
Source of Basic Data: Bangko Sentral ng Pilipinas (BSP)
Figure 2 - NG Expenditures Growth Rate, Year-on-Year
Source of Basic Data: Bangko Sentral ng Pilipinas (BSP)
growth) in September while the BoC’s take rose by 20.2%, faster than the 15.3% recorded in August. The remarkable increase in BIR and BoC revenues would suggest strong output growth in Q4.
Disbursement on capital outlays remained a positive catalyst as the NG continued to ramp up spending on
infrastructure and other capital outlays, posting a 6.2% year-on-year (y-o-y) gain in September.

The Market Call - November 2017
5
Macroeconomy
Net equity capital increased five times higher in July to $131 M due to higher capital placements, which largely came from Singapore, the U.S., the Netherlands, Japan, and Taiwan.
Japan and Taiwan used mostly in Manufacturing; Real Estate; Wholesale and Retail Trade; Financial and Insurance; and Electricity, Gas, Steam and Air-conditioning Supply Activities. Reinvestments in earnings added $71 M. The gains in equity capital could not, however, offset the decline in investments in debt instruments which largely fell by 74% to $105 M. Thus, foreign direct investments in July scored lower to reach $307 M, down by 38% from the same period last year. Nonetheless, equity capital is preferred over debt instruments of foreign affiliates of Philippine-based non-Filipino firms.
YTD, net FDI inflows amounted to $3.9 B, showing a 16.5% decline from the $4.7 B net inflows in the first seven months of 2016. Excluding the $800 M inflow into Security Bank in April 2016 will wash off the decline and result in a flat growth.
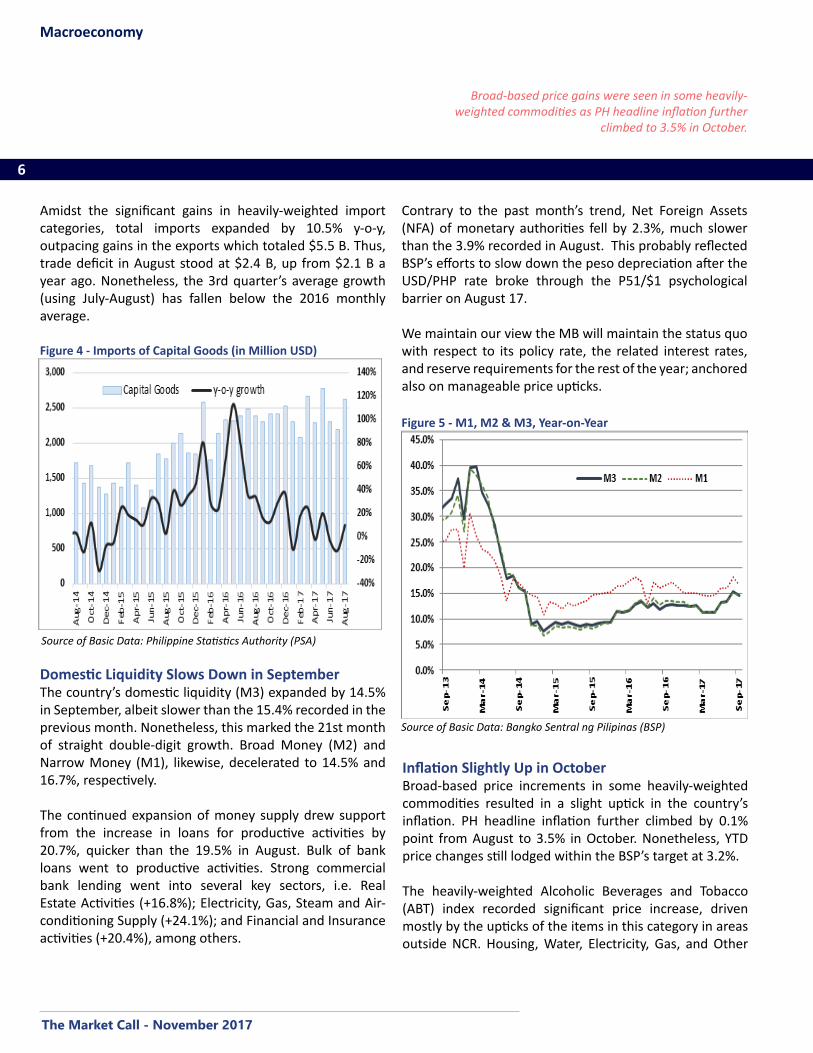
Capital Goods Imports Pick Up in AugustCapital goods imports rose by 10% in August after two consecutive months of decline. Significant gains in four out of six capital goods classifications largely pulled up capital goods imports’ performance to record a total of $2.6 B. This accounted for 33.1% of total imports, second only to raw materials imports.
Imports of Telecommunication Equipment & Electrical Machinery, and Power Generating & Specialized Machines, comprising about 60% of total capital goods imports, registered hefty gains of 21.9% and 11.8%, respectively. Land Transport Equipment excluding Passenger Cars & Motorized Cycle and Photographic Equipment, likewise, posted an increase.
Raw Materials & Intermediate Goods imports, which captured the largest share of total imports at 38.8%, increased by 10.6%. Imports of Mineral Fuels, Lubricant and Related Materials rose by 23.8%, reflecting the strong demand of coal and other related materials. Petroleum Crude imports, however, fell by 3.4%. Consumer Goods imports, taking an 18.1% of the import bill, also jumped by 18.7%, sustained by strong consumer demand, likely due to robust OFW remittances.
Despite the slightly higher electricity rates in August, Residential demand picked up by 8.7% y-o-y. The overall rate in September increased by P0.86/kWh to P9.25/kWh due to higher generation costs brought about by the increase in WESM prices. Electricity demand from Commercial and Industrial customers also increased by 5.4% and 5.9%, respectively.
Meanwhile, the country’s manufacturing output (measured by Volume of Production Index or VoPI) reversed the decline in July, climbing to 2.8% in August as 10 of 14 major sectors registered double-digit growth. The August index is preliminary and will likely be adjusted upward. Major segments of the Manufacturing sector were mostly up (i.e. Fabricated Metal Products (+89.5%), Printing (+41.6%), Furniture and Fixtures (+35.6%), Basic Metals (+28.5%), Food Manufacturing (+26.3%), and Leather products (+21.9%), among other). The strong gains recorded in H1 2017 brought the YTD growth to 6.3%.
Equity Capital Surges, FDI Records $307 M Inflow in JulyNet equity capital increased five times higher in July to $131 M due to higher capital placements. These placements largely came from Singapore, the U.S., the Netherlands,
Figure 3 - VoPI and Meralco Sales Growth Rate
Sources of Basic Data: Meralco & Philippine Statistics Authority
The Market Call - November 2017
6
Macroeconomy
Broad-based price gains were seen in some heavily-weighted commodities as PH headline inflation further
climbed to 3.5% in October.
Amidst the significant gains in heavily-weighted import categories, total imports expanded by 10.5% y-o-y, outpacing gains in the exports which totaled $5.5 B. Thus, trade deficit in August stood at $2.4 B, up from $2.1 B a year ago. Nonetheless, the 3rd quarter’s average growth (using July-August) has fallen below the 2016 monthly average.
Contrary to the past month’s trend, Net Foreign Assets (NFA) of monetary authorities fell by 2.3%, much slower than the 3.9% recorded in August. This probably reflected BSP’s efforts to slow down the peso depreciation after the USD/PHP rate broke through the P51/$1 psychological barrier on August 17.
We maintain our view the MB will maintain the status quo with respect to its policy rate, the related interest rates, and reserve requirements for the rest of the year; anchored also on manageable price upticks.
Domestic Liquidity Slows Down in September The country’s domestic liquidity (M3) expanded by 14.5% in September, albeit slower than the 15.4% recorded in the previous month. Nonetheless, this marked the 21st month of straight double-digit growth. Broad Money (M2) and Narrow Money (M1), likewise, decelerated to 14.5% and 16.7%, respectively.
The continued expansion of money supply drew support from the increase in loans for productive activities by 20.7%, quicker than the 19.5% in August. Bulk of bank loans went to productive activities. Strong commercial bank lending went into several key sectors, i.e. Real Estate Activities (+16.8%); Electricity, Gas, Steam and Air-conditioning Supply (+24.1%); and Financial and Insurance activities (+20.4%), among others.
Figure 4 - Imports of Capital Goods (in Million USD)
Source of Basic Data: Philippine Statistics Authority (PSA)
Figure 5 - M1, M2 & M3, Year-on-Year
Source of Basic Data: Bangko Sentral ng Pilipinas (BSP)
Inflation Slightly Up in OctoberBroad-based price increments in some heavily-weighted commodities resulted in a slight uptick in the country’s inflation. PH headline inflation further climbed by 0.1% point from August to 3.5% in October. Nonetheless, YTD price changes still lodged within the BSP’s target at 3.2%.
The heavily-weighted Alcoholic Beverages and Tobacco (ABT) index recorded significant price increase, driven mostly by the upticks of the items in this category in areas outside NCR. Housing, Water, Electricity, Gas, and Other

The Market Call - November 2017
7
Macroeconomy
Exports continued with its positive performance in August, gaining by 9.4% from a year ago to total $5.5 B, with growth seen in 7 of the top 10 major commodities.
country’s outstanding sales led by Gold which skyrocketed by 186.7%.
Figure 7 - Exports Growth Rates, Year-on-Year
Source of Basic Data: Philippine Statistics Authority (PSA)
-25.0%
-15.0%
-5.0%
5.0%
15.0%
25.0%
35.0%
45.0%
Au
g-1
3
Fe
b-1
4
Au
g-1
4
Fe
b-1
5
Au
g-1
5
Fe
b-1
6
Au
g-1
6
Fe
b-1
7
Au
g-1
7
Fuels (HWEGOF) index, likewise, posted an increase due to higher Meralco and water charges in October (see Meralco article), along with the increase in the prices of construction materials and other fuels (i.e. WTI and Brent posting an average mark-up of 3% from the previous month). Clothing, Recreation & Culture, and Restaurants and Miscellaneous Goods and Services indices also saw faster gains. These gains were offset by hefty decline in the Transport index amidst the downward adjustment in the air and ship fares noted in the provinces, as well as price rollbacks in petroleum products. Prices in Clothing and Health indices posted weaker gains. The rest of the indices maintained its past month’s rate.
The seasonally adjusted annualized rate (SAAR) decelerated from 7.5% (revised) to 2.4%, suggesting price slowdown. Likewise, core inflation (which excludes volatile food and energy prices) registered a slight decline to 3.2% vis-a-vis the 3.3% recorded in September. The limited oil price upside, moreover, confirms our view that average inflation will continue to lodge within the BSP’s target.
Inflation Year-on-Year Growth Rates Oct-2017 Sep-2017 YTD
All items 3.5% 3.4% 3.2%
Alcoholic Beverages and Tobacco 6.8% 6.4% 6.2%
Clothing and Footwear 1.9% 2.0% 2.3%
Housing, Water, Electricity, Gas, and Other Fuels 4.0% 3.8% 3.1%
Health 2.2% 2.3% 2.5%
Transport 4.2% 4.8% 3.3%
Communication 0.4% 0.3% 0.3%
Recreation and Culture 1.5% 1.4% 1.5%
Restaurants and Miscellaneous Goods and Services 2.6% 2.4% 2.0%
Source of Basic Data: National Statistics Office (NSO)
Note: Green font - means higher rate (bad) vs. previous month Red font – means lower rate (good) vs. previous month Not included in details are the items whose growth rate remained the same as in September.
Exports Remain Positive in AugustExports continued with its positive performance in August, gaining by 9.4% from a year ago to total $5.5 B. Growth in seven of the top 10 major commodities resulted in the
Figure 6 - Inflation Rates Annualized, Year-on-Year
Source of Basic Data: Philippine Statistics (PSA)
The Market Call - November 2017
8
Macroeconomy
Personal remittances from Filipinos working abroad continued to pour into the conomy, totaling $2.8 B in August,
near the all-time high which was recorded last March 2017.
(comprising 15%), also increased by 13.9%. ASEAN+East Asia ex-Japan accounted for 52.3% of total exports. Trade exports to the E.U., likewise soared by 31.3%, as its strong economic recovery persists.
We believe that exports will continue to expand buoyed by strong global demand (i.e., U.S., E.U., China, and India). In addition, the peso’s real depreciation of 5.5% in September from December 2016 (as measured by BSP’s Real Effective Exchange Rate) should add fuel to this expansion. Thus, we think that positive exports performance will continue and should provide the needed stimulus to achieve the full year growth target of 6.5%-7%.
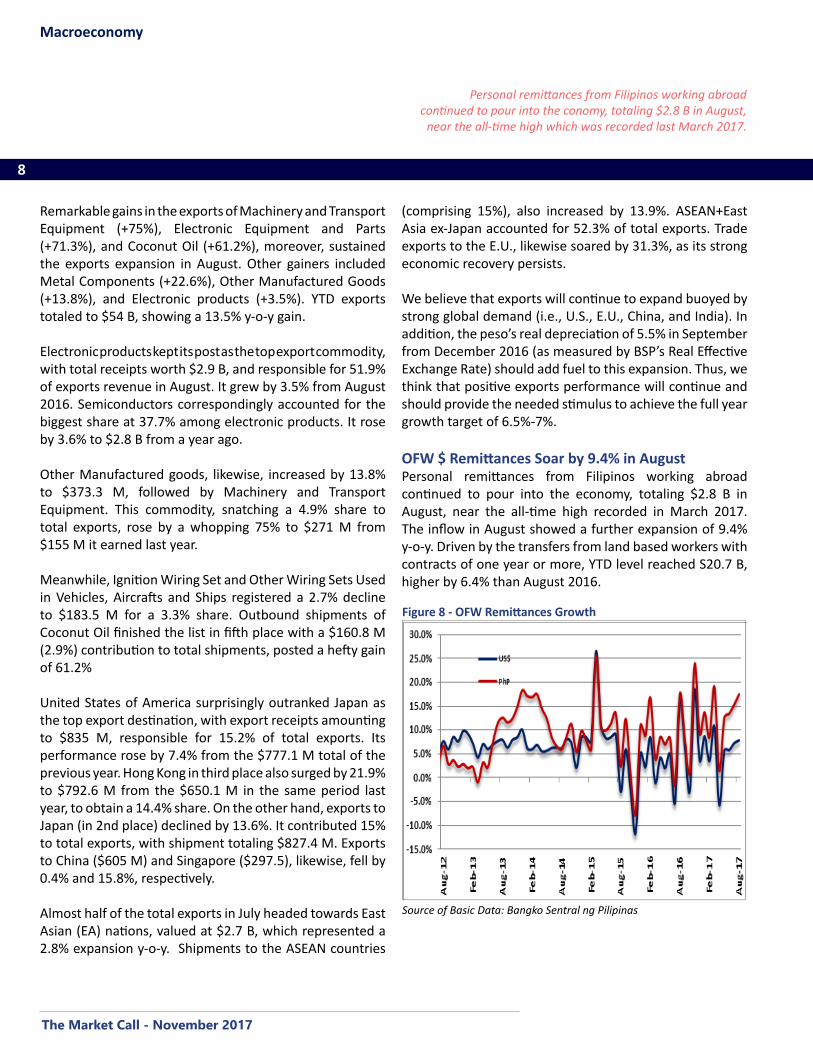
OFW $ Remittances Soar by 9.4% in AugustPersonal remittances from Filipinos working abroad continued to pour into the economy, totaling $2.8 B in August, near the all-time high recorded in March 2017. The inflow in August showed a further expansion of 9.4% y-o-y. Driven by the transfers from land based workers with contracts of one year or more, YTD level reached S20.7 B, higher by 6.4% than August 2016.
Remarkable gains in the exports of Machinery and Transport Equipment (+75%), Electronic Equipment and Parts (+71.3%), and Coconut Oil (+61.2%), moreover, sustained the exports expansion in August. Other gainers included Metal Components (+22.6%), Other Manufactured Goods (+13.8%), and Electronic products (+3.5%). YTD exports totaled to $54 B, showing a 13.5% y-o-y gain.
Electronic products kept its post as the top export commodity, with total receipts worth $2.9 B, and responsible for 51.9% of exports revenue in August. It grew by 3.5% from August 2016. Semiconductors correspondingly accounted for the biggest share at 37.7% among electronic products. It rose by 3.6% to $2.8 B from a year ago.
Other Manufactured goods, likewise, increased by 13.8% to $373.3 M, followed by Machinery and Transport Equipment. This commodity, snatching a 4.9% share to total exports, rose by a whopping 75% to $271 M from $155 M it earned last year.
Meanwhile, Ignition Wiring Set and Other Wiring Sets Used in Vehicles, Aircrafts and Ships registered a 2.7% decline to $183.5 M for a 3.3% share. Outbound shipments of Coconut Oil finished the list in fifth place with a $160.8 M (2.9%) contribution to total shipments, posted a hefty gain of 61.2%
United States of America surprisingly outranked Japan as the top export destination, with export receipts amounting to $835 M, responsible for 15.2% of total exports. Its performance rose by 7.4% from the $777.1 M total of the previous year. Hong Kong in third place also surged by 21.9% to $792.6 M from the $650.1 M in the same period last year, to obtain a 14.4% share. On the other hand, exports to Japan (in 2nd place) declined by 13.6%. It contributed 15% to total exports, with shipment totaling $827.4 M. Exports to China ($605 M) and Singapore ($297.5), likewise, fell by 0.4% and 15.8%, respectively.
Almost half of the total exports in July headed towards East Asian (EA) nations, valued at $2.7 B, which represented a 2.8% expansion y-o-y. Shipments to the ASEAN countries
Figure 8 - OFW Remittances Growth
Source of Basic Data: Bangko Sentral ng Pilipinas

The Market Call - November 2017
9
Macroeconomy
The USD/PHP still lost against the greenback in the last four consecutive months, as it fell by 0.7% from the previous month.
the medium term as U.S. dollar Treasuries’ yields improve with solid economic growth.
OutlookThe economy’s twin-engines--domestic demand and exports—continue to propel growth in H2. Robust NG spending especially on infrastructure and consumers’ opening their wallets with better-than-expected OFW remittances fuel the first engine. A second upgrade by the
Exchange Rates vs US $ for Selected Asian Countries
Sep-17 Oct-17 YTD
AUD -0.7% 2.2% -6.0%
CNY -1.7% 1.0% -4.3%
INR 0.6% 1.1% -4.0%
IDR -0.2% 1.6% 0.8%
KRW 0.1% 0.2% -4.2%
MYR -1.6% 0.3% -5.2%
PHP 0.3% 0.7% 3.1%
SGD -0.8% 0.6% -5.3%
THB -0.3% 0.3% 7.1%
Note: Positive changes mean depreciation and negative changes mean appreciation against the greenbackSource of Basic Data: x-rates.com
Cash remittances (i.e. coursed through banks), likewise increased by 7.8% to reach $2.5 B. Bulk of the remittances came from land-based workers, accounting for about 80%. Remittances from this group registered a 6% growth, further supported by the 3.2% increase in sea-based workers. Most of the remittances came from the United Arab Emirates (UAE), United States, Singapore and Qatar.
Meanwhile, the peso equivalent of these inflows also outperformed July, as it posted a 17.4% growth, bolstered by the 9% y-o-y peso depreciation. This just confirms our view that remittances will continue to swell and provide a big boost to consumer spending in H2.
Peso on Depreciation Streak The USD/PHP still lost against the greenback in the last four consecutive months, as it fell by 0.7% from the previous month. The peso averaged at P51.34/$ in September, the highest level in 10 years. The pair almost breached another psychological resistance as it ranged from P50.83/$ to P51.79/$, with slightly wider volatility measure of 0.27 from 0.16 in September. The rise in the U.S. treasury yields and the better-than-expected U.S. manufacturing data, which increased the investors’ bullish sentiment toward the USD asset, drove the PH currency weakness in October. Despite the weakness, the peso’s depreciation will have negligible effect on inflation (or exchange rate pass-through) as our studies show that every 10% depreciation adds only some 0.55% to inflation.
Other emerging currencies, likewise, stumbled for reasons mentioned earlier along with the looming Fed policy rate hike. The rupiah (IDR) recorded its 10-month low as investors redirected their investments to the U.S. India’s rupee (INR) also stumbled, hitting its 6-month low on weak domestic data as fears that inflation in India might exceed the Central Bank’s target remained. The investment outflows from the emerging countries reflected the weakness in Chinese yuan (CNY), the Malaysian ringgit (MYR), and Thai baht (BHT).
The actual USD/PHP rate in October still lodged above both the 30-day and 200-day moving averages (MAs) supporting our view that the peso will continue to be under pressure in
Figure 9 - Daily Dollar-Peso Exchange Rate
Source of Basic Data: Bangko Sentral ng Pilipinas (BSP)

The Market Call - November 2017
10
Macroeconomy
The strength of the U.S. economy and its financial markets will continue to put pressure on the peso, but we may have
a little respite in November and December when OFWs bring home more U.S. dollars.
IMF of their world growth forecast in October 2017 with the synchronized growth of advanced economies led by the US providing the power for exports expansion.
• NG infrastructure expenditures showed sustained vitality in September 2017, while the above-20% jump in tax revenues signal a vibrant economy in H2.
• OFW remittances (in US$) climbed by 9.4% in August and 17.4% in peso terms provide much spending power to consumers. These remittances, especially scaled in pesos, should continue to rise double-digit for the rest of the year.
• With the U.S. economy expanding by 3% in Q3 on top of 3.1% in Q2, and E.U., Japan and China growing above expectations, we think exports will accelerate further in Q4, and provide the additional thrust to bring PH GDP growth within government targets.
• The mini-fly in the ointment was inflation which has moved up at a faster pace of 3.5% in October, but well within the 2% to 4% target of the BSP. We think this has peaked and so do not expect an upward adjustment of BSP’s policy rate in 2017, even if (very likely) the Fed hikes its policy rate by another 25 bps in December.
ForecastsRates November December January
Inflation (y-o-y %) 3.2 3.2 3.4
91-day T-Bill (%) 2.31 2.36 2.36
Peso-Dollar (P/$) 51.21 51.37 51.4
10-year T-Bond (%) 5.23 5.25 5.28
Source: Authors’ Estimates
Figure 10 - Dollar-Peso Exchange Rates & Moving Average
Source of Basic Data: Bangko Sentral ng Pilipinas (BSP)
• The strength of the U.S. economy and its financial markets will continue to put pressure on the peso. We may have a little respite in November and December when OFWs bring home more U.S. dollars.
The Market Call - November 2017
11
Fixed Income Securities
Bond Yields Slide in Auctions, but Rise in Weak Second Market
Bond markets have gone through a roller coaster ride as changes in expectations on monetary policy and crude oil prices dominated sentiment. The Philippine bond market did not escape this. Bond yields in the primary market for government securities both for Treasury bills and Treasury bonds eased compared to September, while trading volume in the secondary market hit year lows and pushed the yield curve slightly upward.
Outlook: With the case for a prolonged low interest rate environment remaining intact, the slightly upward trend in yields both here and abroad will likely play out. However, the recent pattern of upticks in longer-term US Treasury bond yields quickly correcting would likely stay. Locally, the further minimal rise in inflation to 3.5% in October--likely the peak for 2017—do not provide sufficient reason for the BSP to hike policy rates this year. Abundant domestic savings and relatively low NG domestic borrowing needs for the rest of the year and into Q1-2018 would help limit the upside in bond yields.
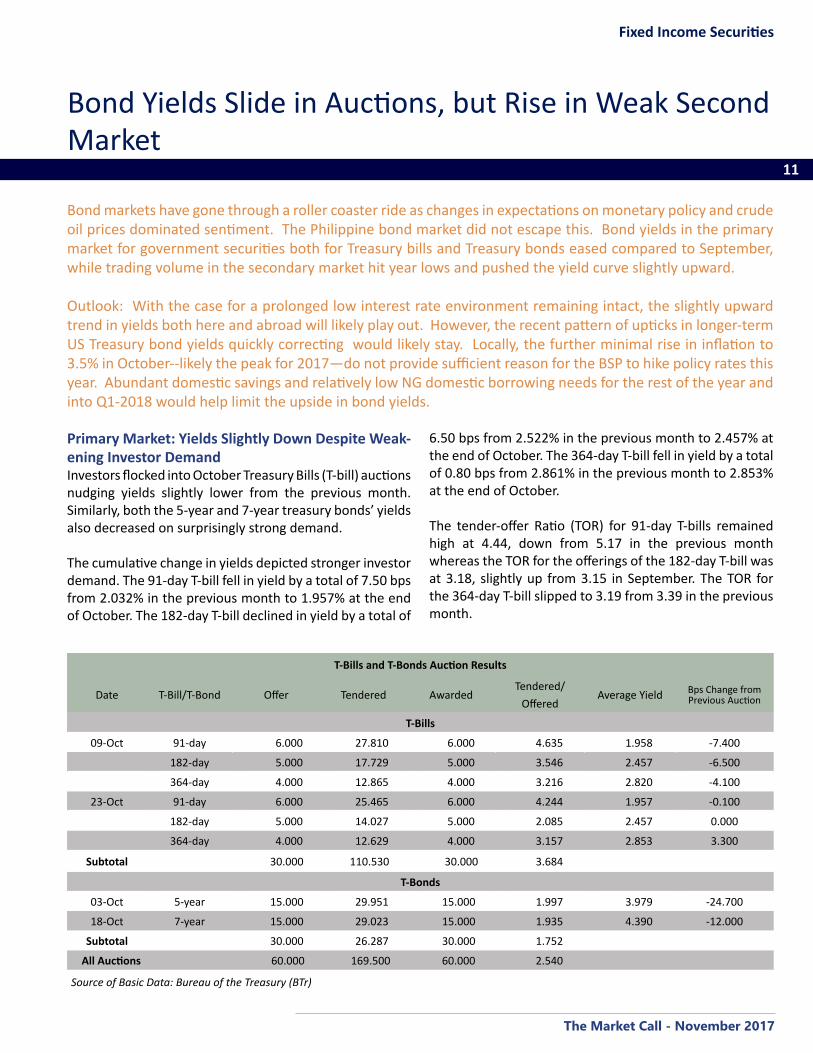
Primary Market: Yields Slightly Down Despite Weak-ening Investor DemandInvestors flocked into October Treasury Bills (T-bill) auctions nudging yields slightly lower from the previous month. Similarly, both the 5-year and 7-year treasury bonds’ yields also decreased on surprisingly strong demand.
The cumulative change in yields depicted stronger investor demand. The 91-day T-bill fell in yield by a total of 7.50 bps from 2.032% in the previous month to 1.957% at the end of October. The 182-day T-bill declined in yield by a total of
T-Bills and T-Bonds Auction Results
Date T-Bill/T-Bond Offer Tendered AwardedTendered/
OfferedAverage Yield Bps Change from
Previous Auction
T-Bills
09-Oct 91-day 6.000 27.810 6.000 4.635 1.958 -7.400
182-day 5.000 17.729 5.000 3.546 2.457 -6.500
364-day 4.000 12.865 4.000 3.216 2.820 -4.100
23-Oct 91-day 6.000 25.465 6.000 4.244 1.957 -0.100
182-day 5.000 14.027 5.000 2.085 2.457 0.000
364-day 4.000 12.629 4.000 3.157 2.853 3.300
Subtotal 30.000 110.530 30.000 3.684 T-Bonds
03-Oct 5-year 15.000 29.951 15.000 1.997 3.979 -24.700
18-Oct 7-year 15.000 29.023 15.000 1.935 4.390 -12.000
Subtotal 30.000 26.287 30.000 1.752
All Auctions 60.000 169.500 60.000 2.540
Source of Basic Data: Bureau of the Treasury (BTr)
6.50 bps from 2.522% in the previous month to 2.457% at the end of October. The 364-day T-bill fell in yield by a total of 0.80 bps from 2.861% in the previous month to 2.853% at the end of October.
The tender-offer Ratio (TOR) for 91-day T-bills remained high at 4.44, down from 5.17 in the previous month whereas the TOR for the offerings of the 182-day T-bill was at 3.18, slightly up from 3.15 in September. The TOR for the 364-day T-bill slipped to 3.19 from 3.39 in the previous month.

The Market Call - November 2017
12
Fixed Income Securities
Total secondary trading volume for October plunged by 47.5% (m-o-m) to P138.9 B, the lowest level recorded so far in 2017.
The 5-year treasury bond had a yield of 3.979%, down 24.7 bps from 4.226% three months ago, reflecting stron-ger demand from investors. It had a TOR of 2.00 up from 1.41 in the previous offering. The 7-year treasury bond had a yield of 4.390%, down 12 bps from 4.510% two months ago, despite having a mild slippage in TOR of 1.94 from 2.26 in the previous auction.
Secondary Market: October Trading Plunges to Year’s Lowest Level Total secondary trading volume for October plunged by 47.5% month-on-month (m-o-m) to P138.9 B, the lowest level recorded so far in 2017. A minor consolation comes for its 1.7% improvement year-on-year (y-o-y) from P136.6 B recorded last October 2016. The yearly decrease in volume can be attributed to the decline in the supply of liquid, long-dated papers in the market, and generally weaker demand as investors remained wary of the impact of possible Fed policy rate hikes. In addition, however, year-to-date (YTD) trading volume declined to P2.4 T recorded in October 2017, a 12.2% drop from P2.7 T a year ago.
Source: Philippine Dealing Systems (PDS)
Figure 13 - PDST-R2 Yield Curves
Source: Philippine Dealing Systems (PDS)
Figure 11 - Trading Volume Trend (in Million Pesos)
0
100
200
300
400
500
600
700
800
900
Jul-1
3
Oct-1
3
Jan-
14
Apr-1
4
Jul-1
4
Oct-1
4
Jan-
15
Apr-1
5
Jul-1
5
Oct-1
5
Jan-
16
Apr-1
6
Jul-1
6
Oct-1
6
Jan-
17
Apr-1
7
Jul-1
7
Oct-1
7
We observe a slight upward movement of the yield curve, as yields generally moved upward in October practically across all tenors.
Source: Philippine Dealing Systems (PDS)
Figure 12 - Average Daily Trading Volume/Week (In Billion Pesos)
0
5
10
Oct 2 - Oct 6 Oct 9 - Oct 13 Oct 17 - Oct 20 Oct 23 - Oct 27 Oct-30
Oct 2017 Average = P6.9 B Oct 2016 Average = P6.8 B
5-year T-bond yields fell by 12.5 bps during the month. On the other hand, the 2-year bond yield rose by 29.8 bps, even as the 10-year yield moved up slower by 18.7 bps. 10-year to 2-year spread, thus, narrowed to 71 bps from 83 bps in September. This represents a spread reduction of 12 bps (see ASEAN +1 table below). This may reflect earlier overshooting of yields in anticipation of Fed policy rate hikes, which skipped September.

The Market Call - November 2017
13
Fixed Income Securities
Overall secondary trading of corporate bonds for October 2017 continued to slide, reaching only P3.3 B, a further 17.4%
reduction (m-o-m) and a decline of 22.8% y-o-y.
Source: Philippine Dealing Systems (PDS)
Figure 16 - Corporate Trading (In Million Pesos)Liquid FXTN tenors continued to post lower yields than FXTN tenors under PDST-R2. The difference in the 20-year space narrowed slightly as 20-yr R2 remained almost unchanged while the liquid FXTN-20-17 yield edged up by 1 bp. In the 10-year bucket, the difference hardly changed.
Corporate Bonds: Trading Further Weakens Following the Decline in GS VolumesOverall secondary trading of corporate bonds for October 2017 continued to slide from September and from the same month in 2016. It reached only P3.3 B, a further 17.4% reduction (m-o-m) from P4 B, and a decline of 22.8% y-o-y from P4.2 B in October last year. The weak October performance brought up YTD trades to P39.4 B, still up by 7.4% from the same period last year, but the growth showed a slowdown from 11.3% expansion YTD in September.
Bond trading volume of five leading corporate issues – Power Sector Assets and Liabilities Management (PSALM), San Miguel Brewery (SMB), Ayala Land, Inc. (ALI), Ayala Corporation (AC) and SM Investments Corporation (SMIC) – saw generally negative movement as trading activity improved for only two out of the five leading corporations.
Source: Philippine Dealing Systems (PDS)
Figure 14 - PDST-R2 vs. FXTN Yields (Month-end)
Source: Philippine Dealing Systems (PDS)
Figure 15 - Total Corporate Trade Volume (In Million Pesos)
ALI once again placed first, trading P300 M, despite plunging by 49.3% m-o-m. SMB and SMIC came in second and third, with trades of P215.5 M and P200.4 M, respectively. These are the two issuers that showed more trades, where SMB improved by 7.4% m-o-m, while SMIC
The Market Call - November 2017
14
Fixed Income Securities
Sources: First Metro Investment Corporation (FMIC) & Philippine Dea-ling Systems (PDS)
Figure 17 - ROPs Yield (Month-on-Month Changes)
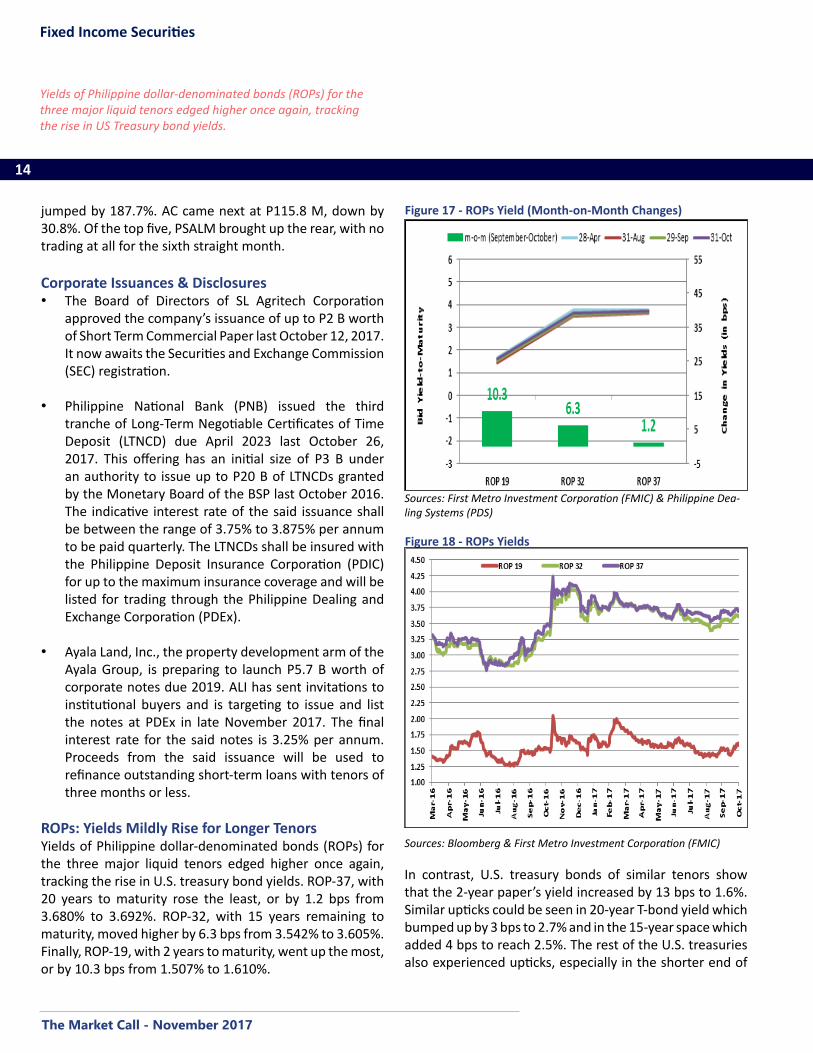
Yields of Philippine dollar-denominated bonds (ROPs) for the three major liquid tenors edged higher once again, tracking the rise in US Treasury bond yields.
jumped by 187.7%. AC came next at P115.8 M, down by 30.8%. Of the top five, PSALM brought up the rear, with no trading at all for the sixth straight month.
Corporate Issuances & Disclosures • The Board of Directors of SL Agritech Corporation
approved the company’s issuance of up to P2 B worth of Short Term Commercial Paper last October 12, 2017. It now awaits the Securities and Exchange Commission (SEC) registration.
• Philippine National Bank (PNB) issued the third tranche of Long-Term Negotiable Certificates of Time Deposit (LTNCD) due April 2023 last October 26, 2017. This offering has an initial size of P3 B under an authority to issue up to P20 B of LTNCDs granted by the Monetary Board of the BSP last October 2016. The indicative interest rate of the said issuance shall be between the range of 3.75% to 3.875% per annum to be paid quarterly. The LTNCDs shall be insured with the Philippine Deposit Insurance Corporation (PDIC) for up to the maximum insurance coverage and will be listed for trading through the Philippine Dealing and Exchange Corporation (PDEx).
• Ayala Land, Inc., the property development arm of the Ayala Group, is preparing to launch P5.7 B worth of corporate notes due 2019. ALI has sent invitations to institutional buyers and is targeting to issue and list the notes at PDEx in late November 2017. The final interest rate for the said notes is 3.25% per annum. Proceeds from the said issuance will be used to refinance outstanding short-term loans with tenors of three months or less.
ROPs: Yields Mildly Rise for Longer TenorsYields of Philippine dollar-denominated bonds (ROPs) for the three major liquid tenors edged higher once again, tracking the rise in U.S. treasury bond yields. ROP-37, with 20 years to maturity rose the least, or by 1.2 bps from 3.680% to 3.692%. ROP-32, with 15 years remaining to maturity, moved higher by 6.3 bps from 3.542% to 3.605%. Finally, ROP-19, with 2 years to maturity, went up the most, or by 10.3 bps from 1.507% to 1.610%.
Sources: Bloomberg & First Metro Investment Corporation (FMIC)
Figure 18 - ROPs Yields
In contrast, U.S. treasury bonds of similar tenors show that the 2-year paper’s yield increased by 13 bps to 1.6%. Similar upticks could be seen in 20-year T-bond yield which bumped up by 3 bps to 2.7% and in the 15-year space which added 4 bps to reach 2.5%. The rest of the U.S. treasuries also experienced upticks, especially in the shorter end of

The Market Call - November 2017
15
Fixed Income Securities
U.S. GDP increased at a 3.0% annual rate in Q3 as an increase in inventory investment and a smaller trade deficit offset a hurricane-related slowdown in consumer spending
and a decline in construction.
Sources: Asian Development Bank (ADB), The Economist & UA&P*1-yr yields are used for PH because 2-yr papers are illiquid
Spreads between 10-year and 2-year T-Bonds
Country 2-year Yields
10-year Yields
Projected Inflation
Rates
Real 10-year yield
10 year to 2-year Spread (bps) Spread
Change (bps)Latest
Policy RateReal Policy
Rate29-Sep-17 30-Oct-17
US 1.574 2.368 2.00 0.37 85.00 79.00 -6.00 1.00 -1.00
PRC 3.570 3.960 1.70 2.26 32.00 39.00 7.00 4.35 2.65
Indonesia 6.219 6.831 3.90 2.93 49.00 61.00 12.00 4.25 0.35
Malaysia 3.293 4.041 3.90 0.14 72.00 75.00 3.00 3.00 -0.90
Thailand 1.439 2.330 0.70 1.63 83.00 89.00 6.00 1.50 0.80
Philippines 2.852 4.795 3.20 1.60 83.00 71.00 -12.00 3.50 0.30
the curve, such that ROPs’ spreads over U.S. treasuries slid slightly downwards as the U.S. treasury yields ended up a bit flatter.
ASEAN + 1 Market: EMs Expect Further Growth in Q3; December Fed Hike Remains ImminentU.S.: U.S. CPI recorded their biggest increase in eight months, with headline inflation rising by 0.5% in September from a month ago, which pushed up the y-o-y gain in the CPI to 2.2% from 1.9% in August. The culprit was gasoline prices which surged in the wake of hurricane-related production disruptions at oil refineries in the Gulf Coast area. Gasoline prices increased by 13.1% m-o-m in September and accounted for 75% of the increase in the CPI. Nonetheless, consumer confidence soared to 125.9 in October from 120.6 in September, marking its highest level in almost 17 years at the back of strong job growth. Thus, share prices hit record highs owing also to strong economic growth, a surge in corporate earnings and increasing expectations of tax reform, and as the country recovers from Hurricanes Harvey and Irma. Analysts think that the elevated level of consumer confidence, supported by the performance of the job market, suggests the economy will continue to expand at a solid pace. The U.S. economy added 261,000 jobs in October and the unemployment rate was at 4.1%. While the new jobs fell below expectations but data for the past two months showed upward revision of 90,000. GDP increased at an annualized rate of 3% in Q3 versus market expectations of 2.5 %, after expanding at a 3.1 %
pace in Q2, as an increase in inventory investment and a smaller trade deficit offset a hurricane-related slowdown in consumer spending and a decline in construction.
As widely anticipated, the Fed did not raise interest rates at its latest policy meeting, but with the recent release of strong employment data in October, market expectations of a rate increase in December have increased to about 96%. Following the release of stronger-than-expected economic data, the yield on the U.S. 10-year T-bond yields hit a high of 2.475% in October, its highest level in eight months, but this have retreated strongly in early November as markets viewed the House tax package with skepticism. Orders for durable goods shot up 2.2% and new home sales surged 18.9% for the month of September, beating market expectations of a 1% increase and 0.9% fall, respectively. 10-year to 2-year spread fell by 6 bps from 85 bps to 79 bps.
PRC: China’s manufacturing purchasing managers’ index (PMI) for the month of September stood at 52.4 marking the 14th straight month of expansion (i.e. above-50) for the country’s manufacturing industry and the highest level since May 2012. China’s foreign exchange reserves posted an eighth-straight monthly rise in September, climbing by $17 B to $3.11 T, due to easier credit, capital curbs, and a stronger yuan. These factors may also help the country escape the pressure from the impending Fed rate hikes. Exports increased by 8.1% in September on improving global outlook, while imports rose by 18.7%, resulting in a trade surplus of $28.5 B.
The Market Call - November 2017
16
Fixed Income Securities
Aggressive deleveraging policies, accelerating inflation, and the risk that the People’s Bank of China may follow the Fed in raising borrowing costs have cast a shadow over the entire bond market.
Inflation remained stable in September, as CPI rose by only 1.6% (y-o-y) due to weakened food prices. In contrast, the producer price index (PPI) was up by 6.9% (y-o-y) in September, accelerating from 6.3% in August, on higher demand for commodities.
Meanwhile, monetary officials anticipate that the economy will expand by 7% (y-o-y) for the rest of 2017 bolstered by strong consumer spending, as well as by exports due to a brighter global outlook.
The People’s Bank of China (PBOC) announced a targeted reserve requirement ratio (RRR) cut to encourage inclusive financing at commercial banks. Commercial banks, whose annual outstanding or new loans in inclusive financing accounts for 1.5% will enjoy a 0.5 percentage point RRR cut from PBOC’s benchmark level starting next year. This is an effort by the government to ease liquidity, especially for small businesses.
China sold its first sovereign dollar bonds since 2004. It will offer with $1 B worth of 5-year bonds priced at 15 bps over US Treasuries and $1 B worth of 10-year bonds priced at 25 bps over U.S. treasuries. The said issuance will help establish a benchmark for pricing of China’s sovereign bonds. Aggressive deleveraging policies, accelerating inflation, and the risk that PBOC may follow the Fed in raising borrowing costs have cast a shadow over China’s bond market. Analysts now anticipate large increased in corporate yields next year as appetite for bonds dwindles and authorities roll out measures that target higher-risk investments. China’s benchmark 10-year government bond extended a slump last October 30, pushing the yield up by 8 bps to 3.93%, the highest since 2014, while the cost on five-year notes jumped 9 bps to 3.97%. The central bank may boost borrowing costs in open-market operations before or after a potential Fed rate increase in December. 10-year to 2-year spread rose slightly by 7 bps from 32 bps to 39 bps.
Indonesia: Indonesia’s annual inflation eased to 3.72% in September from the 3.82% recorded in August, on the back of a continued decline in food prices. Bank
Indonesia (BI) says a weak rupiah would be temporary as the government can keep inflation low while the country currently has a balance of payment surplus. Monetary officials attributed the weakening of the rupiah to the developments in the U.S., i.e. the December hike by the Fed and President Trump’s tax reform plan.
BI’s consumer confidence index stood at 123.8 in September, up from 121.9 in August, suggesting that consumers have more upbeat expectations of improved job availability and business activities over the next six months. The country’s retail sales in August rose 2.2% from a year earlier after a contraction of 3.3% in July, which was mainly supported by the sales of food.
The country’s foreign exchange reserves hit a record-high of $129.4 B at the end of September, $500 M higher than in August, amidst improving exports proceeds and auctions of the bank’s forex bills.
The country posted an external trade surplus for a second straight month in September of $1.8 B versus the $1.7 B in August, as exports rose by 15.6% (y-o-y) in September. Meanwhile, monetary officials asserted that a rupiah exchange rate level of around 13,500 per dollar is “competitive for Indonesia”, as the rupiah has dropped to its weakest level since December, trading within a range of IDR13,455 to IDR13,517 per dollar.
Foreign direct investments (FDI) rose by 12% in Q3 equivalent to $8.3 B. BI estimates 2017 GDP growth of around 5.1% to 5.2% in H2 versus the 5.01% recorded in H1.
Strong gains in trade, hotel and restaurant, and manufacturing industries would likely drive H2 growth. Moreover, BI announced that it would start euro hedging transactions with commercial banks to encourage diverse financing sources for the economy. It expects this to help liquidity management and the maintenance of the rupiah exchange rate stability as the central bank intends to keep the domestic interest rate low to boost growth, despite the expected Fed’s planned policy rate hikes.

The Market Call - November 2017
17
Fixed Income Securities
Finally, BI kept its benchmark rate steady at 4.25% for the month of October, saying the decision was in line with efforts to maintain stability in consumer prices and the rupiah. 10-year to 2-year spread, however, moved up by 12 bps from 49 bps to 61 bps.
Malaysia: Industrial production in August rose by 5.9% from a year earlier on strong exports of manufactured goods, slowing slightly from the previous month’s figure of 6.1% (y-o-y). Malaysia’s exports in August beat economists’ estimates, rising 21.5% from a year earlier on higher shipments of manufactured products and liquefied natural gas. However, after four consecutive months of inflation below 4%, it jumped by 4.3% y-o-y in September, largely driven by higher fuel prices. Thus, core inflation, which excludes prices of fresh food and administered prices, remained stable at 2.4% for the second straight month.
The ringgit has strengthened to 4.2378 against the U.S. dollar, tracking the rise in crude oil prices with Brent oil closing October at a two-year high of $60.90 per barrel.
Foreign holdings of Malaysian bonds hit MYR200.1 B (+4.9% m-o-m) for the month of September, the highest level in seven months, amid the current landscape of modest volatility and low yields. Supported by the strengthening of the ringgit against the USD and robust economic fundamentals, September posted MYR9.3 B of net foreign direct investments, as risk-on sentiment prevailed as with perceived risks vis-a-vis geopolitical tensions subsided. Amid renewed expectations of another Fed rate hike, corporate bond issuance climbed up to MYR18.1 B in September as issuers took the opportunity to lock in better rates ahead of the rate tightening. 10-year to 2-year spread inched higher by 3 bps, from 72 bps to 75 bps.
Thailand: Volatility in the Thai baht is expected to continue as various risks remain in the global economy, such as U.S. tax reforms, monetary and trade policies. Thailand’s top business group raised its 2017 economic growth forecast from 3.7% to 4% from an initial projection of 3.5% to
The baht’s strength, however, remains a risk to export growth, as the currency appreciated by 8.3% this year, the
most among Asian currencies.
4%, citing stronger-than-expected exports and signs of recovery in private consumption and investment. Exports are now expected to increase by 6.5% to 7.5% this year, owing to a recovery in major trade partners’ economies. Exports rose for a seventh straight time, surging by 12.2% (y-o-y) in September to a record high $21.8 B as demand bloated. The baht’s strength, however, remains a risk to export growth, as the currency has appreciated by 8.3% this year, the most among Asian currencies. On the other hand, despite strong imports growth, Thailand still had a trade surplus of $3.4 B in September.
The country’s industrial output rose for a third straight month in September, as the manufacturing production index (MPI) increased by 4.21% from a year earlier on higher production of automobiles, rubber and electronics. The amount of bond defaults reached BHT14.8 B by September. On the other hand, the Finance Ministry approved the issuance of baht-denominated bonds by the Laos government and Nam Ngum 2 Power Co., with both foreign entities being required to issue the baht-denominated bonds in Thailand by May 31, 2018.
Meanwhile, concerns of a faster pace of Fed policy rate with the corresponding capital outflows from EMs, should a new Fed chief prove to be hawkish. Such development could cause volatility in global financial markets. 10-year to 2-year spread moved slightly higher by 6 bps, from 83 bps to 89 bps.
Source: Asian Development Bank (ADB)
Figure 19 - ASEAN Bond Yields

The Market Call - November 2017
18
Fixed Income Securities
Despite the recent acceleration in inflation due to higher oil prices, we expect this to reverse in Q4 when inflation should average more closely to 3% as crude oil prices retrace its advance.
OutlookThe U.S. Fed’s announcement on September 20 to start reducing its balance sheet in October has put the nail in the coffin of rising U.S. Treasury bond yields.
• While we have seen a sharp rise in benchmark 10-year U.S. treasury bond yields especially after the Fed’s an-nouncement regarding its balance sheet reduction, the upside for bond yields appear limited as forecasts of U.S. inflation even up to Q4 have remained at 1.7%. Besides, since disruption in the petroleum products supply chain due to Typhoons Harvey and Irma had driven up the recent inflation, the likely normalization in Q4 should ease the price pressures.
• At home, the rise in bond yields would likely be mut-ed, given overarching liquidity and less government deficit and borrowing than earlier expected. Govern-ment spending, especially on infrastructures, has held above 10%, but absorptive capacity and execution dif-ficulties remain.
• Despite the recent acceleration in inflation due to higher oil prices, we expect this to reverse in Q4 when inflation should average more closely to 3%, as crude oil prices retrace its advance.
• While there exists a respectable number of issues in the pipeline, the December lull and the ASEAN sum-mit in November would likely slow down the rate of new issuances.
• So far, ROPs prices have been doing better than U.S. treasuries, but this may not hold true in Q4, as for-eign investors may focus more on Indonesian and In-dian sovereign bonds and less on ROPs. However, this tendency may be partly offset by locals shifting more funds into U.S. dollar-denominated ROPs as part of in-vestors’ efforts to rebalance their portfolios and risks.
The Market Call - November 2017
19
Equity Markets
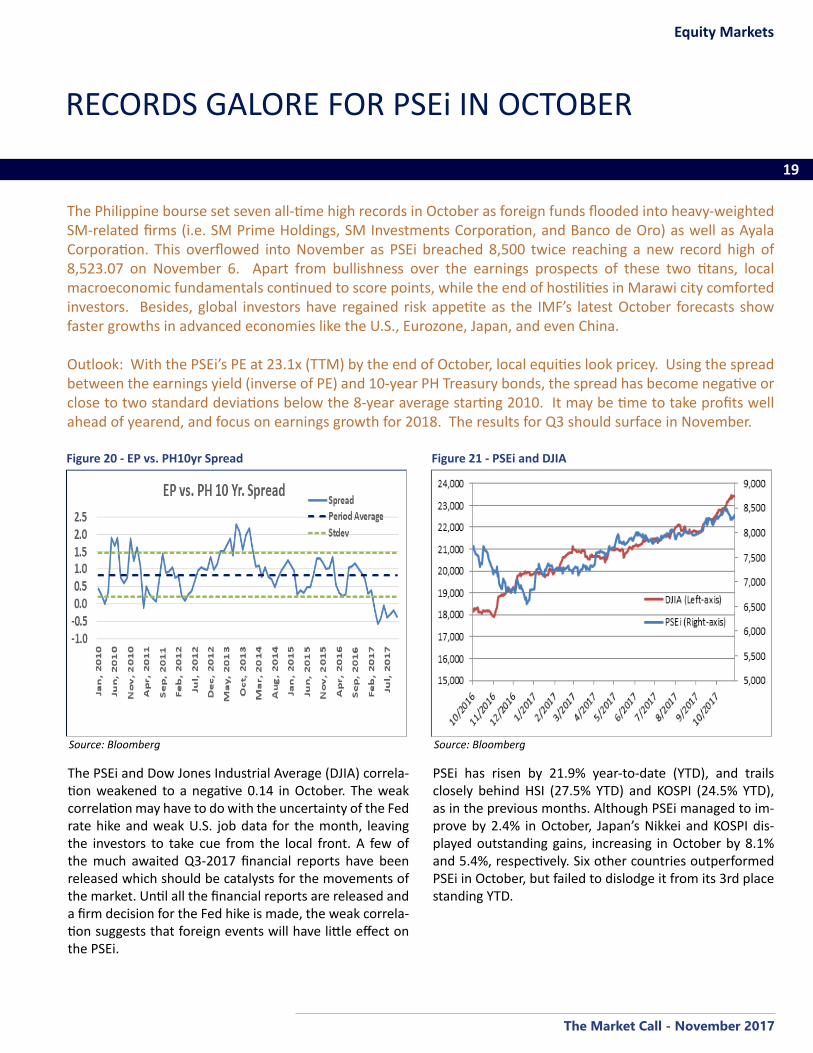
The Philippine bourse set seven all-time high records in October as foreign funds flooded into heavy-weighted SM-related firms (i.e. SM Prime Holdings, SM Investments Corporation, and Banco de Oro) as well as Ayala Corporation. This overflowed into November as PSEi breached 8,500 twice reaching a new record high of 8,523.07 on November 6. Apart from bullishness over the earnings prospects of these two titans, local macroeconomic fundamentals continued to score points, while the end of hostilities in Marawi city comforted investors. Besides, global investors have regained risk appetite as the IMF’s latest October forecasts show faster growths in advanced economies like the U.S., Eurozone, Japan, and even China.
Outlook: With the PSEi’s PE at 23.1x (TTM) by the end of October, local equities look pricey. Using the spread between the earnings yield (inverse of PE) and 10-year PH Treasury bonds, the spread has become negative or close to two standard deviations below the 8-year average starting 2010. It may be time to take profits well ahead of yearend, and focus on earnings growth for 2018. The results for Q3 should surface in November.
RECORDS GALORE FOR PSEi IN OCTOBER
The PSEi and Dow Jones Industrial Average (DJIA) correla-tion weakened to a negative 0.14 in October. The weak correlation may have to do with the uncertainty of the Fed rate hike and weak U.S. job data for the month, leaving the investors to take cue from the local front. A few of the much awaited Q3-2017 financial reports have been released which should be catalysts for the movements of the market. Until all the financial reports are released and a firm decision for the Fed hike is made, the weak correla-tion suggests that foreign events will have little effect on the PSEi.
Source: Bloomberg
Figure 21 - PSEi and DJIA
PSEi has risen by 21.9% year-to-date (YTD), and trails closely behind HSI (27.5% YTD) and KOSPI (24.5% YTD), as in the previous months. Although PSEi managed to im-prove by 2.4% in October, Japan’s Nikkei and KOSPI dis-played outstanding gains, increasing in October by 8.1% and 5.4%, respectively. Six other countries outperformed PSEi in October, but failed to dislodge it from its 3rd place standing YTD.
Source: Bloomberg
Figure 20 - EP vs. PH10yr Spread

The Market Call - November 2017
20
Equity Markets
Company Symbol 9/29/17 Close
10/30/17 Close
% Change
Metrobank MBT 86.50 86.60 0.1%
Banco de Oro BDO 130.70 137.50 5.2%
Bank of the Philippine Islands BPI 99.45 98.00 -1.5%
Security Bank Corporation SECB 243.20 246.00 1.2%
Source of Basic Data: PSE Quotation Reports
Company Symbol 9/29/17 Close
10/30/17 Close
% Change
Meralco MER 283.00 291.80 3.1%
Aboitiz Power AP 42.85 42.50 -0.8%
Robinsons Retail Holdings,
Inc.RRH 99 97 -2.0%
Jollibee Foods Corporation JFC 243.80 249.00 2.1%
Puregold Price Club, Inc. PCGMF 52.15 51.00 -2.2%
First Gen Corporation FGEN 18.92 17.58 -7.1%
Universal Robina Corporation URC 152.80 143.00 -6.4%
Petron Corporation PCOR 10.48 9.74 -7.1%
Source of Basic Data: PSE Quotation Reports
The Financial sector rallied, as it grew by 2% in October from -1.4% in the previous month. Leading the sector, BDO Unibank, Inc. (BDO) registered a 5.2% increase in October after reporting a 16.9% y-o-y growth in Q3-2017 income to reach P7.1 B, despite this just being in line with expectations.
Security Bank Corporation (SECB) enjoyed a minor uptick of 1.2% in October. The bank disclosed its plans to issue P20 B worth of long-term negotiable certificates of depos-it (LTNCD) to extend the maturity profile of its liabilities.
Metropolitan Bank & Trust Co. (MBT) ended flat, rising by 0.1% in October. MBT increased its stake in Metrobank Card Corporation (MCC) to 100%, after buying 40% from its joint venture partner, ANZ Funds Pty. Ltd. (ANZ).
Bank of the Philippine Islands (BPI) decreased by 1.5% due to a downtrend that continued with the heavy foreign sell-ing of BPI shares worth P356 M that occurred in the third week of October.
The PSEi managed to grow by 2.4% in October, despite weak net foreign buying of P84 M, as investors settled with profit-taking, resulting to large yet almost equal buying and selling.
Sources: Bloomberg & Yahoo Finance
Global Equities Markets Performances
Region Country IndexGrowth
Rate (m-o-m)
2017 YTD
Americas US DJIA 4.3% 17.6%
Europe Germany DAX 3.1% 14.1%
London FTSE 101 1.6% 4.4%
East Asia Hong Kong HSI 2.5% 27.5%
Shanghai SSEC 1.3% 8.2%
Japan NIKKEI 8.1% 12.3%
South Korea KOSPI 5.4% 24.5%
Asia-Pacific Australia S&P/ASX 200 4.2% 3.2%
Southeast Asia Indonesia JCI 1.8% 13.8%
Malaysia KLSE -0.4% 6.9%
Thailand SET 2.9% 10.1%
Philippines PSEi 2.4% 21.9%
Singapore STRAITS 4.8% 16.4%
Source of Basic Data: PSE Quotation Reports
Monthly Sectoral Performance
29-Sep-17 30-Oct-17
Sector Index % Change Index % Change
PSEi 8,171.4 2.7% 8,365.3 2.4%
Financial 1,961.2 -1.4% 2,001.1 2.0%
Industrial 11,146.9 1.4% 10,910.8 -2.1%
Holdings 8,221.7 4.9% 8,557.9 4.3%
Property 3,850.9 3.5% 3,945.5 2.5%
Services 1,716.2 -0.3% 1,708.2 -0.5%
Mining and Oil 13,954.3 5.3% 13,224.5 -5.2%
The PSEi managed to grow by 2.4% in October, despite weak net foreign buying of P84 M. With the lack of market catalysts and uncertainty of a Fed rate hike, investors set-tled with profit taking, resulting to large yet almost equal buying and selling. The board showed mixed results, with Holdings taking the lead with a 4.3% uptick. Property and Financial sectors followed with a 2.5% and 2% increase, respectively. Ending relatively flat, the Services sector posted a minor slump of 0.5% in October. Industrial and Mining and Oil sectors ended in deeper red, with a loss of 2.1% and 5.2%, respectively.
The Market Call - November 2017
21
Equity Markets
Leading the Holdings sector which gained by 4.3% in October, SM Investments Corporation soared by 8.1%, after its property
segment opened a new mall in Tuguegarao, the capital of Cagayan.
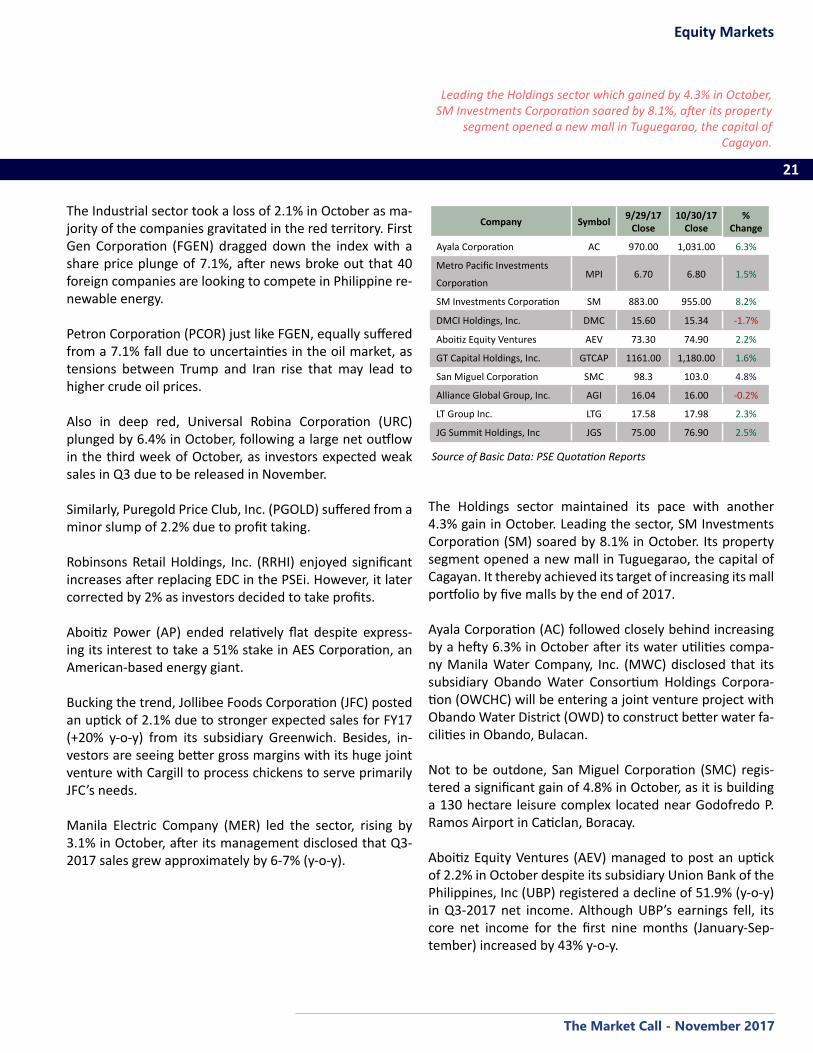
The Holdings sector maintained its pace with another 4.3% gain in October. Leading the sector, SM Investments Corporation (SM) soared by 8.1% in October. Its property segment opened a new mall in Tuguegarao, the capital of Cagayan. It thereby achieved its target of increasing its mall portfolio by five malls by the end of 2017.
Ayala Corporation (AC) followed closely behind increasing by a hefty 6.3% in October after its water utilities compa-ny Manila Water Company, Inc. (MWC) disclosed that its subsidiary Obando Water Consortium Holdings Corpora-tion (OWCHC) will be entering a joint venture project with Obando Water District (OWD) to construct better water fa-cilities in Obando, Bulacan.
Not to be outdone, San Miguel Corporation (SMC) regis-tered a significant gain of 4.8% in October, as it is building a 130 hectare leisure complex located near Godofredo P. Ramos Airport in Caticlan, Boracay.
Aboitiz Equity Ventures (AEV) managed to post an uptick of 2.2% in October despite its subsidiary Union Bank of the Philippines, Inc (UBP) registered a decline of 51.9% (y-o-y) in Q3-2017 net income. Although UBP’s earnings fell, its core net income for the first nine months (January-Sep-tember) increased by 43% y-o-y.
The Industrial sector took a loss of 2.1% in October as ma-jority of the companies gravitated in the red territory. First Gen Corporation (FGEN) dragged down the index with a share price plunge of 7.1%, after news broke out that 40 foreign companies are looking to compete in Philippine re-newable energy.
Petron Corporation (PCOR) just like FGEN, equally suffered from a 7.1% fall due to uncertainties in the oil market, as tensions between Trump and Iran rise that may lead to higher crude oil prices.
Also in deep red, Universal Robina Corporation (URC) plunged by 6.4% in October, following a large net outflow in the third week of October, as investors expected weak sales in Q3 due to be released in November.
Similarly, Puregold Price Club, Inc. (PGOLD) suffered from a minor slump of 2.2% due to profit taking.
Robinsons Retail Holdings, Inc. (RRHI) enjoyed significant increases after replacing EDC in the PSEi. However, it later corrected by 2% as investors decided to take profits.
Aboitiz Power (AP) ended relatively flat despite express-ing its interest to take a 51% stake in AES Corporation, an American-based energy giant.
Bucking the trend, Jollibee Foods Corporation (JFC) posted an uptick of 2.1% due to stronger expected sales for FY17 (+20% y-o-y) from its subsidiary Greenwich. Besides, in-vestors are seeing better gross margins with its huge joint venture with Cargill to process chickens to serve primarily JFC’s needs.
Manila Electric Company (MER) led the sector, rising by 3.1% in October, after its management disclosed that Q3-2017 sales grew approximately by 6-7% (y-o-y).
Source of Basic Data: PSE Quotation Reports
Company Symbol 9/29/17 Close
10/30/17 Close
% Change
Ayala Corporation AC 970.00 1,031.00 6.3%
Metro Pacific Investments
CorporationMPI 6.70 6.80 1.5%
SM Investments Corporation SM 883.00 955.00 8.2%
DMCI Holdings, Inc. DMC 15.60 15.34 -1.7%
Aboitiz Equity Ventures AEV 73.30 74.90 2.2%
GT Capital Holdings, Inc. GTCAP 1161.00 1,180.00 1.6%
San Miguel Corporation SMC 98.3 103.0 4.8%
Alliance Global Group, Inc. AGI 16.04 16.00 -0.2%
LT Group Inc. LTG 17.58 17.98 2.3%
JG Summit Holdings, Inc JGS 75.00 76.90 2.5%

The Market Call - November 2017
22
Equity Markets
The Property sector’s gains eased to 2.5% with SM Prime Holdings, Inc. leading the sector, soaring by 7.4%, with the opening of a new mall in Tuguegarao.
GT Capital Holdings, Inc. (GTCAP) also enjoyed slight gains of 1.6% in October after its subsidiary, Federal Land, re-ceived the approval of the Philippine Competition Commis-sion (PCC) to partner with a Japanese firm, Orix Risingsun Properties, Inc., to build a luxury condominium in Taguig.
Metro Pacific Investments Corporation (MPIC) trailed closely behind with an increase of 1.5% in October, as it invested an additional P2.5 B to increase the number of lanes in North Luzon Expressway (NLEX) to ease traffic con-gestion.
Alliance Global Group, Inc. (AGI) ended relatively flat in Oc-tober with a minor slump of 0.2% despite its plans to di-versify to infrastructure and build a monorail in Guadalupe and Uptown Bonifacio called Skytrain.
DMCI Holdings, Inc. (DMCI) decreased by 1.7% in October tempering its impressive 10.6% gain in Q3-2017 that was driven by its robust business segments.
Ayala Land, Inc. (ALI) also ended flat with a slight decrease of 0.7%, after losing an ownership case over a 6.8-hectare prime land in Southvale Subdivision in Las Piñas. The Su-preme Court (SC) declared Yu Hwa Ping and Mary Gaw, and their heirs, as the rightful owners of the disputed land.
Company Symbol 9/29/17 Close
10/30/17 Close
% Change
Semirara Mining and Power Corporation
SCC 46.70 42.50 -9.0%
Source of Basic Data: PSE Quotation Reports
Company Symbol 9/29/17 Close
10/30/17 Close
% Change
Ayala Land, Inc. ALI 43.50 43.20 -0.7%
SM Prime Holdings, Inc. SMPH 34.45 37.00 7.4%
Robinsons Land Corporation RLC 25.30 25.20 -0.4%
Megaworld Corporation MEG 5.23 5.33 1.9%
Source of Basic Data: PSE Quotation Reports
The Property sector’s gains eased to 2.5% with widely vary-ing performances of constituent firms. Leading the sec-tor, SM Prime Holdings, Inc. (SMPH) posted an outstanding 7.4% with the opening of a new mall in Tuguegarao and a new business strategy that allows customers to make pur-chases online and pick-ups in nearby SM malls.
Megaworld Corporation (MEG) increased by 1.9% in Oc-tober as it expects its rental revenue to increase by 20% y-o-y by the end of FY17 with the BPO industry as its main demand driver for office space.
Robinsons Land Corporation (RLC) ended relatively flat with a slump of 0.4% due to the slow roll out of projects.
Company Symbol 9/29/17 Close
10/30/17 Close
% Change
Philippine Long Distance Tel. Co. TEL 1,668.00 1,710.00 2.5%
Globe Telecom GLO 2,050.00 2,042.00 -0.4%
International Container
Terminal Services Inc.ICT 104.00 105.90 1.8%
Source of Basic Data: PSE Quotation Reports
The Services sector ended relatively flat, slumping only by 0.5% in October. Leading the sector, Philippine Long Distance Telephone Company (TEL) rose by 2.5% after in-vesting P500 M for a submarine cable link from the Phil-ippines to Africa, Europe, and other parts of Asia. TEL has also allotted P11 B for the upgrading of DSL broadbands to fiber-fast connectivity.
International Container Terminal Services, Inc. (ICT) expe-rienced gains of 1.8% in October as it invests P1.1 B for rubber tired gantries (RTG), equipment used to stack con-tainers.
Globe Telecom (GLO) ended relatively flat with a minor loss of 0.4% due to an apparent slow pace of site development in FY 2017 in response to the potential comeback of broad band provider PT&T.
The Mining and Oil sector reversed its gains (+5.3% m-o-m) in the previous month with a 5.2% drop in October. Semi-rara Mining and Power Corporation (SCC) plunged by 9% in October after its royalties to the Department of Ener-gy (DOE) for the first six months of the year nearly tripled from P575 M in the previous year to P1.7 B this year due to the significant increase in its coal production.

The Market Call - November 2017
23
Equity Markets
The total turnover decreased by 28% in October, eating up partly the 53% gain in the previous month.
Monthly Turnover (in Million Pesos)Total Turnover Average Daily Turnover
Sector Value % Change Value % Change
Financial 21,039.00 -1.9% 1,001.8 -11.2%
Industrial 30,100.00 -67.9% 1,433.3 -70.9%
Holdings 47,420.00 35.0% 2,258.1 22.1%
Property 26,544.30 -15.5% 1,264.0 -23.5%
Services 28,113.00 -13.5% 1,338.7 -21.7%
Mining and Oil 6,576.00 -16.7% 313.1 -24.6%
Total 160,163.00 -28.0% 7,626.8 -34.9%
Foreign Buying 82,467.00 -42.9% 3,927.0 -48.4%
Foreign Selling 82,384.00 -28.7% 3,923.0 -35.5%
Net Buying (Selling) 84.00 -99.7% 3.98 -99.7%
Source of Basic Data: PSE Quotation Reports
Total Turnover
The total turnover decreased by 28% in October, eating up partly the 53% gain in the previous month. Foreigners’ buying trend ended flat with a small net foreign buying of P84 M. The weak net foreign buying was due to the lack of market catalysts both abroad and in the local front. The positive outlook towards the economy and Holdings sec-tor enabled its turnover to rocket by 35%. Financial and Services sector followed with a loss of 1.9% and 13.5%, respectively. Following closely behind, the Property and Mining and Oil also decreased by 15.5% and 16.7%, re-spectively. In deep red, the Industrial sector turnover plunged by 67.9%.

The Market Call - October 2017
24
Recent Economic Indicators
NATIONAL INCOME ACCOUNTS, CONSTANT PRICES (In Million Pesos)2015 2016 2nd Quarter 2017 3rd Quarter 2017
Levels A n n u a l G.R. Levels A n n u a l
G.R. Levels Q u a r t e r l y G.R. Annual G.R. Levels Q u a r te r l y
G.R. Annual G.R.
Production Agri, Hunting, Forestry and Fishing 719,748 0.1% 710,590 -1.3% 173,875 -4.5% 6.3% 164,213 -5.6% 2.5% Industry Sector 2,535,796 6.0% 2,738,320 8.0% 756,856 9.8% 7.3% 695,200 -8.1% 7.5% Service Sector 4,338,284 6.8% 4,664,261 7.5% 1,292,066 13.1% 6.1% 1,229,016 -4.9% 7.1%
ExpenditureHousehold Final Consumption 5,264,137 6.3% 5,628,318 6.9% 1,468,147 5.2% 5.9% 1,393,848 -5.1% 4.5%Government Final Consumption 785,347 7.8% 850,747 8.3% 272,461 31.4% 7.1% 217,820 -20.1% 8.3%Capital Formation 1,805,281 15.1% 2,180,842 20.8% 573,565 -7.8% 8.7% 578,168 0.8% 6.6% Exports 3,681,166 9.0% 4,016,105 9.1% 1,248,027 4.1% 19.7% 1,346,722 7.9% 17.2% Imports 3,942,163 14.0% 4,631,536 17.5% 1,353,674 -2.7% 18.7% 1,427,855 5.5% 13.9%
GDP 7,593,828 5.9% 8,113,170 6.8% 2,222,797 10.3% 6.5% 2,088,429 -6.0% 6.9%NPI 1,540,910 5.3% 1,622,040 5.3% 423,063 -2.4% 8.6% 415,276 -1.8% 5.7%GNI 9,134,739 5.8% 9,735,210 6.6% 2,645,860 8.0% 6.8% 2,503,705 -5.4% 6.7%
Source: National Statistical Coordination Board (NSCB)
NATIONAL GOVERNMENT CASH OPERATION (In Million Pesos)2015 2016 Jul-2017 Aug-2017
Levels G r o w t h Rate Levels G r o w t h
Rate Levels M o n t h l y G.R. Annual G.R Levels M o n t h l y
G.R. Annual G.R
Revenues 2,108,956 10.5% 2,195,914 4.1% 194,621 8.2% 14.3% 230,408 18.4% 9.9%Tax 1,815,475 5.6% 1,980,390 9.1% 138,080 5.2% 17.6% 171,654 24.3% 9.0%BIR 1,433,302 7.4% 1,567,214 9.3% 34,994 -1.2% 12.9% 38,289 9.4% 15.8%BoC 367,534 -0.5% 396,365 7.8% 1,461 -0.7% -4.4% 2,351 60.9% 63.5%Others 14,639 -2.1% 16,811 14.8% 20,086 71.6% -0.9% 18,106 -9.9% 2.9%Non-Tax 293,317 54.9% 215,446 -26.5%
245,133 -9.5% 11.0% 201,600 -17.8% 13.9%Expenditures 2,230,645 12.6% 2,549,336 14.3% 42,712 -22.5% 19.3% 43,690 2.3% 20.4%Allotment to LGUs 387,559 12.6% 449,776 16.1% 44,626 131.5% 11.5% 26,370 -40.9% 12.5%Interest Payments 309,364 -3.7% 304,454 -1.6%
Overall Surplus (or Deficit) (121,689) 66.5% (353,422) -190.4% (50,512) 44.4% 0.3% 28,808 157.0% -11.7%
Source: Bureau of the Treasury (BTr)
POWER SALES AND PRODUCTION INDICATORS Manila Electric Company Sales (In Gigawatt-hours)
2016 Aug-2017 Sep-2017
Annual Levels Growth Rate Levels Y-o-Y G.R. YTD Levels Y-o-Y G.R. YTD
TOTAL 39,583 8.1% 3,686.80 6.5% 20.4% 3,752.30 9.6% 22.5% Residential 12,439 11.9% 1,163.30 7.2% 19.9% 1,176.30 8.7% 21.2% Commercial 15,648 8.2% 1,450.50 6.1% 16.6% 1,432.60 5.4% 15.1% Industrial 11,362 4.2% 1,049.40 5.1% 25.5% 1,028.40 5.9% 23.0%
The Market Call - October 2017
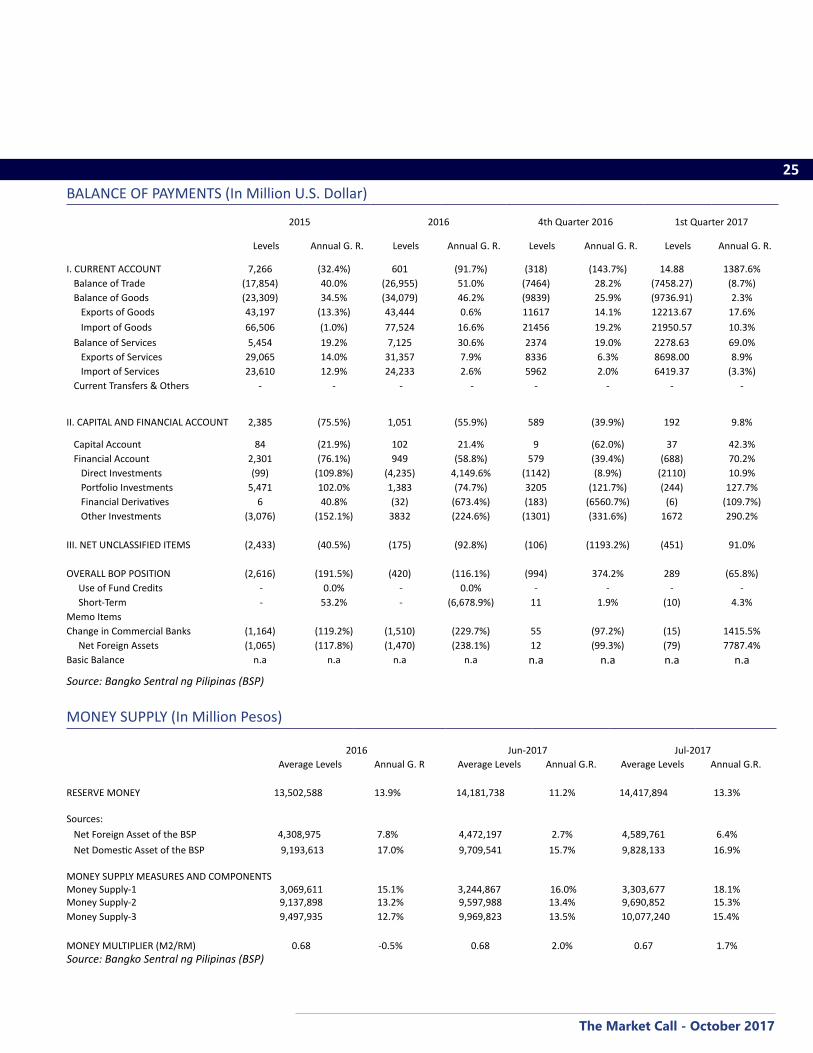
25BALANCE OF PAYMENTS (In Million U.S. Dollar)
2015 2016 4th Quarter 2016 1st Quarter 2017
Levels Annual G. R. Levels Annual G. R. Levels Annual G. R. Levels Annual G. R.
I. CURRENT ACCOUNT 7,266 (32.4%) 601 (91.7%) (318) (143.7%) 14.88 1387.6% Balance of Trade (17,854) 40.0% (26,955) 51.0% (7464) 28.2% (7458.27) (8.7%) Balance of Goods (23,309) 34.5% (34,079) 46.2% (9839) 25.9% (9736.91) 2.3% Exports of Goods 43,197 (13.3%) 43,444 0.6% 11617 14.1% 12213.67 17.6% Import of Goods 66,506 (1.0%) 77,524 16.6% 21456 19.2% 21950.57 10.3% Balance of Services 5,454 19.2% 7,125 30.6% 2374 19.0% 2278.63 69.0% Exports of Services 29,065 14.0% 31,357 7.9% 8336 6.3% 8698.00 8.9% Import of Services 23,610 12.9% 24,233 2.6% 5962 2.0% 6419.37 (3.3%) Current Transfers & Others - - - - - - - -
II. CAPITAL AND FINANCIAL ACCOUNT 2,385 (75.5%) 1,051 (55.9%) 589 (39.9%) 192 9.8%
Capital Account 84 (21.9%) 102 21.4% 9 (62.0%) 37 42.3% Financial Account 2,301 (76.1%) 949 (58.8%) 579 (39.4%) (688) 70.2% Direct Investments (99) (109.8%) (4,235) 4,149.6% (1142) (8.9%) (2110) 10.9% Portfolio Investments 5,471 102.0% 1,383 (74.7%) 3205 (121.7%) (244) 127.7% Financial Derivatives 6 40.8% (32) (673.4%) (183) (6560.7%) (6) (109.7%) Other Investments (3,076) (152.1%) 3832 (224.6%) (1301) (331.6%) 1672 290.2%
III. NET UNCLASSIFIED ITEMS (2,433) (40.5%) (175) (92.8%) (106) (1193.2%) (451) 91.0%
OVERALL BOP POSITION (2,616) (191.5%) (420) (116.1%) (994) 374.2% 289 (65.8%) Use of Fund Credits - 0.0% - 0.0% - - - - Short-Term - 53.2% - (6,678.9%) 11 1.9% (10) 4.3%Memo ItemsChange in Commercial Banks (1,164) (119.2%) (1,510) (229.7%) 55 (97.2%) (15) 1415.5% Net Foreign Assets (1,065) (117.8%) (1,470) (238.1%) 12 (99.3%) (79) 7787.4%Basic Balance n.a n.a n.a n.a n.a n.a n.a n.a
Source: Bangko Sentral ng Pilipinas (BSP)
MONEY SUPPLY (In Million Pesos)
2016 Jun-2017 Jul-2017Average Levels Annual G. R Average Levels Annual G.R. Average Levels Annual G.R.
RESERVE MONEY 13,502,588 13.9% 14,181,738 11.2% 14,417,894 13.3%
Sources: Net Foreign Asset of the BSP 4,308,975 7.8% 4,472,197 2.7% 4,589,761 6.4% Net Domestic Asset of the BSP 9,193,613 17.0% 9,709,541 15.7% 9,828,133 16.9%
MONEY SUPPLY MEASURES AND COMPONENTSMoney Supply-1 3,069,611 15.1% 3,244,867 16.0% 3,303,677 18.1%Money Supply-2 9,137,898 13.2% 9,597,988 13.4% 9,690,852 15.3%Money Supply-3 9,497,935 12.7% 9,969,823 13.5% 10,077,240 15.4%
MONEY MULTIPLIER (M2/RM) 0.68 -0.5% 0.68 2.0% 0.67 1.7%Source: Bangko Sentral ng Pilipinas (BSP)

Rabboni Francis B. ArjonilloDr. Victor A. Abola
Viory Yvonne T. JaneoRamon Alvaro G. Del Rosario
Jose Miguel D. AlonzoAugusto M. Cosio, Jr.
President, FMICSenior Economist, UA&PResearch Associate, UA&PResearch Assistant, UA&PResearch Assistant, UA&PPresident, FAMI
CONTRIBUTORS
Views expressed in this newsletter are solely the responsibilities of the authors and do not represent any position held by the FMIC and UA&P.
November 2017
The Market Call - Capital Markets Research
FMIC and UA&P Capital Markets Research