market timing log spirals - esignal file share …share.esignal.com/contentroot/forex...
TRANSCRIPT

Stocks & Commodities V17:2 (68-70): Log Spirals In The Stock Market by William T. Erman
Copyright (c) Technical Analysis Inc.
MARKET TIMING
T
The basic mathematical characteristic of the log spiral is thateven while increasing or decreasing in size, the log spiralremains constant. This is also true for rectangular spirals,the parameters of which are determined by their related logspirals. Many major market moves share the properties andpredetermined progression of these spirals, indicating theclose correlation between multiple manifestations of theordered form of nature and the architecture of marketsthemselves.
hree important turning pointsbetween 1974 and 1978 haveinfluenced the growth patternof many subsequent major andminor market moves, up to andincluding the July 20, 1998,peak and the September andOctober 1998 lows for the DowJones Industrial Average (DJIA)and the Standard & Poor’s 500,respectively. Here’s how the
triangle in Figure 1, which connects the 1974 low for the S&P500 index with the 1976 peak and 1978 low, have influencedthese subsequent market moves. The triangle seen hereconnects points 1, 2, and 3 from Figure 2. The points in Figure1 and 2 are those moves analyzed in this article.
THE CASE FOR ORDERBefore proceeding to the examples, let us review two schools
1974
76
78
80
82
83
84
87
87
90
90
98
98
80
80
1
2
3
4
5
6
7
8
9
10
11
12
13
14
15
1000
700
500
300
200
150
100
70
75 80 85 90 95 00
Standard & Poor s Composite(monthly)
497 Days
362 Days
859 Days
of thought regarding order in the markets and some propertiesof log spirals. Technical analysis has made amazing progresssince the advent of computers, but this progress has notquieted the debate between random walk proponents andadvocates of mathematically ordered markets. Random walksupporters cite the millions of subjective, individual deci-sions and unpredictable fundamental events as sufficientreasons for the impossibility of ordered markets. The oppos-ing philosophical argument in support of orderly markets isbased on the following:
• Market moves are the result of the psychological factorstranslated into market-moving decisions by the aggre-gate of participants. The participants are human beings.
• Humans are indisputably a part of nature.
• As a product of humankind, markets are as inherentlynatural as thousands of geometrically perfect honey-combed beehives produced by billions of bees.
• From the atom, to living organisms at every level, to thefarthest extent of the cosmos, nature exhibits the abilityto create order out of an infinite number of seeminglychaotic inputs. Order endures, unscathed by a perpetualbarrage of potentially disruptive influences.
• 6A DJIA, April 27, 19817 S&P, August 9, 1982
• 7A DJIA, August 12, 19828 October 11, 1983
• 8A November 30, 19839 July 25, 198410 August 25, 1987
11 October 20, 198712 July 16, 199013 October 10, 199014 July 20, 199815 DJIA, September 1, 1998
• 15A S&P, October 8, 1998
FIGURE 1: SPIRAL GROWTH PATTERNS. Points 1, 2, and 3 are connected,forming a triangle. These points influence the growth pattern of many subsequentmajor and minor moves in the market. The dots represent those moves examinedin this article.
FIGURE 2: This list represents the dates for corresponding numbered chart points in Figure 1. The dotted points denote when the DJIA and S&P reverseon different days; both dates are used in this situation. This is referred to a compound pivot.
by William T. Erman
1 S&P, October 4, 1974• 1A DJIA, December 22, 1974
2 September 22, 19763 March 1, 19784 February 13, 19805 March 27, 19806 S&P, November 26, 1980
DATE LIST
Log SpiralsIn The
Stock Market
TOPL
INE
INVE
STM
ENT
GR
APH
ICS

Stocks & Commodities V17:2 (68-70): Log Spirals In The Stock Market by William T. Erman
Copyright (c) Technical Analysis Inc.
Our work provides the math-ematical basis and evidence (seesidebar, “Ermanometry Prin-ciples”) that the markets aremerely a microcosm of thelarger natural universe in whichthey exist. As children of na-ture, markets digest and con-vert their myriad inputs intoorderly progressive patterns ofgrowth, both in time and price.
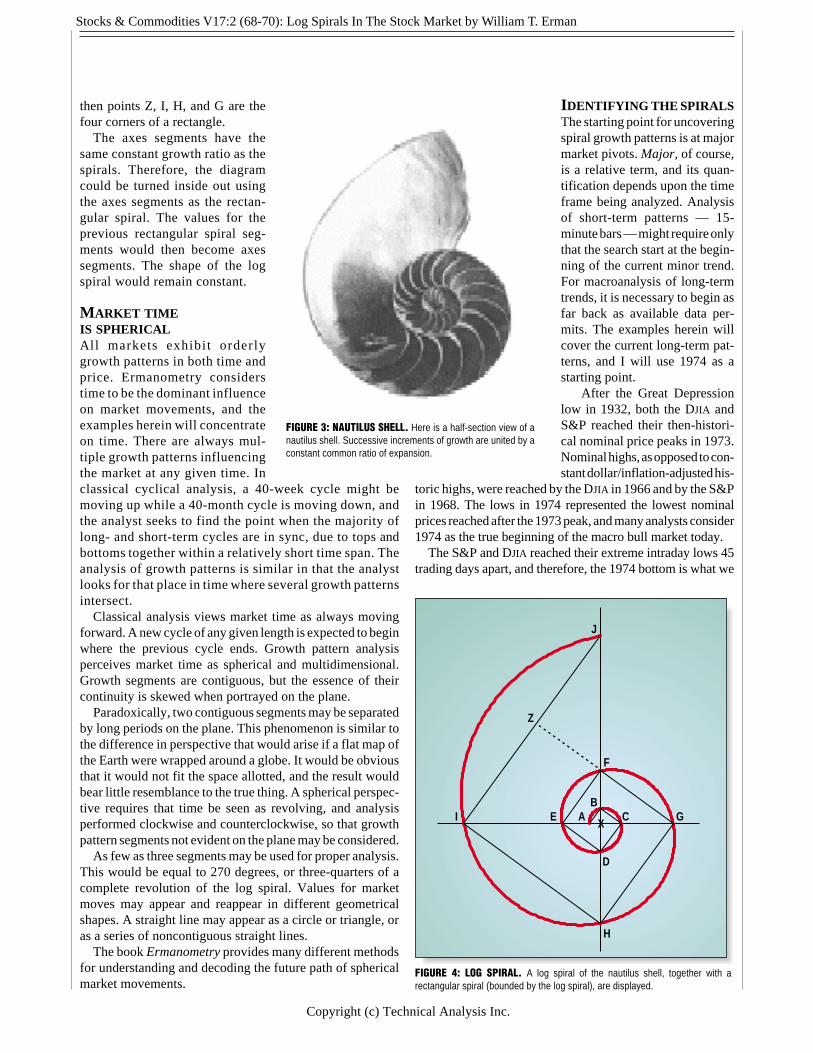
One of the best-known ex-amples of orderly progressionin nature is the nautilus mol-lusk; a half-section view of itsshell can be seen in Figure 3.As its growth forces the shellto increase in size, the essen-tial shape of the shell neverchanges. The radius increasesproportionately as the shellgrows longer. Successive in-crements of growth are unitedby a constant, common ratio ofexpansion.
Figure 4 approximates thespiral growth curve of the nauti-lus. Two perpendicular lines,similar to polar axes, have beendrawn through the center of thespiral at point X. As the spiralcurves around point X, it crossesthe axes at a series of pointslabeled A through J. These pointshave been connected with a se-ries of straight lines. Each line isperpendicular to the precedingand successive lines in the se-ries. Adjoining pairs of theselines are the legs of successivelylarger right triangles, with seg-ments of the axes forming thehypotenuse of each triangle. InFigure 4, the triangle EFG haslegs EF and FG, and axis seg-ment EG is the hypotenuse.
Also in Figure 4, the lineseries A-J is a rectangular spi-ral. Extension of any line in theseries A-J, past the point atwhich it meets an adjacent linein the series to the point at whichit intersects another line in theseries, creates a rectangle. Forexample, if line GF is extendedto intersect line IJ at point Z, BA
RBA
RA
BR
UC
H
Stocks & Commodities V17:2 (68-70): Log Spirals In The Stock Market by William T. Erman
Copyright (c) Technical Analysis Inc.
then points Z, I, H, and G are thefour corners of a rectangle.
The axes segments have thesame constant growth ratio as thespirals. Therefore, the diagramcould be turned inside out usingthe axes segments as the rectan-gular spiral. The values for theprevious rectangular spiral seg-ments would then become axessegments. The shape of the logspiral would remain constant.
MARKET TIMEIS SPHERICALAll markets exhibit orderlygrowth patterns in both time andprice. Ermanometry considerstime to be the dominant influenceon market movements, and theexamples herein will concentrateon time. There are always mul-tiple growth patterns influencingthe market at any given time. Inclassical cyclical analysis, a 40-week cycle might bemoving up while a 40-month cycle is moving down, andthe analyst seeks to find the point when the majority oflong- and short-term cycles are in sync, due to tops andbottoms together within a relatively short time span. Theanalysis of growth patterns is similar in that the analystlooks for that place in time where several growth patternsintersect.
Classical analysis views market time as always movingforward. A new cycle of any given length is expected to beginwhere the previous cycle ends. Growth pattern analysisperceives market time as spherical and multidimensional.Growth segments are contiguous, but the essence of theircontinuity is skewed when portrayed on the plane.
Paradoxically, two contiguous segments may be separatedby long periods on the plane. This phenomenon is similar tothe difference in perspective that would arise if a flat map ofthe Earth were wrapped around a globe. It would be obviousthat it would not fit the space allotted, and the result wouldbear little resemblance to the true thing. A spherical perspec-tive requires that time be seen as revolving, and analysisperformed clockwise and counterclockwise, so that growthpattern segments not evident on the plane may be considered.
As few as three segments may be used for proper analysis.This would be equal to 270 degrees, or three-quarters of acomplete revolution of the log spiral. Values for marketmoves may appear and reappear in different geometricalshapes. A straight line may appear as a circle or triangle, oras a series of noncontiguous straight lines.
The book Ermanometry provides many different methodsfor understanding and decoding the future path of sphericalmarket movements.
AB
C
D
E
F
G
H
I
J
X
Z
IDENTIFYING THE SPIRALSThe starting point for uncoveringspiral growth patterns is at majormarket pivots. Major, of course,is a relative term, and its quan-tification depends upon the timeframe being analyzed. Analysisof short-term patterns — 15-minute bars — might require onlythat the search start at the begin-ning of the current minor trend.For macroanalysis of long-termtrends, it is necessary to begin asfar back as available data per-mits. The examples herein willcover the current long-term pat-terns, and I will use 1974 as astarting point.
After the Great Depressionlow in 1932, both the DJIA andS&P reached their then-histori-cal nominal price peaks in 1973.Nominal highs, as opposed to con-stant dollar/inflation-adjusted his-
toric highs, were reached by the DJIA in 1966 and by the S&Pin 1968. The lows in 1974 represented the lowest nominalprices reached after the 1973 peak, and many analysts consider1974 as the true beginning of the macro bull market today.
The S&P and DJIA reached their extreme intraday lows 45trading days apart, and therefore, the 1974 bottom is what we
FIGURE 3: NAUTILUS SHELL. Here is a half-section view of anautilus shell. Successive increments of growth are united by aconstant common ratio of expansion.
FIGURE 4: LOG SPIRAL. A log spiral of the nautilus shell, together with arectangular spiral (bounded by the log spiral), are displayed.

Stocks & Commodities V17:2 (68-70): Log Spirals In The Stock Market by William T. Erman
Copyright (c) Technical Analysis Inc.
ERMANOMETRY PRINCIPLESThe day count and determination of turning points for themarket moves illustrated in this article are based on certainprinciples of Ermanometry. Following is a brief explanationof the pertinent principles:
• Pivot: The day when a specific market move, either upor down, reaches its extreme intraday high or lowprice. Closing prices are not considered.
• Measuring time: Time is measured in increments assmall as 15 minutes. The largest increment is a singletrading day. Time is never measured in weeks ormonths. Ermanometry does not count days when themarkets do not trade.
• Compound pivot: The S&P and DJIA are consideredone market and are always analyzed in concert. Acompound pivot occurs when the two indices recordtheir extreme prices on different days. Currently, bothmade their high extremes on July 20, but their lowswere made 26 trading days apart: September 1, and
October 8. Each of these low days represents thelowest intraday price subsequent to the July 20th top.Therefore, they are identified as two components of acompound pivot. The components are interchange-able and may be mixed and matched — time may bemeasured from a previous pivot to all components ofa compound pivot. It is quite common to measure froma DJIA pivot to an S&P pivot, and vice versa. Theproperties of the DJIA and S&P pivots are shared bya third pivot, termed the balance point. A balance pointis that day precisely in between the two index pivots.Therefore, the balance point for the September 1stand October 8th index pivots would be 13 days for-ward from the DJIA low and 13 days back from the S&Plow.
• Ermanometry allows for a maximum error factor of twodays. This margin holds regardless of the length ofmoves being analyzed, including moves of 20,000days or more.
—W.T.E.
refer to as a compound pivot: S&P, October 4, 1974; DJIA,December 9, 1974. Both indices made important lows on bothdays, but the DJIA made a lower low on December 9 and the S&Pheld above its October 4th low. Since the S&P pivot came first,it is the logical starting point for identifying a macro log spiral.
The first move of sufficient importance considered inidentifying a macro log spiral is the advance from the S&P1974 low to the 1976 top. On Figure 1, the heavy lineconnecting points 1 and 2 shows this 497-day move. Thesecond move is the decline from 1976 to 1978, points 2 and3, 362 days. The third move is from the 1974 low to the 1978low, points 1 and 3, 859 days. Ermanometry considers thetime distance between any two important pivots as a separateand distinct move, even if it encompasses other importantmoves. Though the 859 days from low to low (points 1 and 3)have already been considered a 497-day advance and a 362-day decline, the 859 days are treated as a third move.
Only two moves, which will be referred to as seed seg-ments when referring to log and rectangular spirals, can beused to initially identify growth patterns because a constantratio of growth must be established. The 497- and 362-daysegments will be used first:
Step 1: Calculate the ratio between 497 and 362:
497/362 = 1.37293
The inverse of the ratio must also be calculated so that the spiralmay wind counterclockwise as well as clockwise:
1/1.37293 = 0.72836
A minimum of three segments, 270 degrees/three quadrants,should be used when rotating counterclockwise.
Step 2: Place the seed segment values, 362 and 497, on segments
DE and EF of the rectangular spiral. Using DE and EF allows forthree segments counterclockwise. (See Figure 5.)
Step 3: The values for the remaining segments of the rectangu-lar spiral may be calculated using the constant growth/decayratios derived in step 1.
(497)(1.37293) = 682.35(682)(1.37293) = 936.81, etc.
The following table shows the values for the rectangular sprialsegments:
SegmentsAB = 139.88BC = 192.05CD = 263.67DE = 362.00 (seed segment)EF = 497.00 (seed segment)FG = 682.35GH = 936.81HI = 1,286.17IJ = 1,765.83
EXAMPLESNumerous techniques exist for relating the spiral segments toimportant tops and bottoms in the stock market. Refer toFigure 2 for the numbered points on the charts. The datesdesignated with an “A” are compound dates; for example,points 6 and 6A represent the peaks for the S&P in 1980 andthe DJIA in 1981, 103 days apart. These points are the extremehighs for the respective indices after the 1980 low, andtogether, they make up a compound pivot.
Figure 6 begins the illustrations of how the various seg-ments of the spiral constitute future market moves. The sumof the two seed segments, DE and EF, added to the segment90-degree counterclockwise, CD, totals 1,122.67 days. This

Stocks & Commodities V17:2 (68-70): Log Spirals In The Stock Market by William T. Erman
Copyright (c) Technical Analysis Inc.
AB
C
D
E
F
G
H
I
J
X
Z
497
362
A
B
C
D
E
F
G
H
IX
1974
76
78
80
82
83
84
87
87
90
90
98
98
80
80
1
2
3
4
5
6
7
8
9
10
11
12
13
14
15
1000
700
500
300
200
150
100
70
75 80 85 90 95 00
Standard & Poor s Composite(monthly)
PROJECTING THE 1982 LOW
CD 263.67DE 362EF 497
1122.67
1122 - 25 Daysis the number of days from point 3, the 1978 low, to the 1982low. Three perpendicular lines, or 270 degrees, become asingle straight line that is the four-year move.
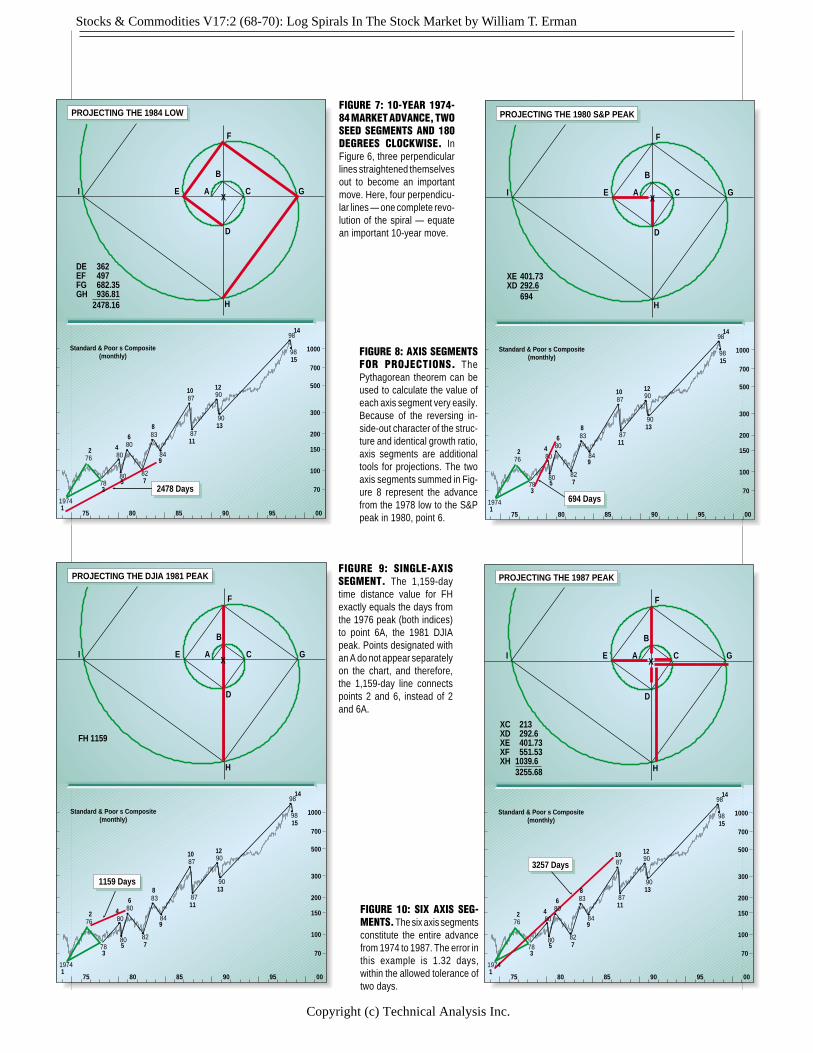
Moving ahead, Figure 7 shows how the two seed seg-ments clockwise, 180 degrees, add up to the entire 10-yearmove, 1974-84. While Figure 6 showed how three perpen-dicular lines straightened themselves out to become animportant move, Figure 7 shows how four perpendicularlines, one complete revolution of the spiral, equate animportant 10-year move.
Another technique to project turning points is to use thePythagorean theorem. Figure 8 shows an example of using theaxis segments for projections. The Pythagorean theorem canbe used to calculate the value of each axis segment. Because ofthe reversing inside-out character of the structure and identicalgrowth ratio, axis segments are additional tools for projections.The two axis segments summed in Figure 8 represent theadvance from the 1978 low to the S&P peak in 1980, point 6.
The next technique is to use a single axis segment forprojections. Examining Figure 9 reveals that the 1,159-daytime distance value for FH exactly equals the days from the1976 peak (both indices) to point 6A, the 1981 DJIA peak.Points designated with an “A” do not appear separately on thechart, and therefore, the 1,159-day line connects points 2 and6 instead of points 2 and 6A.
Figure 10 is the sum of the six axis segments, and theresults constitute the entire advance from 1974 to 1987. Theerror in this example is 1.32 days, within the allowed toler-
FIGURE 5: SEED SEGMENTS. The seed segment values are placed on thesegments DE and EF of the rectangular spiral.
FIGURE 6: PROJECTING THE 1982 LOW. Points 1, 2, and 3 are called seed points.All seed points are valid points from which to project forward, with values derivedfrom the spirals. When a projected point does in fact become an important pivot, thatnew pivot is considered part of the spiral family and becomes a valid point fromwhich to project forward.
ance of two days.What about the crash low in 1987? Figure 11 shows how
the four spiral segments connect the 1982 low with the crashlow of 1987. Note that segments CD, DE, EF connected the1978 low to the 1982 low. (Refer to Figure 6.) The additionof one more segment counterclockwise, BC, by 90 degrees,and the total added to the 1982 low completes the entire movefrom 1974 to 1987, low to low.
If we extend our range and use the larger spiral segments,we can see that in Figure 12, we can project more distantpivots. The projection missed the actual pivot day by 1.8days. However, as in all growth pattern analysis, multiplespirals, from many different time frames, were used toconfirm this projection.
The peak in the market that occurred in the summer of 1998is examined in Figure 13. The first three spiral segmentstotaled the move illustrated in Figure 6. The next two seg-ments, FG and GH, total 1,619 days, the move from 1978 to1984. In Figure 6, this move is shown emanating from the
TOPL
INE
INVE
STM
ENT
GR
APH
ICS
Stocks & Commodities V17:2 (68-70): Log Spirals In The Stock Market by William T. Erman
Copyright (c) Technical Analysis Inc.
A
B
C
D
E
F
G
H
IX
1974
76
78
80
82
83
84
87
87
90
90
98
98
80
80
1
2 4
6
7
8
9
10
11
12
13
14
15
1000
700
500
300
200
150
100
70
75 80 85 90 95 00
Standard & Poor s Composite(monthly)
PROJECTING THE 1984 LOW
DE 362EF 497FG 682.35GH 936.81
2478.16
35
2478 Days
1974
76
78
80
82
83
84
87
87
90
90
98
98
80
80
1
2 4
6
7
8
9
10
11
12
13
14
15
1000
700
500
300
200
150
100
70
75 80 85 90 95 00
Standard & Poor s Composite(monthly)
PROJECTING THE DJIA 1981 PEAK
FH 1159
35
A
B
C
D
E
F
G
H
IX
1159 Days
A
B
C
D
E
F
G
H
IX
76
7882
83
84
87
87
90
90
98
98
80
1
2 4
6
7
9
10
11
12
13
14
15
1000
700
500
300
200
150
100
70
75 80 85 90 95 00
Standard & Poor s Composite(monthly)
PROJECTING THE 1987 PEAK
XC 213XD 292.6XE 401.73XF 551.53XH 1039.6
3255.68
35
1974
80
80
8
3257 Days
FIGURE 7: 10-YEAR 1974-84 MARKET ADVANCE, TWOSEED SEGMENTS AND 180DEGREES CLOCKWISE. InFigure 6, three perpendicularlines straightened themselvesout to become an importantmove. Here, four perpendicu-lar lines — one complete revo-lution of the spiral — equatean important 10-year move.
FIGURE 8: AXIS SEGMENTSFOR PROJECTIONS. ThePythagorean theorem can beused to calculate the value ofeach axis segment very easily.Because of the reversing in-side-out character of the struc-ture and identical growth ratio,axis segments are additionaltools for projections. The twoaxis segments summed in Fig-ure 8 represent the advancefrom the 1978 low to the S&Ppeak in 1980, point 6.
FIGURE 9: SINGLE-AXISSEGMENT. The 1,159-daytime distance value for FHexactly equals the days fromthe 1976 peak (both indices)to point 6A, the 1981 DJIApeak. Points designated withan A do not appear separatelyon the chart, and therefore,the 1,159-day line connectspoints 2 and 6, instead of 2and 6A.
FIGURE 10: SIX AXIS SEG-MENTS. The six axis segmentsconstitute the entire advancefrom 1974 to 1987. The error inthis example is 1.32 days,within the allowed tolerance oftwo days.
1974
76
78
80
82
83
84
87
87
90
90
98
98
80
80
1
2 4
6
7
8
9
10
11
12
13
14
15
1000
700
500
300
200
150
100
70
75 80 85 90 95 00
Standard & Poor s Composite(monthly)
PROJECTING THE 1980 S&P PEAK
XE 401.73XD 292.6
694
35
694 Days
A
B
C
D
E
F
G
H
IX

Stocks & Commodities V17:2 (68-70): Log Spirals In The Stock Market by William T. Erman
Copyright (c) Technical Analysis Inc.
76
7882
84
87
87
90
90
98
98
80
1
2 4
6
7
9
10
11
12
13
14
15
1000
700
500
300
200
150
100
70
75 80 85 90 95 00
Standard & Poor s Composite(monthly)
PROJECTING THE 1990 PEAK
GH 936.81HI 1286.17IJ 1765.83
3988.8
35
1974
80
80
8
AB
C
D
E
F
G
H
I
J
X
Z
83
3987 Days
1974 low because the seed segments were included. Theaddition of the successive spiral segment, HI, brings the totalsto 4,028, which is the exact number of days from August 12,1982, to July 20, 1998.
A DIFFERENTGEOMETRICAL SHAPEFigure 14 is provided to illustrate two principles of Ermanometrythat have already been mentioned:
1 The DJIA & S&P are considered one market and theinteraction between the two indices is very important inprojecting future pivots.
2 Ermanometry considers market time to be spherical anddifficult to graphically portray on a plane.
In Figure 14, note that the time distance from the 1970 lowto the S&P low in 1974 is 1,102 days, and 1,147 days to theDJIA low in 1974. The parallel vectors on the rectangularspiral are added together, which means that every fourth
segment is used. We can consider that these parallel vectorsactually represent the circumference of a circle that hasbeen splintered into five straight lines, and we proceed tocalculate the diameter of such a circle by dividing thecircumference by pi:
3603.11/3.14159 = 1,146.9, which rounds to 1,147
Remember that the starting point for the spirals was the 1974S&P low; 1,147 is the time distance from the 1970 low to the1974 DJIA low. It is possible to conclude that the 1,147-daydiameter gave rise to a circle visible in the segments of therectangular spiral. Removing segment AB from the preced-ing 3,603.11 circumference gives us:
3,603.11 -139.8 = 3,463.31
If once again these segments are considered segments of thecircumference of a circle, and we calculate the diameter:
3463.31/3.14159 = 1,102.4, which rounds to 1,102
FIGURE 11: FOUR SPIRAL SEGMENTS. The 1982 and 1987 lows canbe connected via these four spiral segments. Note that segments CD,DE, and EF connected the 1978 low to the 1982 low. The addition of onemore segment counter clockwise — BC, 90 degrees — and the totaladded to the 1982 low completes the entire move from 1974 to 1987,low to low.
FIGURE 12: LARGER (SPIRAL) SEGMENTS PROJECT 1990 PEAK.The projection missed the actual pivot day by 1.8 days. However, asin all growth pattern analysis, multiple spirals, from many different timeframes, were used to confirm this projection.
A
B
C
D
E
F
G
H
IX
76
7882
83
84
87
87
90
90
98
98
80
1
2 4
6
7
9
10
11
12
13
14
15
1000
700
500
300
200
150
100
70
75 80 85 90 95 00
Standard & Poor s Composite(monthly)
PROJECTING THE 1987 LOW
BC 192.05CD 263.67DE 362EF 497
1314.72
35
1974
80
80
8
1312 - 15 Days

Stocks & Commodities V17:2 (68-70): Log Spirals In The Stock Market by William T. Erman
Copyright (c) Technical Analysis Inc.
The 1,102 represents the time distance from the 1970 low tothe 1974 S&P low.
The diameters representing the moves from the 1970 lowto both the 1974 S&P and DJIA pivots, at the 1974 low,resulted in circles seen in the spiral segments. Market time“reincarnates” itself in related geometrical shapes. Theanalyst would consider the appearance of permutations oftwo previous market moves in spirals anchored by the 1978low as confirmation of an important low.
A NEW CONFIRMING SPIRALThe two seed segments used thus far are 497 and 362. Thesesegments are the advance from 1974 to 1976, and the declinefrom 1976 to 1978. A second set of seed segments is now usedto calculate a new spiral. The first seed segment is the advanceof 497 days, used previously. The second seed segment is 859,the sum of the 497-day advance and the 362-day decline, and
therefore, the time distance from the 1974 low to the 1978 low.
Step 1: Calculate the ratio between 859 and 497:
859/497= 1.72837
The inverse: 1/1.72837 = 0.57858
Step 2: Place the seed segment values, 497 and 859, onsegments EF and FG of the rectangular spiral.
Step 3: The value for the remaining segments of the rectan-gular spiral may be calculated using the constant growth/decay ratios derived in step 1.
Seed segmentAB = 55.69
A
B
C
D
E
F
G
H
IX
76
7882
83
84
87
87
90
90
98
98
80
1
2 4
6
7
9
10
11
12
13
14
15
1000
700
500
300
200
150
100
70
75 80 85 90 95 00
Standard & Poor s Composite(monthly)
PROJECTING THE 1998 PEAK
CD 263.67DE 362EF 497FG 682.35GH 936.81HI 1286.17
1314.72
35
1974
80
80
8
4028 - 4031 Days
CONFIRMING THE 1978 LOW
IJ 1765.83EF 497AB 139.8CD 263.67GH 936.81
3603.11
3603.113.14159 = 1146.9 round to 1147
3463.33.14159 = 1102.4 round to 1102
AB
C
D
E
F
G
H
I
J
X
Z
05-26-70
1147 days
S&P10-04-74
1102 days DJIA12-09-74
3603.11139.8
3463.3-AB
FIGURE 13: SUMMER 1998 PEAK. The first three spiral segments totaled themove illustrated in Figure 6. The next two segments, FG and GH, totaled 1,619days, the move from 1978 to 1984. In Figure 6, this move is shown emanating fromthe 1974 low because the seed segments were included. The addition of thesuccessive spiral segment, HI, brings the totals to 4,028, which is the exact numberof days from August 12, 1982, to July 20, 1998. FIGURE 14: DIFFERENT GEOMETRIC SHAPES. The time distance from the 1970
low to the S&P low in 1974 is 1,102 days, and 1,147 days to the DJIA low in 1974.

Stocks & Commodities V17:2 (68-70): Log Spirals In The Stock Market by William T. Erman
Copyright (c) Technical Analysis Inc.
A
B
C
D
E
F
G
H
IX
76
7882
83
84
87
87
90
90
98
98
80
1
2 4
6
7
9
10
11
12
13
14
15
1000
700
500
300
200
150
100
70
75 80 85 90 95 00
Standard & Poor s Composite(monthly)
PROJECTING THE 1982 LOW
EF 497 859 FGFG 859 = 1484.67 GH
35
1974
80
80
8
497
859
1484.67
1484.87 Days
A
B
C
D
E
F
G
H
IX
76
82
83
87
87
90
90
98
98
1
2 4
6
7
9
10
11
12
13
14
15
1000
700
500
300
200
150
100
70
75 80 85 90 95 00
Standard & Poor s Composite(monthly)
PROJECTING THE 1987 LOW
35
1974
80
80
8
CD 166.37DE 287.55EF 497FG 859GH 1484.67
3294.6 round to 3295
78
84
80
3296 Days
CD = 166.37DE = 287.55EF = 497 (seed segment)FG = 859 (seed segment)GH = 1.484.67HI = 2.566.35IJ = 4.435.6
The constant ratio of growth, 1.72837, is 26% larger than the1.37293 for the spirals already analyzed. This rapid growthcauses the spiral to expand and decrease so quickly that itcannot be drawn to scale without becoming distorted. Thedecreasing spiral becomes so small that it is unreadable.Therefore, the graphic portrayal of the 1.37293 growth ratiowill also be used to illustrate this new set of spirals. Remem-ber, while it is not to scale, the principles remain.
EXAMPLESNow, let’s look at examples using this new set of calculations.Figure 15 shows how a single spiral segment, generatedimmediately following the two seed segments, connects the
FIGURE 15: 1982 LOW CONFIRMATION. A simple three-term continuous propor-tion, A is to B as B is to C, using the constant ratio of growth and the two seedsegments to confirm the 1982 low previously projected in Figure 6.
FIGURE 16: RECONFIRMING THE 1987 CRASH LOW. Figure 10 has alreadyprojected the October 20, 1987, low. The five spiral segments in Figure 15 repeatthis projection with a total of 3,295 days. The actual number of days from the 1974low to the 1987 low is 3,296 days.
1976 peak to the 1982 low. This confirms the projectionalready made for the 1982 low by using three segments of the497–362 spiral, illustrated in Figure 6. A simple three-termcontinuous proportion of A is to B as B is to C uses theconstant ratio of growth and the two seed segments:
Segment SegmentEF 497 859 FGFG 859 1,484.67 GH
So 497 is to 859 as 859 is to 1,484.67; 1,487.67 (segment GH)is the time distance from point 2, the 1976 peak and terminusof seed segment 497, to point 7, the August 9, 1982, low.
Another interesting example uses five spiral segments toconfirm the 1987 crash low (Figure 16). Figure 11 has alreadyprojected the October 20, 1987, low. The five spiral segmentsin Figure 16 repeat this projection with a total 3,295 days. Theactual number of days from the 1974 low to the 1987 low is3,296 days.
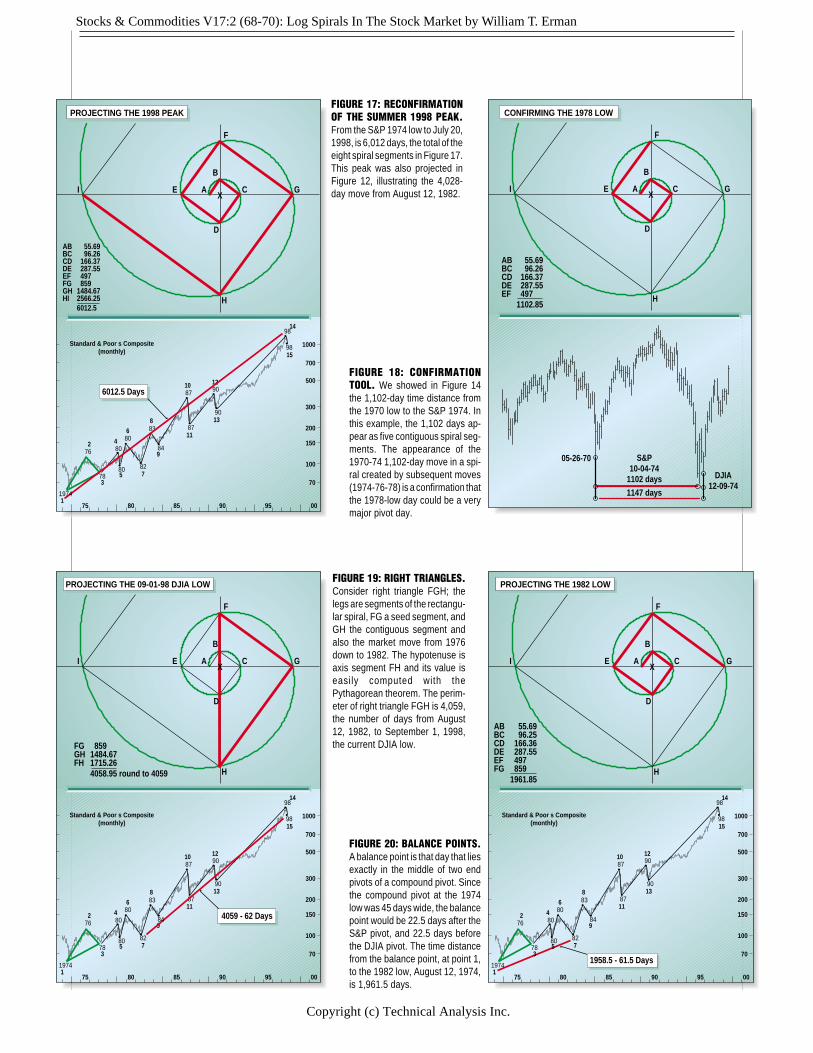
And in more recent activity, Figure 17 shows that from the
Stocks & Commodities V17:2 (68-70): Log Spirals In The Stock Market by William T. Erman
Copyright (c) Technical Analysis Inc.
76
82
83
87
87
90
90
98
98
1
2 4
6
7
9
10
11
12
13
14
15
1000
700
500
300
200
150
100
70
75 80 85 90 95 00
Standard & Poor s Composite(monthly)
PROJECTING THE 09-01-98 DJIA LOW
35
1974
80
80
8
FG 859GH 1484.67FH 1715.26
4058.95 round to 4059
78
84
80
4059 - 62 Days
A
B
C
D
E
F
G
H
IX
76
82
83
87
87
90
90
98
98
1
2 4
6
7
9
10
11
12
13
14
15
1000
700
500
300
200
150
100
70
75 80 85 90 95 00
Standard & Poor s Composite(monthly)
PROJECTING THE 1982 LOW
35
1974
80
80
8
AB 55.69BC 96.25CD 166.36DE 287.55EF 497FG 859
1961.85
78
84
80
1958.5 - 61.5 Days
A
B
C
D
E
F
G
H
IX
A
B
C
D
E
F
G
H
IX
76
82
83
87
87
90
90
98
98
1
2 4
6
7
9
10
11
12
13
14
15
1000
700
500
300
200
150
100
70
75 80 85 90 95 00
Standard & Poor s Composite(monthly)
PROJECTING THE 1998 PEAK
35
1974
80
80
8
AB 55.69BC 96.26CD 166.37DE 287.55EF 497FG 859GH 1484.67HI 2566.25
6012.5
78
84
80
6012.5 Days
A
B
C
D
E
F
G
H
IX
CONFIRMING THE 1978 LOW
AB 55.69BC 96.26CD 166.37DE 287.55EF 497
1102.85
05-26-70
1147 days
S&P10-04-74
1102 days DJIA12-09-74
FIGURE 17: RECONFIRMATIONOF THE SUMMER 1998 PEAK.From the S&P 1974 low to July 20,1998, is 6,012 days, the total of theeight spiral segments in Figure 17.This peak was also projected inFigure 12, illustrating the 4,028-day move from August 12, 1982.
FIGURE 18: CONFIRMATIONTOOL. We showed in Figure 14the 1,102-day time distance fromthe 1970 low to the S&P 1974. Inthis example, the 1,102 days ap-pear as five contiguous spiral seg-ments. The appearance of the1970-74 1,102-day move in a spi-ral created by subsequent moves(1974-76-78) is a confirmation thatthe 1978-low day could be a verymajor pivot day.
FIGURE 19: RIGHT TRIANGLES.Consider right triangle FGH; thelegs are segments of the rectangu-lar spiral, FG a seed segment, andGH the contiguous segment andalso the market move from 1976down to 1982. The hypotenuse isaxis segment FH and its value iseasily computed with thePythagorean theorem. The perim-eter of right triangle FGH is 4,059,the number of days from August12, 1982, to September 1, 1998,the current DJIA low.
FIGURE 20: BALANCE POINTS.A balance point is that day that liesexactly in the middle of two endpivots of a compound pivot. Sincethe compound pivot at the 1974low was 45 days wide, the balancepoint would be 22.5 days after theS&P pivot, and 22.5 days beforethe DJIA pivot. The time distancefrom the balance point, at point 1,to the 1982 low, August 12, 1974,is 1,961.5 days.

Stocks & Commodities V17:2 (68-70): Log Spirals In The Stock Market by William T. Erman
Copyright (c) Technical Analysis Inc.
S&P 1974 low to July 20, 1998, is 6,012 days, which is thetotal of the eight spiral segments in Figure 16. This peak wasalso projected in Figure 13, illustrating the 4,028-day movefrom August 12, 1982.
An additional example of using continuous spiral seg-ments as a confirmation tool is Figure 18. Recall that inFigure 14, the 1,102-day time distance from the 1970 low tothe S&P 1974 was considered the diameter of a circle, andreincarnated as the circumference of a circle on spiral seg-ments. In this example, the 1,102 days appear as five contigu-ous spiral segments.
The appearance of the 1970-74 1,102-day move in a spiralcreated by subsequent moves (1974-76-78) is a confirmationthat the 1978-low day could be a major pivot day. Figure 18would be used in conjunction with the illustrated example inFigure 14 as additional confirmation.
Dow Jones Industrials(actual high and low, daily)
PROJECTING THE 10/05/92 PIVOT
A
B
C
D
E
F
G
H
IX
2566.35
10-05-92
3400
3300
3200
3100
April July Oct. Jan.1992
USING DISCONTINUOUS FOUR TERM PROPORTIONS
EF 497GH 859EG 820.9FH 1079.2
3256.1
(653.39)
A
B
C
D
E
F
G
H
IX
FIGURE 21: 1992 LOW. Spiral segments, HI, added to the 1982 low,6A, projects an important low in 1992. This is the first example of aminor move, although it is minor only in relation to the other examples.A short-term trader would have considered the October 5, 1992, turna major event. This pivot is 2,566 days from the August 12, 1982, low.
FIGURE 22: TWO OPPOSING SIMILAR TRIANGLES. Only the oppos-ing triangles have been calculated, and the sum of their perimetersequals 3256. The number of days from the 1974 low to the 1987 peakis 3,257 days, as also projected in Figure 10.
OTHER TECHNIQUESRight triangles can also be usedto identify important pivot points;Figure 19 illustrates this tech-nique. Figure 8 introduced theuse of axis segments, while Fig-ure 14 introduced the concept ofmarket moves appearing in dif-ferent geometrical forms.
A very common form is the right triangle. Consider righttriangle FGH, Figure 19. The legs are segments of the rectan-gular spiral, FG a seed segment, and GH the contiguoussegment and also the market move from 1976 down to 1982.The hypotenuse is axis segment FH and its value is easilycomputed with the Pythagorean theorem. The perimeter ofright triangle FGH is 4,059, the number of days from August12, 1982, to September 1, 1998, the current DJIA low.
Another method deals with the issue of a compound pivot.As explained in the sidebar, a compound pivot occurs whenthe two indices record their extreme prices on different days.To deal with this, we use a balance point, which is that dayexactly in the middle of two end pivots of a compound pivot.Since the compound pivot at the 1974 low was 45 days wide(Figures 2 and 20), the balance point would be 22.5 days afterthe S&P pivot and 22.5 days before the DJIA pivot. The timedistance from the balance point at point 1 to the 1982 low,August 12, 1974, is 1,961.5 days. This confirms the projec-tions in Figures 6 and 15. Balance points are used extensivelyin all of the Ermanometric algorithms.
Earlier, we stated that many major and minor marketmoves were influenced by the 1974-78 market moves. Figure21, where a spiral segment, HI, added to the 1982 low, 6A,projects an important low in 1992, is the first example of aminor move, although it is minor only in relation to the otherexamples. A short-term trader would have considered theOctober 5, 1992, turn a major event. This pivot is 2,566 daysfrom the August 12, 1982, low.

Stocks & Commodities V17:2 (68-70): Log Spirals In The Stock Market by William T. Erman
Copyright (c) Technical Analysis Inc.
76
82
83
87
87
90
90
98
98
1
2 4
6
7
9
10
11
12
13
14
15
1000
700
500
300
200
150
100
70
75 80 85 90 95 00
Standard & Poor s Composite(monthly)
TURNING THE SPIRAL INSIDE OUT
35
1974
80
80
8
EX 497XG 859EF 820.9FG 1079.2
3256.1
78
84
80
3257 Days
A
B
C
D
E
F
G
H
IX
(XF = 653.39)
FIGURE 23: RECTANGULAR SEGMENTS AND AXES SEGMENTSCHANGE PLACES. Since all segments of the diagram have the samegrowth ratio, the ratios can be interchanged without changing the shapeof the spiral. Figure 23 is an example of switching the segments fromFigure 22. Now the sum of the perimeter of triangle EFG equals 3,256.
†See Traders’ Glossary for definition
BEYOND THE BASICSThe 20 examples shown thus far are merely the tip of theiceberg of future turbulence created by the market action of1974-78. There is a great deal more to this iceberg that willcause the Titanic market to continually change course atprojected pivot days. Perhaps this is a poor analogy, since inthis case the iceberg cannot sink the market! Additionalexploration can be accomplished by calculating the squareroot of the growth ratio between 497 and 859. The growthratio we have been using for these two seed segments is1.72837, and the square root of the ratio is 1.31467, which wewill now use as a growth ratio to get deeper inside the spiral.
(497)(1.31467) = 653.3934(653.3934)(1.31467) = 859
Only the original seed segments are placed on the spiral. (Thespiral diagram is not to scale.) The axes segments can becalculated, as explained previously.
Now, in Figure 22, we are summing the perimeters of twoopposing similar triangles. Only the opposing triangles havebeen calculated and the sum of their perimeters equals 3,256.The number of days from the 1974 low to the 1987 peak is3,257 days, as also projected in Figure 10.
Moving to Figure 23, we see that if the value 820.9 (fromFigure 22) is placed on segment EF, and segments FG, EX,and XG are calculated with the square root of the sameconstant growth ratio used throughout the 497–859 seedsegment example, the result is a right triangle, EFG. Theperimeter of this triangle equals the perimeters of the twoopposing triangles in Figure 22. Earlier, I stated that the axessegments and spiral segments, by virtue of a common growthratio, could be interchanged without changing the shape ofthe spiral. This principle is illustrated in Figure 23, where theaxes segments EG and FH from Figure 22 are used as spiralsegments and the spiral segments, EF and GH from Figure 22,become axes segments EX and XG. This type of exercise maybe redundant, but I have presented it to illustrate differentapproaches to analyzing spiral segments.
CONCLUDING COMMENTSWe may appreciate the markets for their harmonious anddisciplined movements, and even as objects of beauty. How-ever, that admiration can only bring esthetic rewards. A truebelief in perfectly patterned markets should spur the reader touncover more evidence of order and to profit from it.Ermanometry uses many other algorithms for pattern analy-sis, and not only do they have to confirm growth analysisprojections, but spirals from different time frames mustintersect at future pivot points to increase the potential of anyspecific date.
William Erman, the founder of Ermanometry Research, wishesto express his appreciation to Sam Hale, CMT, chairman ofthe Body of Knowledge Committee, the Market TechniciansAssociation, for his review and constructive commentaryduring the evolution of the bases of Ermanometry, and to
Robert Prechter, Jim Tillman, and Walter Bressert for pio-neering work in making the investment community aware ofthe importance of timing analysis. This article is dedicated toJeffrey Horovitz, the former director of The Foundation forthe Study of Cycles, whose support has never wavered.Charts were supplied by Topline Investment Graphics.
RELATED READINGErman, William T. [1999]. Ermanometry: The Perfectly
Patterned Markets, Ermanometry Research, Box 50785,Nashville, TN 37205.
Dunham, William [1990]. Journey Through Genius, JohnWiley & Sons.
Gleick, James [1987]. Chaos, Viking Penguin, New York.Huntley, H.E. [1970]. The Divine Proportion, Dover Publi-
cations, New York.Reichenbach, Hans [1958]. The Philosophy Of Space And
Time, Dover Publications, New York.Thompson, D’Arcy [1961]. On Growth And Form, Cam-
bridge University Press.Topline Investment Graphics, PO Box 2340, Boulder, CO
80306-2340, 303 440-0157, www.topline-charts.com.
S&C