market structure, fragmentation, and market quality paul bennett li wei new york stock exchange...
TRANSCRIPT

Market Structure, Fragmentation, and Market Quality
Paul BennettLi Wei
New York Stock Exchange
December, 2005
2
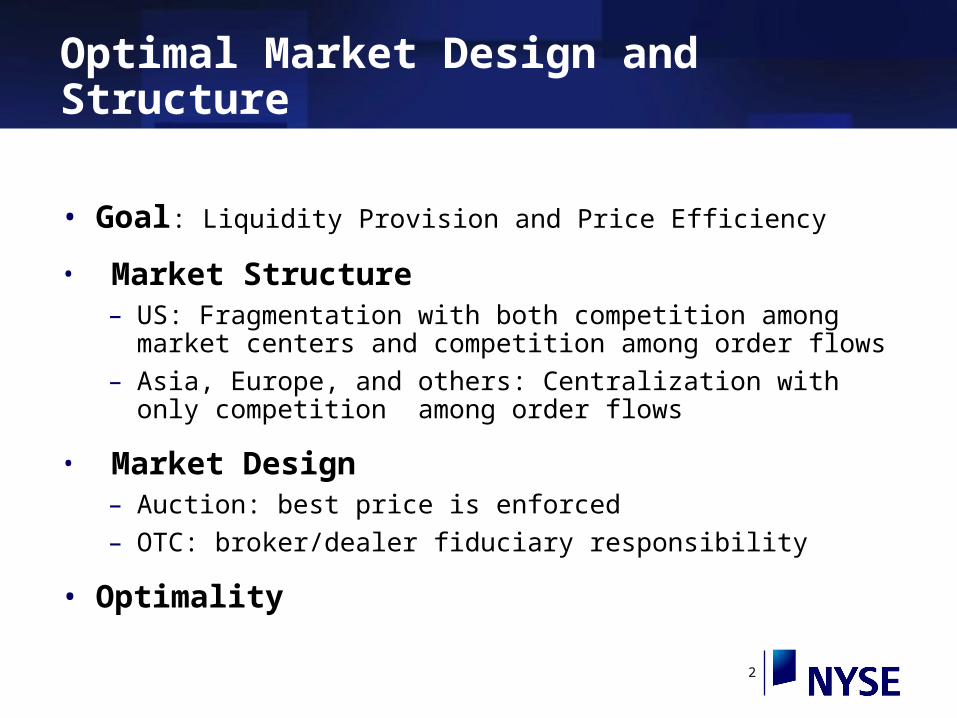
Optimal Market Design and Structure
• Goal: Liquidity Provision and Price Efficiency
• Market Structure– US: Fragmentation with both competition among market centers
and competition among order flows
– Asia, Europe, and others: Centralization with only competition among order flows
• Market Design– Auction: best price is enforced
– OTC: broker/dealer fiduciary responsibility
• Optimality

3
NYSE vs NASDAQ Difference Fundamental difference between the NYSE and NASDAQ Today
• Pre – NASDAQ Reform
• Pre – Decimal
• Post – Decimal– Decimalization Has Driven the Transaction Cost Down
– New Technology of Order Routing Increases Competition
• NYSE vs NASDAQ Difference– Difference in spread is narrowing
– Fragmentation
4
NYSE-listed
NYSE
CHXCAES/ITS
Madoff
Knight
ArcaExPHLX
Instinet
Island
CSE
BSE
Schwab
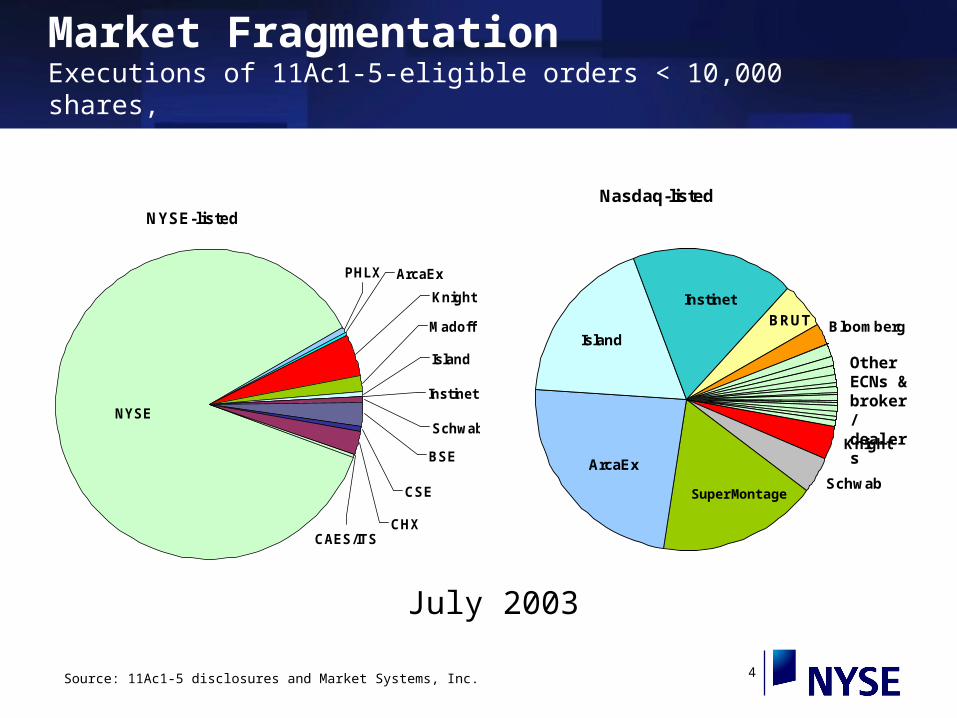
Market FragmentationExecutions of 11Ac1-5-eligible orders < 10,000 shares,
Source: 11Ac1-5 disclosures and Market Systems, Inc.
Nasdaq-listed
BloombergBRUT
Knight
SchwabArcaEx
Island
Instinet
Other ECNs & broker/ dealers
SuperMontage
July 2003
5
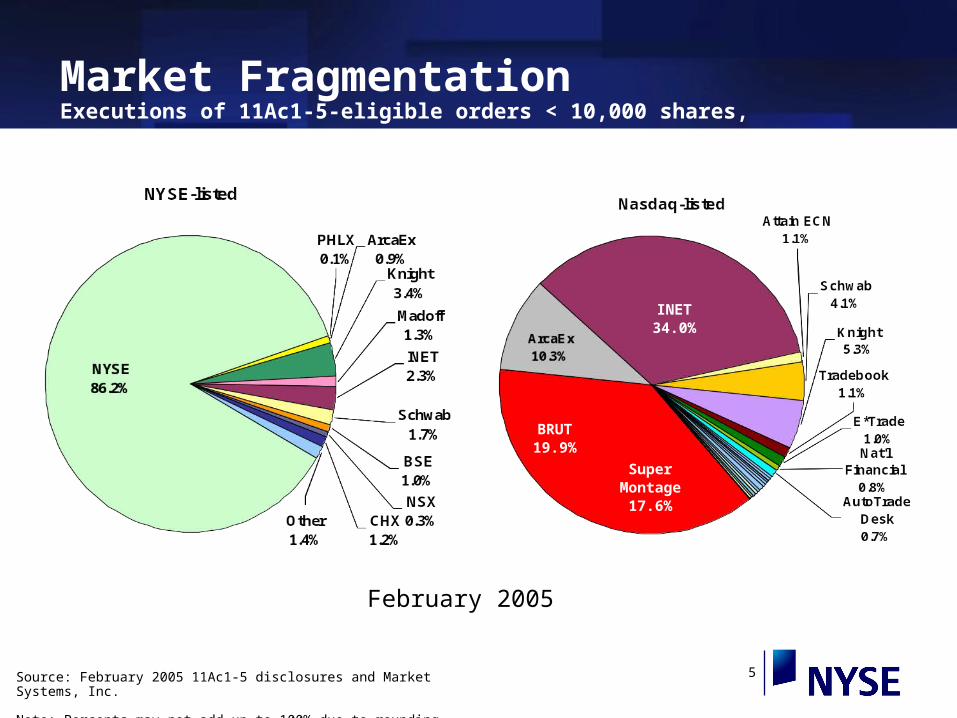
Market FragmentationExecutions of 11Ac1-5-eligible orders < 10,000 shares,
Source: February 2005 11Ac1-5 disclosures and Market Systems, Inc. Note: Percents may not add up to 100% due to rounding.
February 2005
SuperMontage
17.6%
BRUT19.9%
INET34.0%
6
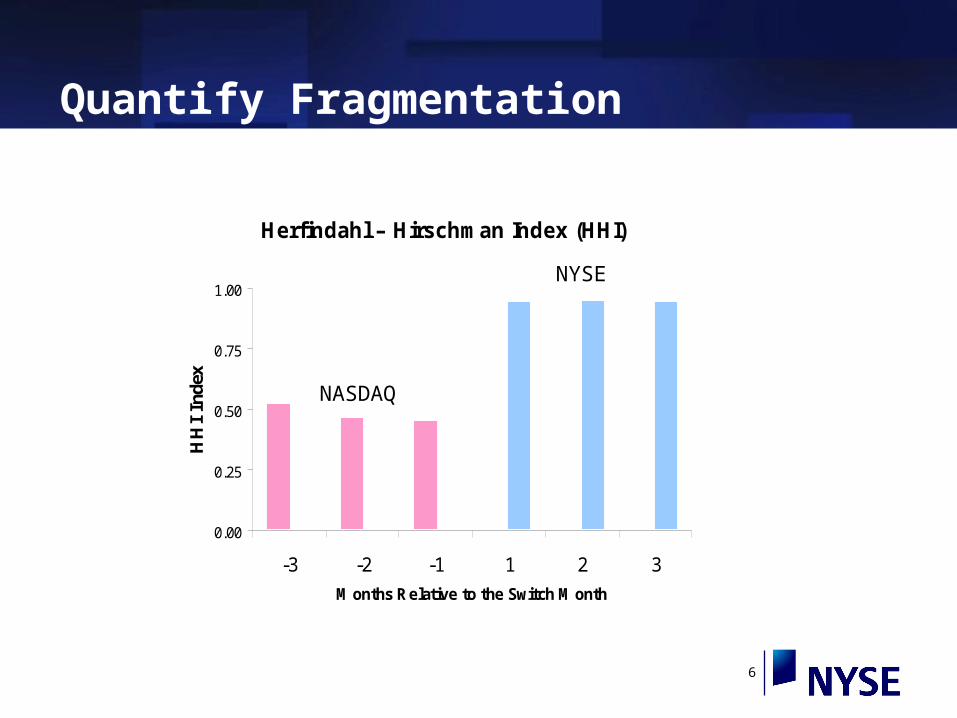
Quantify Fragmentation
Herfindahl – Hirschman Index (HHI)
0.00
0.25
0.50
0.75
1.00
-3 -2 -1 1 2 3
Months Re lative to the Switch Month
HH
I In
dex
NASDAQ
NYSE
7
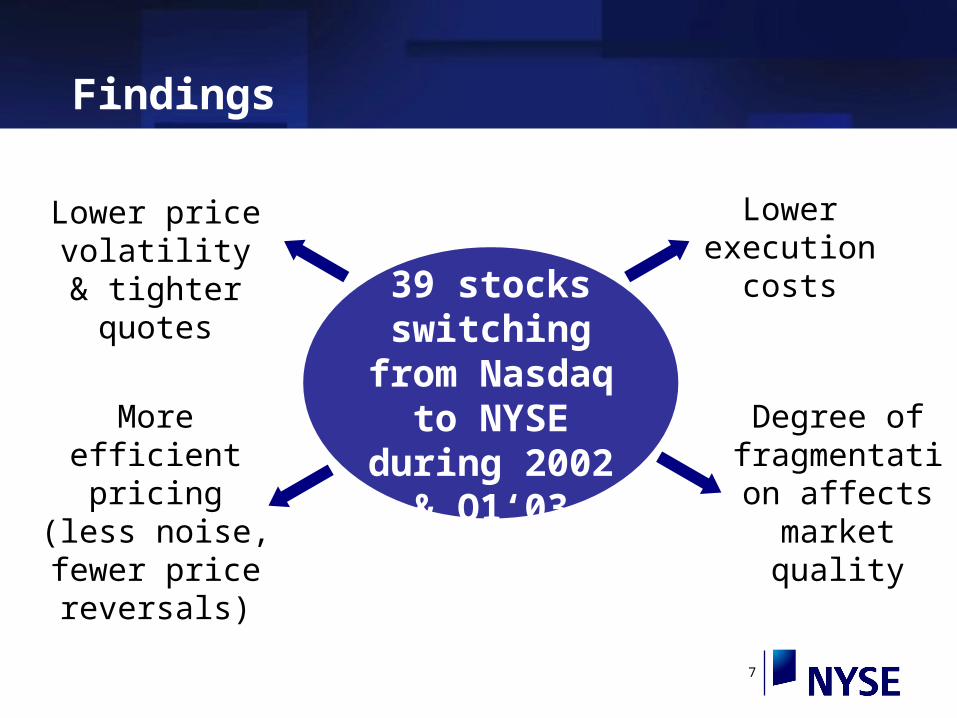
Findings
39 stocks switching from
Nasdaq to NYSE during 2002 & Q1‘03
Lower price volatility &
tighter quotes
More efficient pricing (less noise, fewer
price reversals)
Lower execution
costs
Degree offragmentation affects market
quality
8
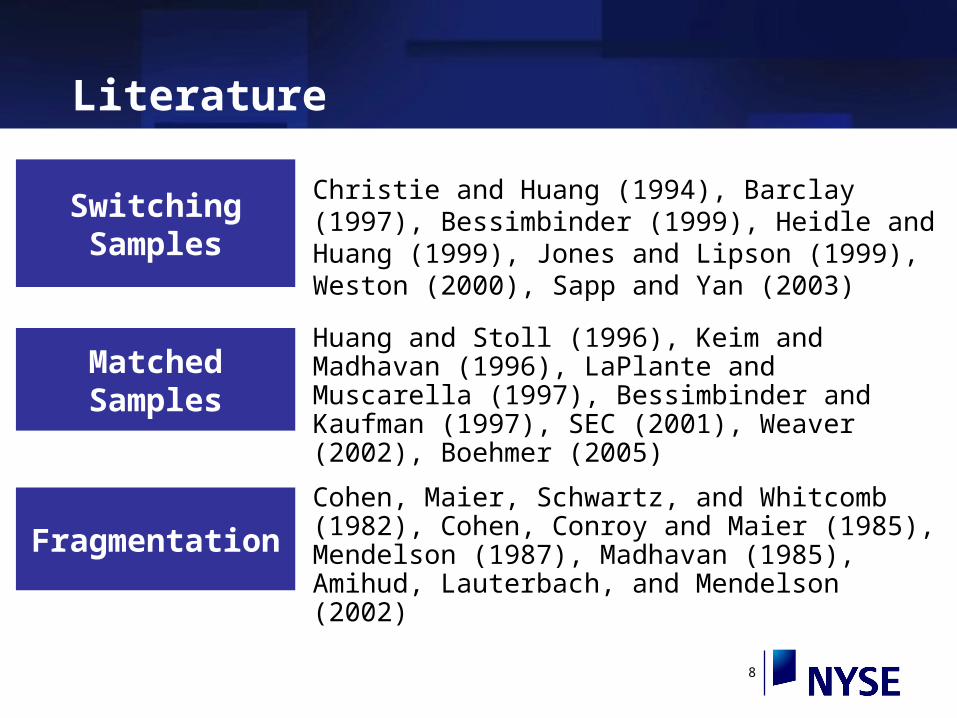
Literature
Switching Samples
Matched Samples
Christie and Huang (1994), Barclay (1997), Bessimbinder (1999), Heidle and Huang (1999), Jones and Lipson (1999), Weston (2000), Sapp and Yan (2003)
Huang and Stoll (1996), Keim and Madhavan (1996), LaPlante and Muscarella (1997), Bessimbinder and Kaufman (1997), SEC (2001), Weaver (2002), Boehmer (2005)
Fragmentation
Cohen, Maier, Schwartz, and Whitcomb (1982), Cohen, Conroy and Maier (1985), Mendelson (1987), Madhavan (1985), Amihud, Lauterbach, and Mendelson (2002)

9
Sample and Data
Sample• 39 companies switching from
Nasdaq to the NYSE from Jan ‘02 through Mar ‘03
Data• Trades and Quotes• SEC 11Ac1-5 Reports
Window• 60 trading days before and after for
trades and quotes.• 3 months before and after for the
Dash-5 data
10
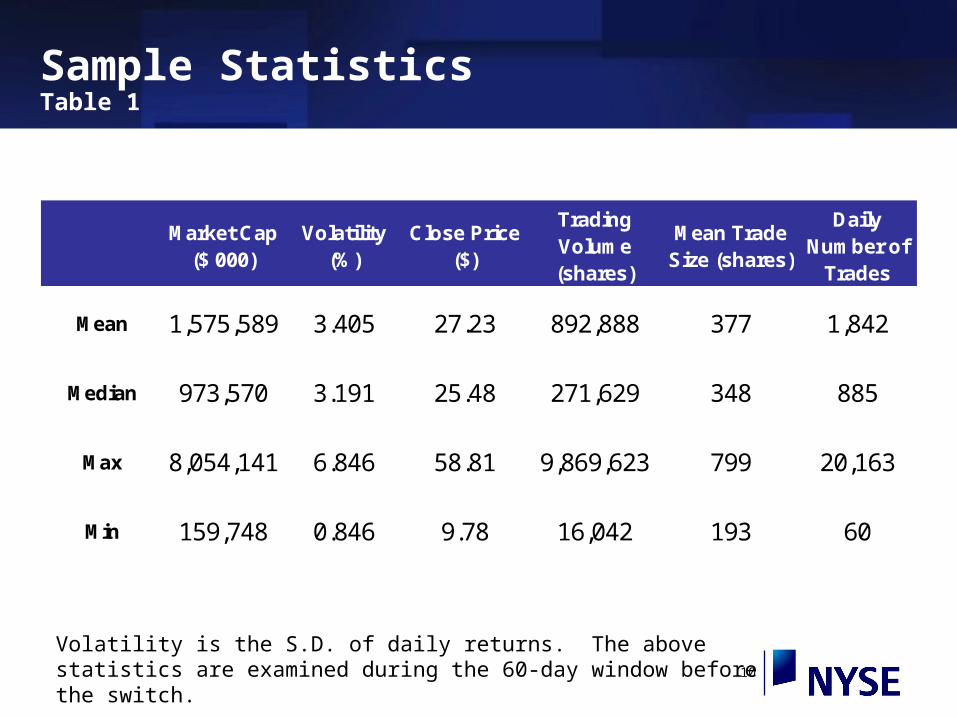
Sample StatisticsTable 1
Market Cap ($ 000)
Volatility (%)
Close Price ($)
Trading Volume (shares)
Mean Trade Size (shares)
Daily Number of
Trades
Mean 1,575,589 3.405 27.23 892,888 377 1,842
Median 973,570 3.191 25.48 271,629 348 885
Max 8,054,141 6.846 58.81 9,869,623 799 20,163
Min 159,748 0.846 9.78 16,042 193 60
Volatility is the S.D. of daily returns. The above statistics are examined during the 60-day window before the switch.

11
Voluntary Order Flow MigrationFigure 1
0
20
40
60
80
100
-60 -50 -40 -30 -20 -10 0 10 20 30 40 50
Trading Days Relative to the Switch
NASDAQ SuperMontage + ECNs + Dealers
NYSE
Regionals + ECNs

12
Market Quality
• Volatility
• Price Efficiency
• Quoted Spread: pre-trade
• Effective Spread: post-trade
• Realized Spread: competition of supplying liquidity
• Execution Speed
13
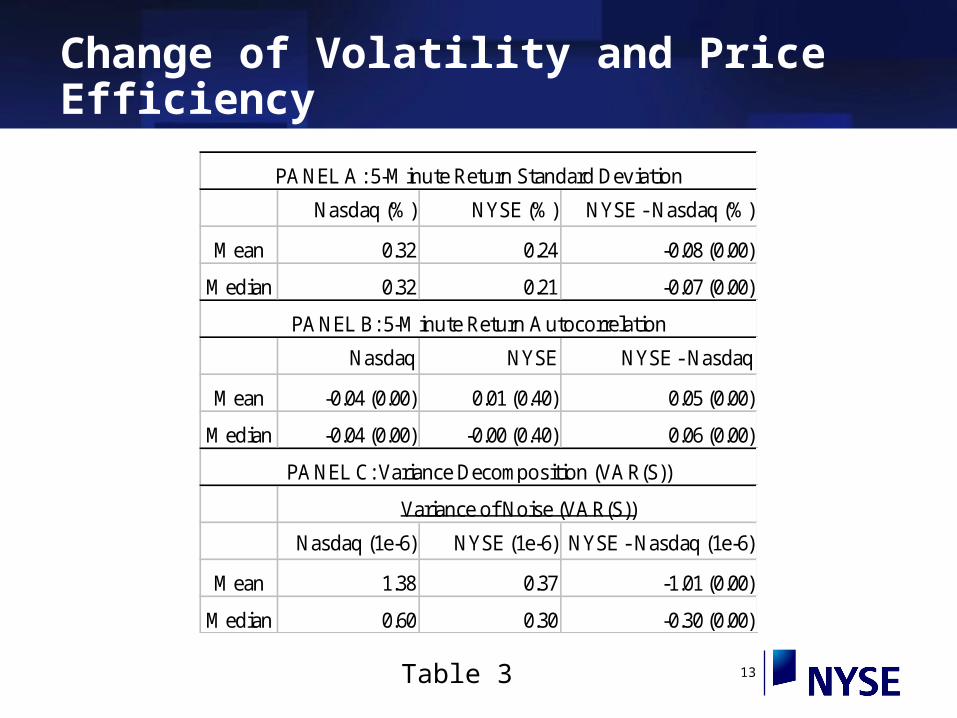
Change of Volatility and Price Efficiency
Nasdaq (%) NYSE (%) NYSE - Nasdaq (%)
Mean 0.32 0.24 -0.08 (0.00)
Median 0.32 0.21 -0.07 (0.00)
Nasdaq NYSE NYSE - Nasdaq
Mean -0.04 (0.00) 0.01 (0.40) 0.05 (0.00)
Median -0.04 (0.00) -0.00 (0.40) 0.06 (0.00)
Nasdaq (1e-6) NYSE (1e-6) NYSE - Nasdaq (1e-6)
Mean 1.38 0.37 -1.01 (0.00)
Median 0.60 0.30 -0.30 (0.00)
PANEL A: 5-Minute Return Standard Deviation
PANEL B: 5-Minute Return Autocorrelation
PANEL C: Variance Decomposition (VAR(S))
Variance of Noise (VAR(S))
Table 3

14
Variance DecompositionHasbrouck (1993)
S is measured at a trade-by-trade basis. P is computed as natural log.
Pt = mt + st , where mt is the efficient price
Magnitude of Pricing Error
Nasdaq NYSE Nasdaq - NYSE
VAR(S) 1.384 *10-6 0.374*10-6 1.010 *10-6
(0.000)
STD (S) 0.1176 cents 0.0611 cents 0.057(0.000)

15
Change of VolatilityFigure 1
Daily 5-Minute Interval Price Range(High - Low)
0
2
4
6
8
10
12
-60
-52
-44
-36
-28
-20
-12 -4 4 12 20 28 36 44 52
Event Window
Pri
ce R
ang
e ($
0.01
)
Nasdaq = 8.3 c
NYSE = 4.0 c

16
Intraday VolatilityFigure 2
Intraday 5-Minute Interval Price Range (High- Low)
0
5
10
15
20
25
30
1 9 17 25 33 41 49 57 65 73
Intraday Interval
Pri
ce R
ang
e ($
0.01
)
Nasdaq
NYSE
17
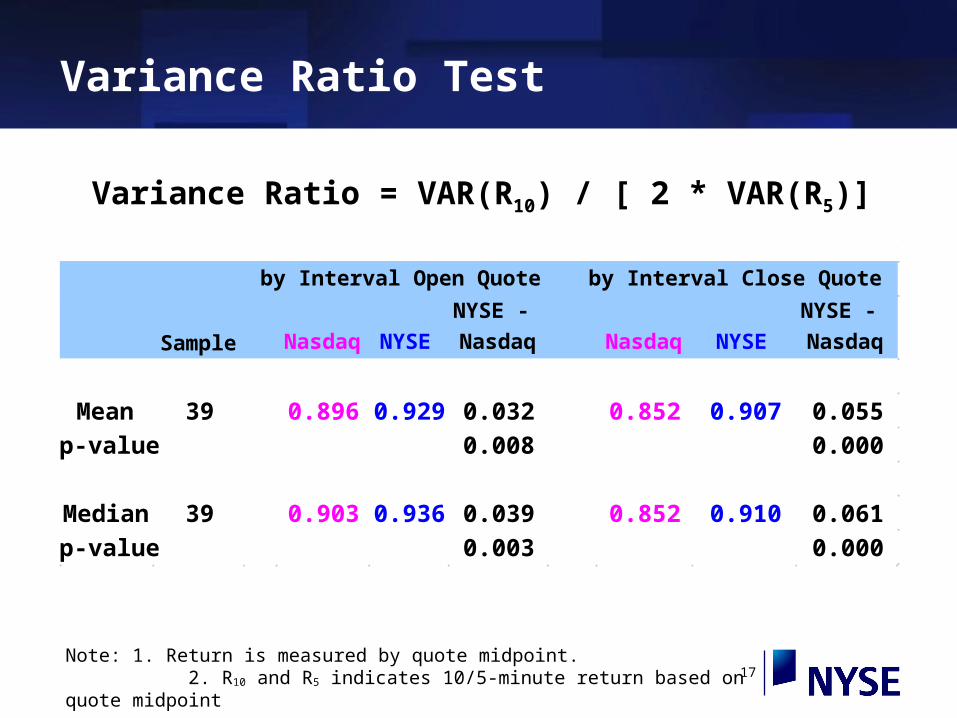
Variance Ratio Test
Variance Ratio = VAR(R10) / [ 2 * VAR(R5)]
Note: 1. Return is measured by quote midpoint. 2. R10 and R5 indicates 10/5-minute return based on quote midpoint
Sample Nasdaq NYSE
NYSE -
Nasdaq Nasdaq NYSE
NYSE -
Nasdaq
Mean 39 0.896 0.929 0.032 0.852 0.907 0.055
p-value 0.008 0.000
Median 39 0.903 0.936 0.039 0.852 0.910 0.061
p-value 0.003 0.000
by Interval Open Quote by Interval Close Quote
18
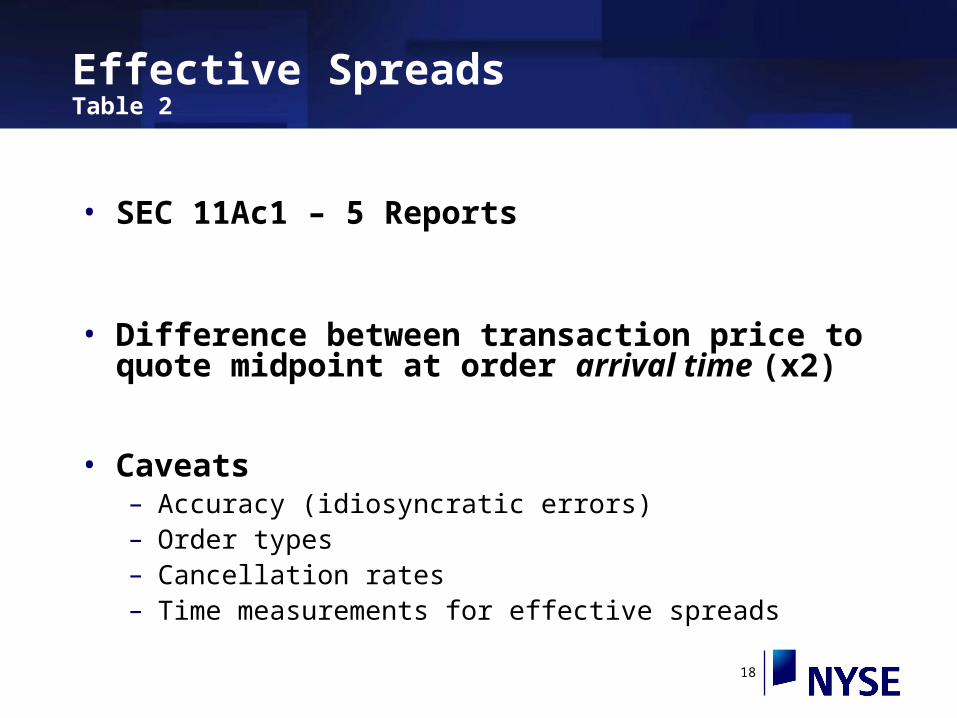
Effective SpreadsTable 2
• SEC 11Ac1 – 5 Reports
• Difference between transaction price to quote midpoint at order arrival time (x2)
• Caveats– Accuracy (idiosyncratic errors)– Order types– Cancellation rates– Time measurements for effective spreads

19
Change of Spreads
NASDAQ NYSE NYSE-Nasdaq NASDAQ NYSE NYSE-Nasdaq
Mean 9.19 5.94 -3.25 (0.00) 37.13 27.33 -9.80 (0.01)
Median 7.63 5.84 -1.71 (0.00) 31.57 23.37 -4.90 (0.00)
NASDAQ NYSE NYSE-Nasdaq NASDAQ NYSE NYSE-Nasdaq
Mean 8.50 5.57 -2.93 (0.00) 34.03 25.30 -8.72 (0.00)
Median 6.51 5.02 -1.12 (0.00) 28.34 23.13 -3.10 (0.00)
NASDAQ NYSE NYSE-Nasdaq NASDAQ NYSE NYSE-Nasdaq
Mean 4.51 -0.42 -4.93 (0.01) 16.66 -0.51 -17.18 (0.00)
Median 1.75 -0.23 -2.01 (0.00) 6.21 -0.01 -6.50 (0.00)
Panel A: Quoted Spread
Quoted Spread ($0.01) Quoted Spread Relative to Price (bp)
Panel B: Effective Spread
Effective Spread (ES) ($0.01) Effective Spread Relative to Price (bp)
Panel C: Realized Spread
Realized Spread (RS) ($0.01) Realized Spread Relative to Price (bp)
Table 4

20
Daily NBBO Spread between Nasdaq and NYSE
0
0.02
0.04
0.06
0.08
0.1
0.12
0.14
-60 -50 -40 -30 -20 -10 0 10 20 30 40 50
Event Window
NB
BO
Sp
read
($0
.01) Nasdaq = 9.2 c
NYSE = 5.7 c
QuotesFigure 3

21
Intraday QuoteFigure 4
Intraday NNBO Quoted Spread
0
0.05
0.1
0.15
0.2
0.25
1 12 23 34 45 56 67 78
Intraday 5-Minute Interval
NB
BO
Sp
read
($0.
01)
Nasdaq
NYSE

22
Effective SpreadsFigure 5
0246
81012
Eff
ecti
ve S
pre
ad
($0.
01)
-3 -2 -1 1 2 3
Months Relative to Switch
Share-weighted Monthly Effective Spread
Nasdaq NYSE
23
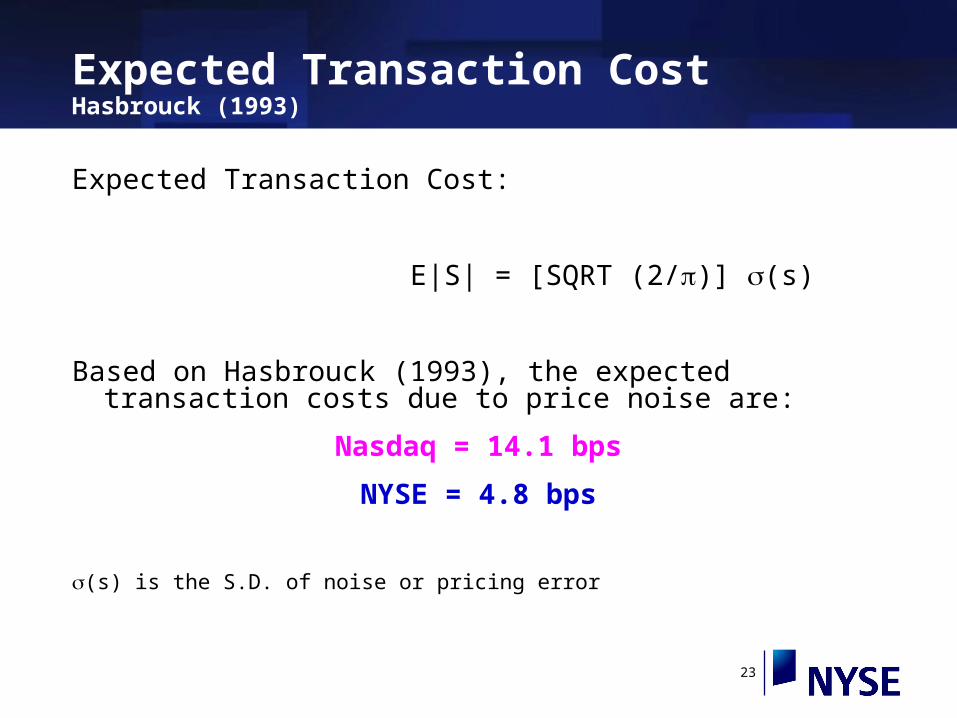
Expected Transaction CostHasbrouck (1993)
Expected Transaction Cost:
E|S| = [SQRT (2/)] (s)
Based on Hasbrouck (1993), the expected transaction costs due to price noise are:
Nasdaq = 14.1 bps
NYSE = 4.8 bps
(s) is the S.D. of noise or pricing error

24
Selection Bias
• Simple Comparison– 39 transferring stock
– 660 Nasdaq NYSE-eligible stocks
• Matching Sample – Select 39 Nasdaq “sister” stocks
– Mcap, volume, volatility, price
• Heckman (1997) 2-Stage Probit Model– 660 firms in the first stage probit regression
25
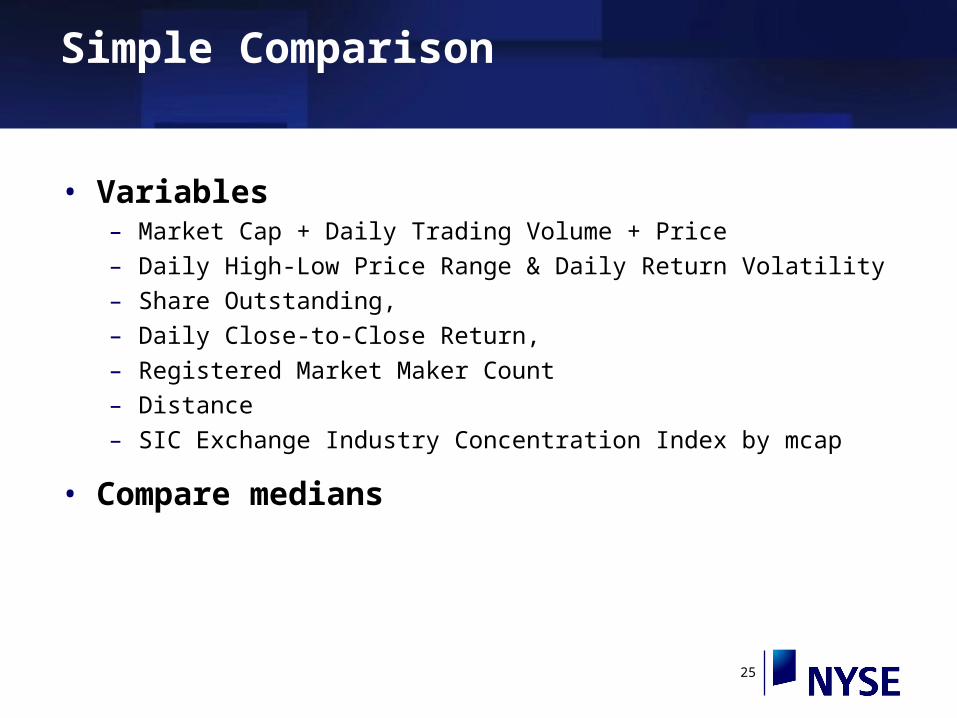
Simple Comparison
• Variables– Market Cap + Daily Trading Volume + Price
– Daily High-Low Price Range & Daily Return Volatility
– Share Outstanding,
– Daily Close-to-Close Return,
– Registered Market Maker Count
– Distance
– SIC Exchange Industry Concentration Index by mcap
• Compare medians

26
Matching Sample
• 39 non-switching Nasdaq sisters – Match: MCAP, Trading Volume, Return Volatility,
Price
– 2001 matching period
• Replicate analysis on sisters
• Sisters: No significant changes between the 60-day pre-switch and post-switch periods.
27
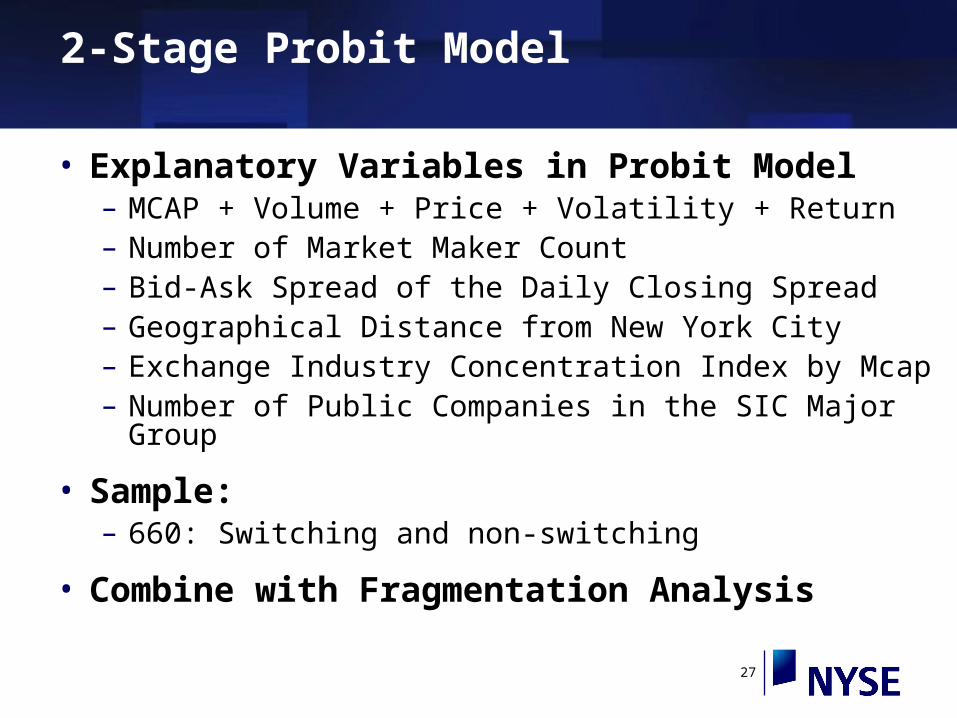
2-Stage Probit Model
• Explanatory Variables in Probit Model– MCAP + Volume + Price + Volatility + Return– Number of Market Maker Count– Bid-Ask Spread of the Daily Closing Spread– Geographical Distance from New York City– Exchange Industry Concentration Index by Mcap– Number of Public Companies in the SIC Major Group
• Sample: – 660: Switching and non-switching
• Combine with Fragmentation Analysis
28
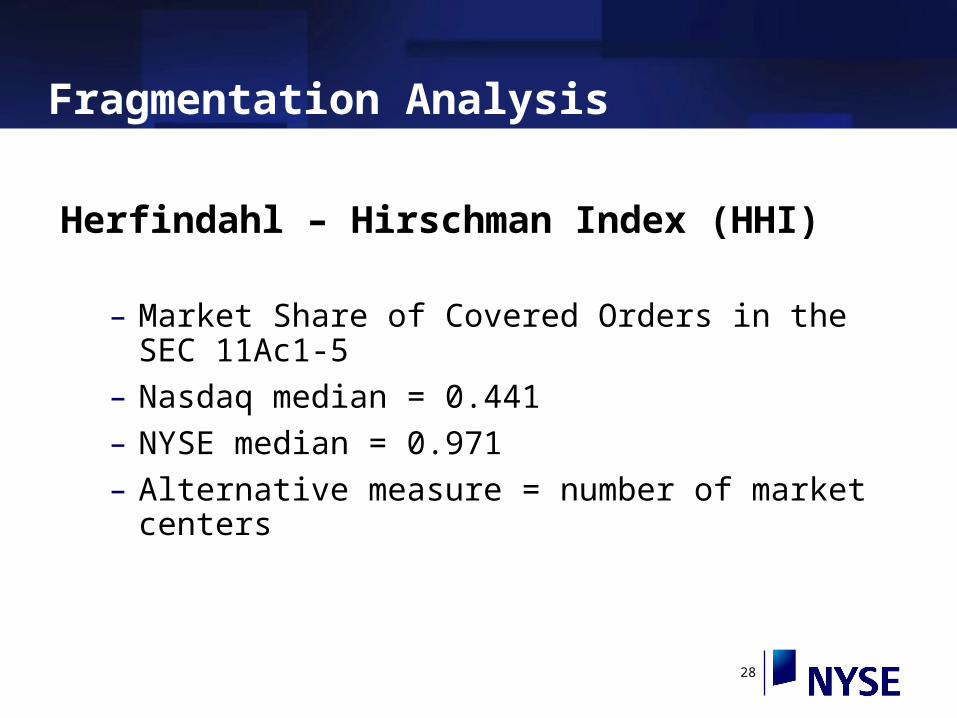
Fragmentation Analysis
Herfindahl – Hirschman Index (HHI)
– Market Share of Covered Orders in the SEC 11Ac1-5
– Nasdaq median = 0.441
– NYSE median = 0.971
– Alternative measure = number of market centers
29
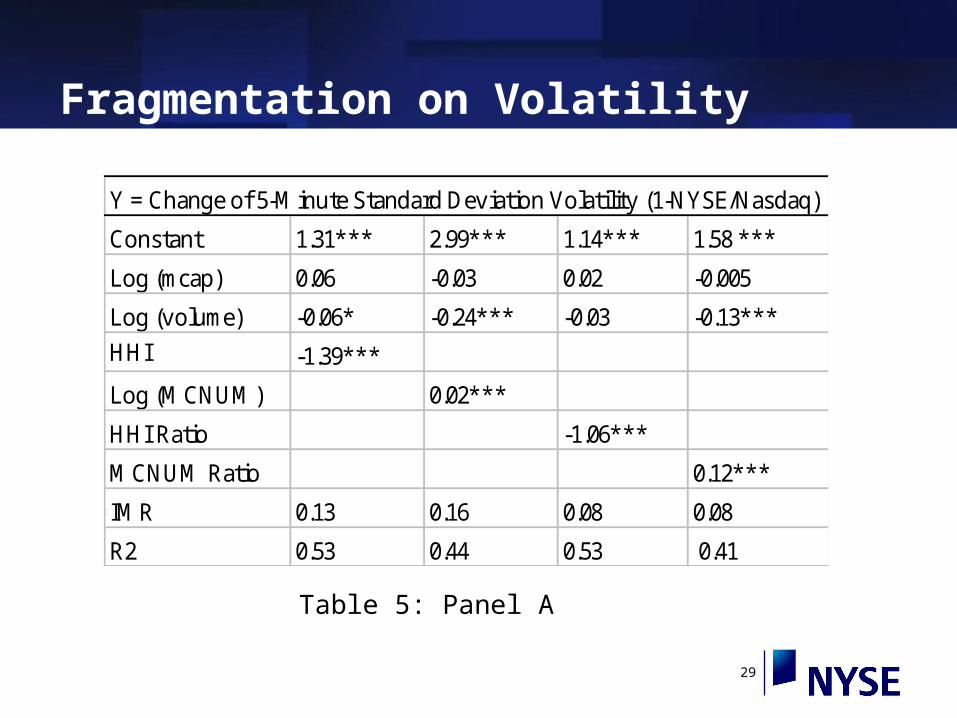
Fragmentation on Volatility
Y = Change of 5-Minute Standard Deviation Volatility (1-NYSE/Nasdaq)
Constant 1.31*** 2.99*** 1.14*** 1.58 ***
Log (mcap) 0.06 -0.03 0.02 -0.005
Log (volume) -0.06* -0.24*** -0.03 -0.13***
HHI -1.39***
Log (MCNUM) 0.02***
HHI Ratio -1.06***
MCNUM Ratio 0.12***
IMR 0.13 0.16 0.08 0.08
R2 0.53 0.44 0.53 0.41
Table 5: Panel A
30
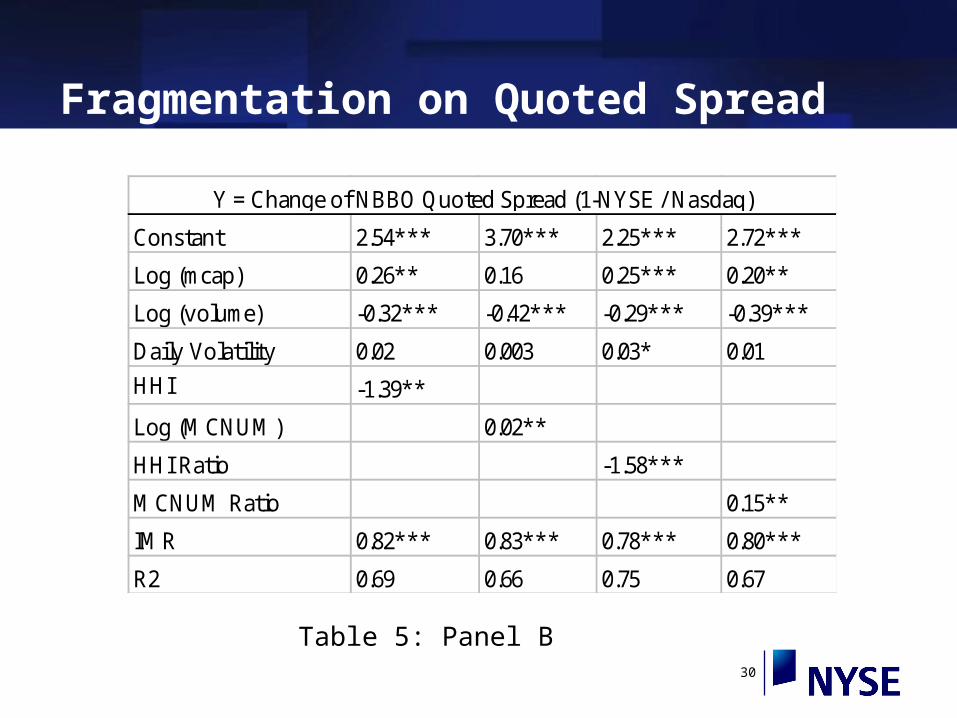
Fragmentation on Quoted Spread
Constant 2.54*** 3.70*** 2.25*** 2.72***
Log (mcap) 0.26** 0.16 0.25*** 0.20**
Log (volume) -0.32*** -0.42*** -0.29*** -0.39***
Daily Volatility 0.02 0.003 0.03* 0.01
HHI -1.39**
Log (MCNUM) 0.02**
HHI Ratio -1.58***
MCNUM Ratio 0.15**
IMR 0.82*** 0.83*** 0.78*** 0.80***
R2 0.69 0.66 0.75 0.67
Y = Change of NBBO Quoted Spread (1-NYSE / Nasdaq)
Table 5: Panel B

31
Fragmentation on Effective Spread
Constant 1.59*** 2.82*** 1.38*** 1.64***
Log (mcap) 0.04 0.002 0.05 0.04
Log (volume) -0.12*** -0.26*** -0.10*** -0.19***
Daily Volatility 0.02 0.01 0.02 0.01
HHI -0.72*
Log (MCNUM) 0.02**
HHI Ratio -0.97**
MCNUM Ratio 0.16**
IMR 0.13 0.21 0.11 0.15
R2 0.41 0.43 0.45 0.42
Y = Change of Effective Spread (1-NYSE / Nasdaq)
Table 5: Panel C

32
Conclusions
• NYSE provides better liquidity provision and price efficiency.
• Order Flow Fragmentation Affects Market Quality
• Competition among market centers does not dominate the benefits of order flow consolidation
• Market fragmentation is particular detrimental for less liquid securities.

33

34
Market Capitalization
0
2,000
4,000
6,000
8,000
10,000
1 6 11 16 21 26 31 36
Company in Order of Their Transfer Date
MC
AP
($M
illi
on
)
Market Capitalization
Regions Financial Co.5/3/02$8 Billion
Concord EFS Co.11/7/02$7.3 Billion
II

35
Daily and 5-Minute Volatility
Daily Volatility (S.T. of Daily Close-to-Close Return)
0.000
1.000
2.000
3.000
4.000
5.000
6.000
7.000
8.000
0.000 1.000 2.000 3.000 4.000 5.000 6.000 7.000 8.000
Nasdaq (%)
NY
SE
(%)
5-Minute Volatility(S.T. of 5-Minute Return)
0.000
0.200
0.400
0.600
0.800
1.000
0.000 0.200 0.400 0.600 0.800 1.000
Nasdaq (%)
NY
SE
(%
)
36
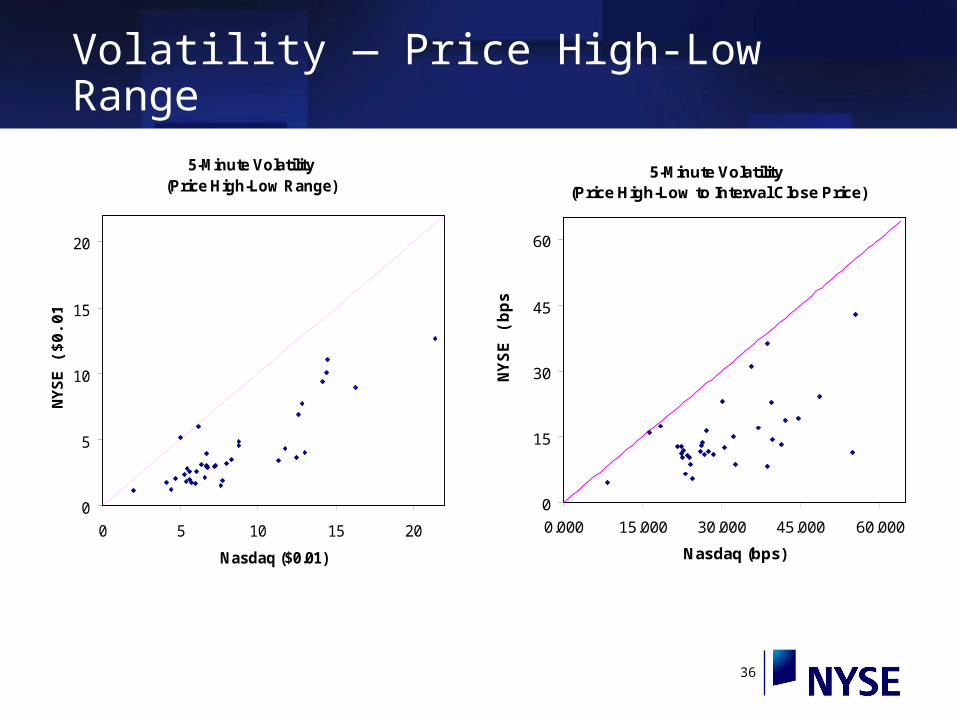
Volatility — Price High-Low Range
5-Minute Volatility (Price High-Low to Interval Close Price)
0
15
30
45
60
0.000 15.000 30.000 45.000 60.000
Nasdaq (bps)
NY
SE
(b
ps
)
5-Minute Volatility(Price High-Low Range)
0
5
10
15
20
0 5 10 15 20
Nasdaq ($0.01)
NY
SE
($0.
01)
37
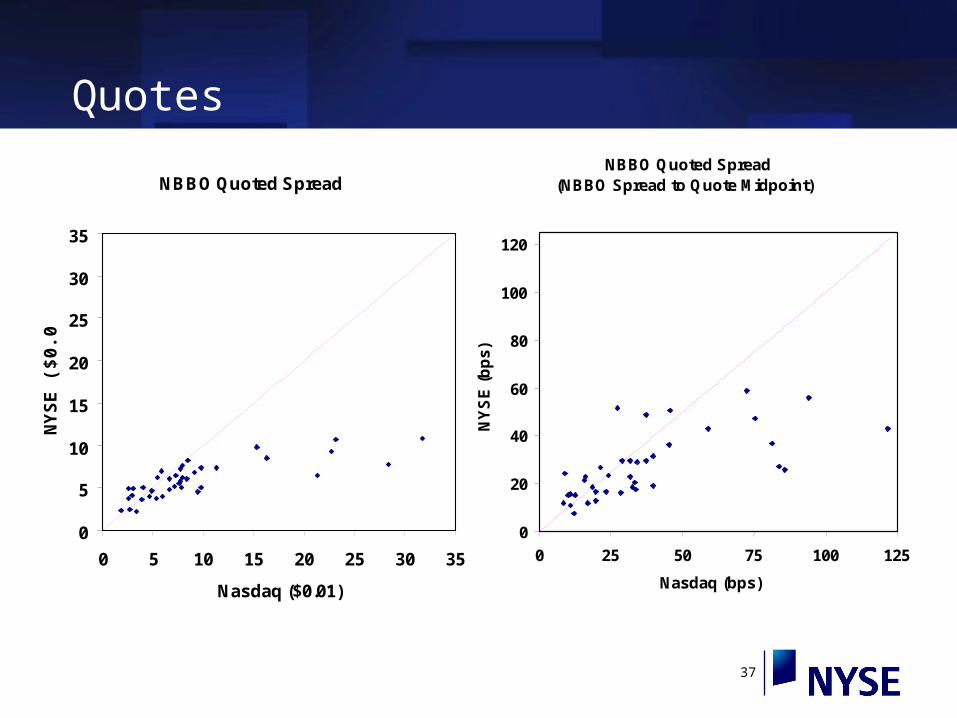
Quotes
NBBO Quoted Spread
0
5
10
15
20
25
30
35
0 5 10 15 20 25 30 35
Nasdaq ($0.01)
NY
SE
($
0.0
1)
NBBO Quoted Spread (NBBO Spread to Quote Midpoint)
0
20
40
60
80
100
120
0 25 50 75 100 125
Nasdaq (bps)
NY
SE
(b
ps)