market report: the philippine non-life insurance industry by ann margaret e. jasmin 1 market report...
TRANSCRIPT
1Market Report: The Philippine Non-Life Insurance Industry by Ann Margaret E. Jasmin
marketreport
thephilippines

2Market Report: The Philippine Non-Life Insurance Industry by Ann Margaret E. Jasmin
ourourcountrycountry

3Market Report: The Philippine Non-Life Insurance Industry by Ann Margaret E. Jasmin
thephilippinesThe Philippines is the third largest
English speaking country in the world. In Asia, it is the oldest
democracy and one of only two predominantly Roman Catholic
nations, the other being East Timor. It has a rich history combining
Asian, European, and American influences.
Composed of 7,107 islands, the Philippines is a tropical country with
fascinating landscapes, active volcanoes, splendid beaches, coral
waters, and tropical rainforests.
4Market Report: The Philippine Non-Life Insurance Industry by Ann Margaret E. Jasmin
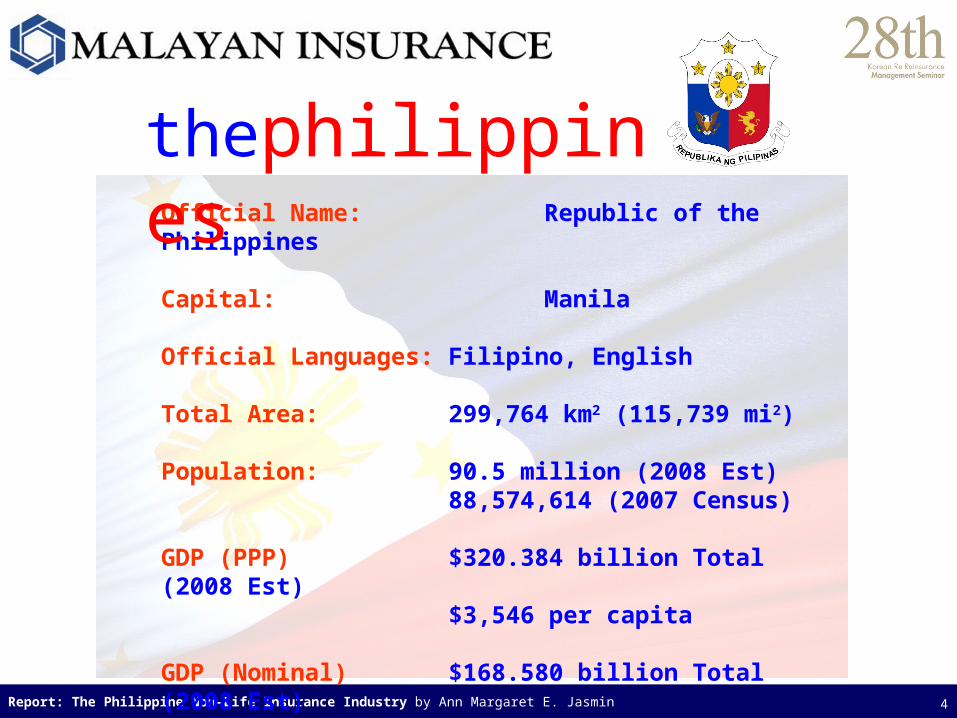
Official Name: Republic of the Philippines
Capital: Manila
Official Languages: Filipino, English
Total Area: 299,764 km2 (115,739 mi2)
Population: 90.5 million (2008 Est)88,574,614 (2007 Census)
GDP (PPP) $320.384 billion Total (2008 Est)$3,546 per capita
GDP (Nominal) $168.580 billion Total (2008 Est)$1,866 per capita
thephilippines
5Market Report: The Philippine Non-Life Insurance Industry by Ann Margaret E. Jasmin
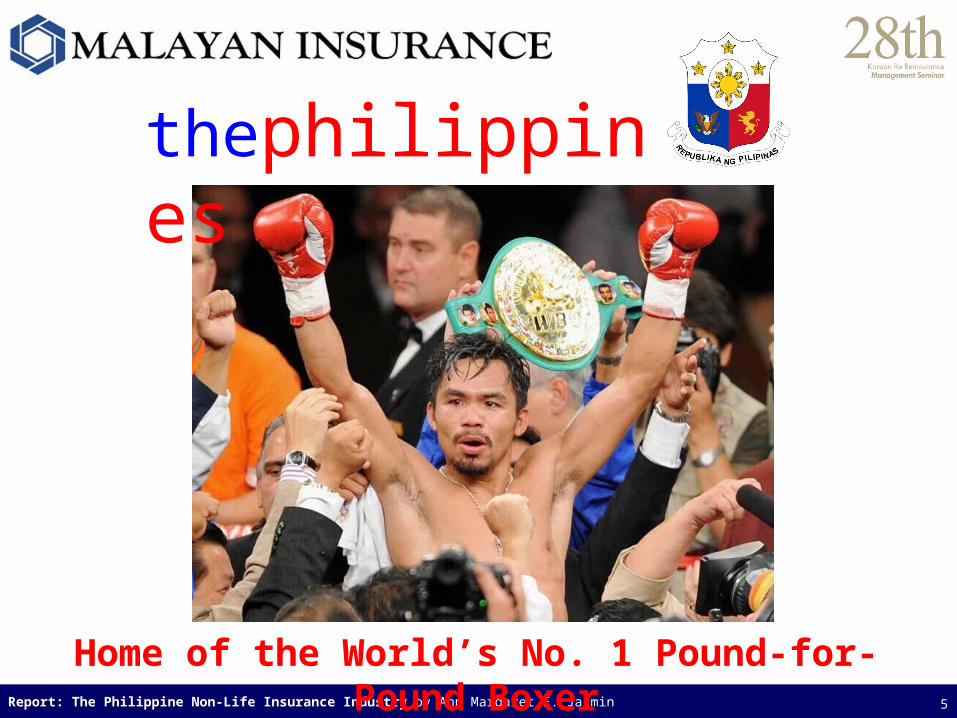
thephilippines
Home of the World’s No. 1 Pound-for-Pound Boxer

6Market Report: The Philippine Non-Life Insurance Industry by Ann Margaret E. Jasmin
ourourcompanycompanyAviation • Fire • Marine • Misc. Casualty • Motorcar • Personal Accident • SuretyAviation • Fire • Marine • Misc. Casualty • Motorcar • Personal Accident • Surety
Insure To Be Sure.
7Market Report: The Philippine Non-Life Insurance Industry by Ann Margaret E. Jasmin
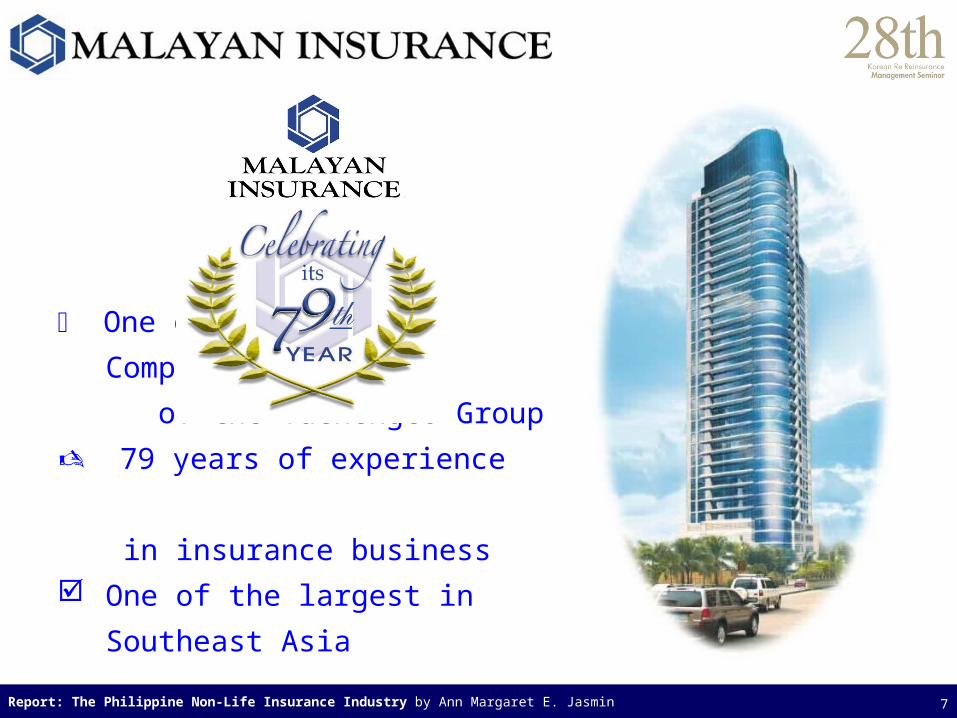
One of the Flagship Companies
of the Yuchengco Group
79 years of experience
in insurance business
One of the largest in Southeast Asia

8Market Report: The Philippine Non-Life Insurance Industry by Ann Margaret E. Jasmin
financialstrength
PhP 6.192B Gross Premiums (USD 129.0M)
PhP 2.913B Premiums Earned (USD 60.7M)
PhP 4.636B Net Worth (USD 96.6M)
(PhP 48 : USD 1)

9Market Report: The Philippine Non-Life Insurance Industry by Ann Margaret E. Jasmin
Year Malayan PGA BPI/MS Standard Pioneer PhilAm UCPB FedPhoe Mapfre PhilChar2008 129.002007 111.67 61.46 48.54 44.38 40.21 32.71 30.21 28.13 27.71 19.272006 104.58 60.83 44.38 40.63 37.71 30.83 32.29 27.29 24.58 23.13
Gross Premium Written of Top 10 Non-Life Insurance Companies (Y2007)
(in USD millions)
0.00
20.00
40.00
60.00
80.00
100.00
120.00
140.00
Malayan PGA BPI/MS Standard Pioneer PhilAm UCPB FedPhoe Mapfre PhilChar
2008
2007
2006
2008 Industry Figures not yet available
industryleadership

10Market Report: The Philippine Non-Life Insurance Industry by Ann Margaret E. Jasmin
Insurance Commission
#1 non-life insurance company for 38 years now
B++ (Very Good) Rating by A.M. Best
(Re-affirmed in December 10, 2008)
BB (Stable) Rating by Standard & Poor’s DRI
(Re-affirmed in April 21, 2009)
Awarded an ISO 9001:2000 certification
by the Certification International U.K.,
Ltd. in December 2008
industryleadership

11Market Report: The Philippine Non-Life Insurance Industry by Ann Margaret E. Jasmin
The Department of Finance’s Insurance Commission has consistently ranked Malayan Insurance as the number one non-life insurance company (in terms of gross premiums written) for 38 years, with close to 20% market share in the industry, from a field of 87 non-life insurance companies.
Republic of the PhilippinesDepartment of Finance
INSURANCE COMMISSION1071 United Nations Avenue
Manila
No. 1 since 1970
industryleadership

12Market Report: The Philippine Non-Life Insurance Industry by Ann Margaret E. Jasmin
• A.M. Best has recently affirmed Malayan Insurance’s B++(Very Good) Rating
• A.M. Best Co. is the world’s oldest and most authoritative insurance rating and information source.
• Malayan Insurance has a BB (Stable) Rating from Standard & Poor’s (S&P), reflecting its strong market position, especially in fire insurance, as the largest general insurer in the Philippines and sound capitalization relative to risks underwritten.
Top 200 Global Insurers
trackrecord

13Market Report: The Philippine Non-Life Insurance Industry by Ann Margaret E. Jasmin
Certification International U.K., Ltd. has recently awarded Malayan Insurance Co. Inc. an ISO 9001:2000 Certification.
ISO 9001:2000 is an internationally-known model for a well- planned quality management system, a foundation for organizations seeking
disciplined and controlled processes to help achieve customer satisfaction and continual improvement.
trackrecord

14Market Report: The Philippine Non-Life Insurance Industry by Ann Margaret E. Jasmin
ourourindustryindustry
non-non-lifelife
15
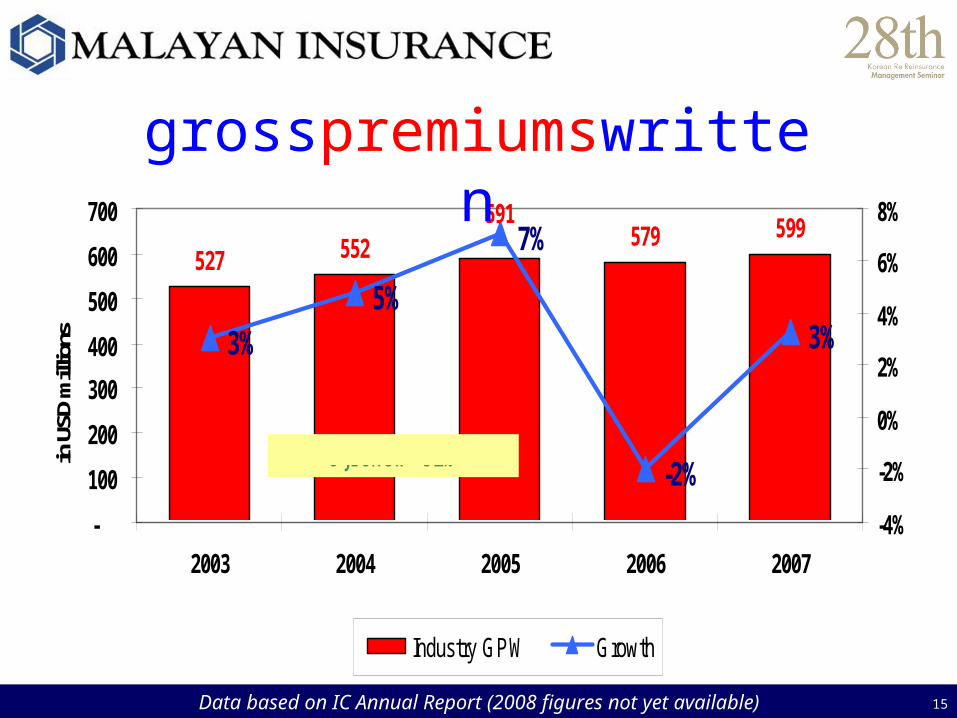
527 552 579 599591
3%5%
7%
-2%
3%
-
100
200
300
400
500
600
700
2003 2004 2005 2006 2007
in U
SD m
illio
ns
-4%
-2%
0%
2%
4%
6%
8%
Industry GPW Growth
5-yr CAGR = 3.2%
Data based on IC Annual Report (2008 figures not yet available)
grosspremiumswritten

16
growth of industry gpw by line2003 2004 2005 2006 2007 CAGR
Fire -1% 3% -2% 0% 2% 0.5%Marine -4% 15% 24% -29% -1% -0.7%Motor Car 6% 4% 7% 4% 4% 4.9%PA,Cslty,Engg 13% 3% 13% 3% 5% 7.8%Surety -1% 10% 1% 26% 9% 8.6%
Data based on IC Annual Report (2008 figures not yet available)

17
3%
47%
-15%
31%
-14%
19%
-2%3%
45%
30%
7%5%3%
11%
-20%
-10%
0%
10%
20%
30%
40%
50%
60%
2001 2002 2003 2004 2005 2006 2007
Growth Sum Insured
Growth GPW
in USD millions 2001 2002 2003 2004 2005 2006 2007Sum Insured 150,918 219,341 323,443 273,888 355,638 465,407 401,172 GPW 431 511 527 552 591 579 599
GPW/SI 0.29% 0.23% 0.16% 0.20% 0.17% 0.12% 0.15%
industry sum insured vs gpw
Data based on IC Annual Report (2008 figures not yet available)
18
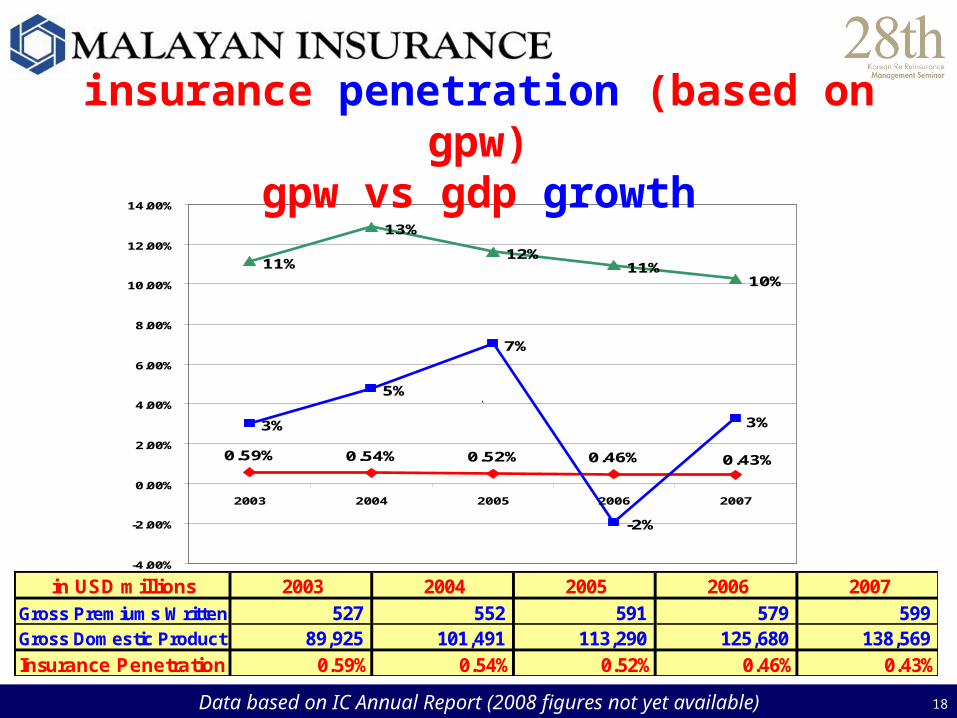
0.59% 0.54% 0.52% 0.46%
3%
5%
7%
-2%
11%
13%
12%11%
10%
0.43%
3%
-4.00%
-2.00%
0.00%
2.00%
4.00%
6.00%
8.00%
10.00%
12.00%
14.00%
2003 2004 2005 2006 2007
GDP Growth
GPW Growth
Penetration Ratio
\
in USD millions 2003 2004 2005 2006 2007Gross Premiums Written 527 552 591 579 599 Gross Domestic Product 89,925 101,491 113,290 125,680 138,569 Insurance Penetration 0.59% 0.54% 0.52% 0.46% 0.43%
insurance penetration (based on gpw)gpw vs gdp growth
Data based on IC Annual Report (2008 figures not yet available)

19
In %
13% 13% 16% 12% 11%
31% 30% 30%32% 33%
18% 18% 18% 19% 20%
32%35%36% 34%33%
4%4%3%3%3%
2003 2004 2005 2006 2007
Surety
Cslty,Engg, PA
MotorCar
Marine
Fire
in USD millions
190 195 191 192 197
66 74 94 67 67
161167
179186 194
9496
109112 11816
17
18 22 24
2003 2004 2005 2006 2007
industryportfoliomix
Data based on IC Annual Report (2008 figures not yet available)

20
527552
591 579 599
285313 332
359384
54%
62%
64%
56%57%
-
100
200
300
400
500
600
2003 2004 2005 2006 2007
48%
50%
52%
54%
56%
58%
60%
62%
64%
66%
GPW NPR Retention Ratio
industryretentionratio
Data based on IC Annual Report (2008 figures not yet available)
in U
SD
mil
lio
ns
21
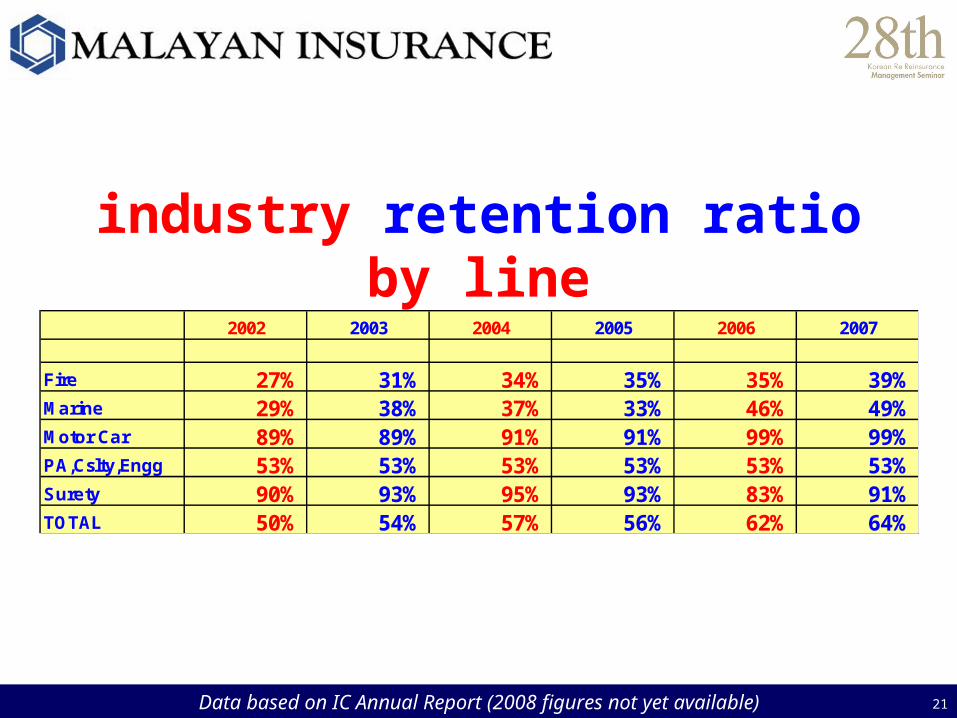
2002 2003 2004 2005 2006 2007
Fire 27% 31% 34% 35% 35% 39%Marine 29% 38% 37% 33% 46% 49%Motor Car 89% 89% 91% 91% 99% 99%PA,Cslty,Engg 53% 53% 53% 53% 53% 53%Surety 90% 93% 95% 93% 83% 91%TOTAL 50% 54% 57% 56% 62% 64%
industry retention ratio by line
Data based on IC Annual Report (2008 figures not yet available)

22
273
301323
347
375
118136 137
157 16643%
45%
42%
45%
44%
-
50
100
150
200
250
300
350
400
2003 2004 2005 2006 2007
41%
41%
42%
42%
43%
43%
44%
44%
45%
45%
46%
46%
NPE Losses Incurred Loss Ratio
industrylossratio
Data based on IC Annual Report (2008 figures not yet available)
in U
SD
mil
lio
ns

23
2002 2003 2004 2005 2006 2007
Fire 26% 35% 40% 30% 52% 40%Marine 33% 24% 22% 33% 33% 33%Motor Car 54% 54% 55% 52% 47% 53%PA,Cslty,Engg 38% 38% 42% 44% 47% 31%Surety 27% 14% 20% 15% 20% 42%TOTAL 43% 43% 45% 42% 45% 44%
industry loss ratio by line
Data based on IC Annual Report (2008 figures not yet available)

24
43.3% 45.2% 42.3% 45.3% 44.4%
17.2%15.5%
20.1% 19.9%
43.1% 40.2%41.0%
39.2% 42.0%
17.3%
0.0%
20.0%
40.0%
60.0%
80.0%
100.0%
120.0%
2003 2004 2005 2006 2007
Loss Ratio Acq Cost Ratio Exp Ratio
103.6%98.9%102.6% 104.6% 106.2%
*2007 Expense Ratio includes Investment Expenses
industrycombinedratio
Data based on IC Annual Report (2008 figures not yet available)

25Market Report: The Philippine Non-Life Insurance Industry by Ann Margaret E. Jasmin
2006 2007 REDUCTION
LIFE INSURANCE CO. 33 32 1
NON LIFE INSURANCE CO. 93 87 6
COMPOSITE CO. 3 3 0
REINSURANCE CO. 1 1 0
Data based on IC Annual Report (2008 figures not yet available)
number of insurance companies/reinsurance firms in the philippines
26Market Report: The Philippine Non-Life Insurance Industry by Ann Margaret E. Jasmin
currentcurrentissuesissues

27Market Report: The Philippine Non-Life Insurance Industry by Ann Margaret E. Jasmin
S&P early this month maintained its “stable” outlook for the Philippine insurance industry after it down-graded its outlook for most insurance markets in the Asia-Pacific region.
Paul Clarkson, S&P credit analyst focusing on the Philippine insurance industry, said the stable outlook on the country’s life and non-life insurers was retained given their efforts to hike their capital amid tough economic conditions.
RP Insurance Industry ‘Stable’
28
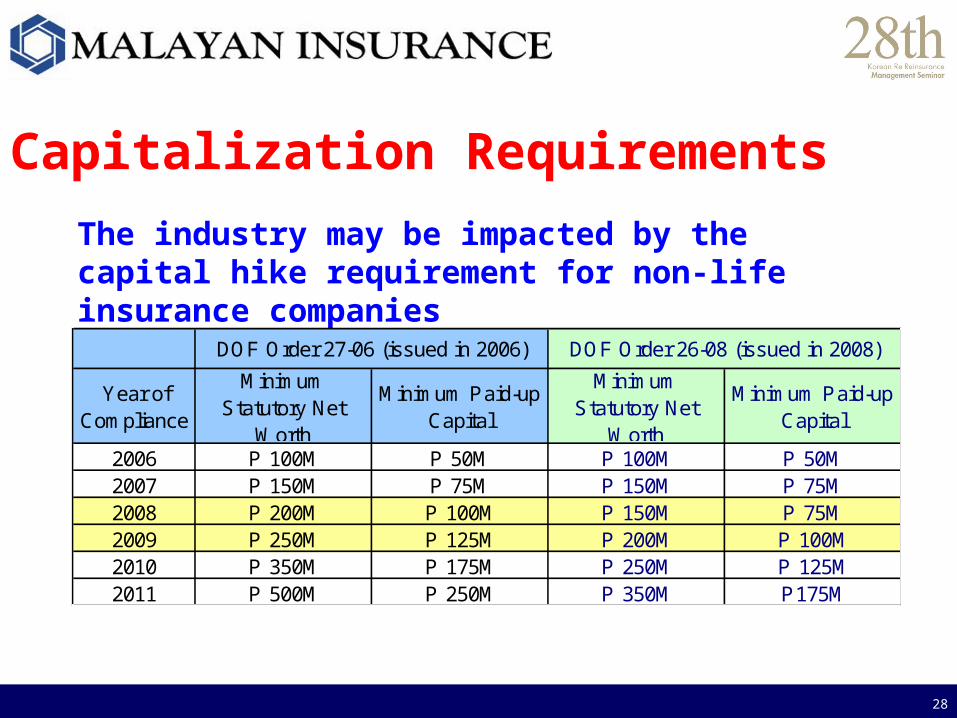
Capitalization Requirements
The industry may be impacted by the capital hike requirement for non-life insurance companies
Year of Compliance
Minimum Statutory Net
Worth
Minimum Paid-up Capital
Minimum Statutory Net
Worth
Minimum Paid-up Capital
2006 P 100M P 50M P 100M P 50M2007 P 150M P 75M P 150M P 75M2008 P 200M P 100M P 150M P 75M2009 P 250M P 125M P 200M P 100M2010 P 350M P 175M P 250M P 125M2011 P 500M P 250M P 350M P175M
DOF Order 27-06 (issued in 2006) DOF Order 26-08 (issued in 2008)

29
Failure to meet the RBC Ratio requirements under Insurance Memorandum Circular 7-2006 shall result in the corresponding Action/Control Event(s)
Capital hike will still be implemented in conjunction with the risk-based capital (RBC) requirements
RBC Ratio Event Course of Action
100 % RBC 125% Trend TestLinear extrapolation if next year’s ratio < 100%. If so, move to Company Action Event. Stress Test to be required.
75 % RBC 100 %Company Action
Company required to submit RBC plan and financial projection and implement the plan.
50 % RBC 75 %Regulatory Action
IC authorized to examine company and issue Corrective Orders.
35 % RBC 50 %Authorized Control
IC authorized to take control of the company.
RBC 35 %Mandatory Control
IC required to take control of the company.
30
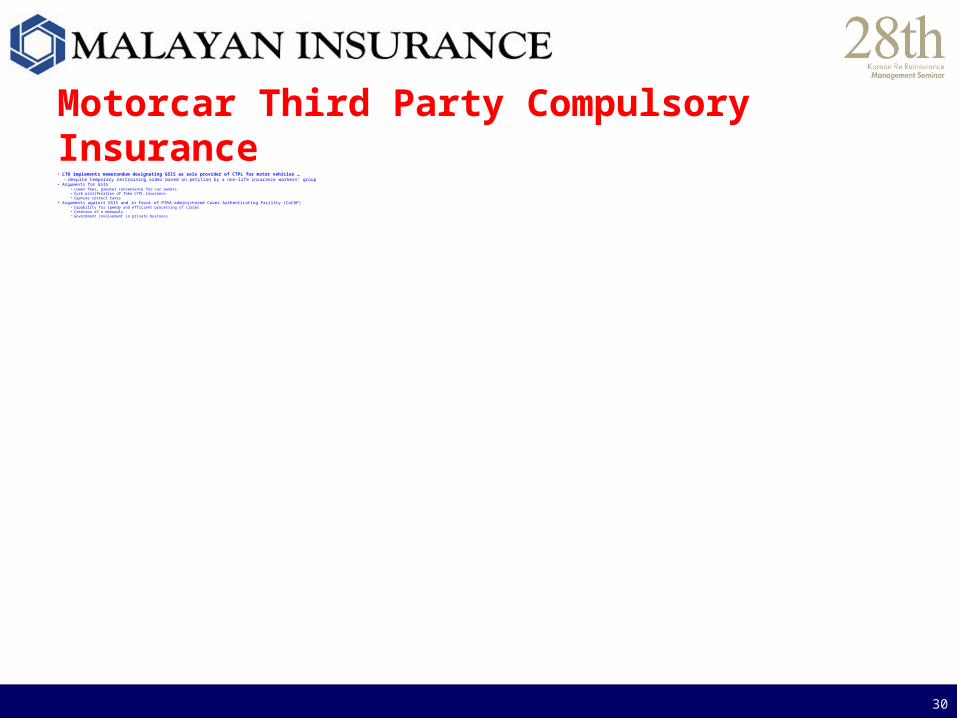
Motorcar Third Party Compulsory Insurance • LTO implements memorandum designating GSIS as sole provider of CTPL for motor vehicles …
– despite temporary restraining order based on petition by a non-life insurance workers’ group• Arguments for GSIS
• Lower fees, greater convenience for car owners• Curb proliferation of fake CTPL insurance• Capture correct taxes
• Arguments against GSIS and in favor of PIRA-administered Cover Authenticating Facility (CoCAF)• Capability for speedy and efficient processing of claims• Creation of a monopoly• Government involvement in private business

31
Insurance Taxes• New tax provisions affecting the insurance industry
+ Positive• Additional exemption in computing MCIT:
– Cost of facilities such as depreciation, supplies, rental of equipment– Inspection & medical fees– Interest expense on investment income not subject to final tax
• Reduction in documentary stamp tax (DST) from 12.5% (P0.50 for every P4 premiums) to 0.25% (P0.50 for every P200 premiums) for PA&Health– Negative
• Imposition of P15 DST on Certificates of Insurance• Investment income realized from funds held subject to gross receipts tax

32
Competitive LandscapeReduction in number of companies from
93 in 2006 to 87 in 20072 local companies were not renewed their
Certificates of Authority 2 others were placed under conservatorship, due to
capital or MOS deficiencies1 foreign company, Aviva, pulled out of the market2 companies merged (merger of BPIMS and FGU)
Non-life insurance industry remains overcrowded

33
Competitive LandscapeReduction in number of companies from
93 in 2006 to 87 in 2007Non-life insurance industry remains
overcrowdedIntense competition characterized by rate-
cutting and rising intermediary compensation

34
Competitive LandscapeReduction in number of companies from
93 in 2006 to 87 in 2007Non-life insurance industry remains
overcrowdedIntense competition characterized by rate-
cutting and rising intermediary compensation
Low insurance penetration of less than 1%--there is still a huge untapped market potential

35Market Report: The Philippine Non-Life Insurance Industry by Ann Margaret E. Jasmin
thank you!