market outlook, 28-05-2013
TRANSCRIPT

7/30/2019 Market Outlook, 28-05-2013
http://slidepdf.com/reader/full/market-outlook-28-05-2013 1/20
www.angelbroking.com
Market Outlook May 28, 2013
Dealer’s Diary
The Indian markets are expected to open flat to positive tracking marginally
positive opening in most of the Asian markets and the flat opening of SGX Nifty.
US markets were closed yesterday owing to Memorial Day holiday. Nevertheless, The European markets ended the day higher on Monday, after markets in Asia
closed mixed amid uncertainties about whether the Federal Reserve would scale
down its bond purchase program. Volumes were thin amid the Spring Bank
holiday for the UK market and the Memorial Day in the U.S.
Meanwhile Indian markets ended higher on Monday and the benchmark Sensex
jumped 326 points as investors cheered falling crude oil price and placed renewed
faith in the US Federal Reserve continuing with its monetary stimulus. RIL led the
rally gaining more than 5% after the company announced a discovery in the D6
block in KG Basin post-market hours on Friday.
Markets Today
The trend deciding level for the day is 19,931 / 6,053 levels. If NIFTY trades above
this level during the first half-an-hour of trade then we may witness a further rally
up to 20,183 – 20,336 / 6,130 – 6,177 levels. However, if NIFTY trades below
19,931 / 6,053 levels for the first half-an-hour of trade then it may correct up to
19,778 – 19,526 / 6,006 – 5,929 levels.
Indices S2 S1 PIVOT R1 R2
SENSEX 19,526 19,778 19,931 20,183 20,336
NIFTY 5,929 6,006 6,053 6,130 6,177
News Analysis Result Review: Coal India, NALCO, Bhushan Steel, GIPCL, Bajaj Electricals,
TTK Healthcare, Sarda Energy, Siyaram Silk Mills
Result Preview: Sun Pharma, GAIL, Colgate, Hindalco, Tata Global, PVR,
Dishman Pharma, Indoco RemediesRefer detailed news analysis on the following page
Net Inflows (May 24, 2013)` cr Purch Sales N et M TD YTD
FII 2,384 2,566 (182) 17,343 78,500
MFs 479 688 (209) (2,704) (11,294)
FII Derivatives (May 27, 2013)` cr Purch Sales N et O pen Interest
Index Futures 3,284 3,118 167 17,747
Stock Futures 7,578 7,704 (125) 31,465
Gainers / Losers
G a iners Losers
C ompa ny Price (`) chg (%) Com pan y Price (`) chg (%)
Britannia Inds 666 15.9 Jet Air India 546 (3.0)
Indusind Bank 529 6. 0 Prestige Estates 167 (2.7)
Emami-$ 778 5. 7 Crompton Greav 94 (2.4) Apollo Hosp 952 5. 6 United Spirits 2,514 (2.2)
Reliance Comm 114 5. 3 Berger Paints 241 (1.8)
D om estic Indices C hg (%) (Pts) (C lose)
BSE Sensex 1.7 326 20,031
Nifty 1.7 100 6,083
MID CAP 1.1 73 6,460
SMALL CAP 0.8 47 6,040
BSE HC 1.6 136 8,866
BSE PSU 0.8 54 6,732
BANKEX 1.5 215 14,806
AUTO 0.5 58 10,931
METAL 1.9 169 8,826
OIL & GAS 2.8 236 8,806
BSE IT 1.2 70 6,025
G lobal Indices Chg (%) (Pts) (C lose)
Dow Jones 0.1 9 15,303NASDAQ (0.0) (0) 3,459
FTSE (0.6) (42) 6,654
Nikkei (3.2) (470) 14,143
Hang Sang 0.3 67 22,686
Straits Times (0.1) (2) 3,391
Shanghai Com 0.2 5 2,293
Indian ADR Chg (%) (Pts) (C lose)
INFY (1.6) (0.7) $41.8
WIT (0.8) (0.1) $7.8IBN 0.4 0.2 $46.4
HDB 0.0 0.0 $41.5
Adva nces / D eclines BSE N SE
Advances 1,364 849
Declines 981 508
Unchanged 140 92
Volume s (` cr)
BSE 1,888
NSE 9,255

7/30/2019 Market Outlook, 28-05-2013
http://slidepdf.com/reader/full/market-outlook-28-05-2013 2/20
www.angelbroking.com
Market OutlookMay 28, 2013
Result Review
Coal India (CMP: `314 / TP: `345 / Upside: 10%)
Coal India (CIL) results came in above our estimate on account of higher than
expected sales volumes. Net sales grew by 2.5% yoy to `19,905cr (above our
estimate of `18,918cr). Sales volumes stood at 130mn tonnes indicating
company’s focus on increasing off-take. EBITDA increased by 51.0% yoy to
`6,600cr due to lower employee costs. Hence the adjusted net profit stood at
`5,425cr (+34.5% yoy) above our estimate of `4,376cr. W e m aintain Accumulate
rating on the stock with a target price of `3 4 5
Y/ E Sa les O PM PAT EPS RO E P/ E P/ BV EV/ EBITD A EV/ Sa les
March (` cr) (%) (` cr) (`) (%) (x) (x) (x) (x)
FY2014E 68,349 31.7 17,504 27.7 36.7 11.3 3.0 5.7 1.8
FY2015E 73,450 31.7 18,703 29.6 35.1 10.6 2.6 4.9 1.6
Nalco (CMP: `35 / TP: / Upside: -)
Nalco reported better than expected performance both on top line and PAT front.
Net sales grew by 4.6% yoy to `1,835cr (above our estimate of `1,656cr). Its
aluminium segment reported a positive EBIT of `59cr, compared to an EBIT loss of
`16cr in 4QFY2012 which led to improvement in the performance. Nalco reported
an EBITDA growth of 37.6% yoy to `421cr due to lower power costs. Other
income, however, declined by 33.6% yoy to `159cr and depreciation expenses
also increased by 10.6% yoy to `136cr. Consequently, the company reported a net
profit decline of 12.7% yoy to `246cr (significantly above our estimate of `201cr).
W e recomm end N eutra l rating on the stock.
Y/ E Sa les O PM PAT EPS RO E P/ E P/ BV EV/ EBITD A EV/ Sa les
March (` cr) (%) (` cr) (`) (%) (x) (x) (x) (x)
FY2014E 8,187 14.5 824 3.2 6.8 10.9 0.7 4.0 0.6
FY2015E 8,416 14.7 840 3.3 6.7 10.7 0.7 3.9 0.6
Bhushan Steel (CMP: `435/ TP: - /Upside: -)
Bhushan Steel reported its 4QFY2013 results. Net sales was flat yoy at̀ 2,819cr.
However, EBITDA decreased by 2.5% yoy to `921cr on account of increase in
employee costs and other expenses. Depreciation expense increased 27.2% yoy to`210cr on account of increased capacity and consequently, net profit decreased by
15.0% yoy to `280cr. We maintain our Neutral view on the stock.
Y/ E Sa les O PM PAT EPS RO E P/ E P/ BV EV/ EBITD A EV/ Sa les
March (` cr) (%) (` cr) (`) (%) (x) (x) (x) (x)
FY2014E 13,794 30.7 1,038 48.9 11.2 8.9 0.9 7.6 2.3
FY2015E 17,335 34.8 1,775 83.6 16.7 5.2 0.8 5.2 1.8
GIPCL (CMP: `74/ TP: `78/Upside: 5.4 %)
GIPCL reported its 4QFY2013 results. Top-line was in-line with our estimates,
growing by 25% yoy to `331cr (vs. our estimate of `340cr). However, operational
performance was much better than our estimate with EBITDAM at 42%.
Consequently, the company’s net profit stood at `62cr (vs`39cr in 4QFY2013 and

7/30/2019 Market Outlook, 28-05-2013
http://slidepdf.com/reader/full/market-outlook-28-05-2013 3/20
www.angelbroking.com
Market OutlookMay 28, 2013
our estimate of `55cr). We maintain Accumulate rating on the stock with target
price of `7 8 .
Y/ E Sa les O PM PAT EPS RO E P/ E P/ BV EV/ EBITD A EV/ Sa les
March (` cr) (%) (` cr) (`) (%) (x) (x) (x) (x)
FY2014E 1,535 31.9 198 13.1 12.4 5.7 0.7 3.5 1.1FY2015E 1,570 31.6 214 14.1 12.2 5.3 0.6 2.9 0.9
Bajaj Electri cals Ltd (CMP: `168/ TP: `237/ Upside: 39%)
Bajaj Electricals Ltd. (BEL) reported poor set of numbers for 4QFY2013. Top-line
reported flat growth of 5.1% yoy to `1,114cr. The consumer durables (CD) and
Lighting and luminous (LnL) segment registered growth of 22.4% and 14.9% yoy
respectively while E&P segment dip by 22.5%. EBITDA stood at `15cr which was
lower by 84.7% yoy while margins at 1.2% lower by 694bp owing to higher raw
material cost. At EBIT levels, both CD and LnL segment reported margin of 8.0%and 7.9% respectively vis-à-vis 10.6% and 11.3% in the same quarter previous
year. Lower EBIT margin is attributable to the inventory correction on account of
new inventory policies of the company. E&P segment, however, reported EBIT loss
of `51cr, 17.8% of the segment revenue, mainly due to unexpected hits from the
closure of the older delayed sites.
On annual front, top-line grew by 9.3% to `3,388cr contributed mainly by CD
segment (54.2%), followed by LnL (25.4%) and E&P (20.3%). EBITDA came in at
`110cr, lower by 53.4%, while margins at 3.3% lower by 440bp owing to 517bp
higher raw material cost. On the back of sluggish top-line growth and poor
operating performance, net profit dip by 56.9% to `51cr.
Amidst poor performance for the quarter, BEL is set to start the FY2014 with a
clean slate after the stock correction and significant hit from the cost over-run of
E&P’s delayed projects closure. In addition, BEL has initiated its entry into premium
segment of CD market with new launches slated to hit the market. On the back of
recent developments, we expect the top-line and bottom line to grow at CAGR of
14.9% and 96.7% (due to low base) respectively over FY2013-15E. W e
recomm end Buy rating on the stock with ta rget price of `23 7 based on target PE of
1 2 x for FY201 5 E.
Y/ E Sa les O PM PAT EPS RO E P/ E P/ BV EV/ EBITD A EV/ Sa les
March (` cr) (%) (` cr) (`) (%) (x) (x) (x) (x)
FY2014E 3,885 5.4 109 10.9 21.7 15.4 2.1 8.3 0.5
FY2015E 4,472 7.2 197 19.7 30.2 8.5 1.7 5.3 0.4
TTK Healthcare (CMP: `560/ TP: `667/ Upside: 19%)
TTKH reported a disappointing set of numbers for 4QFY2013. Topline came in at
`86cr, 2.2% decline on a yoy basis from `88cr in 4QFY2012 and 11.7% lower
from our estimate of `97cr. The EBITDA margin for the quarter contracted by
224bp yoy to 3.7% primarily due to increase in other expenses as compared to
4QFY2012. The margin contraction was attributable to loss of `3cr in theconsumer products division. Consequently, net profit declined by 39% to `2cr on
4QFY2012.

7/30/2019 Market Outlook, 28-05-2013
http://slidepdf.com/reader/full/market-outlook-28-05-2013 4/20
www.angelbroking.com
Market OutlookMay 28, 2013
For FY2013, revenue growth stood at modest 8.1% yoy to `382cr from 354cr in
FY2012. While EBITDA margin contracted by 145bp to 5.3% on account of
increase in overall expenses. This led to a 9.5% yoy decline in net profit to `14cr in
FY2013.
Going forward we expect the EBITDA margin to expand on account of increasingcontribution from high margin business like food business, thus resulting in better
profit. At the current market price, the stock is trading at EV/sales of 0.7x for
FY2015E, which we feel is attractive. Hence, we maintain our buy
recommendation on the stock with a target price of `667 based on a target
EV/ sales of 0. 9 x for FY2 01 5 E.
Y/ E Sa les O PM PAT EPS RO E P/ E P/ BV EV/ EBITD A EV/ Sa les
March (` cr) (%) (` cr) (`) (%) (x) (x) (x) (x)
FY2014E 427 6.0 17 22.5 17.1 24.9 4.1 13.8 0.8
FY2015E 488 6.7 22 28.8 19.5 19.4 3.5 10.7 0.7
Sarda Energy and Minerals (CMP: `107, TP: `153, Upside: 43%)
Sarda Energy and Minerals (SEML) reported healthy 4QFY2013 numbers. The net
sales grew by 5.8% yoy to `315cr mainly driven by healthy performance from steel
business. The EBITDA however declined by 3.9% yoy to `71cr due to higher staff
costs and other expenses. The interest costs decreased by 77.4% yoy to `8cr and
the other income declined by 95.5% yoy to `2cr. The company got a tax benefit of
`1cr compared to a tax expense of `24cr in 4QFY2012 and as a result the net
profit of the company increased by 34.0% yoy to `50cr. We maintain our Buy
rating on the stock with a target price of `1 5 3 .
Y/ E Sa les O PM PAT EPS RO E P/ E P/ BV EV/ EBITD A EV/ Sa les
March (` cr) (%) (` cr) (`) (%) (x) (x) (x) (x)
FY2014E 1,494 19.1 112 31.3 11.3 3.4 0.4 2.9 0.6
FY2015E 1,568 20.3 131 36.5 11.9 2.9 0.3 2.3 0.5
Siyaram Silk Mil ls (CMP: `262/ TP: ` 331/ Upside: 26%)
For 4QFY2013, Siyaram Silk Mills (SSM) reported numbers mixed set of numbers.
The company's top line grew by 8.3% yoy to `290cr, in-line with our estimate of
`296cr for the quarter. However, the company disappointed on the operating
margin front as it came in at 91bp lower to 10.3% for the quarter against our
estimate of 13.0% mainly due to higher than expected raw material cost as a per
cent of net sales. On yoy basis, the operating margin dipped by 177bp yoy mainly
because of higher other expense. Interest outgo for the quarter was `5cr, against
our estimate of `10cr and depreciation cost for the quarter stood at `6cr, against
our estimate of `11cr. Consequently, the company reported a bottomline of `13cr,
23.8% lower yoy, in line with our expectation.
On annual basis, the company’s top line grew by 13.7% to `1,041cr against our
estimate of 1,048cr. Due to higher than expected raw material cost, the
company’s operating margin stood at 10.6%, 69bp lower than our estimate of
11.3%. The interest cost as a per cent of loan decreased from 11.2% to 10.4%
leading to an interest outgo of `29cr. Also, depreciation cost for the year stood at
`22cr, against our estimate of `27cr. The company’s profit for the year dipped

7/30/2019 Market Outlook, 28-05-2013
http://slidepdf.com/reader/full/market-outlook-28-05-2013 5/20
www.angelbroking.com
Market OutlookMay 28, 2013
marginally by 3.0% as compared to FY2012 and came at `55cr, in line with our
expectation.
During the year the company installed 129 looms and 101 garment machines and
further plans to add 50 looms and 100 garment machines in FY2014E. Also, the
company has signed 27 franchise agreements in the first two months of FY2014out of targeted 90 for the full year for strengthening and improving brand visibility.
At CMP of `262, the stock is trading at a PE of 3.2x FY2015E earnings. W e
m a intain o ur Buy recomm enda tion on the stock with a revised target price o f `3 3 1
ba sed on a target P/ E of 4 .0x for FY20 15 E.
Y/ E Sa les O PM PAT EPS RO E P/ E P/ BV EV/ EBITD A EV/ sa les
March (` cr) (%) (` cr) (`) (%) (x) (x) (x) (x)
FY2014E 1,157 11.9 68 72.2 19.7 3.6 0.7 3.7 0.4
FY2015E 1,320 11.8 78 82.8 19.0 3.2 0.6 3.5 0.4
Result Preview
Sun Pharmaceutical Industries (CMP: `1015/ TP: -/ Upside: -)
Among the large-caps in our coverage universe, for 4QFY2013, Sun Pharma is
likely to clock 20.2% yoy growth on the sales front (̀ 2,800cr), led by both exports
and domestic sales. The OPM would decline by 200bp to around 42.9%. The ne
profit is likely to grow 21.5% yoy during the quarter (`997cr). We are neutral on
the stock.
Y/ E Sa les O PM PAT EPS RO E P/ E P/ BV EV/ EBITD A EV/ Sa les
March (` cr) (%) (` cr) (`) (%) (x) (x) (x) (x)
FY2014E 12,563 42.6 3,086 29.8 18.6 19.2 6.0 17.1 7.3
FY2015E 14,698 42.6 3,680 35.5 20.3 19.3 5.1 13.9 5.9
GAIL (CMP: `326 / TP: -/ Upside: -)
GAIL is expected to announce its 4QFY2013 results today. We expect the
company’s top-line to grow by 15.1% yoy to `12,038cr on account of higher
volumes and operating margin is expected to expand by 629bp yoy to 13.3%. On
the bottom-line front, we expect GAIL to report an increase of 72.9% yoy to `835cr
due to lower base. We maintain our Neutral view on the stock.
Y/ E Sa les O PM PAT EPS RO E P/ E P/ BVEV/ EBITD AEV/ Sa les
March (` cr) (%) (` cr) (`) (%) (x) (x) (x) (x)
FY2014E 55,815 15.3 4,556 35.9 17.0 9.1 1.4 4.1 0.6
FY2015E 63,013 15.2 5,259 41.5 17.1 7.9 1.3 2.9 0.4
Colgate Palmolive (CMP: `1,491/ TP:-/ Upside: - )
Colgate Palmolive is expected to declare its 4QFY2013 results today. We expec
the top-line to grow by 17.9% yoy to `809cr. OPM is expected to decline by 497bp
yoy to 17.3%. Bottom-line is expected to remain flat at `130cr. We maintain our
N eutra l recom me nda tion on the stock.

7/30/2019 Market Outlook, 28-05-2013
http://slidepdf.com/reader/full/market-outlook-28-05-2013 6/20
www.angelbroking.com
Market OutlookMay 28, 2013
Y/ E Sa les O PM PAT EPS RO E P/ E P/ BV EV/ EBITD A EV/ sa les
March (` cr) (%) (` cr) (`) (%) (x) (x) (x) (x)
FY2014E 3,588 21.1 608 44.7 98.3 33.3 29.6 27.5 5.5
FY2015E 4,130 21.6 705 51.9 88.0 28.7 22.1 23.1 4.7
Hindalco (CMP: `111/ TP:-/ Upside :-)
Hindalco is slated to report its 4QFY2013 results today. We expect standalone net
sales to decline by 8.0% yoy to `6,959cr. However, EBITDA margin is expected to
expand by 25bp yoy to 11.7% on account of better profitability from copper
segment. Net profit is expected to decrease by 17.5% yoy to `528cr. We maintain
our N eutra l view o n the stock.
Y/ E Sa les O PM PAT EPS RO E P/ E P/ BVEV/ EBITD A EV/ Sa les
March (` cr) (%) (` cr) (`) (%) (x) (x) (x) (x)
FY2014E 88,987 9.2 2,640 13.8 7.6 8.0 0.6 6.4 0.6
FY2015E 94,163 9.7 3,037 15.9 8.1 7.0 0.5 5.6 0.5
Tata Global (CMP: `144/ TP:-/ Upside: -)
Tata Global is expected to declare its 4QFY2013 results today. We expect the top-
line to grow by 5.1% yoy to `1,812cr. OPM is expected to decline by 54bp yoy to
7.4%. Bottom-line is expected to increase by 15.7% yoy to `98cr. We ma intain our
N eutra l recom me nda tion on the stock.
Y/ E Sa les O PM PAT EPS RO E P/ E P/ BV EV/ EBITD A EV/ sa les
March (` cr) (%) (` cr) (`) (%) (x) (x) (x) (x)
FY2014E 7,998 9.7 487 7.9 9.5 18.2 1.7 10.6 1.0
FY2015E 8,798 9.8 537 8.7 9.8 16.5 1.6 9.3 0.9
PVR (CMP: `328/ TP: - / Upside: - %)
For 4QFY2013, we expect PVR to report robust 40% yoy growth in top-line to
`164cr, on back of good performance in movie exhibition business, with many
successful releases during the quarter. The company’s EBITDA margin is likely to
expand by robust 1,353bp yoy to 17.1% (aided by very low base effect).
Consequently, Net profit is expected to be `6cr. At the current market price, PVR is
trading at 14.3x FY2015E consolidated EPS of `22.9. W e be lieve the stock is fa irly
valued and hence, maintain our Neutral rating on the stock.
Y/ E Sa les O PM PAT EPS RO E P/ E P/ BV EV/ EBITD A EV/ Sa les
March (` cr) (%) (` cr) (`) (%) (x) (x) (x) (x)
FY2014E 1,343 18.8 73 18.3 10.6 17.9 1.8 5.6 0.9
FY2015E 1,521 18.9 91 22.9 12.3 14.3 1.7 4.8 0.8
Dishman Pharma (CMP: `69/ TP: -206/ Upside: - 198.5%)
Dishman Pharmaceutical is expected to report a top-line growth of 2.2% to
`358cr. The OPM is expected to contract by 60bp yoy to 22.9%. As a result, net
profit is expected to decrease by 8.6% yoy to `28.6cr on back of contraction in
OPM. W e ma intain our buy with a target of 20 6 .

7/30/2019 Market Outlook, 28-05-2013
http://slidepdf.com/reader/full/market-outlook-28-05-2013 7/20
www.angelbroking.com
Market OutlookMay 28, 2013
Y/ E Sa les O PM PAT EPS RO E P/ E P/ BV EV/ EBITD A EV/ Sa les
March (` cr) (%) (` cr) (`) (%) (x) (x) (x) (x)
FY2014E 1,536 20.2 124.3 15.4 11.6 4.6 0.5 4.9 1.0
FY2015E 1,739 20.9 166.3 20.6 13.7 3.4 0.4 3.9 0.8
Indoco Remedies (CMP: `60/ TP: -89/ Upside: - 48.3%)
Indoco Remedies is expected to report a top-line growth of 18.9% to `176cr. The
OPM is expected to expand by 230bp yoy to 16.9%, driven by growth in domestic
formulation sales. As a result, net profit is expected to increase by 81.0% yoy to
`22.7cr on back of improvement in OPM. We maintain our buy with a target of
8 9 .
Y/ E Sa les O PM PAT EPS RO E P/ E P/ BV EV/ EBITD A EV/ Sa les
March (` cr) (%) (` cr) (`) (%) (x) (x) (x) (x)
FY2014E 774 15.2 66.5 7.2 14.5 8.3 1.1 6.1 0.9
FY2015E 938 15.2 82.4 8.9 15.8 6.7 1.0 5.1 0.8
Quarterly Bloomberg Brokers Consensus Estimate
C o lg a te (2 8 / 0 5 / 2 0 1 3 )
Particula rs (` cr) 4 Q F Y 1 3 E 4 Q F Y 1 2 y-o-y (%) 3 Q F Y 1 3 q-o-q (%)
Net sales 797 686 16 763 4
EBITDA 181 170 7 150 21
EBITDA margin (%) 22.7 24.8 19.7
Net profit 141 131 8 111 27
G a i l (2 8 / 0 5 / 2 0 1 3 )
Particula rs (` cr) 4 Q F Y 1 3 E 4 Q F Y 1 2 y-o-y (%) 3 Q F Y 1 3 q-o-q (%)
Net sales 11,737 10,455 12 12,474 (6)
EBITDA 1,439 768 87 2,002 (28)
EBITDA margin (%) 12.3 7.3 16.0
Net profit 875 483 81 1,285 (32)
Hindalco Industr ies (2 8/ 05 / 20 13 )
Particula rs (` cr) 4 Q F Y 1 3 E 4 Q F Y 1 2 y-o-y (%) 3 Q F Y 1 3 q-o-q (%)
Net sales 7,016 7,563 (7) 6,790 3
EBITDA 626 865 (28) 582 8
EBITDA margin (%) 8.9 11.4 8.6
Net profit 378 640 (41) 434 (13)
H PC L (2 8 / 0 5 / 2 0 1 3 )
Particula rs (` cr) 4 Q F Y 1 3 E 4 Q F Y 1 2 y-o-y (%) 3 Q F Y 1 3 q-o-q (%)
Net sales 56,232 52,394 7 52,751 7
EBITDA 7,148 5,516 30 1,051 580
EBITDA margin (%) 13 11 2
Net profit 6,735 4,631 45 147 4478

7/30/2019 Market Outlook, 28-05-2013
http://slidepdf.com/reader/full/market-outlook-28-05-2013 8/20
www.angelbroking.com
Market OutlookMay 28, 2013
N H PC (2 8 / 0 5 / 2 0 1 3 )
Particula rs (` cr) 4 Q F Y 1 3 E 4 Q F Y 1 2 y-o-y (%) 3 Q F Y 1 3 q-o-q (%)
Net sales 1,157 1,386 (17) 912 27
EBITDA 667 994 (33) 614 9
EBITDA margin (%) 57.7 71.8 67.3
Net profit 449 802 (44) 312 44
Power G r id Corporat ion (28 / 05 / 20 13 )
Particula rs (` cr) 4 Q F Y 1 3 E 4 Q F Y 1 2 y-o-y (%) 3 Q F Y 1 3 q-o-q (%)
Net profit 1,116 1,032 8 1,129 (1)
Rural Electrification (28 / 0 5/ 2 01 3 )
Particula rs (` cr) 4 Q F Y 1 3 E 4 Q F Y 1 2 y-o-y (%) 3 Q F Y 1 3 q-o-q (%)
Net profit 1,012 763 33 1,027 (1)
Sun Pharma ceutical Consolidated (28 / 05 / 2 01 3)Particula rs (` cr) 4 Q F Y 1 3 E 4 Q F Y 1 2 y-o-y (%) 3 Q F Y 1 3 q-o-q (%)
Net sales 2,992 2,330 28 2,852 5
EBITDA 1,285 963 33 1,275 1
EBITDA margin (%) 42.9 41.3 44.7
Net profit 912 820 11 881 3
Tata G lobal Beverage Consolidated (28/ 05 / 20 13 )
Particula rs (` cr) 4 Q F Y 1 3 E 4 Q F Y 1 2 y-o-y (%) 3 Q F Y 1 3 q-o-q (%)
Net sales 1,890 1,724 10 1,902 (1)
EBITDA 199 187 6 203 (2)
EBITDA margin (%) 10.5 10.9 10.7
Net profit 99 54 83 80 24
BPCL (29 /05 /2013 )
Particula rs (` cr) 4 Q F Y 1 3 E 4 Q F Y 1 2 y-o-y (%) 3 Q F Y 1 3 q-o-q (%)
Net sales 63,060 64,642 (2) 62,340 1
EBITDA 6,344 5,064 25 2,287 177
EBITDA margin (%) 10.1 8 4
Net profit 4,531 3,963 14 1,648 175
C i p l a ( 2 9 / 0 5 / 2 0 1 3 )Particula rs (` cr) 4 Q F Y 1 3 E 4 Q F Y 1 2 y-o-y (%) 3 Q F Y 1 3 q-o-q (%)
Net sales 2,071 1,814 14 2,031 2
EBITDA 475 399 19 493 (4)
EBITDA margin (%) 22.9 22.0 24.3
Net profit 334 292 15 339 (1)
HDIL Consol idated (29/05/2013)
Particula rs (` cr) 4 Q F Y 1 3 E 4 Q F Y 1 2 y-o-y (%) 3 Q F Y 1 3 q-o-q (%)
Net sales 458 423 8 625 (27)
EBITDA 300 157 91 413 (27)
EBITDA margin (%) 65.5 37.2 66.1
Net profit 164 156 5 316 (48)

7/30/2019 Market Outlook, 28-05-2013
http://slidepdf.com/reader/full/market-outlook-28-05-2013 9/20
www.angelbroking.com
Market OutlookMay 28, 2013
N M D C (2 9 / 0 5 / 2 0 1 3 )
Particula rs (` cr) 4 Q F Y 1 3 E 4 Q F Y 1 2 y-o-y (%) 3 Q F Y 1 3 q-o-q (%)
Net sales 2,831 2,594 9 2,047 38
EBITDA 2,109 1,976 7 1,391 52
EBITDA margin (%) 74.5 76.2 68.0
Net profit 1,725 1,642 5 1,293 33
O N G C (2 9 / 0 5 / 2 0 1 3 )
Particula rs (` cr) 4 Q F Y 1 3 E 4 Q F Y 1 2 y-o-y (%) 3 Q F Y 1 3 q-o-q (%)
Net sales 19,621 18,819 4 20,987 (7)
EBITDA 9,912 8,020 24 9,272 7
EBITDA margin (%) 50.5 42.6 44.2
Net profit 4,738 5,644 (16) 5,563 (15)
Tata Motors Consolidated (29/ 05 / 20 13 )
Particula rs (` cr) 4 Q F Y 1 3 E 4 Q F Y 1 2 y-o-y (%) 3 Q F Y 1 3 q-o-q (%)
Net sales 51,536 50,609 2 45,821 12
EBITDA 6,814 6,745 1 5,657 20
EBITDA margin (%) 13.2 13.3 12.3
Net profit 2,727 6,234 (56) 1,801 51
DLF Consolidated (30 / 05 / 20 13 )
Particula rs (` cr) 4 Q F Y 1 3 E 4 Q F Y 1 2 y-o-y (%) 3 Q F Y 1 3 q-o-q (%)
Net sales 2,053 2,617 (22) 1,310 57
EBITDA 794 798 (0) 87 812
EBITDA margin (%) 38.7 30.5 6.6Net profit 156 212 (26) 285 (45)
G M R Infra Consolidated (30 / 05 / 20 13 )
Particula rs (` cr) 4 Q F Y 1 3 E 4 Q F Y 1 2 y-o-y (%) 3 Q F Y 1 3 q-o-q (%)
Net sales 2,199 2,099 5 2,356 (7)
EBITDA 652 269 142 584 12
EBITDA margin (%) 29.7 12.8 24.8
Net profit(108) (366)
(70) (216)
(50)
Ind ian O il Corp (30 / 05 / 201 3 )Particula rs (` cr) 4 Q F Y 1 3 E 4 Q F Y 1 2 y-o-y (%) 3 Q F Y 1 3 q-o-q (%)
Net sales 126,700 127,700 (1) 115,300 10
EBITDA 18,061 14,750 22 5,372 236
EBITDA margin (%) 14.3 12 5
Net profit 13,305 12,670 5 3,332 299
Ma hindra & Mahindra (30 / 05 / 20 13 )
Particula rs (` cr) 4 Q F Y 1 3 E 4 Q F Y 1 2 y-o-y (%) 3 Q F Y 1 3 q-o-q (%)
Net sales 10,085 9,241 9 10,643 (5)
EBITDA 1,178 865 36 1,211 (3)
EBITDA margin (%) 11.7 9.4 11.4
Net profit 780 874 (11) 836 (7)

7/30/2019 Market Outlook, 28-05-2013
http://slidepdf.com/reader/full/market-outlook-28-05-2013 10/20
www.angelbroking.com
Market Outlook May 28, 2013
Power Finance Corporation (30/05/2013)
Particulars (` cr) 4QFY13E 4QFY12 y-o-y (%) 3QFY13 q-o-q (%)
Net profit 1,121 818 37 1,117 0
SAIL (30/05/2013)
Particulars (` cr) 4QFY13E 4QFY12 y-o-y (%) 3QFY13 q-o-q (%)
Net sales 12,208 13,397 (9) 10,495 16
EBITDA 1,649 1,871 (12) 1,138 45
EBITDA margin (%) 13.5 14.0 10.8
Net profit 815 1,577 (48) 484 68
Tata Power Consolidated (30/05/2013)
Particulars (` cr) 4QFY13E 4QFY12 y-o-y (%) 3QFY13 q-o-q (%)
Net sales 9,281 7,170 29 8,992 3
EBITDA 1,773 1,460 21 1,855 (4)
EBITDA margin (%) 19.1 20.4 20.6
Net profit 284(629)
(145)(329)
(186)
Economic and Political News
Economists see Q4FY2013 GDP at 4.8%
High subsidy burden due to Food Bill is exaggeration: Plan Com
BofA-ML sees 25 bps cut in repo, CRR in June review
Corporate News
Diageo gets 10% stake in United Spirits Dabur expands packaged food biz; launches drinking yoghurts
Britannia restructures operations to boost growth
Kalanithi Maran to sell 2% equity share in Sun TV through OFS Source: Economic Times, Business Standard, Business Line, Financial Express, Mint

7/30/2019 Market Outlook, 28-05-2013
http://slidepdf.com/reader/full/market-outlook-28-05-2013 11/20
Date Company
May 28, 2013GAIL, Sun Pharma, Power Grid Corpn, NHPC, Hindalco, Rural Elec.Corp., Colgate, HPCL, Tata Global, Tata Comm,CESC, Jagran Prakashan, Indoco Remedies, Dishman Pharma, Godawari Ispat, PVR, Cravatex
May 29, 2013ONGC, NMDC, Tata Motors, BPCL, Cipla, Canara Bank, Mphasis, HDIL, Monnet Ispat, BGR Energy , Anant Raj,Madhucon Proj, Jyoti Structures, J K Lakshmi Cements, Greenply
May 30, 2013
IOC, M&M, SAIL, DLF, Tata Power Co., Power Fin.Corpn., Cadila Healthcare, GMR Infra., Central Bank, Suzlon
Energy, GSPL, Aurobindo Pharma, Ipca labs, Page Industries, Madras Cements, Sadbhav Engg., Simplex Infra, IVRCLInfra, Patel Engg.
Source: Bloomberg, Angel Research
Result Calendar
Global economic events release calendar
Date Time Country Event Description Unit Period Bloomberg Data
Last Reported Estimated
May 29, 2013 1:25PM Germany Unemployment change (000's) Thousands May 4.00 5.00
May 30, 2013 6:00PM US Initial Jobless claims Thousands May 25 340.00 340.002:30PM Euro Zone Euro-Zone Consumer Confidence Value May F (21.90) (21.90)
6:00PM US GDP Qoq (Annualised) % Change 1Q S 2.50 2.50
May 31, 2013 11:00AM India Qtrly GDP YoY% % Change 1Q 4.50 4.80
June 1, 2013 6:30AM China PMI Manufacturing Value May 50.60 50.00
June 3, 2013 1:25PM Germany PMI Manufacturing Value May F 49.00 --
2:00PM UK PMI Manufacturing Value May 49.80 --
June 5, 2013 1:25PM Germany PMI Services Value May F 49.80 --
2:30PM Euro Zone Euro-Zone GDP s.a. (QoQ) % Change 1Q P (0.20) --
June 6, 2013 4:30PM UK BOE Announces rates % Ratio Jun 6 0.50 0.50
5:15PM Euro Zone ECB announces interest rates % Jun 6 0.50 --
June 7, 2013 6:00PM US Change in Nonfarm payrolls Thousands May 165.00 162.50
6:00PM US Unnemployment rate % May 7.50 7.50
June 8, 2013 4:29PM China Exports YoY% % Change May 14.70 --
June 9, 2013 7:00AM China Consumer Price Index (YoY) % Change May 2.40 --
11:00AM China Industrial Production (YoY) % Change May 9.30 --
June 10, 2013 4:29PM India Imports YoY% % Change May 10.96 --
4:29PM India Exports YoY% % Change May 1.68 --
June 11, 2013 2:00PM UK Industrial Production (YoY) % Change Apr (1.40) --
June 12, 2013 2:00PM UK Jobless claims change % Change May (7.30) --
11:00AM India Industrial Production YoY % Change Apr 2.50 --
June 14, 2013 2:30PM Euro Zone Euro-Zone CPI (YoY) % May F 1.20 --
6:00PM US Producer Price Index (mom) % Change May (0.70) --
6:45PM US Industrial Production % May (0.53) --
12:00PM India Monthly Wholesale Prices YoY% % Change May 4.89 --
June 17, 2013 11:00AM India RBI Repo rate % Jun 17 7.25 --
11:00AM India RBI Cash Reserve ratio % Jun 17 4.00 --
11:00AM India RBI Reverse Repo rate % Jun 17 6.25 --
June 18, 2013 2:00PM UK CPI (YoY) % Change May 2.40 --
6:00PM US Housing Starts Thousands May 853.00 --
6:00PM US Building permits Thousands May 1,005.00 --
6:00PM US Consumer price index (mom) % Change May (0.40) --
Source: Bloomberg, Angel Research
May 28, 2013
Market Outlook

7/30/2019 Market Outlook, 28-05-2013
http://slidepdf.com/reader/full/market-outlook-28-05-2013 12/20
Market Outlook
May 28, 2013
www.angelbroking.com
Macro watch
Exhibit 1: Q uarterly G D P trends
Source: CSO, Angel Research
Exhibit 2: IIP trends
Source: MOSPI, Angel Research
Exhibit 3: M onthly WPI inflation trends
Source: MOSPI, Angel Research
Exhibit 4: M a nufacturing a nd services PM I
Source: Ma rket, Angel Research; N ote: Level above 50 ind icates expansion
Exhibit 5: Expo rts an d impo rts growth trends
Source: Bloomberg, Angel Research
Exhibit 6: Key policy rates
Source: RBI, Angel Research
5.7
9.0
7.5
11.2
8.5
7.68.2
9.2
7.5
6.56.0
5.3 5.5 5.34.5
3.0
4.0
5.0
6.0
7.0
8.0
9.0
10.0
11.0
12.0
1 Q F Y 1 0
2 Q F Y 1 0
3 Q F Y 1 0
4 Q F Y 1 0
1 Q F Y 1 1
2 Q F Y 1 1
3 Q F Y 1 1
4 Q F Y 1 1
1 Q F Y 1 2
2 Q F Y 1 2
3 Q F Y 1 2
4 Q F Y 1 2
1 Q F Y 1 3
2 Q F Y 1 3
3 Q F Y 1 3
(%)
(1.3)
2.5
(2.0)
(0.1)
2.0
(0.7)
8.4
(1.0) (0.6)
2.4
0.5
2.5
(4.0)
(2.0)
-
2.0
4.0
6.0
8.0
10.0
A p r - 1 2
M a y - 1
2
J u n - 1
2
J u l - 1 2
A u g - 1
2
S e p - 1
2
O c - 1
2
N o - 1
2
D e c - 1
2
J a n - 1
3
F e b
- 1 3
M a r - 1 3
(%)
7.6 7.6 7.58.0 8.1
7.3 7.2 7.3 7.36.8
6.0
4.9
0.01.0
2.0
3.0
4.0
5.0
6.0
7.0
8.0
9.0
M a y - 1 2
J u n - 1 2
J u l - 1 2
A u g - 1 2
S e p - 1 2
O c t - 1 2
N o v - 1 2
D e c - 1 2
J a n - 1 3
F e b - 1 3
M a r - 1 3
A p r - 1 3
(%)
48.0
50.0
52.0
54.0
56.0
58.0
F e b
- 1 2
M a r - 1 2
A p r - 1 2
M a y - 1
2
J u n - 1
2
J u l - 1 2
A u g - 1
2
S e p - 1
2
O c - 1
2
N o v - 1
2
D e c - 1
2
J a n - 1
3
F e b
- 1 3
M a r - 1 3
A p r - 1 3
Mfg. PMI Services PMI
(15.0)
0.0
15.0
M a
- 1 2
J u n - 1 2
J u l - 1 2
A u g - 1 2
S e p - 1 2
O c - 1 2
N o v - 1 2
D e c - 1 2
J a n - 1 3
F e b - 1 3
M a - 1 3
A p r - 1 3
Exports yoy growth Imports yoy growth(%)
7.50
6.50
4.003.00
4.00
5.00
6.00
7.00
8.00
9.00
A p r - 1 2
M a - 1
2
J u n - 1
2
J u l - 1 2
A u g - 1
2
S e p - 1
2
O c - 1
2
N o - 1
2
D e c - 1
2
J a n - 1
3
F e b
- 1 3
M a r - 1 3
Repo rate Reverse Repo rate CRR(%)
7/30/2019 Market Outlook, 28-05-2013
http://slidepdf.com/reader/full/market-outlook-28-05-2013 13/20
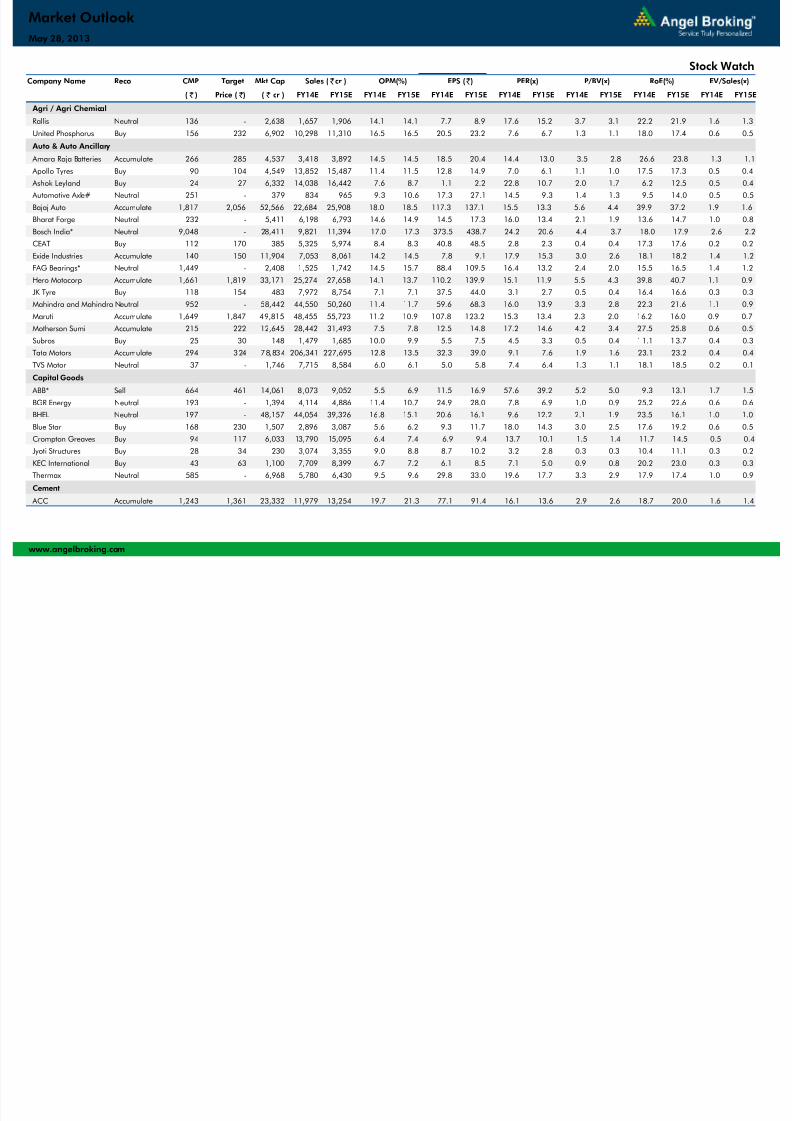
Company Name Reco CMP Target Mkt Cap Sales ( Čcr ) OPM(%) EPS (Č) PER(x) P/BV(x) RoE(%) EV/Sales(x)
( Č ) Price ( Č) ( Č cr ) FY14E FY15E FY14E FY15E FY14E FY15E FY14E FY15E FY14E FY15E FY14E FY15E FY14E FY15E
Agri / Agri Chemical
Rallis Neutral 136 - 2,638 1,657 1,906 14.1 14.1 7.7 8.9 17.6 15.2 3.7 3.1 22.2 21.9 1.6 1.3
United Phosphorus Buy 156 232 6,902 10,298 11,310 16.5 16.5 20.5 23.2 7.6 6.7 1.3 1.1 18.0 17.4 0.6 0.5
Auto & Auto Ancillary
Amara Raja Batteries Accumulate 266 285 4,537 3,418 3,892 14.5 14.5 18.5 20.4 14.4 13.0 3.5 2.8 26.6 23.8 1.3 1.1
Apollo Tyres Buy 90 104 4,549 13,852 15,487 11.4 11.5 12.8 14.9 7.0 6.1 1.1 1.0 17.5 17.3 0.5 0.4
Ashok Leyland Buy 24 27 6,332 14,038 16,442 7.6 8.7 1.1 2.2 22.8 10.7 2.0 1.7 6.2 12.5 0.5 0.4
Automotive Axle# Neutral 251 - 379 834 965 9.3 10.6 17.3 27.1 14.5 9.3 1.4 1.3 9.5 14.0 0.5 0.5Bajaj Auto Accumulate 1,817 2,056 52,566 22,684 25,908 18.0 18.5 117.3 137.1 15.5 13.3 5.6 4.4 39.9 37.2 1.9 1.6
Bharat Forge Neutral 232 - 5,411 6,198 6,793 14.6 14.9 14.5 17.3 16.0 13.4 2.1 1.9 13.6 14.7 1.0 0.8
Bosch India* Neutral 9,048 - 28,411 9,821 11,394 17.0 17.3 373.5 438.7 24.2 20.6 4.4 3.7 18.0 17.9 2.6 2.2
CEAT Buy 112 170 385 5,325 5,974 8.4 8.3 40.8 48.5 2.8 2.3 0.4 0.4 17.3 17.6 0.2 0.2
Exide Industries Accumulate 140 150 11,904 7,053 8,061 14.2 14.5 7.8 9.1 17.9 15.3 3.0 2.6 18.1 18.2 1.4 1.2
FAG Bearings* Neutral 1,449 - 2,408 1,525 1,742 14.5 15.7 88.4 109.5 16.4 13.2 2.4 2.0 15.5 16.5 1.4 1.2
Hero Motocorp Accumulate 1,661 1,819 33,171 25,274 27,658 14.1 13.7 110.2 139.9 15.1 11.9 5.5 4.3 39.8 40.7 1.1 0.9
JK Tyre Buy 118 154 483 7,972 8,754 7.1 7.1 37.5 44.0 3.1 2.7 0.5 0.4 16.4 16.6 0.3 0.3
Mahindra and Mahindra Neutral 952 - 58,442 44,550 50,260 11.4 11.7 59.6 68.3 16.0 13.9 3.3 2.8 22.3 21.6 1.1 0.9
Maruti Accumulate 1,649 1,847 49,815 48,455 55,723 11.2 10.9 107.8 123.2 15.3 13.4 2.3 2.0 16.2 16.0 0.9 0.7
Motherson Sumi Accumulate 215 222 12,645 28,442 31,493 7.5 7.8 12.5 14.8 17.2 14.6 4.2 3.4 27.5 25.8 0.6 0.5
Subros Buy 25 30 148 1,479 1,685 10.0 9.9 5.5 7.5 4.5 3.3 0.5 0.4 11.1 13.7 0.4 0.3
Tata Motors Accumulate 294 324 78,834 206,341 227,695 12.8 13.5 32.3 39.0 9.1 7.6 1.9 1.6 23.1 23.2 0.4 0.4
TVS Motor Neutral 37 - 1,746 7,715 8,584 6.0 6.1 5.0 5.8 7.4 6.4 1.3 1.1 18.1 18.5 0.2 0.1
Capital Goods
ABB* Sell 664 461 14,061 8,073 9,052 5.5 6.9 11.5 16.9 57.6 39.2 5.2 5.0 9.3 13.1 1.7 1.5BGR Energy Neutral 193 - 1,394 4,114 4,886 11.4 10.7 24.9 28.0 7.8 6.9 1.0 0.9 25.2 22.6 0.6 0.6
BHEL Neutral 197 - 48,157 44,054 39,326 16.8 15.1 20.6 16.1 9.6 12.2 2.1 1.9 23.5 16.1 1.0 1.0
Blue Star Buy 168 230 1,507 2,896 3,087 5.6 6.2 9.3 11.7 18.0 14.3 3.0 2.5 17.6 19.2 0.6 0.5
Crompton Greaves Buy 94 117 6,033 13,790 15,095 6.4 7.4 6.9 9.4 13.7 10.1 1.5 1.4 11.7 14.5 0.5 0.4
Jyoti Structures Buy 28 34 230 3,074 3,355 9.0 8.8 8.7 10.2 3.2 2.8 0.3 0.3 10.4 11.1 0.3 0.2
KEC International Buy 43 63 1,100 7,709 8,399 6.7 7.2 6.1 8.5 7.1 5.0 0.9 0.8 20.2 23.0 0.3 0.3
Thermax Neutral 585 - 6,968 5,780 6,430 9.5 9.6 29.8 33.0 19.6 17.7 3.3 2.9 17.9 17.4 1.0 0.9
Cement
ACC Accumulate 1,243 1,361 23,332 11,979 13,254 19.7 21.3 77.1 91.4 16.1 13.6 2.9 2.6 18.7 20.0 1.6 1.4
www.angelbroking.com
Market Outlook
Stock Watch
May 28, 2013

7/30/2019 Market Outlook, 28-05-2013
http://slidepdf.com/reader/full/market-outlook-28-05-2013 14/20
Company Name Reco CMP Target Mkt Cap Sales ( Čcr ) OPM(%) EPS (Č) PER(x) P/BV(x) RoE(%) EV/Sales(x)
( Č ) Price ( Č) ( Č cr ) FY14E FY15E FY14E FY15E FY14E FY15E FY14E FY15E FY14E FY15E FY14E FY15E FY14E FY15E
Cement
Ambuja Cements Neutral 186 - 28,640 10,232 11,762 23.5 24.5 10.3 12.2 18.0 15.3 3.0 2.7 17.2 18.6 2.3 1.9
India Cements Neutral 70 - 2,163 4,777 5,276 17.3 17.1 8.8 10.9 8.0 6.5 0.6 0.6 7.5 8.8 0.8 0.7
J K Lakshmi Cement Buy 102 143 1,204 2,313 2,728 19.8 20.7 16.1 22.1 6.4 4.6 0.8 0.7 13.2 15.8 1.1 0.8
Madras Cements Neutral 249 - 5,933 4,293 4,855 27.4 28.6 21.8 28.2 11.5 8.8 2.1 1.7 19.6 21.3 1.8 1.5
Shree Cement^ Neutral 4,978 - 17,343 6,540 7,452 27.4 26.6 319.7 369.9 15.6 13.5 3.8 3.1 27.5 25.4 2.0 1.5
UltraTech Cement Neutral 2,007 - 55,039 21,947 25,049 23.8 23.8 106.1 119.8 18.9 16.8 3.1 2.7 17.7 17.3 2.5 2.2
Construction Ashoka Buildcon Buy 200 255 1,054 1,928 2,234 21.0 21.5 18.0 22.2 11.2 9.0 1.0 0.9 10.2 10.1 1.9 1.9
Consolidated Co Neutral 11 - 208 2,281 2,492 5.9 6.9 0.7 2.0 16.5 5.6 0.4 0.4 2.3 6.5 0.4 0.3
IRB Infra Buy 125 157 4,145 3,997 4,312 45.5 46.4 15.7 16.6 7.9 7.5 1.2 1.0 15.2 14.5 3.4 3.7
ITNL Buy 173 230 3,355 7,444 8,041 27.4 28.9 29.8 32.1 5.8 5.4 0.8 0.7 14.9 14.2 2.6 2.6
IVRCL Infra Buy 19 35 591 6,287 6,836 8.5 8.5 2.3 3.0 8.2 6.3 0.3 0.3 3.4 4.2 0.5 0.5
Jaiprakash Asso. Buy 69 90 15,312 14,850 15,631 24.9 25.1 2.5 2.9 27.3 24.2 1.1 1.1 4.2 4.7 2.8 2.8
Larsen & Toubro Buy 1,465 1,761 90,243 68,946 78,040 10.5 10.5 77.9 88.3 18.8 16.6 2.8 2.4 15.5 15.6 1.4 1.3
Nagarjuna Const. Buy 32 42 825 6,167 6,945 8.0 8.2 2.7 3.6 12.0 8.8 0.3 0.3 2.7 3.6 0.5 0.5
Punj Lloyd Neutral 47 - 1,556 12,954 14,740 9.9 9.9 0.5 0.9 92.3 50.3 0.5 0.5 0.6 1.1 0.5 0.5
Sadbhav Engg. Buy 109 153 1,646 2,511 2,736 10.6 10.6 7.3 7.8 15.0 14.0 1.9 1.7 13.3 12.7 0.9 0.8
Simplex Infra Buy 106 164 523 6,824 7,563 9.2 9.4 18.0 23.4 5.9 4.5 0.4 0.4 6.9 8.3 0.5 0.4
Unity Infra Buy 32 45 237 2,455 2,734 13.4 13.0 14.6 14.9 2.2 2.2 0.3 0.2 12.3 11.3 0.5 0.5
Financials
Allahabad Bank Buy 124 144 6,200 6,876 7,545 2.6 2.5 28.2 30.9 4.4 4.0 0.6 0.6 12.8 12.7 - -
Andhra Bank Neutral 88 - 4,947 5,254 5,900 2.8 2.8 21.2 22.9 4.2 3.9 0.6 0.5 13.3 13.0 - -
Axis Bank Buy 1,477 1,853 69,186 19,055 22,710 3.3 3.2 130.7 152.3 11.3 9.7 1.8 1.6 17.2 17.6 - -Bank of Baroda Buy 684 851 28,797 16,365 18,781 2.2 2.3 121.3 142.5 5.6 4.8 0.8 0.7 15.1 15.7 - -
Bank of India Buy 299 350 17,794 14,482 16,383 2.3 2.3 58.1 68.1 5.1 4.4 0.8 0.7 14.4 15.0 - -
Bank of Maharashtra A ccumulate 58 64 3,830 4,392 4,743 3.1 3.0 12.6 13.7 4.6 4.2 0.7 0.6 16.8 16.0 - -
Canara Bank Accumulate 430 481 19,029 11,928 13,467 2.1 2.2 74.8 86.0 5.7 5.0 0.8 0.7 13.7 14.2 - -
Central Bank Neutral 67 - 7,020 8,249 9,211 2.4 2.5 14.9 18.2 4.5 3.7 0.7 0.6 12.5 13.8 - -
Corporation Bank Buy 417 495 6,381 5,558 6,121 2.0 2.0 98.4 107.7 4.2 3.9 0.6 0.6 14.9 14.5 - -
Dena Bank Accumulate 89 97 3,100 3,187 3,582 2.3 2.4 23.8 25.5 3.7 3.5 0.6 0.5 15.9 15.1 - -
Federal Bank Neutral 457 - 7,807 2,873 3,413 3.0 3.1 52.7 62.0 8.7 7.4 1.1 1.0 13.4 14.2 - -
www.angelbroking.com
Market Outlook
Stock Watch
May 28, 2013

7/30/2019 Market Outlook, 28-05-2013
http://slidepdf.com/reader/full/market-outlook-28-05-2013 15/20
Company Name Reco CMP Target Mkt Cap Sales ( Čcr ) OPM(%) EPS (Č) PER(x) P/BV(x) RoE(%) EV/Sales(x)
( Č ) Price ( Č) ( Č cr ) FY14E FY15E FY14E FY15E FY14E FY15E FY14E FY15E FY14E FY15E FY14E FY15E FY14E FY15E
Financials
HDFC Neutral 928 - 143,555 8,573 10,142 3.6 3.6 37.0 43.6 25.1 21.3 5.2 4.6 30.0 30.3 - -
HDFC Bank Neutral 715 - 170,264 27,682 33,916 4.6 4.6 35.3 42.7 20.3 16.8 4.0 3.4 21.3 21.8 - -
ICICI Bank Buy 1,219 1,503 140,656 25,705 30,330 3.1 3.2 83.9 96.3 14.5 12.7 1.9 1.8 15.2 15.7 - -
IDBI Bank Accumulate 85 93 11,389 9,477 10,678 2.0 2.1 19.6 22.6 4.4 3.8 0.5 0.5 12.8 13.4 - -
Indian Bank Buy 151 185 6,496 6,185 6,978 3.0 3.0 37.0 42.2 4.1 3.6 0.6 0.5 14.8 15.1 - -
IOB Accumulate 61 66 5,642 8,142 8,956 2.5 2.5 16.5 20.7 3.7 3.0 0.5 0.4 11.8 13.4 - -
J & K Bank Accumulate 1,256 1,315 6,090 3,074 3,140 3.5 3.2 224.7 201.5 5.6 6.2 1.1 1.0 20.6 16.1 - -LIC Housing Finance Accumulate 274 298 13,850 2,113 2,525 2.3 2.3 25.4 29.2 10.8 9.4 1.9 1.7 18.4 18.3 - -
Oriental Bank Accumulate 259 285 7,549 6,835 7,588 2.6 2.6 56.5 63.8 4.6 4.1 0.6 0.6 13.1 13.4 - -
Punjab Natl.Bank Buy 802 994 28,352 20,876 23,929 3.3 3.4 151.7 177.0 5.3 4.5 0.9 0.7 16.1 16.5 - -
South Ind.Bank Neutral 25 - 3,358 1,839 2,091 2.9 2.8 4.2 4.5 6.0 5.6 1.1 0.9 18.2 17.0 - -
St Bk of India Buy 2,162 2,637 147,861 67,243 76,612 3.1 3.0 242.4 284.8 8.9 7.6 1.4 1.2 16.3 16.8 - -
Syndicate Bank Accumulate 132 142 7,925 7,238 8,249 2.7 2.6 27.1 30.4 4.9 4.3 0.7 0.7 16.1 15.9 - -
UCO Bank Neutral 78 - 5,904 6,250 6,738 2.6 2.5 12.1 14.7 6.5 5.4 1.0 0.8 11.8 13.0 - -
Union Bank Accumulate 228 260 1 3,592 11,229 12,794 2.6 2.6 40.7 48.2 5.6 4.7 0.8 0.7 14.6 15.4 - -
United Bank Buy 54 65 2,029 3,443 3,998 2.4 2.6 15.1 20.4 3.6 2.7 0.5 0.4 12.1 14.8 - -
Vijaya Bank Neutral 52 - 2,577 2,730 3,059 1.9 2.0 10.2 11.3 5.1 4.6 0.6 0.6 11.8 12.0 - -
Yes Bank Neutral 518 - 18,620 4,390 5,411 2.8 2.8 41.6 47.9 12.5 10.8 2.6 2.2 23.2 22.1 - -
FMCG
Asian Paints Neutral 4,828 - 46,310 12,332 14,524 16.5 16.3 141.6 162.7 34.1 29.7 10.8 8.6 35.4 32.2 3.6 3.0
Britannia Neutral 666 - 7,964 6,417 7,446 5.1 5.5 20.3 25.2 32.9 26.5 11.2 8.8 37.4 37.3 1.0 0.8
Colgate Neutral 1,491 - 20,274 3,588 4,130 21.1 21.6 44.7 51.9 33.3 28.8 29.6 22.1 98.3 88.0 5.3 4.6
Dabur India Neutral 158 - 27,565 7,183 8,340 16.8 16.8 5.4 6.3 29.4 25.1 11.5 8.9 41.5 40.1 3.8 3.2GlaxoSmith Con* Neutral 5,004 - 21,044 3,617 4,259 16.1 16.4 122.2 148.7 41.0 33.7 12.7 10.2 34.1 33.7 5.2 4.3
Godrej Consumer Neutral 833 - 28,359 7,801 9,017 16.2 15.9 25.1 29.7 33.2 28.1 7.1 5.9 24.9 24.2 3.7 3.2
HUL Neutral 592 - 127,932 29,167 33,164 13.6 13.7 17.1 18.4 34.6 32.2 33.3 24.1 113.4 87.0 4.2 3.7
ITC Neutral 334 - 263,724 34,294 39,991 36.8 37.0 11.3 13.3 29.6 25.0 9.8 7.9 36.1 34.9 7.3 6.2
Marico Neutral 225 - 14,482 5,273 6,044 14.8 14.9 7.3 8.7 31.0 25.9 6.0 5.0 21.4 21.0 2.7 2.3
Nestle* Neutral 5,228 - 50,407 9,447 10,968 22.1 22.3 127.5 154.1 41.0 33.9 20.5 14.8 57.7 50.7 5.4 4.5
Tata Global Neutral 144 - 8,886 7,998 8,798 9.7 9.8 7.9 8.7 18.2 16.5 2.2 2.1 9.5 9.8 1.0 0.9
www.angelbroking.com
Market Outlook
Stock Watch
May 28, 2013

7/30/2019 Market Outlook, 28-05-2013
http://slidepdf.com/reader/full/market-outlook-28-05-2013 16/20
Company Name Reco CMP Target Mkt Cap Sales ( Čcr ) OPM(%) EPS (Č) PER(x) P/BV(x) RoE(%) EV/Sales(x)
( Č ) Price ( Č) ( Č cr ) FY14E FY15E FY14E FY15E FY14E FY15E FY14E FY15E FY14E FY15E FY14E FY15E FY14E FY15E
IT
HCL Tech^ Buy 741 863 51,642 28,633 32,216 21.5 20.7 57.3 61.7 12.9 12.0 3.1 2.6 24.0 21.5 1.6 1.4
Hexaware* Buy 85 96 2,537 2,091 2,289 19.0 18.8 10.6 11.3 8.0 7.5 1.8 1.6 22.8 21.7 1.0 0.9
Infosys Accumulate 2,366 2,465 135,884 43,338 47,244 27.5 27.7 169.4 182.6 14.0 13.0 2.9 2.5 20.8 19.3 2.5 2.1
Infotech Enterprises Accumulate 168 185 1,875 1,956 2,174 17.9 17.7 20.4 21.9 8.2 7.7 1.2 1.1 14.7 13.7 0.6 0.5
KPIT Cummins Buy 108 135 2,084 2,513 2,819 16.1 15.5 12.6 14.0 8.6 7.7 1.5 1.2 17.9 16.6 0.8 0.6
Mahindra Satyam Accumulate 110 126 1 2,904 8,278 9,062 20.3 20.1 10.5 11.4 10.4 9.6 2.4 1.9 23.1 20.0 1.2 0.9
Mindtree Buy 805 920 3,342 2,599 2,871 19.4 19.2 85.2 92.3 9.5 8.7 2.0 1.6 21.4 18.9 1.0 0.8Mphasis& Reduce 440 395 9,246 6,096 6,646 17.6 17.4 38.1 41.6 11.6 10.6 1.6 1.4 14.2 13.7 1.0 0.8
NIIT Buy 23 30 378 1,144 1,267 9.0 9.1 4.3 5.4 5.3 4.3 0.6 0.5 10.3 12.0 0.1 -
Persistent Buy 514 593 2,056 1,445 1,617 25.2 25.0 55.3 59.3 9.3 8.7 1.7 1.4 18.2 16.5 1.0 0.8
TCS Accumulate 1,498 1,585 293,113 71,833 81,893 28.4 28.0 78.5 88.0 19.1 17.0 5.8 4.8 30.2 27.9 3.8 3.3
Tech Mahindra Buy 954 1,170 12,250 7,779 8,398 19.7 19.3 107.4 117.8 8.9 8.1 1.9 1.5 21.2 19.0 1.6 1.4
Wipro Accumulate 340 385 83,772 40,173 43,697 20.4 20.6 26.2 28.5 13.0 11.9 2.6 2.2 19.7 18.4 1.5 1.3
Media
D B Corp Buy 255 290 4,673 1,750 1,925 25.1 26.6 14.2 16.8 17.9 15.2 3.9 3.3 23.4 23.4 2.5 2.2
HT Media Buy 100 117 2,353 2,205 2,380 15.1 15.6 8.3 9.1 12.1 11.0 1.3 1.2 11.5 11.4 0.7 0.6
Jagran Prakashan Buy 89 121 2,962 1,698 1,908 23.9 24.5 7.4 8.4 12.1 10.7 3.1 2.7 26.7 26.8 1.9 1.7
PVR Neutral 328 - 1,298 1,343 1,521 18.8 18.9 18.3 22.9 17.9 14.3 1.7 1.8 10.6 12.3 1.0 0.9
Sun TV Network Neutral 417 - 16,441 2,287 2,551 69.7 70.5 20.0 23.3 20.9 17.9 5.2 4.5 26.4 27.3 6.7 5.9
Metals & Mining
Bhushan Steel Neutral 465 - 10,541 13,794 17,335 30.7 34.8 48.9 83.6 9.5 5.6 1.0 0.9 11.2 16.7 2.4 1.9
Coal India Accumulate 314 345 198,018 72,174 76,311 33.3 28.4 28.4 30.9 11.0 10.2 3.0 2.6 37.6 36.2 1.9 1.7
Electrosteel Castings Buy 17 24 552 1,976 2,017 11.8 12.7 1.3 2.6 13.4 6.5 0.1 0.1 2.6 5.2 0.6 0.2GMDC Buy 136 213 4,326 1,944 2,317 49.9 51.7 20.8 25.6 6.6 5.3 1.5 1.2 24.3 24.6 1.8 1.3
Hind. Zinc Buy 121 145 50,978 12,358 13,659 51.4 51.6 16.0 17.6 7.5 6.9 1.4 1.2 19.4 18.4 1.7 1.2
Hindalco Neutral 111 - 21,156 88,987 94,163 9.2 9.7 13.8 15.9 8.0 7.0 0.6 0.6 7.6 8.1 0.6 0.5
JSW Steel Neutral 720 - 16,053 39,973 40,926 17.2 17.0 71.9 82.8 10.0 8.7 0.9 0.8 9.0 9.6 0.8 0.7
MOIL Buy 203 243 3,411 954 1,062 45.5 47.4 26.1 29.1 7.8 7.0 1.1 1.0 15.1 15.2 1.1 0.8
Monnet Ispat Buy 168 291 1,071 2,883 3,181 21.7 23.6 40.3 57.7 4.2 2.9 0.4 0.3 10.1 13.0 1.2 1.0
Nalco Neutral 35 - 8,904 8,187 8,416 14.5 14.7 3.2 3.3 10.8 10.6 0.7 0.7 6.8 6.7 0.5 0.5
NMDC Buy 118 179 46,803 10,329 12,540 73.8 75.0 16.6 19.0 7.1 6.2 1.4 1.2 20.6 20.2 2.3 1.8
www.angelbroking.com
Market Outlook
Stock Watch
May 28, 2013
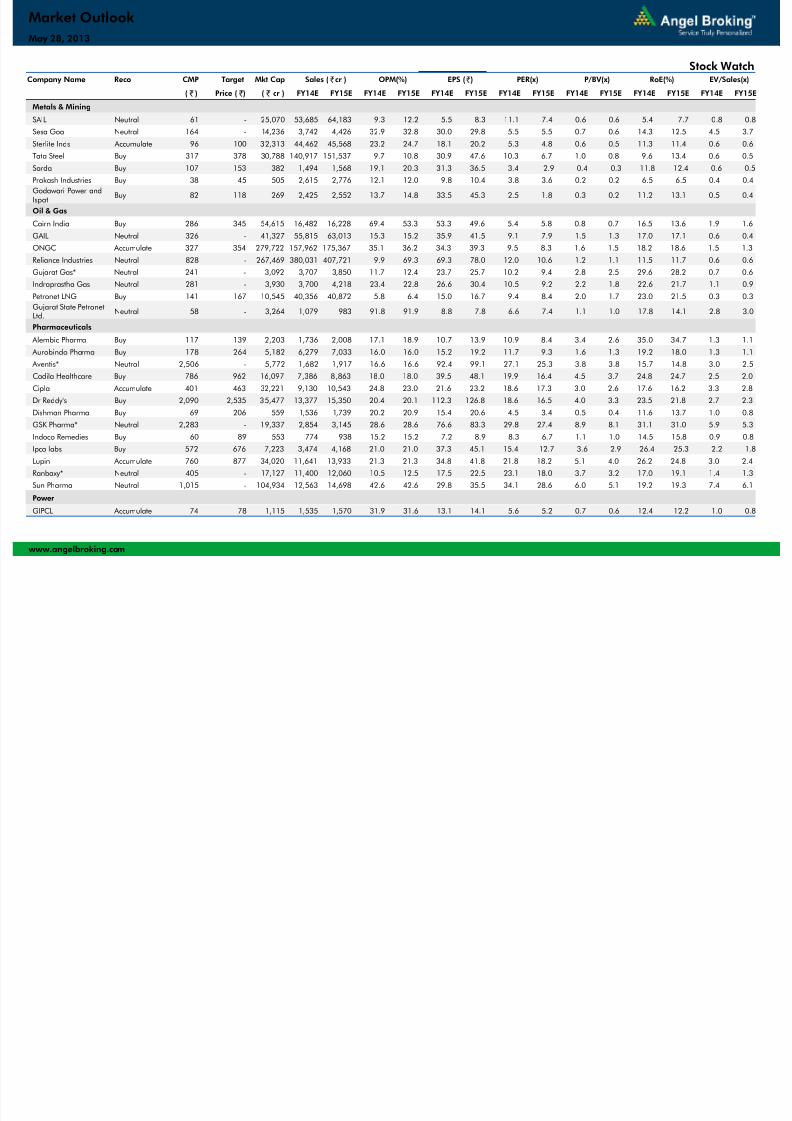
7/30/2019 Market Outlook, 28-05-2013
http://slidepdf.com/reader/full/market-outlook-28-05-2013 17/20
Company Name Reco CMP Target Mkt Cap Sales ( Čcr ) OPM(%) EPS (Č) PER(x) P/BV(x) RoE(%) EV/Sales(x)
( Č ) Price ( Č) ( Č cr ) FY14E FY15E FY14E FY15E FY14E FY15E FY14E FY15E FY14E FY15E FY14E FY15E FY14E FY15E
Metals & Mining
SAIL Neutral 61 - 25,070 53,685 64,183 9.3 12.2 5.5 8.3 11.1 7.4 0.6 0.6 5.4 7.7 0.8 0.8
Sesa Goa Neutral 164 - 14,236 3,742 4,426 32.9 32.8 30.0 29.8 5.5 5.5 0.7 0.6 14.3 12.5 4.5 3.7
Sterlite Inds Accumulate 96 100 32,313 44,462 45,568 23.2 24.7 18.1 20.2 5.3 4.8 0.6 0.5 11.3 11.4 0.6 0.6
Tata Steel Buy 317 378 30,788 140,917 151,537 9.7 10.8 30.9 47.6 10.3 6.7 1.0 0.8 9.6 13.4 0.6 0.5
Sarda Buy 107 153 382 1,494 1,568 19.1 20.3 31.3 36.5 3.4 2.9 0.4 0.3 11.8 12.4 0.6 0.5
Prakash Industries Buy 38 45 505 2,615 2,776 12.1 12.0 9.8 10.4 3.8 3.6 0.2 0.2 6.5 6.5 0.4 0.4
Godawari Power andIspat Buy 82 118 269 2,425 2,552 13.7 14.8 33.5 45.3 2.5 1.8 0.3 0.2 11.2 13.1 0.5 0.4
Oil & Gas
Cairn India Buy 286 345 54,615 16,482 16,228 69.4 53.3 53.3 49.6 5.4 5.8 0.8 0.7 16.5 13.6 1.9 1.6
GAIL Neutral 326 - 41,327 55,815 63,013 15.3 15.2 35.9 41.5 9.1 7.9 1.5 1.3 17.0 17.1 0.6 0.4
ONGC Accumulate 327 354 279,722 157,962 175,367 35.1 36.2 34.3 39.3 9.5 8.3 1.6 1.5 18.2 18.6 1.5 1.3
Reliance Industries Neutral 828 - 267,469 380,031 407,721 9.9 69.3 69.3 78.0 12.0 10.6 1.2 1.1 11.5 11.7 0.6 0.6
Gujarat Gas* Neutral 241 - 3,092 3,707 3,850 11.7 12.4 23.7 25.7 10.2 9.4 2.8 2.5 29.6 28.2 0.7 0.6
Indraprastha Gas Neutral 281 - 3,930 3,700 4,218 23.4 22.8 26.6 30.4 10.5 9.2 2.2 1.8 22.6 21.7 1.1 0.9
Petronet LNG Buy 141 167 10,545 40,356 40,872 5.8 6.4 15.0 16.7 9.4 8.4 2.0 1.7 23.0 21.5 0.3 0.3
Gujarat State PetronetLtd.
Neutral 58 - 3,264 1,079 983 91.8 91.9 8.8 7.8 6.6 7.4 1.1 1.0 17.8 14.1 2.8 3.0
Pharmaceuticals
Alembic Pharma Buy 117 139 2,203 1,736 2,008 17.1 18.9 10.7 13.9 10.9 8.4 3.4 2.6 35.0 34.7 1.3 1.1
Aurobindo Pharma Buy 178 264 5,182 6,279 7,033 16.0 16.0 15.2 19.2 11.7 9.3 1.6 1.3 19.2 18.0 1.3 1.1
Aventis* Neutral 2,506 - 5,772 1,682 1,917 16.6 16.6 92.4 99.1 27.1 25.3 3.8 3.8 15.7 14.8 3.0 2.5
Cadila Healthcare Buy 786 962 16,097 7,386 8,863 18.0 18.0 39.5 48.1 19.9 16.4 4.5 3.7 24.8 24.7 2.5 2.0
Cipla Accumulate 401 463 32,221 9,130 10,543 24.8 23.0 21.6 23.2 18.6 17.3 3.0 2.6 17.6 16.2 3.3 2.8
Dr Reddy's Buy 2,090 2,535 35,477 13,377 15,350 20.4 20.1 112.3 126.8 18.6 16.5 4.0 3.3 23.5 21.8 2.7 2.3
Dishman Pharma Buy 69 206 559 1,536 1,739 20.2 20.9 15.4 20.6 4.5 3.4 0.5 0.4 11.6 13.7 1.0 0.8
GSK Pharma* Neutral 2,283 - 19,337 2,854 3,145 28.6 28.6 76.6 83.3 29.8 27.4 8.9 8.1 31.1 31.0 5.9 5.3
Indoco Remedies Buy 60 89 553 774 938 15.2 15.2 7.2 8.9 8.3 6.7 1.1 1.0 14.5 15.8 0.9 0.8
Ipca labs Buy 572 676 7,223 3,474 4,168 21.0 21.0 37.3 45.1 15.4 12.7 3.6 2.9 26.4 25.3 2.2 1.8
Lupin Accumulate 760 877 34,020 11,641 13,933 21.3 21.3 34.8 41.8 21.8 18.2 5.1 4.0 26.2 24.8 3.0 2.4
Ranbaxy* Neutral 405 - 17,127 11,400 12,060 10.5 12.5 17.5 22.5 23.1 18.0 3.7 3.2 17.0 19.1 1.4 1.3
Sun Pharma Neutral 1,015 - 104,934 12,563 14,698 42.6 42.6 29.8 35.5 34.1 28.6 6.0 5.1 19.2 19.3 7.4 6.1
Power
GIPCL Accumulate 74 78 1,115 1,535 1,570 31.9 31.6 13.1 14.1 5.6 5.2 0.7 0.6 12.4 12.2 1.0 0.8
www.angelbroking.com
Market Outlook
Stock Watch
May 28, 2013

7/30/2019 Market Outlook, 28-05-2013
http://slidepdf.com/reader/full/market-outlook-28-05-2013 18/20
Company Name Reco CMP Target Mkt Cap Sales ( Čcr ) OPM(%) EPS (Č) PER(x) P/BV(x) RoE(%) EV/Sales(x)
( Č ) Price ( Č) ( Č cr ) FY14E FY15E FY14E FY15E FY14E FY15E FY14E FY15E FY14E FY15E FY14E FY15E FY14E FY15E
Power
NTPC Accumulate 153 163 125,743 76,734 86,680 24.5 24.3 13.4 14.5 11.4 10.5 1.4 1.3 12.8 12.7 2.3 2.2
Real Estate
DLF Buy 215 288 38,344 9,699 12,010 37.0 36.9 6.0 8.4 36.1 25.6 1.4 1.3 3.8 5.1 5.3 4.3
MLIFE Buy 394 476 1,609 888 1,002 30.6 30.6 38.8 43.4 10.1 9.1 1.1 1.0 11.2 11.4 2.4 2.1
Telecom
Bharti Airtel Accumulate 309 338 117,401 86,592 95,860 31.4 31.8 10.9 14.5 28.4 21.3 2.2 2.0 7.7 9.3 2.0 1.6
Idea Cellular Neutral 135 - 44,640 25,122 27,663 27.0 27.2 4.0 4.8 33.9 28.3 2.8 2.6 8.3 9.1 2.1 1.9Rcom Neutral 114 - 23,540 22,801 24,628 31.0 31.3 3.6 5.3 32.0 21.7 0.7 0.7 2.2 3.1 2.6 2.2
Others
Abbott India* Accumulate 1,437 1,659 3,054 1,863 2,081 11.8 12.4 71.2 83.0 20.2 17.3 4.1 3.5 21.6 21.5 1.4 1.1
Bajaj Electricals Buy 168 237 1,678 3,929 4,480 7.4 7.7 15.5 19.7 10.9 8.5 1.9 1.6 17.4 18.7 0.4 0.4
Cera Sanitaryware Buy 457 562 578 630 795 14.4 13.6 42.8 51.1 10.7 8.9 2.5 2.0 26.6 25.2 0.9 0.7
Cravatex Buy 370 566 96 308 351 7.0 7.0 39.6 47.2 9.3 7.8 2.0 1.6 21.8 21.0 0.4 0.3
Finolex Cables Buy 54 68 825 2,563 2,899 9.8 9.8 10.1 11.3 5.4 4.8 0.8 0.7 14.3 13.8 0.2 0.2
Force Motors Buy 349 437 455 2,304 2,649 3.1 3.6 28.0 43.7 12.5 8.0 0.4 0.4 3.1 4.7 0.1 0.1
Goodyear India* Buy 266 345 614 1,458 1,542 8.3 9.0 32.3 37.0 8.3 7.2 1.5 1.3 19.5 19.3 0.2 0.2
Hitachi Buy 146 177 398 1,053 1,169 6.3 7.1 13.8 17.7 10.6 8.3 1.5 1.3 15.0 16.7 0.4 0.4
Honeywell Automation* Neutral 2,438 - 2,155 1,842 2,131 7.7 7.8 112.4 132.4 21.7 18.4 2.7 2.4 13.3 13.8 1.1 0.9
IFB Agro Buy 169 198 152 495 651 12.7 12.9 29.3 39.5 5.8 4.3 0.8 0.7 15.4 17.6 0.4 0.3
ITD Cementation Buy 182 234 210 1,430 1,573 11.1 11.0 19.1 26.9 9.6 6.8 0.5 0.5 4.9 6.3 0.6 0.5
Jyothy Laboratories Accumulate 180 199 2,900 1,220 1,476 13.3 13.6 5.5 9.0 32.6 19.9 3.8 3.3 12.1 17.7 2.7 2.1
MRF Reduce 15,400 14,416 6,531 11,799 12,587 14.1 13.5 1,792.4 1,802.0 8.6 8.6 1.8 1.5 23.5 19.2 0.6 0.6
Page Industries Reduce 3,872 3,637 4,318 1,047 1,281 19.6 19.8 127.3 158.1 30.4 24.5 14.5 10.6 54.9 50.0 4.2 3.5Relaxo Footwears Buy 641 791 769 1,146 1,333 10.9 11.4 45.9 60.9 14.0 10.5 2.9 2.3 23.0 24.6 0.8 0.7
Siyaram Silk Mills Buy 262 331 246 1,157 1,320 11.9 11.8 72.2 82.8 3.6 3.2 0.7 0.6 19.7 19.0 0.4 0.4
Styrolution ABS India* Buy 436 617 766 1,068 1,223 9.6 9.6 38.1 44.1 11.5 9.9 1.6 1.4 14.5 14.7 0.7 0.6
TAJ GVK Buy 64 108 403 300 319 35.8 36.2 7.9 9.1 8.1 7.1 1.1 1.0 13.9 14.4 1.8 1.5
Tata Sponge Iron Buy 296 371 456 814 849 17.0 17.6 64.6 69.2 4.6 4.3 0.6 0.6 14.5 13.8 0.2 -
TTK Healthcare Accumulate 561 686 435 435 516 6.2 7.1 24.3 33.3 23.1 16.8 3.8 3.3 17.6 20.8 1.0 0.8
Tree House Accumulate 264 275 949 150 192 52.7 52.5 12.8 16.2 20.6 16.3 2.1 1.8 10.0 11.1 5.8 4.4
TVS Srichakra Buy 189 252 145 1,591 1,739 6.1 6.6 24.5 41.9 7.7 4.5 0.8 0.7 10.9 17.2 0.3 0.3
United Spirits Neutral 2,514 - 32,876 12,294 14,162 12.0 12.0 42.1 67.7 59.7 37.1 4.2 3.8 9.1 10.7 3.1 2.6
www.angelbroking.com
Market Outlook
Stock Watch
May 28, 2013

7/30/2019 Market Outlook, 28-05-2013
http://slidepdf.com/reader/full/market-outlook-28-05-2013 19/20
Company Name Reco CMP Target Mkt Cap Sales ( Čcr ) OPM(%) EPS (Č) PER(x) P/BV(x) RoE(%) EV/Sales(x)
( Č ) Price ( Č) ( Č cr ) FY14E FY15E FY14E FY15E FY14E FY15E FY14E FY15E FY14E FY15E FY14E FY15E FY14E FY15E
Others
Vesuvius India* Buy 369 439 750 600 638 20.1 19.4 35.7 36.6 10.4 10.1 1.9 1.6 19.4 17.1 1.0 0.9
Source: Company, Angel Research; Note: *December year end; #September year end; &October year end; Price as on May 27, 2013
www.angelbroking.com
Market Outlook
Stock Watch
May 28, 2013

7/30/2019 Market Outlook, 28-05-2013
http://slidepdf.com/reader/full/market-outlook-28-05-2013 20/20
Market Outlook May 28, 2013