market auto trader manual
TRANSCRIPT

8/4/2019 Market Auto Trader Manual
http://slidepdf.com/reader/full/market-auto-trader-manual 1/30
www.markets.com Page 1
User guide
Version 1.1

8/4/2019 Market Auto Trader Manual
http://slidepdf.com/reader/full/market-auto-trader-manual 2/30
www.markets.com Page 2
Table of Contents
1 STRATEGIES- SMART FILTER ............................................................................................................. 3
2 STRATEGIES- CUSTOM FILTER .......................................................................................................... 7
3 STRATEGIES- WATCH LIST .............................................................................................................. 12
4 PORTFOLIO ................................................................................................................................... 16
5 RATES ........................................................................................................................................... 18
6 ACCOUNT ACTIVITIES..................................................................................................................... 21
7 POSITIONS- OPEN POSITIONS ........................................................................................................ 23
8 POSITIONS- ORDERS ...................................................................................................................... 26
9 POSITIONS- CLOSED POSITIONS ..................................................................................................... 27

8/4/2019 Market Auto Trader Manual
http://slidepdf.com/reader/full/market-auto-trader-manual 3/30
www.markets.com Page 3
1 STRATEGIES- SMART FILTER
The “Smart Filter” will help you find appropriate strategies based on your start balance and trade size. This
filter calculates the performance data of all strategies during the selected time frame, and shows only those
strategies that fit your criteria.
Each strategy’s performance is presented in a table and on a graph. In order to see a strategy’s curve on a
graph, simply click on the “Curve” icon.
You can add a strategy to your “Portfolio” by clicking on the “Plus” icon. You can also add strategies to your
“Watch List” and monitor their performance by clicking on the “Star” icon.

8/4/2019 Market Auto Trader Manual
http://slidepdf.com/reader/full/market-auto-trader-manual 4/30
www.markets.com Page 4
Terms and Definitions
Filter Criteria
Start Balance The amount of money you intend to use for trading.
There are suitable strategies for each combination of “Start Balance”
and “Trade Size.” You may increase or decrease the value or enter any
amount manually.
Trade Size (k): The size you intend to use for trading (e.g. 100k=
100,000 currency units=1 lot; 10k= 10,000 currency units=1 mini lot).
Time Frame: The period of time that you refer to or judge past results
against (time refers to calendar days).
Table Columns
“Curve” Icon: A Strategy's P/L Curve (Profits and Losses Curve) displays a graph plot of total
trading performance for the selected time frame. You can place up to 5 strategies on the graph.
To remove a strategy curve from the graph, click on the left hand icon associated with the
strategy. To add a strategy curve to graph, simply click on the “Curve” icon.
“Star” Icon: Click on this icon to add strategies to your “Watch List” for future reference.
Strategy: Generic strategy name.
Symbol: Traded currency pair.
T-score Rating System: A unique Tradency scoring method, operating on a scale of 1 to 10, which
indicates strategies’ relevance to current market conditions (momentum) and takes into
consideration strategies’ risk and reward. A Strategy’s T-score appears as ‘N/A’ when it has not
yet reached 50 trades—that is, when Tradency does not yet have enough information to rate it.
Total trades: The total number of trades opened and closed during the selected time frame.
ROI % (Return on Investment): Calculated by dividing your strategy’s Profit/Loss in pips by the
“Start Balance”” you entered into the Smart Filter, during the selected time frame.
MDD%: Maximum “Draw Down” in percentage terms, calculated using your "Start Balance,"
“Trade Size” and “Time Frame.” The strategies shown here have not had losses greater than your
acceptable trading criteria.
8/4/2019 Market Auto Trader Manual
http://slidepdf.com/reader/full/market-auto-trader-manual 5/30
www.markets.com Page 5
MP (Max Positions): The number of open positions that a strategy may trade simultaneously for
a currency pair. The MP is determined by the strategy. For example, an MP of 4 means that the
strategy may trade 4 positions at the same time. Hence, if your trade size is 10k you might
actually have 4 positions trading 10K each, for a total of 40k.
Pips: Net pips earned or lost by the strategy during the selected time frame.
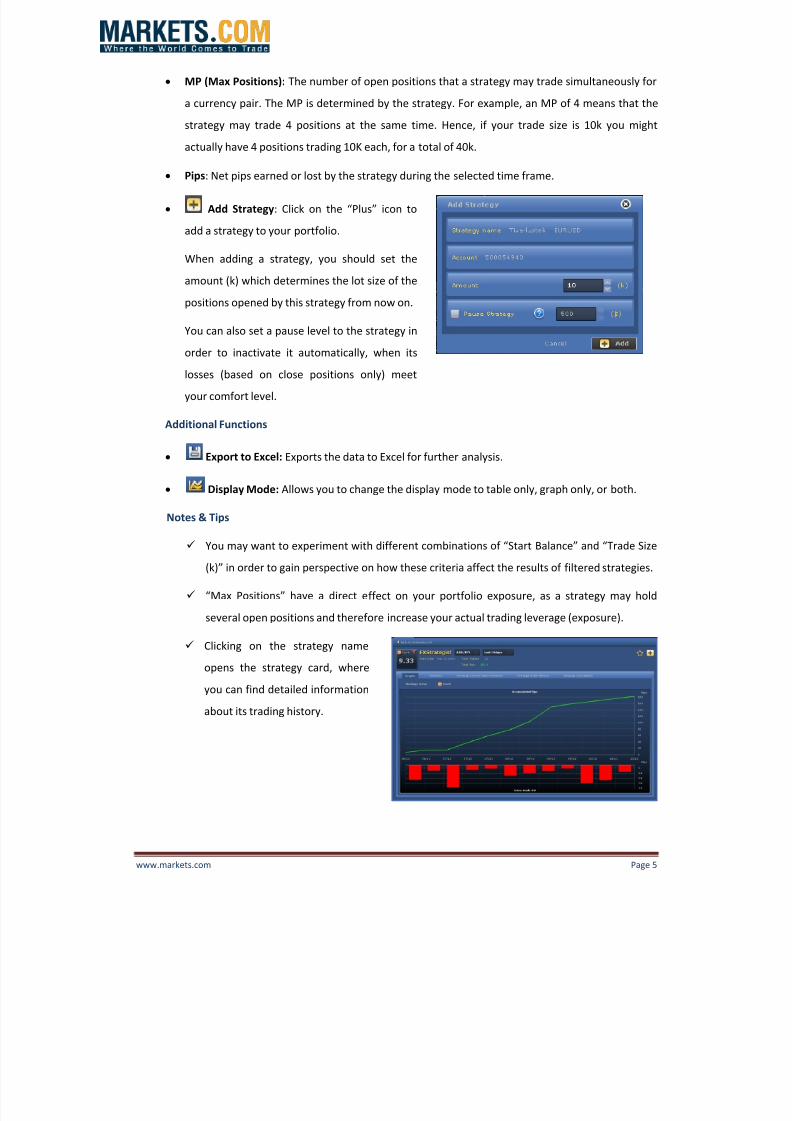
Add Strategy: Click on the “Plus” icon to
add a strategy to your portfolio.
When adding a strategy, you should set the
amount (k) which determines the lot size of the
positions opened by this strategy from now on.
You can also set a pause level to the strategy in
order to inactivate it automatically, when its
losses (based on close positions only) meet
your comfort level.
Additional Functions
Export to Excel: Exports the data to Excel for further analysis.
Display Mode: Allows you to change the display mode to table only, graph only, or both.
Notes & Tips
You may want to experiment with dif ferent combinations of “Start Balance” and “Trade Size
(k)” in order to gain perspective on how these criteria affect the results of filtered strategies.
“Max Positions” have a direct effect on your portfolio exposure, as a strategy may hold
several open positions and therefore increase your actual trading leverage (exposure).
Clicking on the strategy name
opens the strategy card, where
you can find detailed information
about its trading history.

8/4/2019 Market Auto Trader Manual
http://slidepdf.com/reader/full/market-auto-trader-manual 6/30
www.markets.com Page 6
You can view a combination of up to 5 strategies in the “Graph” display. Use this feature in
order to find the best strategies and/or combinations for your portfolio.
As soon as a strategy is added to your portfolio, its new trades will be automatically placed in
your account. It might take some time for a strategy to open a trade after being added to
your portfolio.
Positions opened by the strategies will be closed by the strategy as well. However you can
close each position manually from the “open positions” section.
When the strategy reaches the ‘Pause’ level you provided, it is automatically inactivated. The
strategy will stay in the portfolio, but new positions opened by it will not be executed in the
account. Other open positions remain open until a closing signal is sent by the strategy or
yourself.
The ‘Pause’ level is an approximate value, since it only takes into account the closed positions
of the strategy, while open positions remain open. When the strategy closes the open
positions, they will not necessarily meet the exact value set as the ‘Pause’ level.
Use “Custom Filter” to view all available strategies’ trading results and statistics.
8/4/2019 Market Auto Trader Manual
http://slidepdf.com/reader/full/market-auto-trader-manual 7/30
www.markets.com Page 7
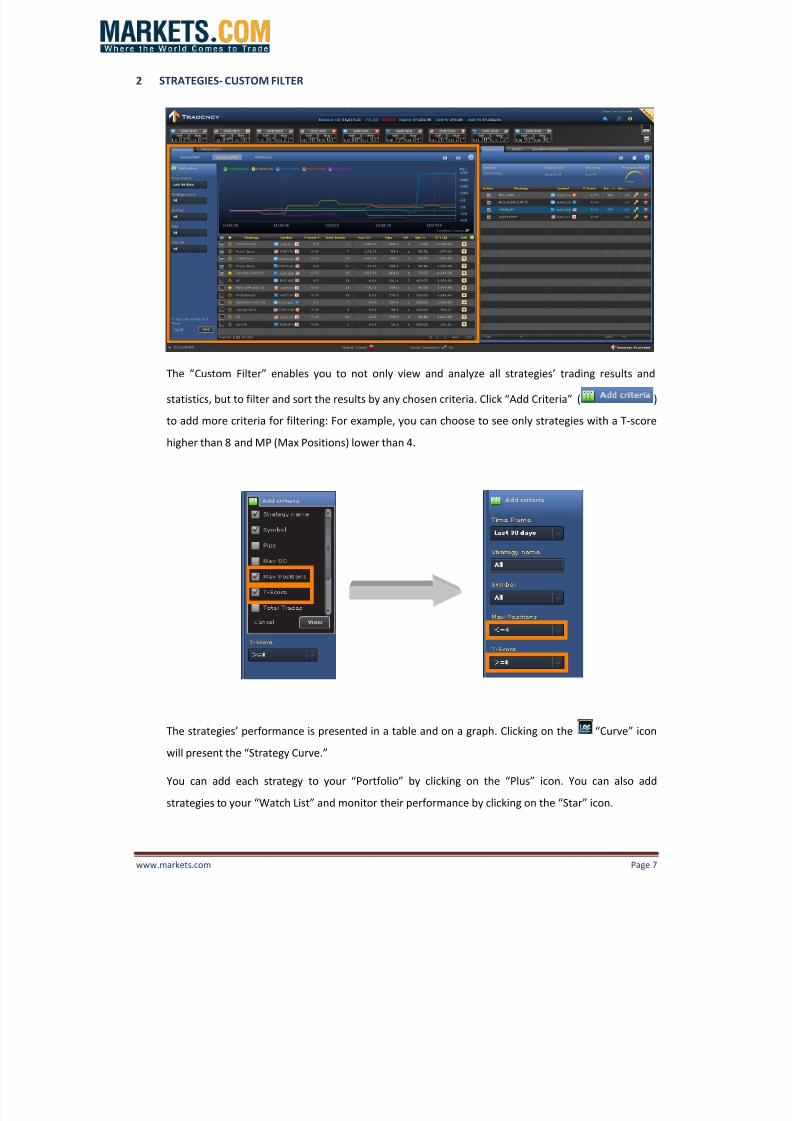
2 STRATEGIES- CUSTOM FILTER
The “Custom Filter” enables you to not only view and analyze all strategies’ trading results and
statistics, but to filter and sort the results by any chosen criteria. Click “Add Criteria” ( )
to add more criteria for filtering: For example, you can choose to see only strategies with a T-score
higher than 8 and MP (Max Positions) lower than 4.
The strategies’ performance is presented in a table and on a graph. Clicking on the “Curve” icon
will present the “Strategy Curve.”
You can add each strategy to your “Portfolio” by clicking on the “Plus” icon. You can also add
strategies to your “Watch List” and monitor their performance by clicking on the “Star” icon.
8/4/2019 Market Auto Trader Manual
http://slidepdf.com/reader/full/market-auto-trader-manual 8/30
www.markets.com Page 8
Terms and Definitions
“Curve” Icon: A strategy's P/L Curve (Profits and Losses) displays a graph plot of total trading
performance for the selected time frame. You can place up to 5 strategies on the graph. To
remove a strategy curve from the graph, click on the left hand icon associated with the strategy.To add a strategy curve to graph, simply click on the “Curve” icon.
“Star” Icon: Click on this icon to add or remove strategies from your “Watch List.”
Strategy Name: Generic name for a strategy.
Symbol: Traded currency pair.
T-score Rating System: A unique Tradency scoring method, operating on a scale of 1 to 10, which
indicates strategies’ relevance to current market conditions (momentum) and takes into
consideration strategies’ risk and reward. A Strategy’s T-score appears as ‘N/A’ when it has not
yet reached 50 trades—that is, when Tradency does not yet have enough information to rate it.
MP (Max Positions): The number of open positions that a strategy may trade simultaneously for
a currency pair. The MP is determined by the strategy. For example, an MP of 4 means that the
strategy may trade 4 positions at the same time. Hence, if your trade size is 10k you might
actually have 4 positions trading 10K each, for a total of 40k.
Pips: Net pips earned or lost by the strategy during the selected time frame.
P/L: Profit or Loss ($) generated by a strategy during the selected time frame. The P/L uses a
100K trade size and includes rollover.
Total trades: The total number of trades opened and closed during the selected time frame.
Max DD (Maximum Draw Down): The worst losing sequence of the strategy in pips (the largest
drop from net balance peak to net balance valley).
Profit Factor: The ratio of the net profit versus the net loss (in account currency terms). This ratio
shows by how much the profit exceeded the loss. For example, a value greater than 1 means the
strategy has generated more profits than losses.
RAR (Risk Adjustment Ratio): The direct measure of return in pips divided by the maximum
drawdown in pips. A value greater than 1 means that the strategy has generated profits in excess
of the largest drawdown loss. For example, an RAR of 3 means that the strategy's returns are 3
times greater than its maximum drawdown.

8/4/2019 Market Auto Trader Manual
http://slidepdf.com/reader/full/market-auto-trader-manual 9/30
www.markets.com Page 9
Win %: The percentage of wining trades out of the total amount of recorded trades. This
percentage does not necessarily reflect a strategy’s profitability; instead, it simply shows how
many times the strategy was correct.
ATT (Average Trade Time): The average holding period, in hours, of each trade.
LPT (Largest Profit Trade): The trade that resulted in the largest profit (in pips).
APT (Average Profit Trade): A calculation of the gross profit (in pips) divided by the number of
profitable trades.
LLT (Largest Losing Trade): The trade that resulted in the largest loss (in pips).
ALT (Average Losing Trade): A calculation of the gross loss (in pips) divided by the number of
losing trades.
Start Date: The day the strategy began trading with a specific currency pair.
“Add/Remove Columns” Icon: Click on
this icon to add or remove columns (your
trading criteria) from the results table.
Add Strategy: Click on the “Plus” icon
to add a strategy to your portfolio.
When adding a strategy, you should set the
amount (k) which determines the lot size of the positions opened by this strategy from
now on.
You can also set a pause level to the
strategy in order to inactivate it
automatically, when its losses (based on
close positions only) meet your comfort
level.
8/4/2019 Market Auto Trader Manual
http://slidepdf.com/reader/full/market-auto-trader-manual 10/30
www.markets.com Page 10
Additional Functions
Export to Excel: Exports the data to Excel for further analysis.
Display Mode: Allows you to change the display mode to table only, graph only, or both.
Notes & Tips
Use the “Add Criteria” to choose the ranges of performance results, according to your
trading preferences.
“Max Positions” have a direct effect on your portfolio exposure, as a strategy may open
several positions and therefore increase your actual trading leverage (exposure).
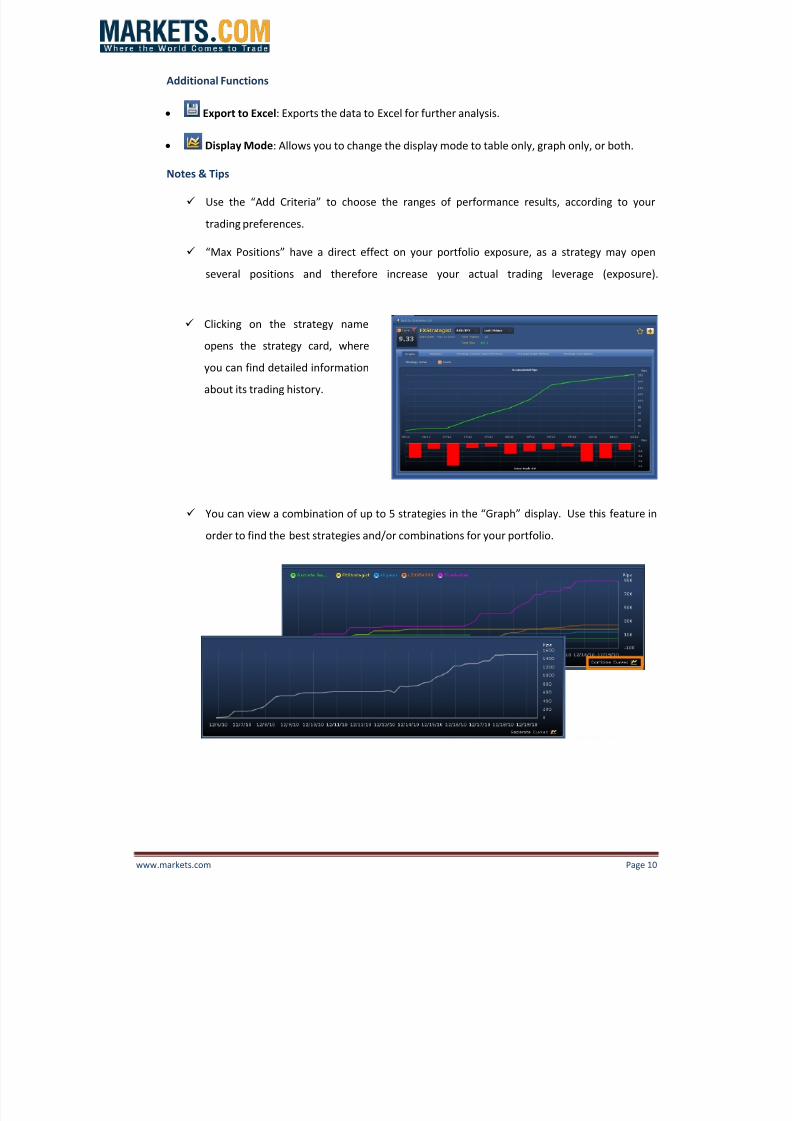
Clicking on the strategy name
opens the strategy card, where
you can find detailed information
about its trading history.
You can view a combination of up to 5 strategies in the “Graph” display. Use this feature in
order to find the best strategies and/or combinations for your portfolio.
8/4/2019 Market Auto Trader Manual
http://slidepdf.com/reader/full/market-auto-trader-manual 11/30
www.markets.com Page 11
As soon as a strategy is added to your portfolio, its new trades will be automatically placed in
your account. It might take some time for a strategy to open a trade after being added to
your portfolio.
Positions opened by the strategies will be closed by the strategy as well. However you can
close each position manually from the “open positions” section.
When the strategy reaches the ‘Pause’ level you provided, it is automatically inactivated. The
strategy will stay in the portfolio, but new positions opened by it will not be executed in the
account. Other open positions remain open until a closing signal is sent by the strategy or
yourself.
The ‘Pause’ level is an approximate value, since it only takes into account the closed positions
of the strategy, while open positions remain open. When the strategy closes the open
positions, they will not necessarily meet the exact value set as the ‘Pause’ level.
You can add strategies to your “Watch List,” in order to follow up on their performance, by
clicking on the “Star” icon.

8/4/2019 Market Auto Trader Manual
http://slidepdf.com/reader/full/market-auto-trader-manual 12/30
www.markets.com Page 12
3 STRATEGIES- WATCH LIST
The “Watch List” provides you with quick access to selected strategies of interest. Use the “Watch
List” to follow up on strategies’ performance before actually adding them to your portfolio. The
strategies’ performance is presented in a table and on a graph. To see the strategy curve, simply click
on the “Curve” icon.
You can customize your table view with
your preferred criteria by clicking on the
“Add/Remove Columns” icon. Click on the
“Plus” icon to add a strategy to your
portfolio.
Terms and Definitions
“Curve” Icon: A strategy's P/L Curve (Profits and Losses) displays a graph plot of total trading
performance for the selected time frame. You can place up to 5 strategies on the graph. To
remove a strategy curve from the graph, click on the left hand icon associated with the strategy.
To add a strategy curve to graph, simply click on the “Curve” icon.
“Star” Icon: Click on this icon to add or remove strategies from your “Watch List.”
Strategy Name: Generic name for a strategy.
Symbol: Traded currency pair.
8/4/2019 Market Auto Trader Manual
http://slidepdf.com/reader/full/market-auto-trader-manual 13/30
www.markets.com Page 13
T-score Rating System: A unique Tradency scoring method, operating on a scale of 1 to 10, which
indicates strategies’ relevance to current market conditions (momentum) and takes into
consideration strategies’ risk and reward. A Strategy’s T-score appears as ‘N/A’ when it has not
yet reached 50 trades—that is, when Tradency does not yet have enough information to rate it.
MP (Max Positions): The number of open positions that a strategy may trade simultaneously for
a currency pair. The MP is determined by the strategy. For example, an MP of 4 means that the
strategy may trade 4 positions at the same time. Hence, if your trade size is 10k you might
actually have 4 positions trading 10K each, for a total of 40k.
Pips: Net pips earned or lost by the strategy during the selected time frame.
P/L: Profit or Loss ($) generated by a strategy during the selected time frame. The P/L uses a
100K trade size and includes rollover.
Total trades: The total number of trades opened and closed during the selected time frame.
Max DD (Maximum Draw Down): The worst losing sequence of the strategy in pips (the largest
drop from net balance peak to net balance valley).
Profit Factor: The ratio of the net profit versus the net loss (in account currency terms). This ratio
shows by how much the profit exceeded the loss. For example, a value greater than 1 means the
strategy has generated more profits than losses.
RAR (Risk Adjustment Ratio): The direct measure of return in pips divided by the maximum
drawdown in pips. A value greater than 1 means that the strategy has generated profits in excess
of the largest drawdown loss. For example, an RAR of 3 means that the strategy's returns are 3
times greater than its maximum drawdown.
Win %: The percentage of wining trades out of the total amount of recorded trades. This
percentage does not necessarily reflect a strategy’s profitability; instead, it simply shows how
many times the strategy was correct.
ATT (Average Trade Time): The average holding period, in hours, of each trade.
LPT (Largest Profit Trade): The trade that resulted in the largest profit (in pips).
APT (Average Profit Trade): A calculation of the gross profit (in pips) divided by the number of
profitable trades.
LLT (Largest Losing Trade): The trade that resulted in the largest loss (in pips).
ALT (Average Losing Trade): A calculation of the gross loss (in pips) divided by the number of
losing trades.

8/4/2019 Market Auto Trader Manual
http://slidepdf.com/reader/full/market-auto-trader-manual 14/30
www.markets.com Page 14
Start Date: The day the strategy began trading with a specific currency pair.
“Add/Remove Columns” Icon: Click on this icon to add or remove columns (your trading
criteria) from the results table.
Add Strategy: Click on the “Plus” icon to
add a strategy to your portfolio.
When adding a strategy, you should set the
amount (k) which determines the lot size of the
positions opened by this strategy from now on.
You can also set a pause level to the strategy in
order to inactivate it automatically, when its
losses (based on close positions only) meet your
comfort level.
Additional Functions
Export to Excel: Exports the data to Excel for further analysis.
Display Mode: Allows you to change the display mode to table only, graph only, or both.
Notes & Tips
Use the “Watch List” to follow up on strategies’ performance before actually adding them to
your portfolio.
Try different combinations of strategies to see how they work together as a portfolio.
Clicking on the strategy name
opens the strategy card, where
you can find detailed information
about its trading history.
8/4/2019 Market Auto Trader Manual
http://slidepdf.com/reader/full/market-auto-trader-manual 15/30
www.markets.com Page 15
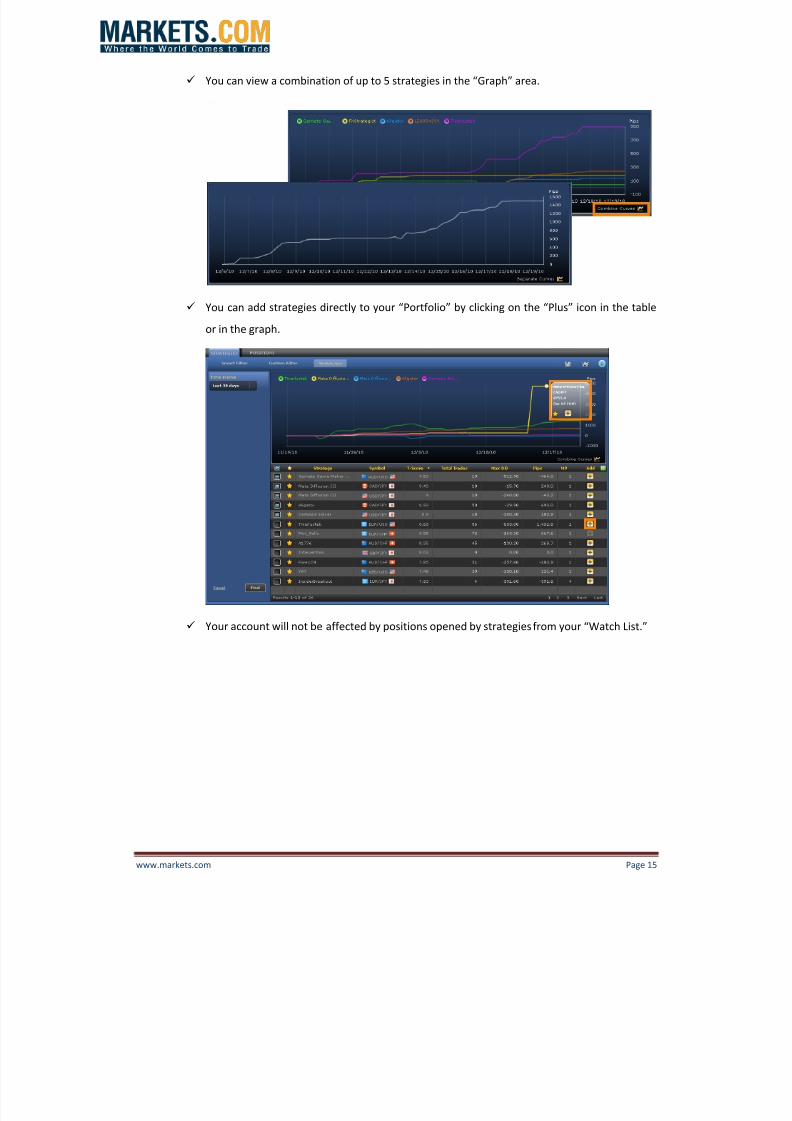
You can view a combination of up to 5 strategies in the “Graph” area.
You can add strategies directly to your “Portfolio” by clicking on the “Plus” icon in the table
or in the graph.
Your account will not be affected by positions opened by strategies from your “Watch List.”

8/4/2019 Market Auto Trader Manual
http://slidepdf.com/reader/full/market-auto-trader-manual 16/30
www.markets.com Page 16
4 PORTFOLIO
Your Trading Portfolio consists of all the strategies you have chosen to trade in your account. The
strategy providers open and close positions according to their rules and understanding of the market.
When a strategy is added to your portfolio, every trade sent by it opens in your account.
When adding a strategy, you should set the amount (k) which determines the lot size of the positions
opened by this strategy from now on. You can also set a pause level to the strategy in order to
inactivate it automatically, when its losses (based on close positions only) meet your comfort level.
Moreover, you can control the activation of a strategy by checking/un-checking the box next to the
strategy name.
After you added the strategy, you can edit the trade size and pause level, by clicking on the
modify icon.
When adding a strategy, you should set the amount
(k) which determines the lot size of the positions
opened by this strategy from now on. You can also
set a pause level to the strategy in order to
inactivate it automatically, when its losses (based
on close positions only) meet your comfort level.

8/4/2019 Market Auto Trader Manual
http://slidepdf.com/reader/full/market-auto-trader-manual 17/30
www.markets.com Page 17
Terms and Definitions
Exposure: Indicates your portfolio’s leverage, should all the strategies open all of their max
positions simultaneously. Your “Portfolio’s Exposure” is calculated as follows:
[Sum (Amount (k)*Max Pos)]/(Account Balance).
Exposure Meter: A visual presentation of your portfolio’s exposure (a risk gauge). The closer the
needle is to the red zone, the riskier your portfolio is.
“Active” Checkbox: Click on this checkbox to inactivate or activate a strategy without removing it
from your portfolio. When Strategy is inactive, new positions will not be opened by it. Open
positions will remain open until it is closed manually or by the strategy.
Strategy Name: Generic strategy name.
Symbol: Traded currency pair.
T-score Rating System: A unique Tradency scoring method, operating on a scale of 1 to 10, which
indicates strategies’ relevance to current market conditions (momentum) and takes into
consideration strategies’ risk and reward. A Strategy’s T-score appears as ‘N/A’ when it has not
yet reached 50 trades—that is, when Tradency does not yet have enough information to rate it.
Pause: The level you set to automatically inactivate the strategy.
Amount (k): A trade’s size in multiples of 1,000 currency units (e.g. 100k= 100,000 currency
units=1 lot; 10k= 10,000 currency units=1 mini lot).
“Modify” Icon: Allows you to modify your strategy’s money management setting and pause
level. Pay attention to your portfolio “Exposure.”
“Remove” icon: Allows you to remove a strategy from your portfolio.
8/4/2019 Market Auto Trader Manual
http://slidepdf.com/reader/full/market-auto-trader-manual 18/30
www.markets.com Page 18
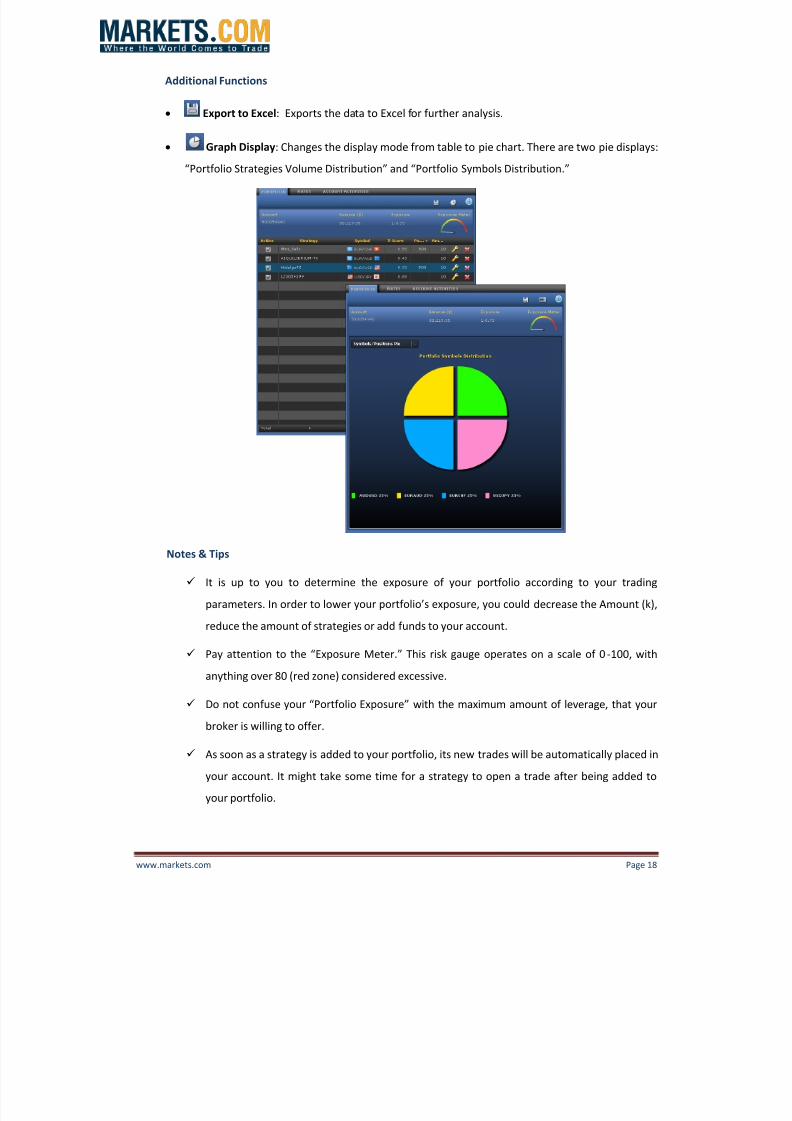
Additional Functions
Export to Excel: Exports the data to Excel for further analysis.
Graph Display: Changes the display mode from table to pie chart. There are two pie displays:
“Portfolio Strategies Volume Distribution” and “Portfolio Symbols Distribution.”
Notes & Tips
It is up to you to determine the exposure of your portfolio according to your trading
parameters. In order to lower your portfolio’s exposure, you could decrease the Amount (k),
reduce the amount of strategies or add funds to your account.
Pay attention to the “Exposure Meter.” This risk gauge operates on a scale of 0-100, with
anything over 80 (red zone) considered excessive.
Do not confuse your “Portfolio Exposure” with the maximum amount of leverage, that your
broker is willing to offer.
As soon as a strategy is added to your portfolio, its new trades will be automatically placed in
your account. It might take some time for a strategy to open a trade after being added to
your portfolio.
8/4/2019 Market Auto Trader Manual
http://slidepdf.com/reader/full/market-auto-trader-manual 19/30
www.markets.com Page 19
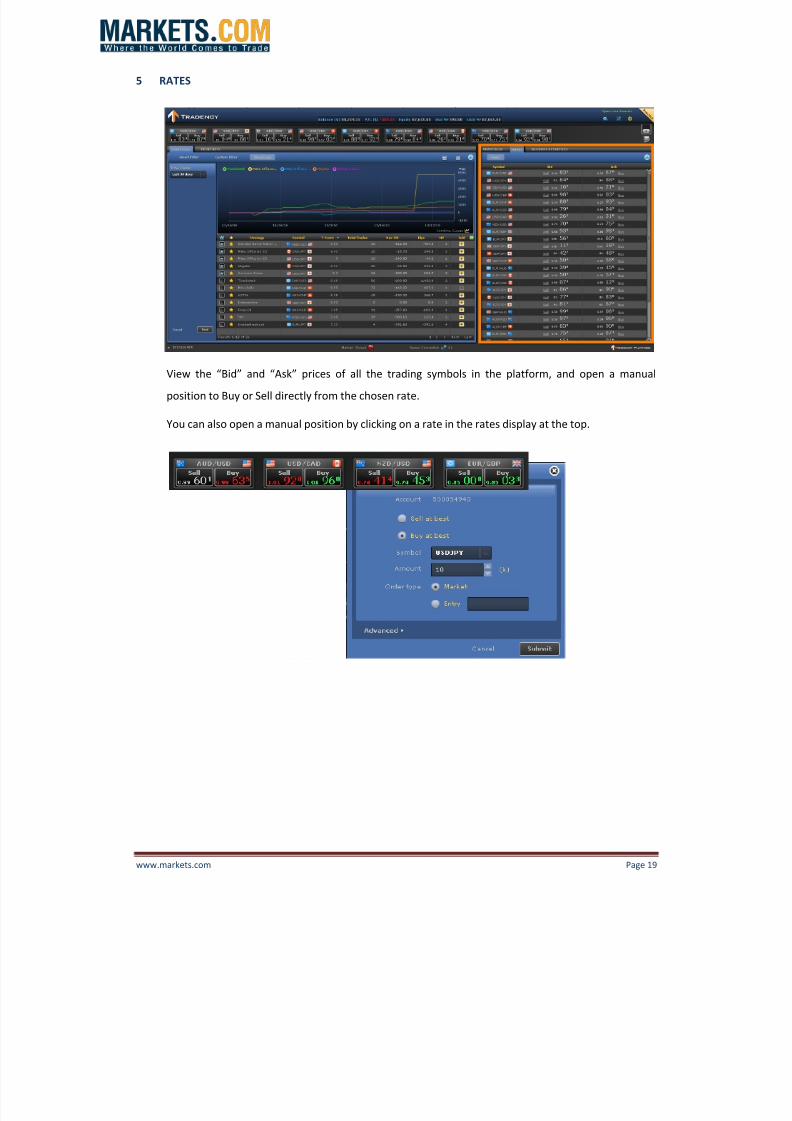
5 RATES
View the “Bid” and “Ask” prices of all the trading symbols in the platform, and open a manual
position to Buy or Sell directly from the chosen rate.
You can also open a manual position by clicking on a rate in the rates display at the top.
8/4/2019 Market Auto Trader Manual
http://slidepdf.com/reader/full/market-auto-trader-manual 20/30
www.markets.com Page 20
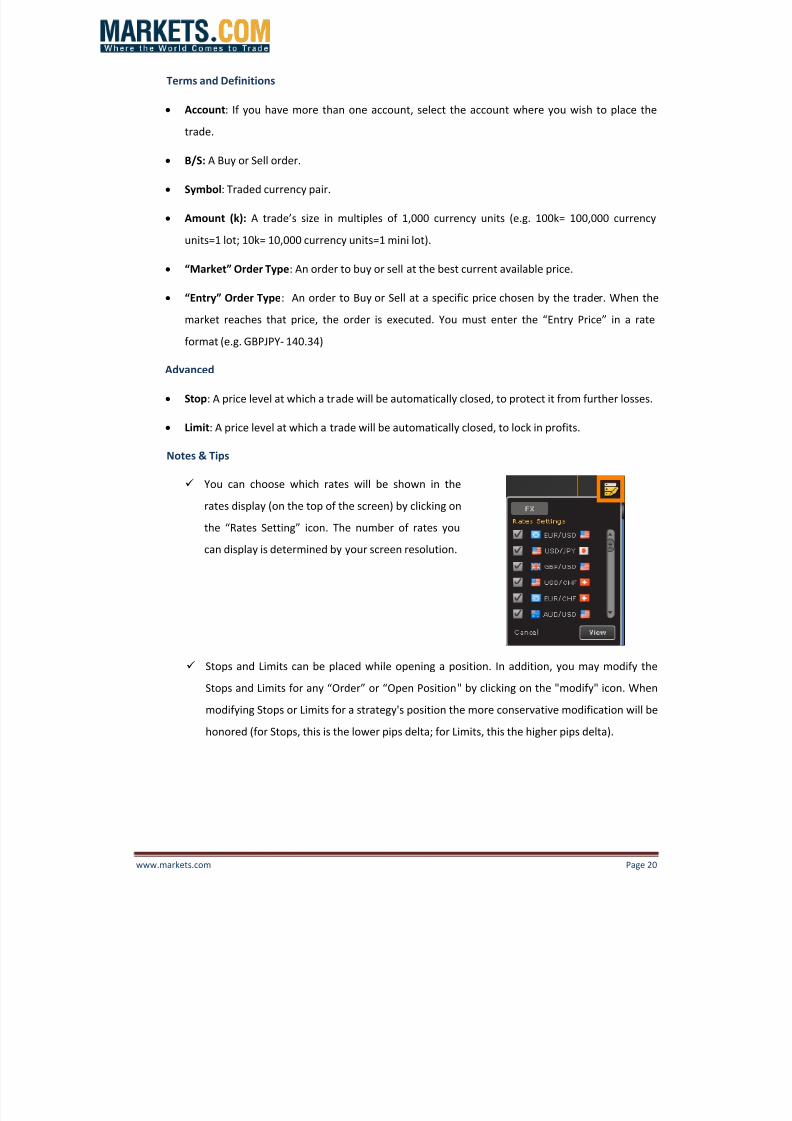
Terms and Definitions
Account: If you have more than one account, select the account where you wish to place the
trade.
B/S: A Buy or Sell order.
Symbol: Traded currency pair.
Amount (k): A trade’s size in multiples of 1,000 currency units (e.g. 100k= 100,000 currency
units=1 lot; 10k= 10,000 currency units=1 mini lot).
“Market” Order Type: An order to buy or sell at the best current available price.
“Entry” Order Type: An order to Buy or Sell at a specific price chosen by the trader. When the
market reaches that price, the order is executed. You must enter the “Entry Price” in a rate
format (e.g. GBPJPY- 140.34)
Advanced
Stop: A price level at which a trade will be automatically closed, to protect it from further losses.
Limit: A price level at which a trade will be automatically closed, to lock in profits.
Notes & Tips
You can choose which rates will be shown in the
rates display (on the top of the screen) by clicking on
the “Rates Setting” icon. The number of rates you
can display is determined by your screen resolution.
Stops and Limits can be placed while opening a position. In addition, you may modify the
Stops and Limits for any “Order” or “Open Position" by clicking on the "modify" icon. When
modifying Stops or Limits for a strategy's position the more conservative modification will be
honored (for Stops, this is the lower pips delta; for Limits, this the higher pips delta).

8/4/2019 Market Auto Trader Manual
http://slidepdf.com/reader/full/market-auto-trader-manual 21/30
8/4/2019 Market Auto Trader Manual
http://slidepdf.com/reader/full/market-auto-trader-manual 22/30
www.markets.com Page 22
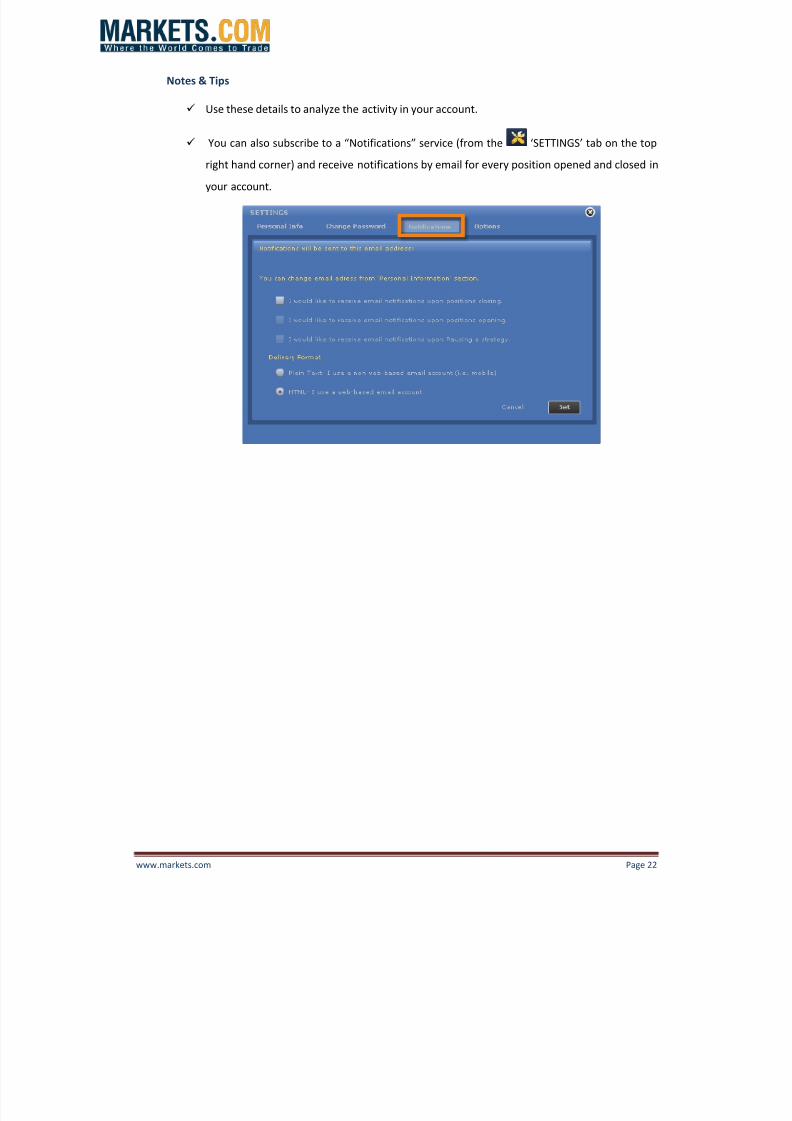
Notes & Tips
Use these details to analyze the activity in your account.
You can also subscribe to a “Notifications” service (from the ‘SETTINGS’ tab on the top
right hand corner) and receive notifications by email for every position opened and closed in
your account.

8/4/2019 Market Auto Trader Manual
http://slidepdf.com/reader/full/market-auto-trader-manual 23/30
www.markets.com Page 23
7 POSITIONS- OPEN POSITIONS
This tab shows a list of the open positions that were opened either manually or by strategies. The
number of open positions is shown next to the tab name [e.g. Open Positions (3)].
The “Margin Meter” shows your available margin
when new positions are opened in your accountand notifies you of a “Margin Call ”.
You can choose between the following display modes in the graph area:
Symbols distribution by Pips Bar, Strategies distribution by Pips Bar.
8/4/2019 Market Auto Trader Manual
http://slidepdf.com/reader/full/market-auto-trader-manual 24/30
www.markets.com Page 24
Terms and Definitions
Ticket: A trade’s identification number.
Strategy: Generic strategy name. When a manual position is opened, its name is “Manual.”
Symbol: Traded currency pair.
B/S: A Buy or Sell order.
Amount (k): A trade’s size in multiples of 1,000 currency units (e.g. 100k= 100,000 currency
units=1 lot; 10k= 10,000 currency units=1 mini lot).
Open Price: The price received when a position was opened.
Pips: Net pips accumulated for each open position.
P/L: Profit or Loss (in account currency terms) accumulated for each open position.
Stop: A price level at which a trade will be automatically closed, to protect it from further losses.
Limit: A price level at which a trade will be automatically closed, to lock in profits.
“Modify” Icon: Allows you to modify a position's Stop or Limit.
“Close” icon: Allows you to close a position manually.
Rollover: The amount credited or debited to your account for trades held overnight (5:00 p.m.
EST) due to different interest rates between the currencies.
Last Price: The current market price.
Open Time: The date and time when a position was opened.
Additional Functions
Export to Excel: Exports the data to Excel for further analysis.
Display Mode: Changes the display mode to table only, graph only, or both.
8/4/2019 Market Auto Trader Manual
http://slidepdf.com/reader/full/market-auto-trader-manual 25/30
www.markets.com Page 25
Notes & Tips
After submitting a manual position, you will receive a notification regarding its execution
status. Only after being executed successfully, the position will be shown in the “Open
Positions.”
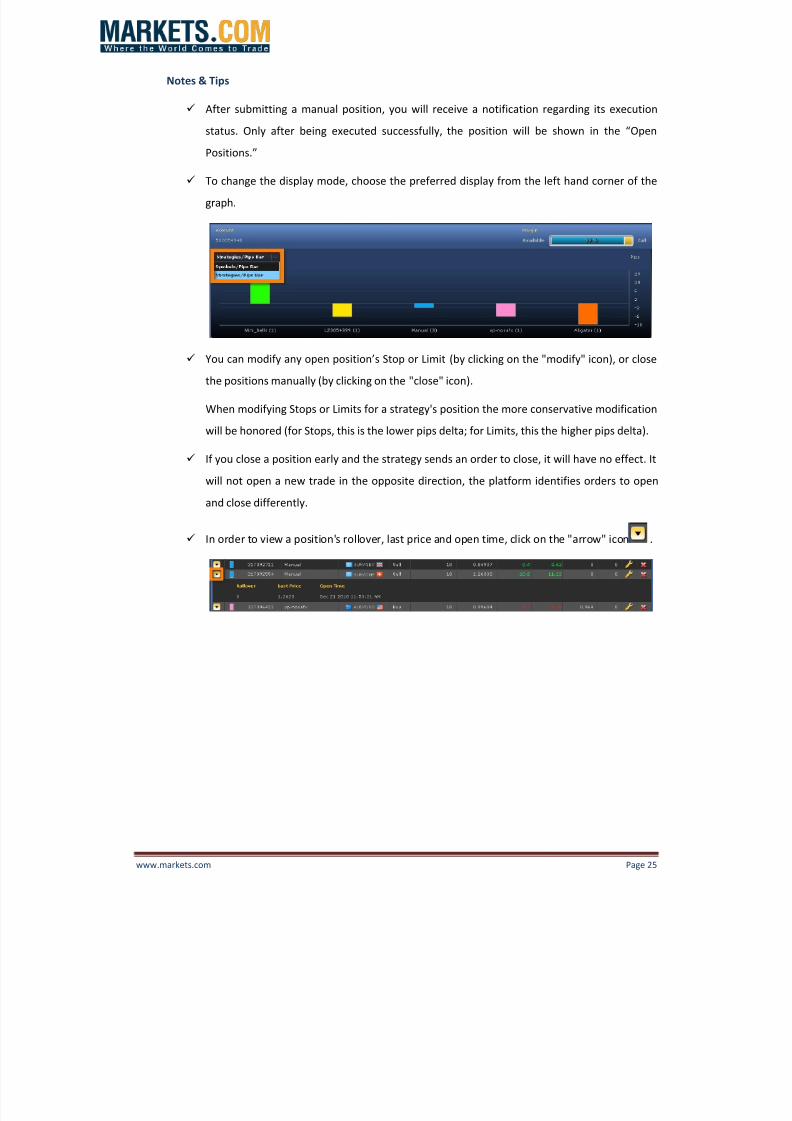
To change the display mode, choose the preferred display from the left hand corner of the
graph.
You can modify any open position’s Stop or Limit (by clicking on the "modify" icon), or close
the positions manually (by clicking on the "close" icon).
When modifying Stops or Limits for a strategy's position the more conservative modification
will be honored (for Stops, this is the lower pips delta; for Limits, this the higher pips delta).
If you close a position early and the strategy sends an order to close, it will have no effect. It
will not open a new trade in the opposite direction, the platform identifies orders to open
and close differently.
In order to view a position's rollover, last price and open time, click on the "arrow" icon .

8/4/2019 Market Auto Trader Manual
http://slidepdf.com/reader/full/market-auto-trader-manual 26/30
www.markets.com Page 26
8 POSITIONS- ORDERS
This tab shows a list of the entry positions created manually in your account before they open upon
reaching the entry price.
Terms Definitions
Order ID: A trade’s identification number.
Strategy: Generic strategy name. When a manual position is opened, its name is “Manual”
Symbol: Traded currency pair.
B/S: A Buy or a Sell order.
Amount (k): A trade’s size in multiples of 1,000 currency units (e.g. 100k= 100,000 currency
units=1 lot; 10k= 10,000 currency units=1 mini lot).
Open Price: The entry price in which the position will be opened once the market reaches it.
Last Price: The current market price.
Stop: A price level at which a trade will be automatically closed, to protect it from further losses.
Limit: A price level at which a trade will be automatically closed, to lock in profits.
Open time: The date and time when the order was sent.
“Modify” Icon: Allows you to modify an order's Stop or Limit.
“Delete” icon: Allows you to delete an order.
8/4/2019 Market Auto Trader Manual
http://slidepdf.com/reader/full/market-auto-trader-manual 27/30
www.markets.com Page 27
Notes & Tips
After submitting an entry order, you will receive a notification regarding its execution status.
Only after the position is actually opened will it appear in the “Open Positions.”
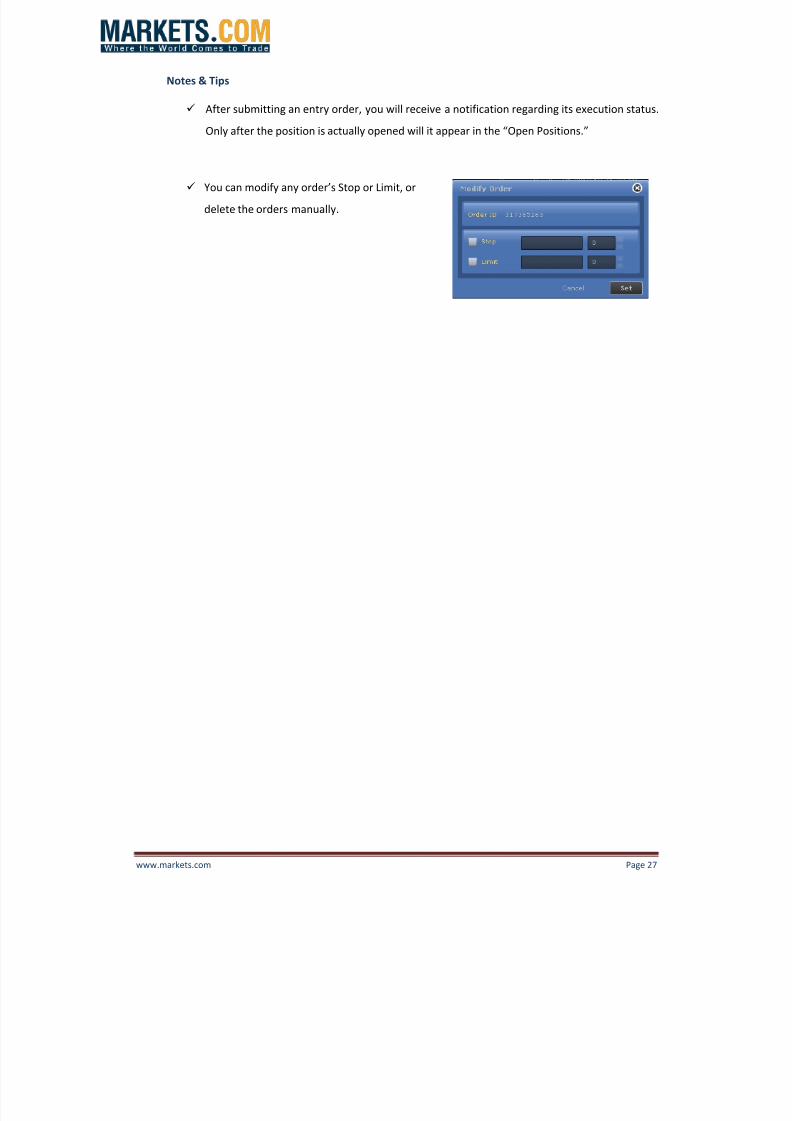
You can modify any order’s Stop or Limit, or
delete the orders manually.

8/4/2019 Market Auto Trader Manual
http://slidepdf.com/reader/full/market-auto-trader-manual 28/30
www.markets.com Page 28
9 POSITIONS- CLOSED POSITIONS
This tab shows a list of the positions that were closed either manually or by a strategy in your
account. You have the option to filter the data by strategy name, symbol or time frame.
You can choose between the following display modes in the graph area:
Total P/L per Strategy & Pair Bar, Total P/L Curve
8/4/2019 Market Auto Trader Manual
http://slidepdf.com/reader/full/market-auto-trader-manual 29/30
www.markets.com Page 29
Terms and Definitions
Ticket: A trade’s identification number.
Strategy: Generic strategy name. When a manual position is opened, its name is ‘Manual’.
Symbol: Traded currency pair.
B/S: A Buy or Sell order.
Amount (k): A trade’s size in multiples of 1,000 currency units (e.g. 100k= 10 0,000 currency
units=1 lot; 10k= 10,000 currency units=1 mini lot).
Open Price: The price received when a position was opened.
Close price: The price received when the position was closed.
Close Time: The date and time when a position was closed.
Pips: The Net pips accumulated for each closed position.
P/L: Profit or Loss (in account currency terms) accumulated for each closed position.
Rollover: The Amount credited or debited to your account for trades held overnight (5:00 p.m.
EST) due to different interest rates between the currencies.
Stop: A price level at which a trade will be automatically closed, to protect it from further losses.
Limit: A price level at which a trade will be automatically closed, to lock in profits.
Commission: The commission fee for each closed position.
Open Time: The date and time when a position was opened.
Additional Functions
Export to Excel: Exports the data to excel for further analysis.
Display Mode: Changes the display mode to table only, graph only, or both.

8/4/2019 Market Auto Trader Manual
http://slidepdf.com/reader/full/market-auto-trader-manual 30/30
Notes & Tips
Use “Closed Positions” data to analyze your account history. You can filter the data by
strategies and find out which strategy worked best for you.
To change the display mode, choose the preferred display from the left hand corner of the
graph.
In order to view a position's rollover, stop, limit, commission and open time click on the
"arrow" icon .