auto trader group plc – annual report and financial ... · auto trader group plc is the uk’s...
TRANSCRIPT

Auto Trader G
roup plc Annual Rep
ort and
Financial Statements 20
18
Auto Trader Group plc Annual Report and Financial Statements 2018
Unique journeys

Auto Trader Group plc is the UK’s largest digital automotive marketplace. Auto Trader sits at the heart of the UK’s vehicle buying and selling processes, bringing together the largest and most engaged consumer audience with the largest pool of vehicle sellers.
Strategic report02 Business at a glance04 Unique journeys10 Chairman’s statement11 Chief Executive Officer’s statement12 Value generation story14 – Market overview18 – Our business model20 – Our strategy22 – Key performance indicators26 Operating and financial review32 Risk management34 Principal risks and uncertainties39 Corporate social responsibility
Governance50 Governance overview52 Board of Directors54 Corporate governance statement60 Report of the Nomination Committee62 Report of the Audit Committee66 Directors’ remuneration report81 Directors’ report
Financial statements84 Independent auditors’ report to the members of Auto Trader Group plc only88 Consolidated income statement89 Consolidated statement of
comprehensive income90 Consolidated balance sheet91 Consolidated statement of
changes in equity92 Consolidated statement of cash flows93 Notes to the consolidated financial statements124 Company balance sheet125 Company statement of changes in equity126 Notes to the Company financial statements131 Shareholder information
Follow us: twitter.com/ATInsight
To view and download this report online: plc.autotrader.co.uk

With over 10 million transactions each year, the journey of buying or selling a car is often complex and inefficient.
Auto Trader, the UK’s largest digital automotive marketplace, addresses this by driving efficiencies through its innovative products and solutions that enable smoother buying and selling experiences.
Making these journeys easier will lead to people changing their cars more often – a win for consumers, retailers and manufacturers alike.
We all have journeys in life...
Start the journey on page 4
Strategic report / Governance / Financial statements
01Auto Trader Group plc Annual Report and Financial Statements 2018

1 ‘2018’ references the year ended 31 March 2018 and the comparative ‘2017’ references the 369-day period ended 31 March 2017 unless otherwise stated.
2 Average number during the year.3 Cash generated from operations is defined as net
cash generated from operating activities, before corporation tax paid.
4 Net external debt is gross external indebtedness, less cash and cash equivalents.
5 Leverage is Net external debt as a multiple of Adjusted underlying EBITDA (earnings before interest, taxation, depreciation and amortisation, share-based payments and associated NI).
6 Cash returns to shareholders comprise dividends paid and the cost of share buybacks (excluding transaction costs).
7 Cross platform minutes as measured by comScore MMX Multi-Platform.
8 Company measure of the number of inspections of individual vehicle advertisements on the UK marketplace for both physical and virtual stock.
9 Physical cars advertised on autotrader.co.uk.
Financial highlights 1
Revenue
+7% to £330.1m
Average RevenuePer Retailer (‘ARPR’) 2
+£149 to £1,695 pcm
Operating profit
+10% to £220.6m
Basic EPS
+15% to 17.76p per share
2017 £311.4m
2018 £330.1m
2017 £1,546
2018 £1,695
Margin
65%
Margin
67%
2017 £203.1m
2018 £220.6m
201715.64p
2018 17.76p
Cash generated from operations 3
+£13.2m to £226.1m
Net external debt 4,5
-£16.3m to £338.7m
Total dividend per share
5.9pinterim 1.9p plus final 4.0p
Cash returns to shareholders 6
+£19.7m to £148.4m
2017 £212.9m
2018 £226.1m
2017 £355.0m
2018 £338.7m
Leverage
1.65x
Leverage
1.46x
2017 5.2p
2018 5.9p
2017 £128.7m
2018 £148.4m
Operational highlightsAverage monthly cross platform minutes 7,8
+6% to 618m(2017: 582m)
Advert views per month 2,8
-0%to 246m(2017: 247m)
Live car stock 2,9
+1%to 453,000(2017: 450,000)
Number of retailer forecourts advertising on Auto Trader 2
-1% to 13,213(2017: 13,296)
Another year of growth
Business at a glance
Change from 52-week to annual accounting periodAs the 2017 financial year was four days longer than the 2018 financial year, year-on-year percentages for revenue, costs, profit, EPS and dividend per share have been adjusted throughout this report to reflect like-for-like growth.
Operating and financial review page 28
02 Auto Trader Group plc Annual Report and Financial Statements 2018

85%
9%6%
TradeRevenue from retailers, home traders and logistics companies, utilising Auto Trader’s products and marketplaces.
Consumer servicesRevenue from private sellers who pay to place adverts on our marketplace and from our partners who provide services to consumers.
Manufacturer and AgencyRevenue from manufacturers and their advertising agencies who advertise their brand or services on the marketplace.
Revenue performance
+8%to £281.2m (2017: £262.1m)
Revenue performance
-5%to £29.8m (2017: £31.8m)
Revenue performance
+10%to £19.1m (2017: £17.5m)
Our revenue streams
We have maintained our market leading position, with consistent full page advert views and increasing minutes spent on our marketplace. Profit growth has largely been converted into cash, which has been returned to shareholders in line with our capital returns policy.
Chairman’s statement page 10
Chief Executive Officer’s statement page 11
Our business model page 18
Operating and financial review page 26
Strategic report / Governance / Financial statements
03Auto Trader Group plc Annual Report and Financial Statements 2018

Unique journeys: consumers
From desire, to research, to decision. Auto Trader makes the consumer journey easier
New and used car search listingsConsumers can search from 453,000 1 used cars and 6,000 virtual cars on the marketplace each month.
Searching by monthly budgetWith 52% of car buyers wanting to search for their next car by monthly price 2, we launched a new finance search tool which allows them to do just that. Over 8,000 retailers feature monthly price payments on their adverts.
Dealer reviews and ratings Over 8,000 retailers feature in circa 470,000 reviews, helping consumers make an informed and trusted decision about who they want to buy from.
The role we play for consumers:
Vehicle CheckWe offer a free standard five point vehicle check so consumers can quickly assess the provenance of a vehicle.
ValuationsWe provide free vehicle valuations, offering both a private sale price as well as a part-exchange price.
Price Indicator Powered by our valuations, these good, great or low price indicators give consumers full price transparency so they can understand the price they are paying compared to the market value.
Private salesConsumers can list their vehicles for sale directly to other consumers.
Motoring servicesWe offer consumers a variety of services to help them make an informed decision about the car they are looking to buy. These include finance and insurance.
Motoring adviceWe feature over 48,000 expert and owner reviews, as well as regularly updated editorial and advice articles to help consumers in their car buying journey. We recently launched a new series of expert reviews called ‘The REV Test’ which are presented by expert female automotive journalists and are aimed at helping both women and men choose their next car based on a monthly budget or lifestyle change.
1 Average physical cars advertised on autotrader.co.uk.
2 Auto Trader Market Report, March 2018.
04 Auto Trader Group plc Annual Report and Financial Statements 2018

Over
8,000retailers feature monthly price payments on their adverts
Greater choice
453,000 1used cars and 6,000 virtual new make/model derivatives listed each month
Strategic report / Governance / Financial statements
05Auto Trader Group plc Annual Report and Financial Statements 2018

Unique journeys: retailers
Average retailer forecourts
13,213 Average Revenue Per Retailer (pcm)
£1,695
06 Auto Trader Group plc Annual Report and Financial Statements 2018

From marketing, to finance, to deal. Auto Trader makes the retailer journey easier
Classified advertisingOur core classified platform reaches the UK’s largest automotive audience. Our product packages enable retailers to compete effectively on the marketplace. Our ‘starter’ retailer package now includes products such as 100 images, Live Chat, Dealer Reviews and the Part-Exchange Guide. We offer progressively higher levels, giving retailers the opportunity to pay for greater prominence and stand out in a search.
The role we play for retailers:
Finance solutionsAfter gaining FCA authorisation, we can now enable retailers to display their own finance calculator as standard on their full page adverts on Auto Trader. This allows retailers to show their finance offerings much earlier on in the car buying journey, therefore increasing the opportunity for them to sell their own finance over a consumer sourcing finance from elsewhere.
Forecourt management toolsPowered by both our own and third-party data, we offer data intelligence solutions (i-Control and Retail Check) enabling retailers to buy the right stock, at the right price.
ValuationsAn improvement in the underlying data that powers our valuations has allowed us to launch specification-adjusted valuations which power price indicators consumers see on the marketplace. Our valuations also power our part-exchange tool.
Creating a trusted marketplaceWe invest in technology and a security team that is focused on creating a safe and secure marketplace. We remove misleading adverts and also operate two-factor verification on our platforms to protect our customers.
Retailer education and insight As well as providing every retailer customer with monthly performance dashboard analytics to help them assess their performance on Auto Trader, we also offer free best practice events. In the last year over 4,000 retailers have attended a free webinar, masterclass or conference where our insight team have shared the latest consumer insights and best practice advice.
Strategic report / Governance / Financial statements
07Auto Trader Group plc Annual Report and Financial Statements 2018

From production, to advertising, to sale.Auto Trader makes the manufacturer journey easier
their recent purchase decision 3, we responded with new video format advertising.
New car reviews and awardsMake/model pages for all new cars improve the buying journey, and the extra content enhances Auto Trader’s position in the new car market. Last year we launched our first New Car Awards – where we asked over 10,000 consumers to vote on their favourite cars based on true lifestyle categories such as family car of the year and best car for long distances. These accolades were well received by manufacturers, with some using the award in their marketing collateral.
The role we play for manufacturers:
Unique journeys: manufacturers
Data-driven targetingWe have developed our own data management platform (‘DMP’) which allows us to use both first and third-party data to create highly targeted audience segments for advertising. We are utilising our DMP together with our Creative Solutions offering to give manufacturers a compelling proposition to reach new car buyers.
3 Google Gear Shift Research 2017.
New carsWe know that 75% of buyers consider new cars, so we added over 6,000 brand new car make/model variants. These new cars are unregistered and do not physically exist, and are called ‘virtual stock’.
Advertising solutionsOur platform enables manufacturers to advertise to the UK’s largest car buying audience. We provide manufacturers with a range of manufacturer and agency options, including a new format InSearch, which allows brands to serve new car adverts within search results. And as 58% of car buyers used video to inform
08 Auto Trader Group plc Annual Report and Financial Statements 2018
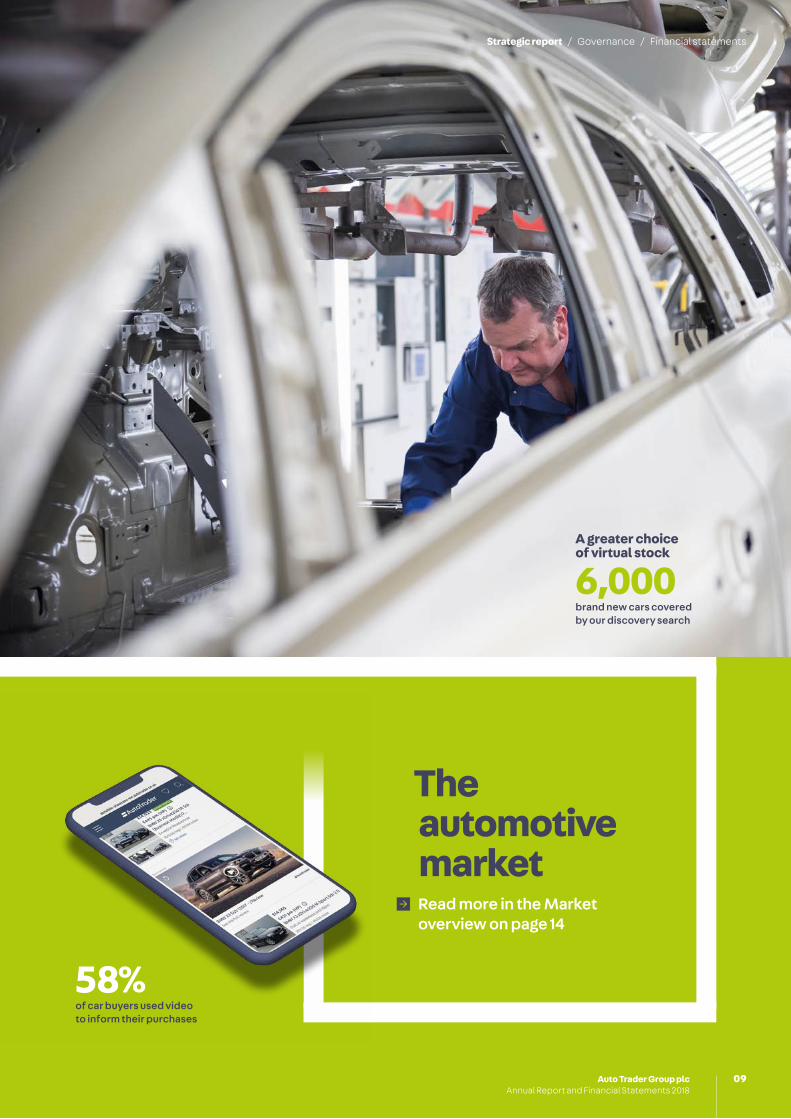
The automotive marketRead more in the Market overview on page 14
A greater choice of virtual stock
6,000brand new cars covered by our discovery search
58%of car buyers used video to inform their purchases
Strategic report / Governance / Financial statements
09Auto Trader Group plc Annual Report and Financial Statements 2018

4
2
Board diversityAs at 31 March 2018
MenWomen
77
OLT diversityAs at 31 March 2018
MenWomen
Ed WilliamsChairman
Driving sustainable growth Creating sustainable shareholder value over the long term, underpinned by a diverse, transparent and open culture.
2018 was a year of investment in innovation, reflecting a long-term perspective underpinned by our financial strength.
OverviewThe challenges to the car industry in the UK during this pre-Brexit period are well reported, though concentrated predominantly in the new car sector. Nonetheless, Auto Trader continued to innovate and grow. Total revenue grew by 7% to £330.1m, and earnings per share (‘EPS’) grew by 15%, principally as a result of rising profits but enhanced by share buybacks.
We also continued to innovate, enhancing the consumer experience and delivering more value to retailers and manufacturers.
Dividend and capital strategyWe are recommending to shareholders a final dividend of 4.0 pence per share, bringing the total dividend for the year to 5.9 pence per share. This 15% increase on the previous year is underpinned by our EPS growth.
Our policy is to distribute around a third of net income as dividends. We use the majority of surplus cash, after dividends, to buy back shares while also reducing debt. In 2018, we returned £148.4m to shareholders through dividends and share buybacks, bringing the total since IPO to £282.1m.
Refinancing On 6 June 2018 we signed into a new five-year £400m revolving credit facility, ahead of our existing facility maturity of March 2020. See the Operating and financial review section for more details.
Culture, diversity and inclusionWe foster a culture of openness and transparency. The Board spends a significant proportion of its time on supporting the executives in maintaining and improving our culture.
We are committed to having a diverse workforce, including the Board. Women now make up 50% of our Operational Leadership
Team (‘OLT’) and a third of our Board. The proportion of women and minorities amongst our workforce has increased in recent years, at least in part due to a number of well supported internal initiatives. We recently published our Gender Pay Gap, which though improved, still leaves us short of the goal of eliminating the gap entirely. The CSR report on page 43 contains more detail on the work we are doing to continue to foster diversity.
Board changes and governanceSean Glithero stepped down as Chief Financial Officer on 21 September 2017. During his 11 years with Auto Trader, Sean made a huge contribution in a wide range of areas and under differing ownership structure. We thank him for this contribution and wish him well in his new role. Nathan Coe, Chief Operating Officer, took on the additional responsibility of Chief Financial Officer on Sean’s departure.
As a result, the overall Board size reduced from seven to six. Whilst very small by the standards of FTSE 250 companies, we remain compliant with all provisions of the Corporate Governance Code. The small Board size helps maintain a level of trust and openness in line with our culture.
Annual General MeetingOur Annual General Meeting (‘AGM’) will be held at 10.00am on Thursday 20 September 2018 at 4th Floor, 1 Tony Wilson Place, Manchester, M15 4FN and we expect that all Directors will be in attendance.
Ed WilliamsChairman 7 June 2018
Chairman’s statement
We continue to make progress against our strategy of improving car buying in the UK
Governance overview page 50
Change from 52-week to annual accounting periodAs the 2017 financial year was four days longer than the 2018 financial year, year-on-year percentages for revenue, costs, profit, EPS and dividend per share have been adjusted throughout this report to reflect like-for-like growth.
Operating and financial review page 28
10 Auto Trader Group plc Annual Report and Financial Statements 2018

Trevor MatherChief Executive Officer
Another year of growth
1. Innovation driving our operational and financial results
Operating and financial review, page 26
2. Our strategy and strategic pillarsOur strategy, page 20
3. A commitment to our people and cultureCorporate social responsibility, page 39
4. The automotive market todayMarket overview, page 14
We maintained our market leading position and our audience has continued to grow as consumers spend more time on the site.
Delivering against our strategyOur purpose is to lead the future of the digital automotive marketplace and we continue to make progress against our strategy of improving car buying in the UK. We seek to continually evolve the automotive ecosystem so consumers, retailers and manufacturers realise greater efficiencies.
Summary of operating performanceIt has been another good year for the business despite the toughest market conditions we have seen since we became a public company. We achieved revenue growth of 7%, through our core Retailer and Manufacturer and Agency revenue streams, but this has been partially offset by weakness in Consumer services where broader economic uncertainty has affected our private listings business. With Operating profit growth of 10%, we saw continued improvement in Operating profit margin to 67%.
What we’ve deliveredWe have a market leading position as the UK’s largest digital automotive marketplace. Our audience has grown as consumers spend more time on our platforms, viewing an average of 94 adverts every second of every day, and the vast majority of our audience remains unique to Auto Trader.
During the year we improved our offering to retailer customers, including the successful launch of our new advertising packages in April 2017, which enabled retailers to compete more effectively on our marketplace. We have also continued to leverage our data to evolve our consumer and retailer products, integrated Motor Trade Delivery (‘MTD’) and delivered our new Dealer Finance product in December 2017.
The marketThe overall size of the UK’s car parc continues to grow, which is beneficial for our stock-based business model. However, in the year to March 2018 both new and used car transactions declined, and industry forecasts suggest that both markets will continue to decline for the remainder of the calendar year 2018.
People and cultureAs we strive to become the UK’s most admired digital business, I am delighted to say that 90% of employees say they are proud to work at Auto Trader1 and would recommend the Company to a friend2.
We are committed to addressing the gender and wider diversity balance that is common in most technology and digital companies and we have made good progress in this area. Along with all other large companies, we reported our Gender Pay Gap this year for the first time. We are dedicated to reducing this gap as well as increasing diversity at all levels of our business and we have implemented a number of initiatives which are already having an impact.
Finally, this year we re-assessed our business’ core values, and collectively decided to add a sixth value – community-minded – as a reflection of our commitments to support the Auto Trader community, as well as the wider communities in which we operate.
Trevor MatherChief Executive Officer 7 June 2018
Our business model page 18
Key performance indicators page 22
Chief Executive Officer’s statement
1 Auto Trader employee engagement survey, 20172 Glassdoor, April 2018
Strategic report / Governance / Financial statements
11Auto Trader Group plc Annual Report and Financial Statements 2018

Auto Trader’s trusted
marketplace
AUDIENCE
STOCK
The largest
The largest choice of trusted
Mos
t eff
ecti
ve s
ales
pla
tfor
m
Best car buying experience
– Investment in platform
– Investment in insight & tools
– Investment in growing audience
– Stock-based revenue model
Market overview Our business model
A holistic approach to generating value
Value generation story
The automotive market, with over 10 million transactions each year, is complex and often inefficient. We believe that by continually improving transparency in the marketplace around pricing, specifications of the car and dealer reviews we can improve trust held within the industry. Greater trust, as well as a much improved buying journey, should help many consumers overcome their perception that changing their car is an onerous process and, ultimately, encourage more transactions.
Auto Trader is the UK’s largest digital automotive marketplace. Our trusted brand has been built over 40 years, where we have built a network of highly engaged consumers shopping for cars. These cars are largely supplied by retailers, as well as a small proportion from other consumers, and are then advertised on our marketplace – the most effective automotive sales platform. We collect large amounts of data and continually invest in our platform, marketing, insight and customer relationships.
Market overview page 14
Our business model page 18
10.4m cars sold to consumers
(new and used)
5.0m used car sales from trade to consumers
2.4m new car
registrations to consumers
ConsumersOwners of the 34.7 million cars within the UK car parc. Consumers involved in transactions as buyers, sometimes also sellers and providers of stock via part-exchange.
Focus areas
RetailersRetailers are involved in the sale of new cars, as part of a manufacturers’ distribution network, and sellers of used cars. Much of that used car stock is sourced via part-exchange or through auctions.
ManufacturersNew cars are built and distributed either to fleet and lease companies or sold to companies and private buyers, usually via a franchise network.
12 Auto Trader Group plc Annual Report and Financial Statements 2018

KPIsOur strategy
We use the metrics below to track our operational and financial performance. This financial year, we have moved to using statutory Operating profit, as the growth in share-based payments has reached steady state as described at IPO. We have also introduced live car stock as a new operational measure, as this is a key revenue driver.
We remain committed to our purpose of leading the future of the digital automotive marketplace and we have continued to make progress against our strategy of improving car buying in the UK. We seek to continually evolve the automotive ecosystem so consumers, retailers and manufacturers alike experience greater efficiencies.
Our strategy page 20
Key performance indicators page 22
Operational
Advert views Average number per month (millions)
246Number of retailer forecourtsAverage number per month
13,213Live car stock Average number of physical cars advertised on autotrader.co.uk per month
453,000Cross platform minutes Monthly average minutes spent across all our platforms (millions)
618Number of full-time equivalent employees (‘FTEs’)Average number (including contractors)
824
Financial
Revenue £m
330.1Average Revenue Per Retailer (‘ARPR’)£ per month
1,695Operating profit £m
220.6Operating profit margin
67%Basic EPS pence per share
17.76Cash generated from operations £m
226.1
Improve car buying in the UK
Evolve the automotive ecosystem in the UK
Become the most admired digital business
Our strategic pillars
Strategic report / Governance / Financial statements
13Auto Trader Group plc Annual Report and Financial Statements 2018

2016 2017 2018
0
10
20
-10
-20
0
12-month rolling new car registrations(’000s) (%)
3,000
2,000
1,000
Year-on-year growth in the month Number of new car registrations
2016 2017 2018
0
-10
-20
-30
10
20
309,000
6,000
3,000
0
12-month rolling used car transactions (’000s)
Year-on-year growth for the month
(%)
Number of used car transactions
2016 2017 2018
2.5
15.0
12.5
10.0
5.0
7.5
0
-2.5
-5.0
15,000
12,000
9,000
6,000
3,000
0
Auto Trader Retail Price Index (£)
Year-on-year price growth for the monthYear-on-year mix growth for the monthAverage price of a trade car for the month
(%)
The automotive market today
Market overview
Market overview
UK automotive market and associated macroeconomic conditions
New and used car sales A growing number of vehicles in the UK, coupled with a stable desire of car owners wanting to change their car (average ownership is 3.3 years), resulted in 10.4 million total car transactions in the 12 months to March 2018.
New car sales have fallen from record highs seen in 2016, with the total number of new car registrations down by 11% to 2.4 million in the 12 months to March 2018, according to the Society of Motor Manufacturers and Traders (‘SMMT’).
Despite the decline, the overall UK car parc has continued to grow, increasing by 1% to 34.7 million cars 1, as the number of cars registered outweighs the number of cars that are scrapped each year. In the 12 months to March 2018, used car transactions were down 3% to 7.9 million3.
Used car prices continue to increase. The Auto Trader Retail Price Index shows that the price of a used car in the UK has continued to grow; achieving an average of £12,171 over the 12-month period to March 2018, an increase of 5.4% when compared to the same period the previous year. This is on a like-for-like basis – stripping out the impact of changes in the mix of cars being sold.
Looking forward, industry predictions suggest that new car transactions will decline again in 2018 by similar levels experienced in 2017. However, the used car market is less volatile and therefore we anticipate only a small decline in the number of used car sales in 2018.
UK economy and EU Referendum implications Against a backdrop of the UK negotiating its exit from the EU, the economy remained fairly buoyant in the calendar year 2017. GDP grew by 1.7% with similar levels predicted for calendar year 2018. Inflation has continued to climb steadily to 2.3% in March 2018, with the largest downward contribution to change in the rate coming from prices for motor
Following the record highs reached in 2016, both new and used car market volumes have declined. However, transaction volumes are still at historically high levels.
14 Auto Trader Group plc Annual Report and Financial Statements 2018

New cars direct to consumers1.1m1.2m
0.1m
New cars sold via retailers
Used car sales to consumers
BusinessDirect car sales
to businesses
Part-exchangeof used cars
5.0m
3.4m
Used car sales to immediate cash buyers
Third parties making cash
offers toconsumers
AuctionBuying and selling by
all types of car traders
Fleet& lease
customers Commercial
buyers of new cars
1.2m
Trade
New cars
Usedcars Trade-
to-tradetransactions
1.6m
Manufacturers
new car registrations
2.4m
9.0mcars sold to consumers
(new and used)
2.9mconsumer-
to-consumertransactions
Consumers
KPIsMarket overview Our strategyOur business model
The automotive market, with over 10 million car transactions each year, is complex and often inefficient. Through the evolution of our digital platforms and our innovative data products, we continue to make the car buying process easier for consumers, retailers and manufacturers.
1 SMMT UK car parc.2 SMMT new car registrations.3 DVLA used car transactions.
fuels, which rose by less than they did a year ago. Interest rates remain low, although the Bank of England increased its base rate to 0.5% in November 2017, the first increase since July 2007; this continued low level of interest rates has contributed to the attractiveness of car finance deals and therefore overall vehicle sales.
However, there are concerns about the implications surrounding the UK’s departure from the EU. Economic conditions and, critically for the automotive industry, currency volatility and consumer confidence levels could all be adversely affected. For our business specifically, if prices of cars increase and
34.7mcars registered in the UK 1
2.4mnew cars registered in the 12 months to March 20182
7.9m used cars sold in the 12 months to March 2018 3
10.4m car transactions in the 12 months to March 2018
consumer confidence levels decrease, then there’s a potential impact on the number of actual car transactions. This would likely impact our retailers and their ability to spend on our marketplace. Turn to page 34 for more information about the impact of the EU Referendum on Auto Trader.
Strategic report / Governance / Financial statements
15Auto Trader Group plc Annual Report and Financial Statements 2018

Market overview
Simplifying the car buying journey The automotive retail sector is a fast evolving one. The way people search for their next car, the way they pay for it, and the cars themselves, have all changed dramatically over the last decade. Today, 94% of consumers conduct their car buying research online, spending an average of 13 hours looking for their next car4, choosing from an almost endless list of brands, specifications, budgets and deals.
However, for many car buyers this change has created a complex and often frustrating process. Our award-winning Car Buyers Report found that 85% of consumers entering the process expect it to be hard, with 60% giving up their pursuit for the perfect car and making a purchase simply out of exhaustion. The problem is even more prevalent amongst younger buyers.
At Auto Trader we are committed to creating an end-to-end buying experience that is easy, convenient, transparent and safe for consumers, and one which reflects their evolving retail needs and expectations. As part of this commitment, we provide our retailer customers with the products, tools, data and insight to create a more engaging, efficient and simplified buying journey for today’s car buyers.
Building trust through transparencyOne of the biggest challenges faced by the automotive industry is trust. Just 7% of consumers claim to trust car dealers, and as a result nearly a quarter of car buyers (23%) find visiting a dealership daunting and 22% see car dealerships as untrustworthy5. We have worked hard to address this issue. We have built relationships with the leading third-party review sites and have aggregated over 470,000 reviews, as well as developed our own ‘open’ review platform. We are now the number one dealer review site in the UK, with over 8,000 retailers providing reviews. This level of transparency offers consumers greater confidence and trust in the dealer, and for retailers, it provides the opportunity to differentiate themselves amongst competitors. Underlining the positive influence reviews have on consumers, car buyers spend 22% more time on full page adverts that carry reviews than those that don’t6.
For consumers, a key factor in establishing trust is price transparency. In fact, 76% of car buyers believe that transparent pricing is the most important factor when buying a car 7. Last year we launched Price Indicator to help consumers validate the price of a car versus similar ones on our marketplace. Adverts are labelled as having either a Great Price, Good Price or Priced Low, determined by comparing prices against Auto Trader market valuations. The calculations are based on make, model, derivative, age, mileage and
adjusted for any optional extras on the car. We combine and analyse data from circa 500,000 trade used car listings every day, as well as additional dealer forecourt and website data, ensuring indicators are an accurate reflection of the live retail market. Adverts with Price Indicator are viewed over four million times every day.
With 33% of buyers walking away from a part-exchange due to a disagreement on the valuation offered10, our valuations are also used to build trust in the price of the car consumers are selling. Our Part-Ex Guide Price is designed to bring consumers and retailers together. It gives potential car buyers a convenient way in which to get an accurate part-exchange guide price on their car based on our powerful valuations.
Improving the car buying experience
94% of consumers conduct their car buying research online4
52% of buyers worked out their monthly budget when researching their next car 8
88% of new cars bought on finance9
1.5m valuations conducted per month
Market overview continued
16 Auto Trader Group plc Annual Report and Financial Statements 2018

KPIsMarket overview Our strategyOur business model
For retailers, the tool not only encourages a more cost-effective source of stock, but it also enables smoother negotiations with engaged car buyers earlier in the car buying process. Accordingly, circa 9,000 retailers choose to promote our tool on their full page adverts. Each month, 1.5 million valuations are carried out, with over 85,000 enquiries sent to retailers.
Demystifying finance Our latest Market Report revealed that over half of car buyers (52%) already consider the cost of a car as a monthly price, rather than the full retail value8. However, despite 88% of new cars bought on finance in 2017, and circa 30% of used, consumers have told us that finance is one of the most challenging and confusing aspects of the modern car buying journey9. And for our retailer customers, all too many were losing out on lucrative
finance deals to alternative lenders, such as high-street banks and specialist providers. To address both challenges, we introduced finance across our retailer adverts, integrating finance options from over 6,000 retailers. For non-Financial Conduct Authority (‘FCA’) authorised retailers, we partnered with car finance broker, Zuto.
To further enhance the finance experience, in December 2017 we launched a search by monthly price functionality, making it even easier for consumers to find a car based on their monthly budget. For consumers it’s added greater simplicity and convenience. For our customers it provides a welcome competitive advantage with the opportunity to engage with car buyers at the very beginning of their buying journey, not at the end of it.
Despite a growing number of competitive brands and platforms, our ability to evolve and adapt alongside changing market conditions means we remain the UK’s largest digital automotive marketplace for new and used cars. With 55 million cross platform visits 11 we are the most visited automotive website, with an audience three times larger than our nearest competitor. With car buyers spending 618 million minutes on Auto Trader12, we also have the most engaged audience. What’s more, we are the most trusted automotive classified brand in the UK, with nearly 10 times more consumers claiming to trust Auto Trader over our nearest competitor.
Looking forward
New car sales continue to decline
Industry predictions suggest that new car transactions will decline again in 2018 by similar levels experienced in 2017. The used car market, which makes up two thirds of annual car transactions, is less volatile and therefore the industry expects only a small decline in the number of used car sales in 2018.
Brexit negotiations If prices of cars increase and consumer confidence levels decrease, then there’s a potential impact on the number of car transactions, which may impact on our retailers’ profitability.
Consumer behaviour change
Consumers spend an average of 13 hours researching their next car online and only visit 1.6 dealerships before they buy 4. Consumers will demand a complete end-to-end buying journey and will do more of the process online and visit fewer dealerships to make their purchase.
Cars bought on finance
88% of new cars, and circa 30% of used cars, were bought on finance in 2017 9. As this is set to increase, making the financing of used cars especially more competitive, accessible and easier to understand will be crucial to driving more options for buyers and more sales for retailers.
4 Auto Trader internal data.5 Auto Trader Market Report
(September 2016).6 Auto Trader internal data.7 Auto Trader Market Report
(September 2016).8 Auto Trader Market Report (March 2018).9 Auto Trader Market Report (March 2018).10 Auto Trader internal data.11 Cross platform visits as measured by
comScore (average during the year).12 Cross platform minutes as measured
by comScore (average during the year).
Operating and financial review page 26
Strategic report / Governance / Financial statements
17Auto Trader Group plc Annual Report and Financial Statements 2018
Auto Trader’s trusted
marketplace
AUDIENCE
STOCK
The largest
The largest choice of trusted
Mos
t eff
ecti
ve s
ales
pla
tfor
m
Best car buying experience
– Investment in platform
– Investment in insight & tools
– Investment in growing audience
– Stock-based revenue model
Leveraging the scale of our network to generate value
Our business model
Our business modelMarket overview
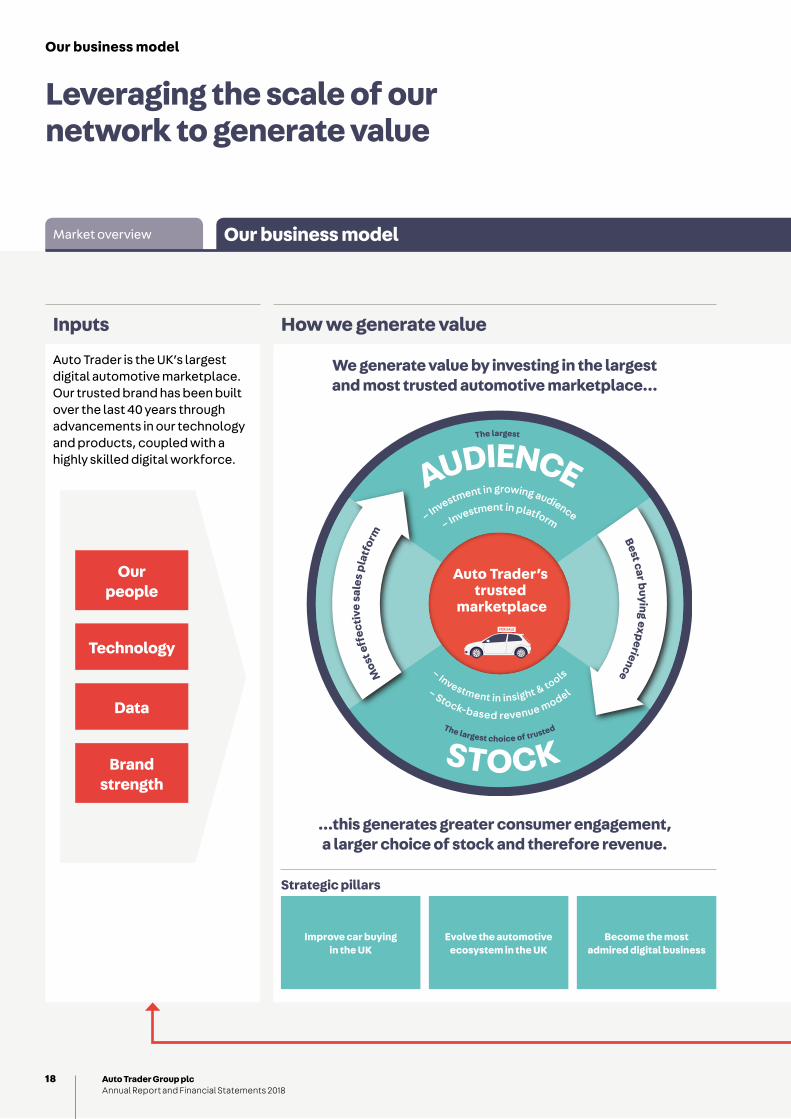
Inputs How we generate value
We generate value by investing in the largest and most trusted automotive marketplace...
...this generates greater consumer engagement, a larger choice of stock and therefore revenue.
Improve car buying in the UK
Evolve the automotive ecosystem in the UK
Become the most admired digital business
Strategic pillars
Auto Trader is the UK’s largest digital automotive marketplace. Our trusted brand has been built over the last 40 years through advancements in our technology and products, coupled with a highly skilled digital workforce.
Technology
Data
Brand strength
Our people
18 Auto Trader Group plc Annual Report and Financial Statements 2018

Value
Our business model KPIsOur strategy
Value outputs
Trust in the market
Market position
Brand reputation
Data & insight
Revenue
Shareholder returns
Strategic report / Governance / Financial statements
19Auto Trader Group plc Annual Report and Financial Statements 2018

Strategic pillars Focus areas 2018 progress Relevant risks How we measure progress
1
Increase consumer audience, advert views and use of our valuation tools
Having the largest and most engaged consumer audience is one of the key components in our network effects business model. Investing in the best consumer experience and growing audience underpins the value we deliver to our retailers. Part of that experience is the free valuation tool we offer.
We have maintained our share of audience versus competitors and kept full page advert views, our key measure of audience engagement, consistent year on year.
2 Brand: Failure to protect our brand could result in a reduction in audience.
3 Increased competition: Competitors could develop a superior consumer experience which we find hard to replicate, resulting in loss of audience share.
– Advert views – Cross platform minutes
2
Improve stock choice, volumes and accuracy
Consumers visit Auto Trader because of the volume and choice of trusted stock from our fragmented customer base. It’s important we maintain coverage across age, price, region, make and model to ensure we can meet the buying needs of all our consumers. Stock is underpinned by accurate taxonomy, which we continue to improve.
We grew the number of live cars on site 1% in the year, giving consumers greater choice. We offered free consumer adverts for cars priced under £1,000, to gain share in this space.
1 Economy, market and business environment: Declining used cars transactions could lead to a reduction in the amount of car stock in the market.
3 Increased competition: Competitors could expand from specific types of stock, with smaller niche audiences, into other types of stock and disrupt our market position.
– Live stock – Number of retailer forecourts
3
Grow ARPR in a balanced, sustainable way by creating value for our customers
Average Revenue Per Retailer (‘ARPR’) growth is driven by three levers: stock, price and product. Over a three to four-year period we look to balance their contribution, as we seek to attain long-term sustainable growth.
ARPR saw good growth of £149 in 2018. Product was the largest growth contributor, with the launch of our advanced and premium packages, as well as added value products included in the packages. Price and stock also contributed to growth.
1 Economy, market and business environment: Declining new and used cars transactions could lead to a reduction of retailers’ advertising spend, resulting in downgrades and pressure on customer wallet.
4 Failure to innovate: disruptive technologies and changing consumer behaviours: If we rely too much on price and do not innovate our product offering to increase value, we could see downgrades and cancellations offsetting the growth expected from pricing initiatives.
– Revenue – Operating profit – Operating profit margin – Number of retailer forecourts – Average Revenue Per Retailer (‘ARPR’)
– Live stock
4
Enhance our relevance and value to manufacturers
Whilst the majority of our revenue comes from retailers, there is considerable opportunity with manufacturers. We know three out of four consumers are open to buying new cars high up in the buying funnel, which promotes our audience of in-market car buyers as a valuable target audience for manufacturers.
We saw a solid year of growth in our Manufacturer and Agency line. We’ve seen significant investment in the team, recruiting a number of people with OEM experience and investing in our product offering for these customers.
1 Economy, market and business environment: Declining new car registrations could lead to a reduction in manufacturer spend on digital display advertising.
2 Brand: Failure to change perception of manufacturers that we are a destination for new car buyers could result in lost opportunity to attract more of the c.£500 million manufacturers spend on digital advertising.
– Revenue – Operating profit – Operating profit margin – Advert views – Cross platform minutes
5
Extend our product offering further down the buying funnel, towards online transactions
There’s considerable market research suggesting that consumers are becoming more open to the idea of transacting cars online. We believe having the component parts of the deal will be a key differentiator for us as a business.
The business has made good strides in delivering some of the component parts of online transactions. We acquired Motor Trade Delivery (‘MTD’) in April, which acts as a marketplace for logistics companies, and have also developed our finance proposition to display monthly payment prices on Auto Trader.
4 Failure to innovate: disruptive technologies and changing consumer behaviours: If we do not innovate in this area, there is a risk that we miss out on the opportunity to be at the front of industry developments and lose market share.
– Revenue – Operating profit – Operating profit margin – Number of retailer forecourts – Average Revenue Per Retailer (‘ARPR’)
6
Create and maintain high-performing, data-oriented teams
Auto Trader’s people are one of our most important assets. We continually invest in their development, our environment and promoting diversity and inclusion. Data is at the heart of how we operate as a business and how our people work.
We’ve held our headcount flat year-on-year, but have increased our developer and data science ratios. Data continues to play an ever more prominent role driving business decisions, with capability increasing across the organisation.
6 Employees: Manchester and London continue to grow in terms of competition for top talent, particularly in data science and developers.
– Operating profit – Operating profit margin – Number of full-time equivalent employees (‘FTEs’)
Improve car buying in the UK
Evolve the automotive ecosystem in the UK
Become the most admired digital business
To be the UK’s leading digital automotive marketplace
Our strategy
Our strategyMarket overview Our business model
20 Auto Trader Group plc Annual Report and Financial Statements 2018

Strategic pillars Focus areas 2018 progress Relevant risks How we measure progress
1
Increase consumer audience, advert views and use of our valuation tools
Having the largest and most engaged consumer audience is one of the key components in our network effects business model. Investing in the best consumer experience and growing audience underpins the value we deliver to our retailers. Part of that experience is the free valuation tool we offer.
We have maintained our share of audience versus competitors and kept full page advert views, our key measure of audience engagement, consistent year on year.
2 Brand: Failure to protect our brand could result in a reduction in audience.
3 Increased competition: Competitors could develop a superior consumer experience which we find hard to replicate, resulting in loss of audience share.
– Advert views – Cross platform minutes
2
Improve stock choice, volumes and accuracy
Consumers visit Auto Trader because of the volume and choice of trusted stock from our fragmented customer base. It’s important we maintain coverage across age, price, region, make and model to ensure we can meet the buying needs of all our consumers. Stock is underpinned by accurate taxonomy, which we continue to improve.
We grew the number of live cars on site 1% in the year, giving consumers greater choice. We offered free consumer adverts for cars priced under £1,000, to gain share in this space.
1 Economy, market and business environment: Declining used cars transactions could lead to a reduction in the amount of car stock in the market.
3 Increased competition: Competitors could expand from specific types of stock, with smaller niche audiences, into other types of stock and disrupt our market position.
– Live stock – Number of retailer forecourts
3
Grow ARPR in a balanced, sustainable way by creating value for our customers
Average Revenue Per Retailer (‘ARPR’) growth is driven by three levers: stock, price and product. Over a three to four-year period we look to balance their contribution, as we seek to attain long-term sustainable growth.
ARPR saw good growth of £149 in 2018. Product was the largest growth contributor, with the launch of our advanced and premium packages, as well as added value products included in the packages. Price and stock also contributed to growth.
1 Economy, market and business environment: Declining new and used cars transactions could lead to a reduction of retailers’ advertising spend, resulting in downgrades and pressure on customer wallet.
4 Failure to innovate: disruptive technologies and changing consumer behaviours: If we rely too much on price and do not innovate our product offering to increase value, we could see downgrades and cancellations offsetting the growth expected from pricing initiatives.
– Revenue – Operating profit – Operating profit margin – Number of retailer forecourts – Average Revenue Per Retailer (‘ARPR’)
– Live stock
4
Enhance our relevance and value to manufacturers
Whilst the majority of our revenue comes from retailers, there is considerable opportunity with manufacturers. We know three out of four consumers are open to buying new cars high up in the buying funnel, which promotes our audience of in-market car buyers as a valuable target audience for manufacturers.
We saw a solid year of growth in our Manufacturer and Agency line. We’ve seen significant investment in the team, recruiting a number of people with OEM experience and investing in our product offering for these customers.
1 Economy, market and business environment: Declining new car registrations could lead to a reduction in manufacturer spend on digital display advertising.
2 Brand: Failure to change perception of manufacturers that we are a destination for new car buyers could result in lost opportunity to attract more of the c.£500 million manufacturers spend on digital advertising.
– Revenue – Operating profit – Operating profit margin – Advert views – Cross platform minutes
5
Extend our product offering further down the buying funnel, towards online transactions
There’s considerable market research suggesting that consumers are becoming more open to the idea of transacting cars online. We believe having the component parts of the deal will be a key differentiator for us as a business.
The business has made good strides in delivering some of the component parts of online transactions. We acquired Motor Trade Delivery (‘MTD’) in April, which acts as a marketplace for logistics companies, and have also developed our finance proposition to display monthly payment prices on Auto Trader.
4 Failure to innovate: disruptive technologies and changing consumer behaviours: If we do not innovate in this area, there is a risk that we miss out on the opportunity to be at the front of industry developments and lose market share.
– Revenue – Operating profit – Operating profit margin – Number of retailer forecourts – Average Revenue Per Retailer (‘ARPR’)
6
Create and maintain high-performing, data-oriented teams
Auto Trader’s people are one of our most important assets. We continually invest in their development, our environment and promoting diversity and inclusion. Data is at the heart of how we operate as a business and how our people work.
We’ve held our headcount flat year-on-year, but have increased our developer and data science ratios. Data continues to play an ever more prominent role driving business decisions, with capability increasing across the organisation.
6 Employees: Manchester and London continue to grow in terms of competition for top talent, particularly in data science and developers.
– Operating profit – Operating profit margin – Number of full-time equivalent employees (‘FTEs’)
Risk management page 32
Principal risks and uncertainties page 34
Our strategy KPIs
Risk that applies to all focus areas:5 IT systems and cyber security
Measures that apply to all focus areas:
– Basic EPS – Cash generated from operations
Strategic report / Governance / Financial statements
21Auto Trader Group plc Annual Report and Financial Statements 2018

KPIsOur business model Our strategyMarket overview
Financial KPIsKey performance indicators
Revenue £m
Average Revenue Per Retailer (‘ARPR’) £ per month
Operating profit £m
Basic EPS pence per share
Cash generated from operations£m
+7% +£149 +10% +15% +£13.2m
2016 2017 2018
330.1
281.6311.4
2016 2017 2018
1,695
1,3841,546
2016 2017 2018
220.6
169.6
203.1
67%65%60%
Margin Margin Margin
2016 2017 2018
17.76
12.67
15.64
2016 2017 2018
226.1
180.1212.9
Relevant focus areas1 2 3 4 5 6
Relevant focus areas1 2 3 4 5 6
Relevant focus areas1 2 3 4 5 6
Relevant focus areas1 2 3 4 5 6
Relevant focus areas1 2 3 4 5 6
DefinitionThe Group generates revenue from three different streams: Trade, Consumer services and Manufacturer and Agency. Trade is further analysed into three classes: Retailer, Home Trader and Other.
ProgressRevenue increased 7% year-on-year, with much of the growth coming through our Retailer line, supported by Manufacturer and Agency. This growth was slightly undermined by a decline in Consumer services, due to a reduction in private listings.
DefinitionAverage Revenue Per Retailer (‘ARPR’) is the average monthly revenue generated from retailer forecourts divided by the average monthly number of retailer forecourts.
ProgressARPR grew £149 in the year. This was largely a function of product growth, as we launched a new set of packages, monetising part-exchange, video, dealer reviews and introducing further prominence products in our new advanced and premium levels. This was supported by a c.3% underlying price rise and modest levels of stock growth.
DefinitionLast year we announced we are no longer reporting Underlying operating profit. Instead, the focus is now on the statutory measure of Operating profit.
Operating profit is as reported in the consolidated income statement on page 88. This is defined as revenue less administrative expenses.
Operating profit margin is Operating profit as a percentage of revenue.
ProgressOperating profit grew 10% due to top line revenue growth of 7% and well managed costs. Margin continued to improve, albeit at a slower rate than previous years.
DefinitionBasic earnings per share is defined as profit for the year attributable to equity holders of the parent divided by the weighted average number of shares in issue during the year.
ProgressBasic EPS grew at 15%, demonstrating the Group’s high operational gearing. Part of the growth drops through from profit, but it was supported by a reduction in the weighted average number of shares in issue during the year.
DefinitionCash generated from operations as reported in the consolidated statement of cash flows on page 92. This is defined as cash generated from operating activities, before corporation tax paid. This is considered to be a more meaningful measure of performance than the statutory measure of cash generated from operating activities, which can be distorted by changes in funding structure and the time lag that applies to the payment of corporation tax.
ProgressCash generated from operations increased to £226.1 million, giving £13.2 million growth in the year. This represented a high proportion of profit converted into cash, which was largely returned to shareholders through dividends and share buybacks.
Relevant risks1 2 3 4 5 6
Relevant risks1 2 3 4 5 6
Relevant risks1 2 3 4 5 6
Relevant risks1 2 3 4 5 6
Relevant risks1 2 3 4 5 6
£
22 Auto Trader Group plc Annual Report and Financial Statements 2018

KPIs
Revenue £m
Average Revenue Per Retailer (‘ARPR’) £ per month
Operating profit £m
Basic EPS pence per share
Cash generated from operations£m
+7% +£149 +10% +15% +£13.2m
2016 2017 2018
330.1
281.6311.4
2016 2017 2018
1,695
1,3841,546
2016 2017 2018
220.6
169.6
203.1
67%65%60%
Margin Margin Margin
2016 2017 2018
17.76
12.67
15.64
2016 2017 2018
226.1
180.1212.9
Relevant focus areas1 2 3 4 5 6
Relevant focus areas1 2 3 4 5 6
Relevant focus areas1 2 3 4 5 6
Relevant focus areas1 2 3 4 5 6
Relevant focus areas1 2 3 4 5 6
DefinitionThe Group generates revenue from three different streams: Trade, Consumer services and Manufacturer and Agency. Trade is further analysed into three classes: Retailer, Home Trader and Other.
ProgressRevenue increased 7% year-on-year, with much of the growth coming through our Retailer line, supported by Manufacturer and Agency. This growth was slightly undermined by a decline in Consumer services, due to a reduction in private listings.
DefinitionAverage Revenue Per Retailer (‘ARPR’) is the average monthly revenue generated from retailer forecourts divided by the average monthly number of retailer forecourts.
ProgressARPR grew £149 in the year. This was largely a function of product growth, as we launched a new set of packages, monetising part-exchange, video, dealer reviews and introducing further prominence products in our new advanced and premium levels. This was supported by a c.3% underlying price rise and modest levels of stock growth.
DefinitionLast year we announced we are no longer reporting Underlying operating profit. Instead, the focus is now on the statutory measure of Operating profit.
Operating profit is as reported in the consolidated income statement on page 88. This is defined as revenue less administrative expenses.
Operating profit margin is Operating profit as a percentage of revenue.
ProgressOperating profit grew 10% due to top line revenue growth of 7% and well managed costs. Margin continued to improve, albeit at a slower rate than previous years.
DefinitionBasic earnings per share is defined as profit for the year attributable to equity holders of the parent divided by the weighted average number of shares in issue during the year.
ProgressBasic EPS grew at 15%, demonstrating the Group’s high operational gearing. Part of the growth drops through from profit, but it was supported by a reduction in the weighted average number of shares in issue during the year.
DefinitionCash generated from operations as reported in the consolidated statement of cash flows on page 92. This is defined as cash generated from operating activities, before corporation tax paid. This is considered to be a more meaningful measure of performance than the statutory measure of cash generated from operating activities, which can be distorted by changes in funding structure and the time lag that applies to the payment of corporation tax.
ProgressCash generated from operations increased to £226.1 million, giving £13.2 million growth in the year. This represented a high proportion of profit converted into cash, which was largely returned to shareholders through dividends and share buybacks.
Relevant risks1 2 3 4 5 6
Relevant risks1 2 3 4 5 6
Relevant risks1 2 3 4 5 6
Relevant risks1 2 3 4 5 6
Relevant risks1 2 3 4 5 6
Linked to remuneration
£
Directors’ remuneration report page 66
Focus areas relevant to our KPIs
Improve car buying in the UK
1 Increase consumer audience, advert views and use of our valuation tools
2 Improve stock choice, volumes and accuracy
Evolve the automotive ecosystem in the UK
3 Grow ARPR in a balanced, sustainable way by creating value for our customers
4 Enhance our relevance and value to manufacturers
5 Extend our product offering further down the buying funnel, towards online transactions
Become the most admired digital business
6 Create and maintain high-performing, data-oriented teams
Our strategy page 20
Risks relevant to our KPIs
1 Economy, market and business environment
2 Brand
3 Increased competition
4 Failure to innovate: disruptive technologies and changing consumer behaviours
5 IT systems and cyber security
6 Employee retention
Principal risks and uncertainties page 34
Strategic report / Governance / Financial statements
23Auto Trader Group plc Annual Report and Financial Statements 2018

KPIsOur business model Our strategyMarket overview
Operational KPIsKey performance indicators continued
Cross platform minutes Monthly average minutes spent across all our platforms (millions)
Advert viewsAverage number per month (millions)
Number of retailer forecourtsAverage number per month
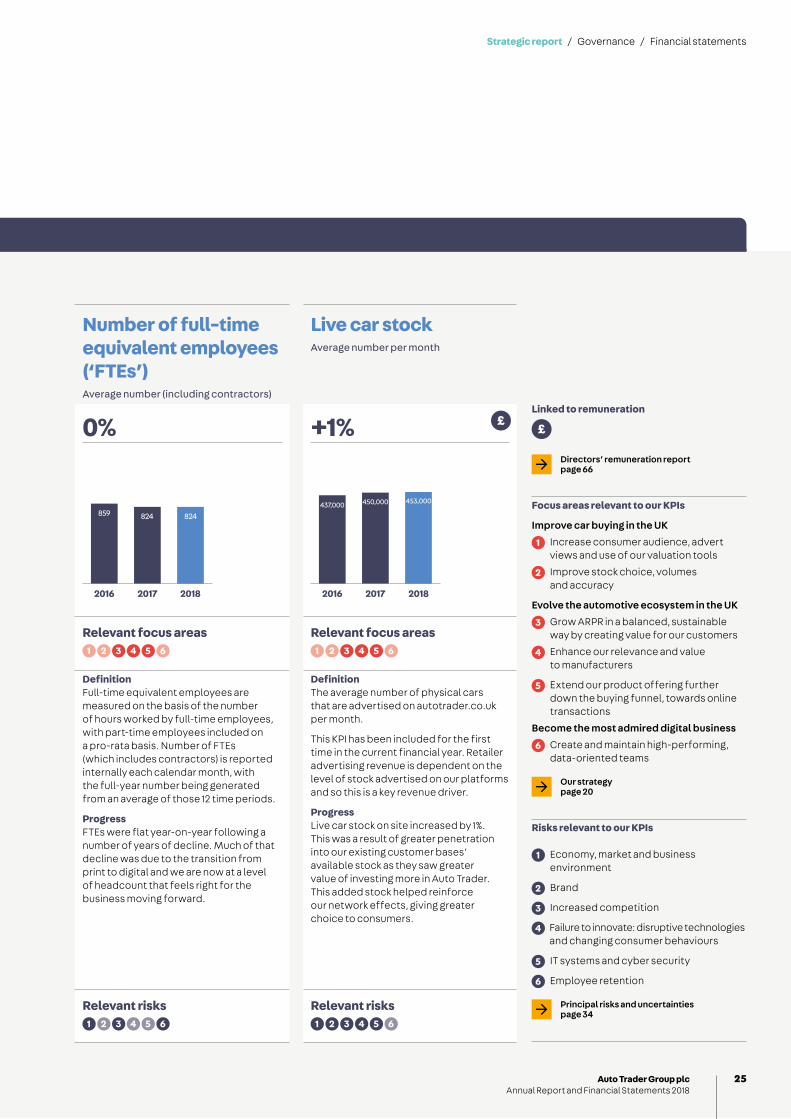
Number of full-time equivalent employees (‘FTEs’) Average number (including contractors)
Live car stockAverage number per month
+6% -0% -1% 0% +1%
2016 2017 2018
618
521582
2016 2017 2018
246243 247
2016 2017 2018
13,21313,514 13,296
2016 2017 2018
824859 824
20172016 2018
453,000450,000437,000
Relevant focus areas1 2 3 4 5 6
Relevant focus areas1 2 3 4 5 6
Relevant focus areas1 2 3 4 5 6
Relevant focus areas1 2 3 4 5 6
Relevant focus areas1 2 3 4 5 6
DefinitionMonthly average minutes spent across all our platforms, as defined by comScore.
ProgressCross platform minutes, as measured by comScore, increased 6% year-on-year. This was in part due to a methodology change in calculation, however we’ve retained our market share when measured against our competitor set.
DefinitionAdvert views are click-throughs from initial search result pages to see the more detailed specification of the vehicle. Research has shown that a higher level of advert views correlates with a higher number of retailer sales.
ProgressAdvert views were broadly flat in the year. The absolute volume remains high as we delivered on average 246 million advert views per month, a considerable volume of engagement for our customers with their adverts.
DefinitionThe average number of retailer forecourts per month that are advertising vehicles on the Auto Trader marketplace over the financial year.
ProgressNumber of retailer forecourts was flat, following a year of decline in 2017. We still saw a small level of decline in independent forecourts, but this was offset by growth in Franchise and non-car channels.
DefinitionFull-time equivalent employees are measured on the basis of the number of hours worked by full-time employees, with part-time employees included on a pro-rata basis. Number of FTEs (which includes contractors) is reported internally each calendar month, with the full-year number being generated from an average of those 12 time periods.
ProgressFTEs were flat year-on-year following a number of years of decline. Much of that decline was due to the transition from print to digital and we are now at a level of headcount that feels right for the business moving forward.
DefinitionThe average number of physical cars that are advertised on autotrader.co.uk per month.
This KPI has been included for the first time in the current financial year. Retailer advertising revenue is dependent on the level of stock advertised on our platforms and so this is a key revenue driver.
ProgressLive car stock on site increased by 1%. This was a result of greater penetration into our existing customer bases’ available stock as they saw greater value of investing more in Auto Trader. This added stock helped reinforce our network effects, giving greater choice to consumers.
Relevant risks1 2 3 4 5 6
Relevant risks1 2 3 4 5 6
Relevant risks1 2 3 4 5 6
Relevant risks1 2 3 4 5 6
Relevant risks1 2 3 4 5 6
£
24 Auto Trader Group plc Annual Report and Financial Statements 2018
KPIs
Cross platform minutes Monthly average minutes spent across all our platforms (millions)
Advert viewsAverage number per month (millions)
Number of retailer forecourtsAverage number per month
Number of full-time equivalent employees (‘FTEs’) Average number (including contractors)
Live car stockAverage number per month
+6% -0% -1% 0% +1%
2016 2017 2018
618
521582
2016 2017 2018
246243 247
2016 2017 2018
13,21313,514 13,296
2016 2017 2018
824859 824
20172016 2018
453,000450,000437,000
Relevant focus areas1 2 3 4 5 6
Relevant focus areas1 2 3 4 5 6
Relevant focus areas1 2 3 4 5 6
Relevant focus areas1 2 3 4 5 6
Relevant focus areas1 2 3 4 5 6
DefinitionMonthly average minutes spent across all our platforms, as defined by comScore.
ProgressCross platform minutes, as measured by comScore, increased 6% year-on-year. This was in part due to a methodology change in calculation, however we’ve retained our market share when measured against our competitor set.
DefinitionAdvert views are click-throughs from initial search result pages to see the more detailed specification of the vehicle. Research has shown that a higher level of advert views correlates with a higher number of retailer sales.
ProgressAdvert views were broadly flat in the year. The absolute volume remains high as we delivered on average 246 million advert views per month, a considerable volume of engagement for our customers with their adverts.
DefinitionThe average number of retailer forecourts per month that are advertising vehicles on the Auto Trader marketplace over the financial year.
ProgressNumber of retailer forecourts was flat, following a year of decline in 2017. We still saw a small level of decline in independent forecourts, but this was offset by growth in Franchise and non-car channels.
DefinitionFull-time equivalent employees are measured on the basis of the number of hours worked by full-time employees, with part-time employees included on a pro-rata basis. Number of FTEs (which includes contractors) is reported internally each calendar month, with the full-year number being generated from an average of those 12 time periods.
ProgressFTEs were flat year-on-year following a number of years of decline. Much of that decline was due to the transition from print to digital and we are now at a level of headcount that feels right for the business moving forward.
DefinitionThe average number of physical cars that are advertised on autotrader.co.uk per month.
This KPI has been included for the first time in the current financial year. Retailer advertising revenue is dependent on the level of stock advertised on our platforms and so this is a key revenue driver.
ProgressLive car stock on site increased by 1%. This was a result of greater penetration into our existing customer bases’ available stock as they saw greater value of investing more in Auto Trader. This added stock helped reinforce our network effects, giving greater choice to consumers.
Relevant risks1 2 3 4 5 6
Relevant risks1 2 3 4 5 6
Relevant risks1 2 3 4 5 6
Relevant risks1 2 3 4 5 6
Relevant risks1 2 3 4 5 6
£Linked to remuneration
£
Directors’ remuneration report page 66
Focus areas relevant to our KPIs
Improve car buying in the UK
1 Increase consumer audience, advert views and use of our valuation tools
2 Improve stock choice, volumes and accuracy
Evolve the automotive ecosystem in the UK
3 Grow ARPR in a balanced, sustainable way by creating value for our customers
4 Enhance our relevance and value to manufacturers
5 Extend our product offering further down the buying funnel, towards online transactions
Become the most admired digital business
6 Create and maintain high-performing, data-oriented teams
Our strategy page 20
Risks relevant to our KPIs
1 Economy, market and business environment
2 Brand
3 Increased competition
4 Failure to innovate: disruptive technologies and changing consumer behaviours
5 IT systems and cyber security
6 Employee retention
Principal risks and uncertainties page 34
Strategic report / Governance / Financial statements
25Auto Trader Group plc Annual Report and Financial Statements 2018

Innovation and growthOperating and financial review
Key performance indicators page 22
“Despite the backdrop of a slightly tougher market, we have continued to deliver improvements for customers, consumers and our business which has resulted in a strong financial performance.”
IntroductionWe are pleased with the progress we have made this year, both from an operational and financial perspective. Despite the backdrop of a slightly tougher market, we have continued to deliver improvements for customers, consumers and our business which has resulted in a strong financial performance.
Improving car buying in the UKWe have launched new products that make car buying more efficient, with the most prominent of these being the ability to search for a car by monthly payment. With over half of car buyers (52%) considering the price of their next car as a monthly figure rather than the full advertised price1, we responded by launching the ability for consumers to search for their next car by monthly payment in December 2017.
The change was not only designed to meet consumers’ growing expectations of being able to search for everything they buy on monthly payments, but also to support retailers attract more buyers to their cars and increase their finance penetration by promoting their own finance offers much earlier on in the buying journey.
At the start of the year we relaunched our retailer advertising packages, so that our entry level starter package now includes products such as: 100 images, Live Chat, Dealer Reviews, and the Part-Exchange Guide. We also offer progressively higher package levels, giving retailers the
Nathan CoeChief Financial Officer and Chief Operating Officer
Average advert views per month
246m
Average cross platform minutes per month6
618m
Operating review
26 Auto Trader Group plc Annual Report and Financial Statements 2018

Our business model page 18
Our strategy page 20
opportunity to pay for greater prominence to stand out in search. Alongside these changes to our core packages we also re-platformed our core vehicle upload process to make it both easier and quicker for retailers to advertise stock on our marketplace.
We have continued our focus on growing penetration of our ‘Managing’ products: i-Control and Retail Check. Approximately 3,000 retailer forecourts (2017: 2,500) listing 39% of trade stock, are using at least one of these data analytics products, which we have improved by adding Price Indicator flags and evolving our valuation engine with machine learning to take into account vehicle specification – a first for the UK market.
We continue to invest in our brand to ensure it stays front of mind with consumers. Auto Trader enjoys 91% prompted brand awareness2 with consumers and is consistently voted as the most influential automotive website by consumers in the car buying process. We redesigned our website and native apps, and improved functionality to better reflect our position as the number one marketplace for both used and new cars.
With three out of every four visitors to Auto Trader considering purchasing a new car3, we have developed new products that allow manufacturers and their agencies to reach and influence these buyers. In the last 12 months we launched InSearch, our native advertising performance product, which allows new cars to be promoted within search in a highly targeted way. More recently we have further developed this product to include a video format allowing us to capitalise on the fast growth in video advertising.
Both manufacturers and retailers can now use our Search API service to operate their websites, saving them the effort of building backend systems and allowing them to benefit from our taxonomy, valuations and product improvements. They can also benefit from a new Image app, which enables them to take 360-degree interior and exterior shots that meet manufacturer standards.
Maintaining our market leading positionWe have a market leading position as the UK’s largest digital automotive marketplace. Our audience has grown as consumers spend more time on our platforms, viewing an average of 94 adverts every second of every day4, and the vast majority of this audience remains unique to Auto Trader. Our audience is three times larger than that of our nearest competitor, with our share of cross platform visits for the year at 54% on average5, whilst total minutes spent increased by 6%6. Full page advert views were consistent year-on-year at 246 million per month (2017: 247 million).
We have increased the level of physical stock on site, with the average number of cars on the marketplace increasing 1% to 453,000 (2017: 450,000). The average number of retailer forecourts using our marketplace declined slightly in the year at 13,213 (2017: 13,296) following a 2% decline last year.
Average number of retailer forecourts advertising per month
13,213
Average number of live car stock advertised on our site per month
453,000
1 Auto Trader Market Report (March 2018).2 Acacia Avenue Brand Tracker (March 2018).3 Auto Trader search data (2017).4 Auto Trader internal data.5 Monthly visits as measured by comScore.6 Monthly minutes as measured by comScore.
Strategic report / Governance / Financial statements
27Auto Trader Group plc Annual Report and Financial Statements 2018

2016
3341
58
2017
28
86
48
2018
86
43
20
ARPR levers(£)
Key
Price Stock Product
Operating and financial review continued
RevenueIn 2018, revenue grew 7% to £330.1m (2017: £311.4m) predominantly through Trade revenue, and more specifically Retailer revenue, as our core business continued to grow.
Trade revenue increased by 8% to £281.2m. Retailer revenue grew 9% to £268.7m (2017: £250.1m) as a result of growth in ARPR, where there was improvement of £149 to £1,695 per month (2017: £1,546). Average retailer forecourts declined by 1% in the year to 13,213 (2017: 13,296).
ARPR growth of £149 per month was generated through all three of our levers: price, stock and product.
– Price: Our price lever contributed £43 (2017: £86) and 29% (2017: 53%) of total ARPR growth. We restructured our retailer advertising packages to include enhanced features for all customers as part of their subscription. All packages now have Dealer Reviews, Part-Exchange Guide, 100 Images and Live Chat – tools which not only help retailers to compete effectively, but also provide the best experience for car buyers. We also launched two new package tiers – Advanced and Premium – which give customers the opportunity to pay more for greater prominence when consumers search for cars.
– Stock: Our stock lever contributed £20 (2017: £48) and 13% (2017: 30%) of total ARPR growth. The average number of cars advertised on autotrader.co.uk each month increased by 1% in 2018 to 453,000 (2017: 450,000) as the number of cars advertised per retailer forecourt increased. Used car transactions in the UK decreased by 3% in the 12 months to March 2018, however the UK car parc continues to grow as new car registrations exceed scrappage rates.
– Product: Our product lever contributed £86 (2017: £28) and 58% (2017: 17%) of total ARPR growth. The launch of Advanced and Premium advertising package levels contributed to this growth, with 12% of retailer car stock moving into one of these new higher-priced tiers by the end of the year. The penetration of our ‘Managing’ products (i-Control and Retail Check) increased from 19% in 2017 to 23% in the current year.
Home Trader declined 4% to £11.4m (2017: £12.0m). Other revenue comprises logistics revenue from Motor Trade Delivery, which contributed £1.1m since its acquisition in April 2017.
Revenue2018
£m2017
£mDays-adjusted
change
Retailer 268.7 250.1 9%
Home Trader 11.4 12.0 (4%)
Other 1.1 – n/m
Trade 281.2 262.1 8%
Consumer services 29.8 31.8 (5%)
Manufacturer and Agency 19.1 17.5 10%
Total 330.1 311.4 7%
+7%Revenue
£330.1m(2017: £311.4m)
+10%Operating profit
£220.6m(2017: £203.1m)
Cash generated from operations
£226.1m(2017: £212.9m)
Cash returned to shareholders
£148.4m(2017: £128.7m)
Financial review
28 Auto Trader Group plc Annual Report and Financial Statements 2018

Consumer services revenue decreased 5% in the year to £29.8m (2017: £31.8m). Private revenue decreased 11% to £21.6m (2017: £24.4m). Motoring services revenue grew 12% to £8.2m (2017: £7.4m), with a large proportion of the growth coming through delivering greater response to our third-party partner for finance.
Manufacturer and Agency revenue grew 10% to £19.1m (2017: £17.5m). The automotive industry spends a huge amount on advertising every year and the addressable digital market continues to grow. In order to grow our market share, we have invested in people, with experience of working at some of the largest manufacturers; and content, by innovating new products such as InSearch. InSearch is our native performance product, which allows manufacturers to advertise new cars directly within our main search, providing a highly targeted way to influence in-market car buyers.
Administrative expensesOperating costs continue to be well controlled, with administrative expenses increasing by 2% to £109.5m (2017: £108.3m).
People costs, which comprise staff costs (excluding share-based payments) and third-party contractor costs, increased 4% in the year to £51.1m (2017: £49.5m). Full-time equivalent employees (‘FTEs’) (including contractors) remained flat at an average of 824 (2017: 824).
A share-based payment charge of £3.7m (2017: £4.5m) was recognised during the year, including national insurance costs (‘NI’) on potential employee gains where applicable. The year-on-year decrease in the charge was primarily due to leavers under the Performance Share Plan, offset by further Performance Share Plan awards made in June 2017. We also launched a second Save As You Earn scheme in November 2017 which was available to all eligible employees.
Marketing spend was flat at £16.3m (2017: £16.0m), reflecting the release of our ‘Next Car’ campaign across TV and radio platforms. Other costs, which include property costs, data services and other overheads, increased in the year to £31.3m (2017: £30.7m).
Depreciation and amortisation decreased by 10% to £7.1m (2017: £8.0m). Within this cost line is £1.0m of amortisation from intangibles recognised following the acquisition of MTD.
Change from 52-week to annual accounting periodAs the 2017 financial year was four days longer than the 2018 financial year, year-on-year percentages for revenue, costs, profit, EPS and dividend per share have been adjusted throughout this report to reflect like-for-like growth.
Costs2018
£m2017
£mDays-adjusted
change
People costs 51.1 49.5 4%
Share-based payments 3.7 4.5 (17%)
Marketing 16.3 16.0 3%
Other costs 31.3 30.7 3%
Depreciation and amortisation 7.1 8.0 (10%)
Exceptional items – (0.4) n/m
Total administrative expenses 109.5 108.3 2%
Operating profitIn the year, Operating profit grew 10% to £220.6m (2017: £203.1m). Operating profit margin increased two percentage points to 67% (2017: 65%).
The Group previously used a measure of Underlying operating profit to highlight the impact of certain one-off and other items, including exceptional items, share-based payment charges and costs related to management incentive schemes linked to the previous private ownership of the Group. From this financial year the Group will no longer report Underlying operating profit and instead will focus on the statutory measure of Operating profit.
Strategic report / Governance / Financial statements
29Auto Trader Group plc Annual Report and Financial Statements 2018

Operating and financial review continued
Earnings per shareBasic earnings per share rose by 15% to 17.76 pence (2017: 15.64 pence) based on a weighted average number of ordinary shares in issue of 964,516,212 (2017: 989,278,991). Diluted earnings per share of 17.70 pence (2017: 15.60 pence) increased by 15%, based on 967,912,689 shares (2017: 991,812,212) which takes into account the dilutive impact of outstanding share awards.
Cash flow and net external debtCash generated from operations increased to £226.1m (2017: £212.9m) and was achieved as a result of strong Operating profit and a high level of cash conversion.
Corporation tax payments totalled £39.4m (2017: £34.8m). Cash generated from operating activities was £186.7m (2017: £178.1m).
Interest paid on financing arrangements was £6.7m (2017: £7.6m). Net external debt reduced to £338.7m (2017: £355.0m) following Term Loan repayments of £20.0m (2017: £40.0m). Leverage, defined as the ratio of net external debt to Adjusted underlying EBITDA, decreased to 1.46x (2017: 1.65x).
AcquisitionOn 25 April 2017, the Group acquired MTD for a total cash consideration of £12.2m, less cash acquired with the business of £0.3m. The assets and liabilities acquired have been accounted for at fair value in accordance with IFRS 3, as described in note 26 to the financial statements, with the remaining value of £8.5m being allocated to goodwill.
Profit before taxation Profit before taxation increased by 10% to £210.8m (2017: £193.4m). Finance costs remained stable year-on-year at £9.8m (2017: £9.7m). A year-on-year reduction in the average level of gross debt drawn, coupled with a margin benefit resulting from a reduction in the Group’s leverage, resulted in a reduced interest cost on the Group’s term loan. This was offset by an increase in the amount of debt issue costs that were amortised, with an acceleration of £1.1m of these costs recognised in the year following the decision in the year to refinance the debt facility by June 2018.
TaxationThe Group tax charge of £39.5m (2017: £38.7m) represents an effective tax rate of 19% (2017: 20%) which is in line with the average standard UK rate.
30 Auto Trader Group plc Annual Report and Financial Statements 2018
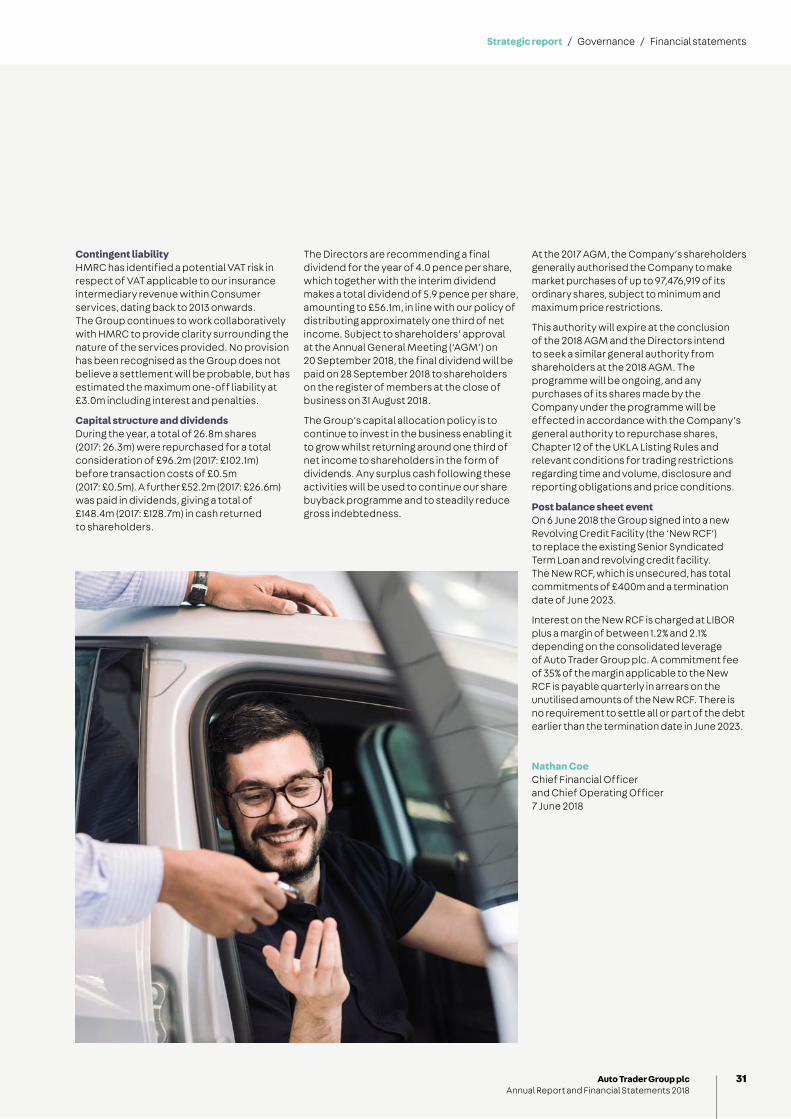
Contingent liability HMRC has identified a potential VAT risk in respect of VAT applicable to our insurance intermediary revenue within Consumer services, dating back to 2013 onwards. The Group continues to work collaboratively with HMRC to provide clarity surrounding the nature of the services provided. No provision has been recognised as the Group does not believe a settlement will be probable, but has estimated the maximum one-off liability at £3.0m including interest and penalties.
Capital structure and dividendsDuring the year, a total of 26.8m shares (2017: 26.3m) were repurchased for a total consideration of £96.2m (2017: £102.1m) before transaction costs of £0.5m (2017: £0.5m). A further £52.2m (2017: £26.6m) was paid in dividends, giving a total of £148.4m (2017: £128.7m) in cash returned to shareholders.
The Directors are recommending a final dividend for the year of 4.0 pence per share, which together with the interim dividend makes a total dividend of 5.9 pence per share, amounting to £56.1m, in line with our policy of distributing approximately one third of net income. Subject to shareholders’ approval at the Annual General Meeting (‘AGM’) on 20 September 2018, the final dividend will be paid on 28 September 2018 to shareholders on the register of members at the close of business on 31 August 2018.
The Group’s capital allocation policy is to continue to invest in the business enabling it to grow whilst returning around one third of net income to shareholders in the form of dividends. Any surplus cash following these activities will be used to continue our share buyback programme and to steadily reduce gross indebtedness.
At the 2017 AGM, the Company’s shareholders generally authorised the Company to make market purchases of up to 97,476,919 of its ordinary shares, subject to minimum and maximum price restrictions.
This authority will expire at the conclusion of the 2018 AGM and the Directors intend to seek a similar general authority from shareholders at the 2018 AGM. The programme will be ongoing, and any purchases of its shares made by the Company under the programme will be effected in accordance with the Company’s general authority to repurchase shares, Chapter 12 of the UKLA Listing Rules and relevant conditions for trading restrictions regarding time and volume, disclosure and reporting obligations and price conditions.
Post balance sheet eventOn 6 June 2018 the Group signed into a new Revolving Credit Facility (the ‘New RCF‘) to replace the existing Senior Syndicated Term Loan and revolving credit facility. The New RCF, which is unsecured, has total commitments of £400m and a termination date of June 2023.
Interest on the New RCF is charged at LIBOR plus a margin of between 1.2% and 2.1% depending on the consolidated leverage of Auto Trader Group plc. A commitment fee of 35% of the margin applicable to the New RCF is payable quarterly in arrears on the unutilised amounts of the New RCF. There is no requirement to settle all or part of the debt earlier than the termination date in June 2023.
Nathan CoeChief Financial Officer and Chief Operating Officer7 June 2018
Strategic report / Governance / Financial statements
31Auto Trader Group plc Annual Report and Financial Statements 2018
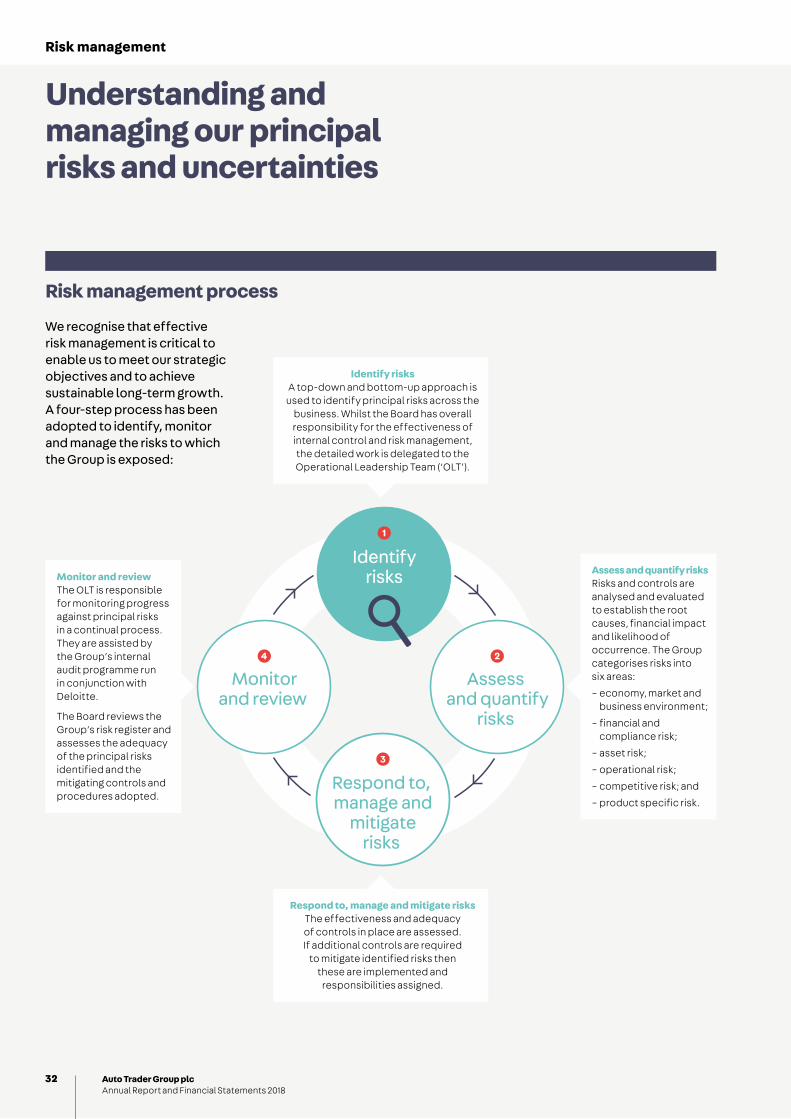
2
Assess and quantify
risks
4
Monitorand review
3
Respond to, manage and
mitigaterisks
1
Identifyrisks
Understanding and managing our principal risks and uncertainties
Risk management
We recognise that effective risk management is critical to enable us to meet our strategic objectives and to achieve sustainable long-term growth. A four-step process has been adopted to identify, monitor and manage the risks to which the Group is exposed:
Risk management process
Monitor and review The OLT is responsible for monitoring progress against principal risks in a continual process. They are assisted by the Group’s internal audit programme run in conjunction with Deloitte.
The Board reviews the Group’s risk register and assesses the adequacy of the principal risks identified and the mitigating controls and procedures adopted.
Identify risksA top-down and bottom-up approach is
used to identify principal risks across the business. Whilst the Board has overall responsibility for the effectiveness of internal control and risk management, the detailed work is delegated to the Operational Leadership Team (‘OLT’).
Respond to, manage and mitigate risksThe effectiveness and adequacy of controls in place are assessed. If additional controls are required
to mitigate identified risks then these are implemented and
responsibilities assigned.
Assess and quantify risksRisks and controls are analysed and evaluated to establish the root causes, financial impact and likelihood of occurrence. The Group categorises risks into six areas:
– economy, market and business environment;
– financial and compliance risk;
– asset risk;
– operational risk;
– competitive risk; and
– product specific risk.
32 Auto Trader Group plc Annual Report and Financial Statements 2018

Board
Exte
rnal
aud
itor Internal auditor
Operational Leadership Team
Risk register and risk review
Operational management
Audit Committee
Our strategy page 20
Key performance indicators page 22
Risks are reviewed on an ongoing basis and are captured in a risk register, identifying the risk area, the likelihood of the risk occurring, the impact if it does occur and the actions being taken to manage the risk to the desired level. The Board’s role is to consider whether, given the risk appetite of the Group, the level of risk is acceptable within its strategy.
The roles and responsibilities of each level of this framework are as follows:
Our framework
Risk governance and responsibilities
The Board’s responsibilities – Overall responsibility for risk management.
The Audit Committee’s responsibilities
– Assess the scope and effectiveness of risk management processes and internal control systems.
Operational Leadership Team responsibilities
– Identify, assess, monitor, manage and mitigate risks and exploit opportunities;
– Ensure appropriate internal controls are in place;
– Ensure the risk register is properly maintained; and
– Embed risk management as business as usual.
Operational management and internal controls
– Embed and manage internal controls and risk management day to day as part of business as usual.
Oversight functions and internal audit
– Aid in setting appropriate policies, provide guidance, advice and direction on implementation of those policies and monitor the first line of defence.
Additional line of defence – External auditor.
Strategic report / Governance / Financial statements
33Auto Trader Group plc Annual Report and Financial Statements 2018
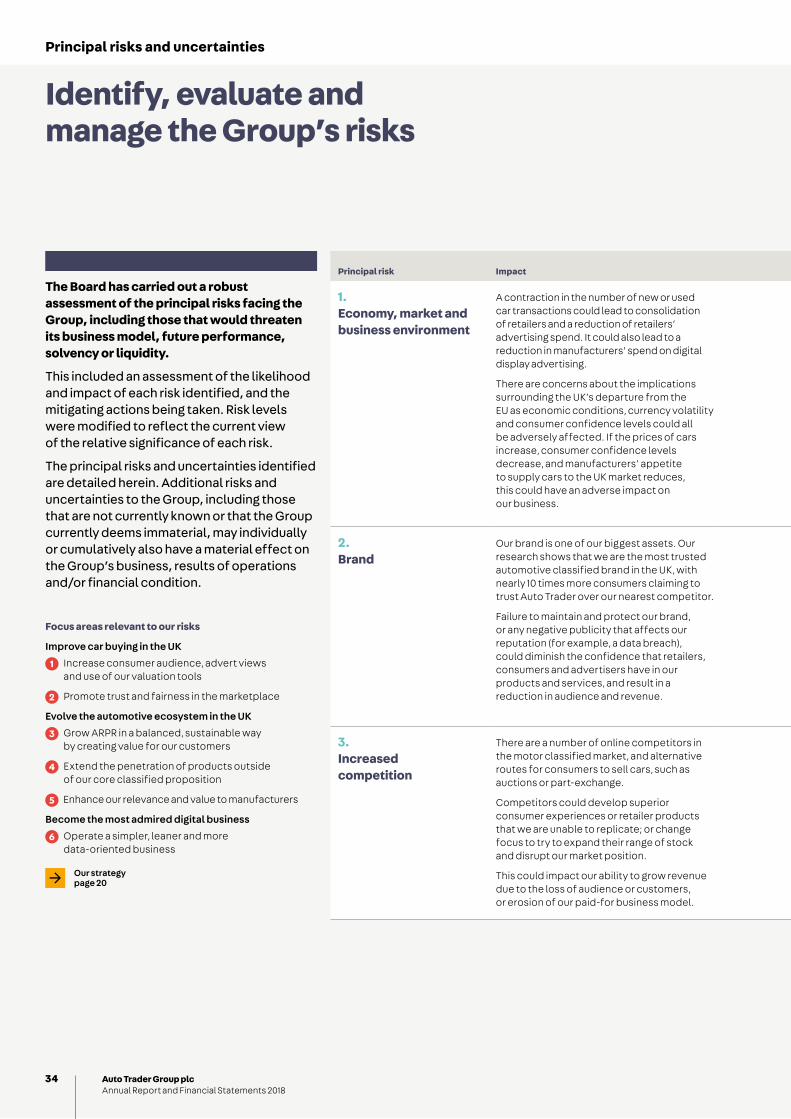
Identify, evaluate and manage the Group’s risks
Principal risks and uncertainties
Focus areas relevant to our risks
Improve car buying in the UK
1 Increase consumer audience, advert views and use of our valuation tools
2 Promote trust and fairness in the marketplace
Evolve the automotive ecosystem in the UK
3 Grow ARPR in a balanced, sustainable way by creating value for our customers
4 Extend the penetration of products outside of our core classified proposition
5 Enhance our relevance and value to manufacturers
Become the most admired digital business
6 Operate a simpler, leaner and more data-oriented business
Our strategy page 20
The Board has carried out a robust assessment of the principal risks facing the Group, including those that would threaten its business model, future performance, solvency or liquidity.
This included an assessment of the likelihood and impact of each risk identified, and the mitigating actions being taken. Risk levels were modified to reflect the current view of the relative significance of each risk.
The principal risks and uncertainties identified are detailed herein. Additional risks and uncertainties to the Group, including those that are not currently known or that the Group currently deems immaterial, may individually or cumulatively also have a material effect on the Group’s business, results of operations and/or financial condition.
Principal risk Impact Changes in the year Key mitigationsRelevant focus areas Change
1. Economy, market and business environment
A contraction in the number of new or used car transactions could lead to consolidation of retailers and a reduction of retailers’ advertising spend. It could also lead to a reduction in manufacturers’ spend on digital display advertising.
There are concerns about the implications surrounding the UK’s departure from the EU as economic conditions, currency volatility and consumer confidence levels could all be adversely affected. If the prices of cars increase, consumer confidence levels decrease, and manufacturers’ appetite to supply cars to the UK market reduces, this could have an adverse impact on our business.
As we anticipated, new car sales have fallen during this financial year, and the used car market has also seen declines of around 3%.
However, the overall UK car parc has continued to grow as the number of cars registered still outweighs the number of cars that are scrapped each year.
The number of retailer forecourts has remained relatively flat.
We monitor new and used car transactions closely, using data from SMMT and now also data directly from the DVLA.
We have developed the Auto Trader Retail Price Index to monitor the pricing trends of used cars by trade sellers.
We continue to diversify into related and adjacent activities to reduce our reliance on stock and to improve the resilience of our business model.
We closely manage our cost base and operate on a lean basis, and would be able to respond swiftly in the event of a downturn.
The Board has considered the potential implications of the UK’s departure from the EU, taking into account the factors above, as well as the time lag between the registration of new cars and the entry of cars into the used car marketplace and the strength of our value proposition, and does not consider that there will be a significant impact on our business.
1 2 3
4 5 6
2. Brand
Our brand is one of our biggest assets. Our research shows that we are the most trusted automotive classified brand in the UK, with nearly 10 times more consumers claiming to trust Auto Trader over our nearest competitor.
Failure to maintain and protect our brand, or any negative publicity that affects our reputation (for example, a data breach), could diminish the confidence that retailers, consumers and advertisers have in our products and services, and result in a reduction in audience and revenue.
Our research shows that Auto Trader has 91% prompted brand awareness with consumers for new and used cars and is consistently voted as the most influential automotive website by consumers in the car buying process.
We have seen a significant reduction in fraudulent and misleading adverts, due to additional measures and monitoring techniques used by our security team.
We have a clear and open culture with a focus on trust and transparency.
We have a dedicated customer security team, who closely monitor our site to identify and quickly remove fraudulent or misleading adverts.
We invest in new and innovative marketing campaigns and new ways of engaging car buyers to continue to maintain brand awareness, and to change perceptions of Auto Trader to be a destination for new cars as well as used.
Our approach to cyber security and data protection, as described on page 36, helps to protect us from the adverse impact of a significant data breach or cyber attack.
1 2 3
4 5 6
3. Increased competition
There are a number of online competitors in the motor classified market, and alternative routes for consumers to sell cars, such as auctions or part-exchange.
Competitors could develop superior consumer experiences or retailer products that we are unable to replicate; or change focus to try to expand their range of stock and disrupt our market position.
This could impact our ability to grow revenue due to the loss of audience or customers, or erosion of our paid-for business model.
The competitive landscape continues to develop, with new business models emerging.
Big media players are also entering the marketplace, mostly competing for lower-value private sales.
We have the largest and most engaged audience of any UK automotive site. Our investment in brand as described above helps us to protect and grow our audience, to ensure that we remain the most influential website a consumer visits when purchasing a vehicle.
We have a dedicated competitors’ guild to closely monitor competitor activity.
We continue to invest in and develop our product offering to improve the value we offer to consumers, retailers and manufacturers.
We work in an agile way and can respond quickly to emerging competitive threats.
1 2 3
4 5 6
34 Auto Trader Group plc Annual Report and Financial Statements 2018

Principal risk Impact Changes in the year Key mitigationsRelevant focus areas Change
1. Economy, market and business environment
A contraction in the number of new or used car transactions could lead to consolidation of retailers and a reduction of retailers’ advertising spend. It could also lead to a reduction in manufacturers’ spend on digital display advertising.
There are concerns about the implications surrounding the UK’s departure from the EU as economic conditions, currency volatility and consumer confidence levels could all be adversely affected. If the prices of cars increase, consumer confidence levels decrease, and manufacturers’ appetite to supply cars to the UK market reduces, this could have an adverse impact on our business.
As we anticipated, new car sales have fallen during this financial year, and the used car market has also seen declines of around 3%.
However, the overall UK car parc has continued to grow as the number of cars registered still outweighs the number of cars that are scrapped each year.
The number of retailer forecourts has remained relatively flat.
We monitor new and used car transactions closely, using data from SMMT and now also data directly from the DVLA.
We have developed the Auto Trader Retail Price Index to monitor the pricing trends of used cars by trade sellers.
We continue to diversify into related and adjacent activities to reduce our reliance on stock and to improve the resilience of our business model.
We closely manage our cost base and operate on a lean basis, and would be able to respond swiftly in the event of a downturn.
The Board has considered the potential implications of the UK’s departure from the EU, taking into account the factors above, as well as the time lag between the registration of new cars and the entry of cars into the used car marketplace and the strength of our value proposition, and does not consider that there will be a significant impact on our business.
1 2 3
4 5 6
2. Brand
Our brand is one of our biggest assets. Our research shows that we are the most trusted automotive classified brand in the UK, with nearly 10 times more consumers claiming to trust Auto Trader over our nearest competitor.
Failure to maintain and protect our brand, or any negative publicity that affects our reputation (for example, a data breach), could diminish the confidence that retailers, consumers and advertisers have in our products and services, and result in a reduction in audience and revenue.
Our research shows that Auto Trader has 91% prompted brand awareness with consumers for new and used cars and is consistently voted as the most influential automotive website by consumers in the car buying process.
We have seen a significant reduction in fraudulent and misleading adverts, due to additional measures and monitoring techniques used by our security team.
We have a clear and open culture with a focus on trust and transparency.
We have a dedicated customer security team, who closely monitor our site to identify and quickly remove fraudulent or misleading adverts.
We invest in new and innovative marketing campaigns and new ways of engaging car buyers to continue to maintain brand awareness, and to change perceptions of Auto Trader to be a destination for new cars as well as used.
Our approach to cyber security and data protection, as described on page 36, helps to protect us from the adverse impact of a significant data breach or cyber attack.
1 2 3
4 5 6
3. Increased competition
There are a number of online competitors in the motor classified market, and alternative routes for consumers to sell cars, such as auctions or part-exchange.
Competitors could develop superior consumer experiences or retailer products that we are unable to replicate; or change focus to try to expand their range of stock and disrupt our market position.
This could impact our ability to grow revenue due to the loss of audience or customers, or erosion of our paid-for business model.
The competitive landscape continues to develop, with new business models emerging.
Big media players are also entering the marketplace, mostly competing for lower-value private sales.
We have the largest and most engaged audience of any UK automotive site. Our investment in brand as described above helps us to protect and grow our audience, to ensure that we remain the most influential website a consumer visits when purchasing a vehicle.
We have a dedicated competitors’ guild to closely monitor competitor activity.
We continue to invest in and develop our product offering to improve the value we offer to consumers, retailers and manufacturers.
We work in an agile way and can respond quickly to emerging competitive threats.
1 2 3
4 5 6
Key performance indicators page 22
Strategic report / Governance / Financial statements
35Auto Trader Group plc Annual Report and Financial Statements 2018

Focus areas relevant to our KPIs
Improve car buying in the UK
1 Increase consumer audience, advert views and use of our valuation tools
2 Promote trust and fairness in the marketplace
Evolve the automotive ecosystem in the UK
3 Grow ARPR in a balanced, sustainable way by creating value for our customers
4 Extend the penetration of products outside of our core classified proposition
5 Enhance our relevance and value to manufacturers
Become the most admired digital business
6 Operate a simpler, leaner and more data-oriented business
Our strategy page 20
Principal risk Impact Changes in the year Key mitigationsRelevant focus areas Change
4. Failure to innovate: disruptive technologies and changing consumer behaviours
Failure to innovate and develop new products or technologies, to execute new product launches or to adapt to changing consumer behaviour towards car buying or ownership could have an adverse impact. For example, this could lead to an over-reliance on price to drive revenue growth in an unsustainable way; or could result in missed opportunities as we fail to be at the front of industry developments.
In recognition of changing consumer behaviour, we have successfully launched monthly price search in 2018, a complex product requiring FCA authorisation, integration with external partners and significant development of our platform.
Continuous research into changing consumer behaviour, including our bi-annual Market Reports and Buyer Behaviour Report.
Monitoring of emerging trends, using external resources where needed, and regular contact with other similar businesses in other territories.
Ability to innovate and respond quickly due to our agile and collaborative way of working, and continuous investment in technology.
1 2 3
4 5 6
5. IT systems and cyber security
As a digital business, we are reliant on our IT infrastructure to continue to operate.
Any significant downtime of our systems would result in an interruption to the services we provide.
A significant data breach, whether as a result of our own failures or a malicious cyber attack, would lead to a loss in confidence by our retailers, advertisers and consumers.
This could result in loss of audience, loss of revenue, reputational damage and potential financial losses in the form of penalties.
The enactment of GDPR in May 2018 has significantly increased the financial impact of a data breach. We have enhanced our processes and policies as required.
We have a disaster recovery and business continuity plan in place which is regularly reviewed and tested. This includes the use of two data centres and regular back ups of data.
We continuously monitor the availability and resilience of processing systems and services and if required can restore the availability and access systems and data in a timely manner in the event of a physical or technical incident.
We have dedicated security teams, including white hat hackers, and carry out regular penetration testing and review of threats and vulnerabilities. We invest in IT and security infrastructure to ensure our systems remain robust.
Over the last 12 months we have taken the opportunity to review all processes that involve data collection, storage or processing, and have updated and amended to ensure that they meet the enhanced GDPR requirements.
All of our employees are required to undertake annual compliance training which includes Information Security and GDPR.
We have introduced two-factor verification for all our retailers, and for employees, to access our network.
We have been PCI DSS (payment card industry data security standard) compliant since 2013 and use an external Quality Security Assessor to maintain best practice.
1 2 3
4 5 6
6. Employees
Our continued success and growth is dependent on our ability to attract, recruit, retain and motivate our highly skilled workforce, with a particular focus on specialist technological and data skills. Failure to do so could result in the loss of key talent.
90% of employees completing our engagement survey said they were proud to work at Auto Trader.
Our Glassdoor rating based on anonymous reviews is 4.6/5.
Launched a mentoring matching programme.
Carried out a review of long-term incentive plans and plan to make some changes to make them more relevant and motivating.
We use long-term incentive plans for our senior and key staff.
We carry out active succession planning and career development plans to retain and develop the next level of executives, and added oversight of talent development to the terms of reference of the Nomination Committee.
We have a strong, value-led culture which is embedded through recruitment, induction, training and appraisals.
We carry out employee engagement surveys and closely monitor Glassdoor ratings. We have regular business updates, all-employee annual conference, networks and guilds.
1 2 3
4 5 6
Principal risks and uncertainties continued
36 Auto Trader Group plc Annual Report and Financial Statements 2018

Principal risk Impact Changes in the year Key mitigationsRelevant focus areas Change
4. Failure to innovate: disruptive technologies and changing consumer behaviours
Failure to innovate and develop new products or technologies, to execute new product launches or to adapt to changing consumer behaviour towards car buying or ownership could have an adverse impact. For example, this could lead to an over-reliance on price to drive revenue growth in an unsustainable way; or could result in missed opportunities as we fail to be at the front of industry developments.
In recognition of changing consumer behaviour, we have successfully launched monthly price search in 2018, a complex product requiring FCA authorisation, integration with external partners and significant development of our platform.
Continuous research into changing consumer behaviour, including our bi-annual Market Reports and Buyer Behaviour Report.
Monitoring of emerging trends, using external resources where needed, and regular contact with other similar businesses in other territories.
Ability to innovate and respond quickly due to our agile and collaborative way of working, and continuous investment in technology.
1 2 3
4 5 6
5. IT systems and cyber security
As a digital business, we are reliant on our IT infrastructure to continue to operate.
Any significant downtime of our systems would result in an interruption to the services we provide.
A significant data breach, whether as a result of our own failures or a malicious cyber attack, would lead to a loss in confidence by our retailers, advertisers and consumers.
This could result in loss of audience, loss of revenue, reputational damage and potential financial losses in the form of penalties.
The enactment of GDPR in May 2018 has significantly increased the financial impact of a data breach. We have enhanced our processes and policies as required.
We have a disaster recovery and business continuity plan in place which is regularly reviewed and tested. This includes the use of two data centres and regular back ups of data.
We continuously monitor the availability and resilience of processing systems and services and if required can restore the availability and access systems and data in a timely manner in the event of a physical or technical incident.
We have dedicated security teams, including white hat hackers, and carry out regular penetration testing and review of threats and vulnerabilities. We invest in IT and security infrastructure to ensure our systems remain robust.
Over the last 12 months we have taken the opportunity to review all processes that involve data collection, storage or processing, and have updated and amended to ensure that they meet the enhanced GDPR requirements.
All of our employees are required to undertake annual compliance training which includes Information Security and GDPR.
We have introduced two-factor verification for all our retailers, and for employees, to access our network.
We have been PCI DSS (payment card industry data security standard) compliant since 2013 and use an external Quality Security Assessor to maintain best practice.
1 2 3
4 5 6
6. Employees
Our continued success and growth is dependent on our ability to attract, recruit, retain and motivate our highly skilled workforce, with a particular focus on specialist technological and data skills. Failure to do so could result in the loss of key talent.
90% of employees completing our engagement survey said they were proud to work at Auto Trader.
Our Glassdoor rating based on anonymous reviews is 4.6/5.
Launched a mentoring matching programme.
Carried out a review of long-term incentive plans and plan to make some changes to make them more relevant and motivating.
We use long-term incentive plans for our senior and key staff.
We carry out active succession planning and career development plans to retain and develop the next level of executives, and added oversight of talent development to the terms of reference of the Nomination Committee.
We have a strong, value-led culture which is embedded through recruitment, induction, training and appraisals.
We carry out employee engagement surveys and closely monitor Glassdoor ratings. We have regular business updates, all-employee annual conference, networks and guilds.
1 2 3
4 5 6
Key performance indicators page 22
Strategic report / Governance / Financial statements
37Auto Trader Group plc Annual Report and Financial Statements 2018

Viability statementIn accordance with Provision C.2.2 of the 2014 UK Corporate Governance Code, the Directors have assessed the prospects and viability of the Group over a period significantly longer than 12 months from the approval of these financial statements.
Principal risks and uncertainties continued
Assessment of prospectsThe Board has determined that a period of three years to March 2021 is the most appropriate period to provide its viability statement due to:
– it being consistent with the Group’s rolling three-year strategic planning process;
– it reflects reasonable expectations in terms of the reliability and accuracy of operational forecasts;and
– projections looking out further than three years become significantly less meaningful given the pace of change in the digital automotive market.
The Group’s overall strategy and business model, as set out on pages 18 to 21, are central to assessing its future prospects. As such, key factors likely to affect the future development, performance and position of the Group are:
– Data and technology: continuous investment is made in developing platform technologies which leads to improvements for consumers, retailers and manufacturers;
– Market position: the Group has the largest and most engaged audience of any UK automotive site and is the most influential website a consumer visits when purchasing a vehicle; and
– People: continued success and growth are dependent on ability to attract, retain and motivate a highly skilled workforce, with a particular focus on specialist technological and data skills.
The Group’s prospects are assessed primarily through its strategic planning process. This process includes an annual review of the ongoing plan, led by the Group CEO and CFO/COO through the Operational Leadership Team and in conjunction with relevant functions. The Board participates fully in the annual process and has the task of considering whether the plan continues to take appropriate account of the external environment including technological, social and macroeconomic changes.
The output of the annual review process is a set of objectives which the Group determines to be its focus areas, an analysis of the risks that could prevent the plan being delivered, and the annual financial budget. The latest updates to the plan were finalised in March 2018, which considered the Group’s current position and its prospects over the forthcoming years.
Detailed financial forecasts that consider customer numbers, live car stock, ARPR, revenue, profit, cash flow and key financial ratios have been prepared for the three-year period to March 2021.
Funding requirements have also been considered. On 6 June 2018 the Group signed into a new Revolving Credit Facility (the ‘New RCF‘) to replace the existing Senior Syndicated Term Loan and revolving credit facility. The New RCF, which is unsecured, has total commitments of £400m and a termination date of June 2023. There is no requirement to settle all or part of the debt before the termination date.
The first year of the financial forecasts forms the Group’s 2019 annual budget and is subject to a re-forecasting process at the mid-point of the year. The second and third years are prepared in detail and are flexed based on the actual results in year one. Progress against financial budgets and focus areas are reviewed monthly by both the Operational Leadership Team and the Board. This control measure is in place to prevent and mitigate the impact of factors that may affect the Group’s prospects.
Assessment of viabilityThe output of the Group’s strategic and financial planning process detailed above reflects the Board’s best estimate of the future prospects of the business. To make the assessment of viability, however, additional scenarios have been modelled over and above those in the ongoing plan, based upon a number of the Group’s principal risks and uncertainties which are documented on pages 34 to 37. These scenarios were overlaid into the plan to quantify the potential impact of one or more of these crystallising over the assessment period.
While each of the Group’s principal risks has a potential impact and has therefore been considered as part of the assessment, only those that represent severe but plausible scenarios have been modelled through the plan. These were:
Scenario 1: Reduction of stock on the Auto Trader marketplace
Link to risk – Economy, market and business environment, Increased competition, Failure to innovate
Macroeconomic factors such as consumer confidence have an impact on the number of new and used car transactions that occur in the UK and therefore retailer and manufacturer profitability. A contraction in the number of new and used car transactions, when coupled with failure to innovate new products in order to grow ARPR in a sustainable way, could lead to retailers reducing their advertising spend in favour of competitors.
This scenario assumes a shock reduction in live car stock around a pricing event. The number of retailers advertising stock with the Group was assumed to reduce in a short space of time with further reductions in the year after the shock event. No cost savings were assumed.
Scenario 2: Data breaches
Link to risk – IT systems and cyber security, Brand
The impact of any regulatory fines has been considered. The biggest of these is the General Data Protection Regulation (‘GDPR’) fine for data breaches, which was enacted in May 2018.
This scenario assumes a data breach resulting in the maximum fine, coupled with significant reputational damage to the Group’s brand. A severe reduction in revenue was modelled through each of the Trade, Consumer services and Manufacturer and Agency areas. Marketing costs were increased to model a potential need to increase traffic.
The scenarios above are hypothetical and severe for the purpose of creating outcomes that have the ability to threaten the viability of the Group; however, multiple control measures are in place to prevent and mitigate any such occurrences from taking place.
The results of the stress testing demonstrated that due to the Group’s significant free cash flow, access to the New RCF and the Board’s ability to adjust the discretionary share-buy back programme, it would be able to withstand the impact and remain cash generative.
Viability statementBased on their assessment of prospects and viability above, the Directors confirm that they have a reasonable expectation that the Group will be able to continue in operation and meet its liabilities as they fall due over the three-year period ending March 2021.
Going concernThe Directors also considered it appropriate to prepare the financial statements on the going concern basis, as explained in the Basis of preparation paragraph in note 1 to the financial statements.
38 Auto Trader Group plc Annual Report and Financial Statements 2018

Corporate social responsibility
How we are making a difference
A part of our strategy is to become the most admired UK digital business. To achieve this we have built a digital culture that is values-oriented, customer-centric and data-driven with a focus on an agile approach to change and, importantly, underpinned by creating a diverse and inclusive workforce.
Measuring the impact of our CSR strategyThese are just some of the metrics we are focused on, in order to measure our ‘Make a difference’ strategy:
88%of employees would recommend Auto Trader as a great place to work
90%proud to work at Auto Trader score
4.6 / 5Glassdoor rating
£170kdonated to charity
50%women on our OLT
4,000retailers reached through insight programme
Strategic report / Governance / Financial statements
39Auto Trader Group plc Annual Report and Financial Statements 2018

A diverse and inclusive workforce
Driven byinnovation
Values and value-ledPurpose and principles-driven
Basedon trustanddebate
Digitalanddata-driven
Corporate social responsibility continued
OverviewPeople are the Group’s most valuable resource and the success of the Group is to the credit of all its employees. Last year we were focused on creating a simpler, leaner, and more data-oriented organisation. To ensure our culture is digital, agile and enables our teams to be quick to respond to change, we have continued to focus on creating and maintaining consistently high-performing, data-oriented squads across the whole Auto Trader business. Our culture is shaped by the evolution of our values of being determined, reliable, curious, courageous, humble and community-minded. These values often manifest themselves in our fast-paced and highly customer-oriented approach in our commitment to being an exciting, innovative and digital-led company.
Corporate social responsibility at Auto Trader is driven by our values and culture and is focused on making a difference to our employees, our community and our industry. This, along with our diversity and inclusion strategy, is embedded into how we operate on a daily basis. As an employer, it comprises employee engagement, rewards and recognition schemes, people development, health and safety, the environmental impact, sustainability and energy efficient operations.
As a company, we are keen to give back to our local communities in which we operate, as well as supporting charities and causes that are close to our employees’ hearts. We continue to focus our community support in four areas: employees’ individual charitable fundraising efforts, promoting the two volunteering
days that are available to all employees each year, Give as You Earn, which is one of our Incredible Benefits, and through the Auto Trader Community Fund which supports grassroots projects in Greater Manchester and Greater London. We constantly look at ways we can make a positive contribution to our industry; whether that’s developing the next generation of talent, sharing best practice advice with our retailer customers through masterclasses and larger-scale industry events, or helping the industry as a whole to operate in a more transparent, progressive and diverse manner.
Our cultureOur culture is built around evolving our digital, values-oriented approach to ensure our people are proud of our diversity, our focus on the wildly important, our rapid response to change and our continued success and growth.
40 Auto Trader Group plc Annual Report and Financial Statements 2018

Our valuesTo truly reflect our culture and the behaviours we all adhere to every day, we updated our values this year. We made the decision to change inspirational to courageous and we added community-minded to encapsulate our business’s focus on supporting not only the Auto Trader community but the wider communities in which we operate.
Be determinedWe are passionate about our customers, showing stamina and resilience, and have the conviction to do the right thing. We will roll up our sleeves to get the job done.
Be reliable We are outcome-oriented and we do what we say we will do. We perform under pressure and have a strong work ethic.
Be curiousWe are always learning. We question why, we search for better ways, ask questions and actively listen.
Be humbleWe are open, honest, approachable and we treat each other fairly. We recognise success in ourselves and others but admit and learn from mistakes.
Be courageousWe are bold in our thinking, overcoming fears, challenging the conventional and we will run towards and embrace change.
Be community-minded We look after each other, respect diversity and advocate inclusion. We are committed to making a difference to the communities around us and think of others before ourselves.
41Auto Trader Group plc Annual Report and Financial Statements 2018
Strategic report / Governance / Financial statements

Corporate social responsibility continued
as women in the digital industry and our Photography Club created an exhibition celebrating the diverse city of Manchester.
Our accessibility and inclusive design working group ran workshops to introduce employees to some of the challenges disabled and neurodiverse people potentially face and help them understand how they can make a difference when creating products for our customers. The month ended with more than a hundred of our employees taking part in the Manchester Pride Festival Parade and being awarded Best Corporate Entry for their passionate showcase of support to the LGBT+ community.
Our employee groups and networks (Family Network, Women’s Network, Photography, Book, Board game, Running and Film Clubs) continue to bring our colleagues together, in line with our philosophy that inclusion will be achieved by respecting each other’s differences but concentrating on finding common ground.
Ensuring Auto Trader is a diverse and inclusive employer that contributes positively to the communities in which we operate remains a key strategic priority for our business. Our dedicated diversity and inclusion working group has committed to design and deliver a comprehensive strategy concentrating on all diversity strands, with a focus on LGBT+, gender equality, disability and neurodiversity and BAME for this year.
Diversity – for everyone at Auto Trader – means respect for and appreciation of differences in: gender, age, sexual orientation, disability, race and ethnic origin, religion and faith, marital status, social, education background and way of thinking. We believe that inclusion is a state of being valued, respected and supported for who you are.
Our colleagues across the business have worked collaboratively with our Diversity and Inclusion group and achieved positive results.
We continued our one-day Diversity and Inclusion workshops, which every new joiner attends within their first three months, focusing on creating common understanding of the concepts as well as exploring participants’ unconscious biases and how they can impact their own behaviour and relationships with other people inside and outside of work. This year we extended the invite to customers and business partners, who participated in the workshop and took learnings back to their own organisations.
This year we launched a Diversity and Inclusion month in August to bring together some already successful initiatives with new ones, aiming to educate, celebrate and make a difference. We introduced workshops by the National Autistic Society, Stonewall and Mental Health First Aid England. The latter resulted in us creating our team of Mental Health First Aiders, available to provide support to colleagues in our offices and out in the field. Our Auto Trader Women’s Network hosted a talk with two inspirational senior leaders sharing their personal stories
We continue our participation to promote Science, Technology, Engineering and Maths (‘STEM’) careers by supporting schools by running Code Clubs to teach young children how to code.
We also ran summer experience days hosting schools and universities, introducing them to the digital, technology and automotive industries. Following the success of the past two years we continue to participate in the Change 100 programme organised by Leonard Cheshire Disability. We offered two summer placements, one resulting in a permanent placement to our Graduate Scheme.
Our ambition to become one of the most diverse and inclusive employers is supported by our Company policies and practices which are reviewed regularly in line with the Equality Act 2010 protected characteristics and best practice. Everyone from across the business is involved in providing feedback to help us continuously evolve and take positive action to ensure our colleagues, customers and partners feel they can be their authentic self while having a brilliant experience working with us.
Making a difference to diversity and inclusion
“Diversity is the mix, inclusion is getting the mix to work well together.”
42 Auto Trader Group plc Annual Report and Financial Statements 2018
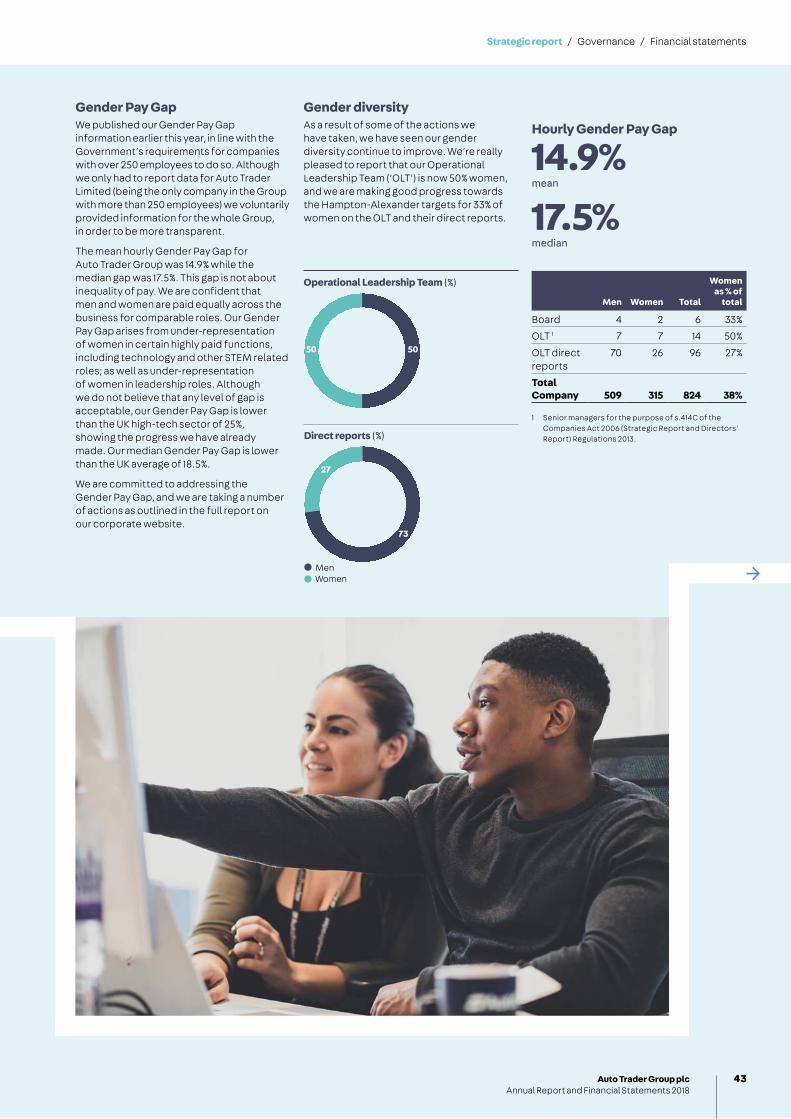
5050
Operational Leadership Team (%)
MenWomen
73
27
Direct reports (%)
Gender Pay GapWe published our Gender Pay Gap information earlier this year, in line with the Government’s requirements for companies with over 250 employees to do so. Although we only had to report data for Auto Trader Limited (being the only company in the Group with more than 250 employees) we voluntarily provided information for the whole Group, in order to be more transparent.
The mean hourly Gender Pay Gap for Auto Trader Group was 14.9% while the median gap was 17.5%. This gap is not about inequality of pay. We are confident that men and women are paid equally across the business for comparable roles. Our Gender Pay Gap arises from under-representation of women in certain highly paid functions, including technology and other STEM related roles; as well as under-representation of women in leadership roles. Although we do not believe that any level of gap is acceptable, our Gender Pay Gap is lower than the UK high-tech sector of 25%, showing the progress we have already made. Our median Gender Pay Gap is lower than the UK average of 18.5%.
We are committed to addressing the Gender Pay Gap, and we are taking a number of actions as outlined in the full report on our corporate website.
Gender diversityAs a result of some of the actions we have taken, we have seen our gender diversity continue to improve. We’re really pleased to report that our Operational Leadership Team (‘OLT’) is now 50% women, and we are making good progress towards the Hampton-Alexander targets for 33% of women on the OLT and their direct reports.
Hourly Gender Pay Gap
14.9%mean
17.5%median
Men Women Total
Women as % of
total
Board 4 2 6 33%
OLT 1 7 7 14 50%
OLT direct reports
70 26 96 27%
Total Company 509 315 824 38%
1 Senior managers for the purpose of s.414C of the Companies Act 2006 (Strategic Report and Directors’ Report) Regulations 2013.
Strategic report / Governance / Financial statements
43Auto Trader Group plc Annual Report and Financial Statements 2018

BESTCOMPANIES
TO WORK FOR
2018
100
Corporate social responsibility continued
Training and development Investing in our people remains a key focus. We have a dedicated Learning and Development team, specialising in various fields including personal, career, leadership, systems and business-related training, and also use external experts to bring outside insight and knowledge when required.
All new people joining our business are given a brilliant start to their careers with us by attending a three-day induction programme, allowing them to understand the core values of our business and culture and ways of working.
We recognise that all our employees are unique and have different needs and learning styles. We offer blended learning opportunities that are aligned to our collaborative and inclusive culture, including workshops, bitesize sessions, on-the-job solutions, attendance at conferences, coaching and mentoring, online learning and professional qualifications.
Our managers take part in the Practical People Leadership Programme (‘PPLP’), and senior leaders take part in the Leadership Development Programme (‘LDP’), both aimed at developing well-rounded leaders that will drive the future of Auto Trader.
To help us achieve our mission of being one of the most admired UK digital businesses, we have built a business that is centred around its people. Our success is due to the diverse talent of our innovative, courageous, talented and committed people.
Informing and consulting our employeesWe value our people and their opinions.
Every year we organise an all-employee conference where we celebrate our achievements and share the strategy and focuses for the year ahead.
We also hold regular business and financial updates throughout the year to keep employees informed on the Group’s performance and priorities as well as giving them the opportunity to feed back and contribute with questions and ideas.
We hold regular checks throughout the year, allowing teams to spend time together in an open and secure environment to discuss how they feel in the workplace and how we are doing against our key focus areas.
We also offered a second Sharesave scheme in 2017, promoting a culture of shared ownership, and saw take-up rates of over 40%.
We have welcomed a number of apprentices, graduates and work placements under our future talent programme, to equip our business with the skills needed for our ongoing success. Every individual is responsible for their own career and personal development, and we aim for everyone to have quarterly development conversations with their people leaders.
Employee engagement and recognitionWe conducted an employee engagement survey again this year, and achieved a response rate of 91% of our total workforce. Overall engagement remains positive, with 90% of our people feeling proud to work for Auto Trader, and 88% saying they would recommend us as a great place to work. There were also areas to improve, and we have set up working groups to concentrate on these, including recognition, career development and physical and mental health. Our Glassdoor rating is 4.5 out of 5, based on more than 200 anonymous reviews. For the second year we participated in the Sunday Times Top 100 Best Companies to Work For and we achieved a two-star ‘Outstanding’ rating and moved up the list to number 32.
Making a difference to our employees
44 Auto Trader Group plc Annual Report and Financial Statements 2018

Making a difference to our communities
Disabled employees We are part of the Department for Work and Pensions Disability Confident employer scheme and have agreed to its commitments and taken action to make a difference to disabled people.
Our dedicated resourcing team actively reaches out to disabled candidates and welcomes their applications for employment. We take great care to make reasonable adjustments during the assessment process according to the needs of each individual to ensure that they can perform at their best.
We remain committed to supporting disabled employees or those who become disabled during their employment with us. Recognising that everyone is unique, we provide the right support to ensure they continue to realise their full potential at work and develop their careers with us. This year we have also added more support and education for managers of disabled colleagues, for example ‘Understanding Autism for Managers’ workshops provided by the National Autism Society.
We have established a dedicated team of colleagues from across our business who are committed to driving our Make a Difference strategy, which aims to maximise the support and impact we provide to the communities in which we operate.
We donate to local causes through the Auto Trader Community Fund, powered by Forever Manchester (a registered charity), which makes awards of up to £1,000 to community groups and grassroots projects across Greater Manchester. This year, the fund has donated over £60,000 to various local groups that bring people together and empower them to create sustainable changes in their lives. As a recognition of our efforts, Forever Manchester awarded us the Business Supporter of the Year for 2017.
We are extending this fund and are in the process of setting up a similar fund model to support charities in Greater London.
Donations from Auto Trader directly to other charities totalled an additional £60,000 through our Auto Trader Sponsorships initiative which provides match-funding to employees, customers and partners fundraising for charities that are close to their hearts.
Our Give as You Earn (‘GAYE’) scheme participation has reached 11% of our total workforce and £100,000 has been donated to various charities through payroll.
But Make a Difference is more than just donating money.
We encourage all our colleagues to utilise two optional volunteering days every year. One in four of our employees have offered their time and skills to support worthy causes across the UK, such as Barnabus, a drop-in centre for homeless people; FareShare, to fight food waste and tackle hunger; Didsbury Park, to maintain eight acres of green space; and Dress for Success, helping to empower women by providing professional attire and skills to gain employment.
To support the arts and design in Manchester, we continue our successful partnership with HOME arts centre and supported various initiatives including the PUSH festival of fresh creative experiences from the North West, showcasing some of the most exciting film, theatre and visual arts from the region, and sponsorship of the monthly ‘Bring the Family’ initiative, enabling the provision of an intergenerational film programme to audiences in Greater Manchester.
Strategic report / Governance / Financial statements
45Auto Trader Group plc Annual Report and Financial Statements 2018

Corporate social responsibility continued
Making a difference to our industries
25 of our colleagues have trained to become ‘STEM ambassadors’ so that they can support ‘Code Clubs’, teaching young children how to code and supporting the ‘People Like Me’ initiative to encourage girls into relevant STEM careers.
We are proud that our Director of Risk and Compliance, Helena Fearon, was shortlisted in this year’s Women in IT Award: Security Champion of the Year, in recognition of her work in the safety and security arena. Helena leads our customer security team and risk and compliance function, and chairs the wider industry body Vehicle Safe Trading Advisory Group (‘VSTAG’) which aims to bring the industry, police and fraud agencies together to help consumers buy and sell vehicles safely and securely.
We hosted over 100 events and conferences, including: Manchester Youth HAC, Rails Girls, Manimation, Real UX and Manchester Futurists. We are also members of the Manchester Publicity Association, working to evolve the creative, media, publishing and digital industries in Manchester.
Our Make a Difference strategy extends to supporting the wider technology, automotive, advertising and creative industries.
Supporting STEM careersTo encourage future talent, we have continued our partnership with Manchester Digital by taking part in their Apprenticeship Scheme for the second year, welcoming an additional four apprentices. We also support relevant degrees for Software Developer and Infrastructure Technician apprentices. We continue to offer a PhD scholarship and two summer project grants for Data Science students from the University of Manchester.
We work with local universities and schools and host numerous experience days in our offices, run mock interviews and give talks to introduce them to careers in digital. We continue to participate to promote STEM subjects and careers by supporting local schools and clubs in the Manchester area.
Automotive industryThe automotive industry, much like the wider technology sector, has a significant challenge with diversity. We work with key media partners, recruitment businesses and major automotive retailer groups to actively drive the diversity agenda.
We participate in key industry events such as Inspiring Automotive Women, and will be hosting an upcoming event in partnership with Ennis & Co. and media title ARN, which aims to bring together the wider automotive industry to discuss diversity issues as well as to encourage actionable plans for businesses to take away.
Leading the industry, sharing ideas, and inspiring change and action are at the heart of our work with our retailer customers. Through our masterclasses, conferences, webinars, in-house discovery days and award events we share the latest consumer trends, best practice advice and insights gleaned from our data to help shape the future of the industry. Over 4,000 retailer customers or industry figures joined us for one of these sessions.
We want to make a difference to our customers by rewarding their efforts, and we do this annually at our Retailer Awards Ceremony – The Auto Trader Click Awards. The awards recognise those at the forefront of digital automotive retailing and those that really do put the consumer at the heart of their business. These awards are used by retailers to promote their business to consumers on our marketplace.
46 Auto Trader Group plc Annual Report and Financial Statements 2018
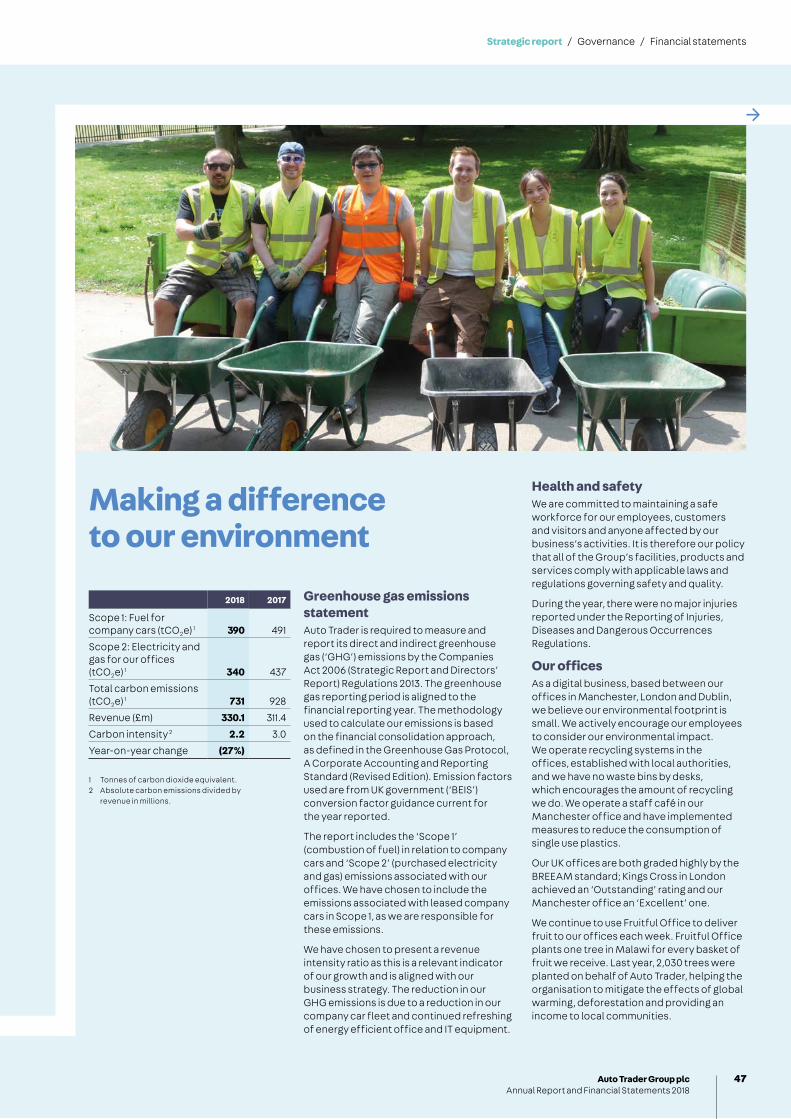
Making a difference to our environment
Health and safetyWe are committed to maintaining a safe workforce for our employees, customers and visitors and anyone affected by our business’s activities. It is therefore our policy that all of the Group’s facilities, products and services comply with applicable laws and regulations governing safety and quality.
During the year, there were no major injuries reported under the Reporting of Injuries, Diseases and Dangerous Occurrences Regulations.
Our officesAs a digital business, based between our offices in Manchester, London and Dublin, we believe our environmental footprint is small. We actively encourage our employees to consider our environmental impact. We operate recycling systems in the offices, established with local authorities, and we have no waste bins by desks, which encourages the amount of recycling we do. We operate a staff café in our Manchester office and have implemented measures to reduce the consumption of single use plastics.
Our UK offices are both graded highly by the BREEAM standard; Kings Cross in London achieved an ‘Outstanding’ rating and our Manchester office an ‘Excellent’ one.
We continue to use Fruitful Office to deliver fruit to our offices each week. Fruitful Office plants one tree in Malawi for every basket of fruit we receive. Last year, 2,030 trees were planted on behalf of Auto Trader, helping the organisation to mitigate the effects of global warming, deforestation and providing an income to local communities.
2018 2017
Scope 1: Fuel for company cars (tCO2e) 1 390 491
Scope 2: Electricity and gas for our offices (tCO2e) 1 340 437
Total carbon emissions (tCO2e) 1 731 928
Revenue (£m) 330.1 311.4
Carbon intensity 2 2.2 3.0
Year-on-year change (27%)
1 Tonnes of carbon dioxide equivalent.2 Absolute carbon emissions divided by
revenue in millions.
Greenhouse gas emissions statementAuto Trader is required to measure and report its direct and indirect greenhouse gas (‘GHG’) emissions by the Companies Act 2006 (Strategic Report and Directors’ Report) Regulations 2013. The greenhouse gas reporting period is aligned to the financial reporting year. The methodology used to calculate our emissions is based on the financial consolidation approach, as defined in the Greenhouse Gas Protocol, A Corporate Accounting and Reporting Standard (Revised Edition). Emission factors used are from UK government (‘BEIS’) conversion factor guidance current for the year reported.
The report includes the ‘Scope 1’ (combustion of fuel) in relation to company cars and ‘Scope 2’ (purchased electricity and gas) emissions associated with our offices. We have chosen to include the emissions associated with leased company cars in Scope 1, as we are responsible for these emissions.
We have chosen to present a revenue intensity ratio as this is a relevant indicator of our growth and is aligned with our business strategy. The reduction in our GHG emissions is due to a reduction in our company car fleet and continued refreshing of energy efficient office and IT equipment.
Strategic report / Governance / Financial statements
47Auto Trader Group plc Annual Report and Financial Statements 2018

Modern slavery policyWe have a zero-tolerance approach to modern slavery and are committed to acting ethically and with integrity in all our business dealings and relationships, and to implementing and enforcing effective systems and controls to ensure modern slavery is not taking place anywhere in our own business or in any of our supply chains. We are committed to ensuring there is transparency in our own business and in our approach to tackling modern slavery throughout our supply chains. We expect the same high standards from all our contractors, suppliers and other business partners.
WhistleblowingWe provide an independent whistleblowing service if employees need to report anything untoward or experience any serious malpractice or wrongdoing in our business.
Auto Trader believes in promoting trust and fairness in the marketplace and this has become part of the way we work across the organisation. We aspire to be the UK’s most admired digital business and we want that admiration to come from employees, suppliers and customers.
The only way to deliver the best services for our customers – and do the right things by our people – is to approach things in the right way. We have established policies, procedures and training to ensure that everyone at Auto Trader knows that they must behave professionally, ethically and legally, treating people with decency and respect.
We promote a culture of compliance and shared responsibility by providing advice and information to keep our employees and customers smart, safe and secure.
Each year, our employees complete compliance training that covers fraud, bribery, anti-money laundering, information security and GDPR.
Anti-bribery and corruptionWe are committed to carrying out all business activities in an honest, open and ethical manner. We have zero tolerance to any aspect of bribery and corruption, both within our business and in respect of any third parties with whom we have dealings. We have an established anti-bribery and corruption policy and procedures in place including reporting of gifts and hospitality, standard contractual clauses with suppliers and annual online compliance training for all employees.
Maintaining a trusted marketplaceConsumers trust Auto Trader to show genuine, accurate adverts when they search for vehicles. We have a dedicated customer security team who monitor our site to identify adverts that are potentially fraudulent or misleading, whether that be a misleading price or inaccurate mileage in their advert. We also have functionality to enable users of our site to report a misleading advert whilst they are searching, which we then investigate and, if necessary, remove from the site.
Doing the right thing
Corporate social responsibility continued
48 Auto Trader Group plc Annual Report and Financial Statements 2018

Protecting our customers’ and consumers’ dataProtecting the data of our consumers and our retailer customers is also an important focus for us.
We invest heavily in security and data protection. We have a dedicated security squad and we invest to ensure that our systems are robust and that we remain compliant with PCI/DSS (payment card industry, data security standard). Over the last 12 months we have taken the opportunity to review all processes that involve data collection, storage or processing, and have updated and amended to ensure that they meet the enhanced GDPR requirements.
Human rights and equal opportunityThe Group is committed to treating all its employees and job applicants fairly and equally. It is our policy not to discriminate based on their gender, sexual orientation, marital or civil partner status, gender reassignment, race, religion or belief, colour, nationality, ethnic or national origin, disability or age, pregnancy, or trade union membership or the fact that they are a part-time worker or a fixed-term employee. The equal opportunities policy operated by the Group ensures all workers have a duty to act in accordance with this.
The Company’s Strategic report is set out on pages 1 to 49. Approved by the Board on 7 June 2018 and signed on its behalf by:
Nathan CoeChief Financial Officer and Chief Operating Officer7 June 2018
“Auto Trader believes in promoting trust and fairness in the marketplace and this has become part of the way we work across the organisation.”
Strategic report / Governance / Financial statements
49Auto Trader Group plc Annual Report and Financial Statements 2018

Governance overview
Corporate governance statement page 54
I am pleased to introduce our corporate governance statement which incorporates reports from the Chairmen of each of our Board Committees. These reports explain our governance policies and procedures in detail and describe how we have applied the principles of corporate governance contained in the UK Corporate Governance Code 2016 (the ‘Code’).
Compliance with the Corporate Governance CodeThe Company complied with all provisions set out in the Code for the period.
DirectorsSean Glithero stepped down as Chief Financial Officer on 21 September 2017 after 11 years with Auto Trader. Sean made a significant contribution to the success of Auto Trader’s transformation from a print to a digital business and was instrumental in taking our Company from private ownership to a listed UK plc. We would like to thank him for his tremendous contribution and wish him well in his next venture. Nathan Coe, Chief Operating Officer, took on the additional role of Chief Financial Officer from that date.
The composition of the Board is kept under continual review to ensure that it has the skills, experience and balance required for the proper stewardship of the business. We have three independent Non-Executive Directors, who bring with them significant commercial and financial expertise and are well placed to support the Executive Team in implementing our strategy. We have two Executive Directors and therefore comply with the relevant provision of the Code for at least half of the Board to be independent, excluding myself.
All Directors will offer themselves for election or re-election by the shareholders at the forthcoming AGM.
Board effectivenessIn our third year as a premium listed business, we engaged an external company, Independent Audit Limited, to facilitate our Board evaluation process.
A comprehensive review process was carried out, including a review of Board and Committee papers and observation of meetings as well as interviews with every Board member.
A robust framework of governance underpinned by a culture of openness and transparency
“The Company complied with all provisions set out in the Corporate Governance Code for the period.”
Ed WilliamsChairman
50 Auto Trader Group plc Annual Report and Financial Statements 2018
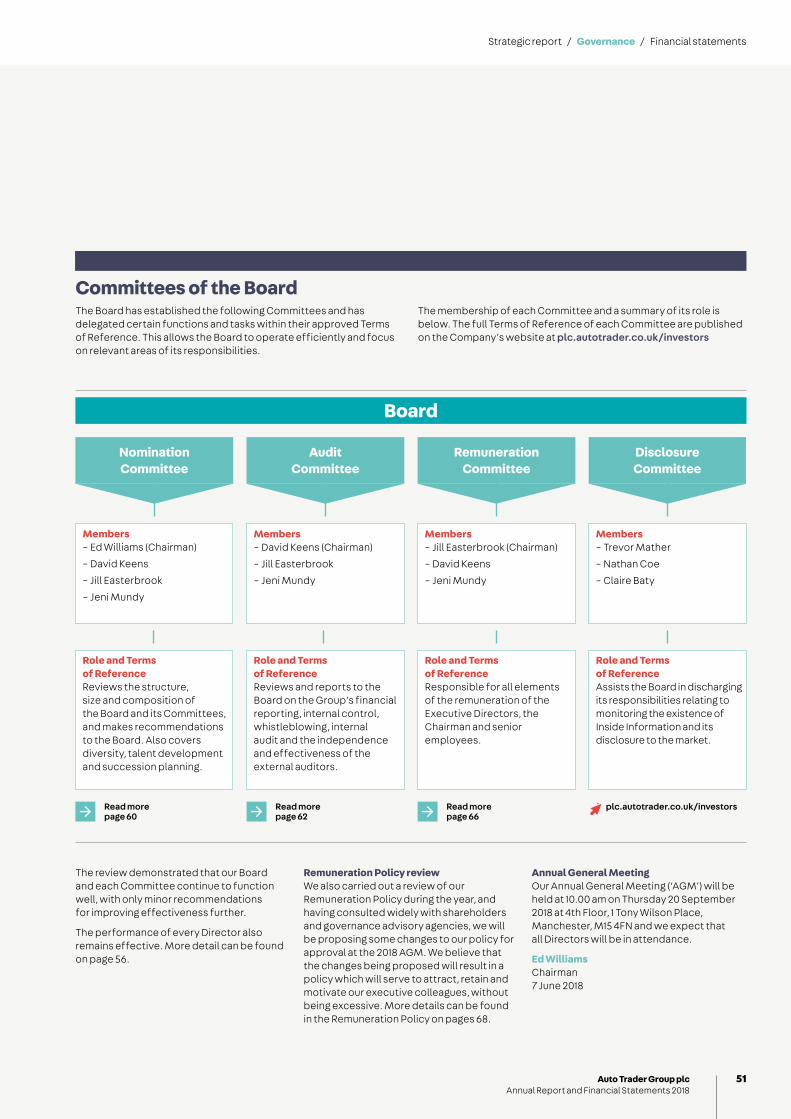
The review demonstrated that our Board and each Committee continue to function well, with only minor recommendations for improving effectiveness further.
The performance of every Director also remains effective. More detail can be found on page 56.
Remuneration Policy reviewWe also carried out a review of our Remuneration Policy during the year, and having consulted widely with shareholders and governance advisory agencies, we will be proposing some changes to our policy for approval at the 2018 AGM. We believe that the changes being proposed will result in a policy which will serve to attract, retain and motivate our executive colleagues, without being excessive. More details can be found in the Remuneration Policy on pages 68.
Annual General MeetingOur Annual General Meeting (‘AGM’) will be held at 10.00 am on Thursday 20 September 2018 at 4th Floor, 1 Tony Wilson Place, Manchester, M15 4FN and we expect that all Directors will be in attendance.
Ed WilliamsChairman 7 June 2018
Committees of the BoardThe Board has established the following Committees and has delegated certain functions and tasks within their approved Terms of Reference. This allows the Board to operate efficiently and focus on relevant areas of its responsibilities.
The membership of each Committee and a summary of its role is below. The full Terms of Reference of each Committee are published on the Company’s website at plc.autotrader.co.uk/investors
Board
Nomination Committee
Members – Ed Williams (Chairman)
– David Keens
– Jill Easterbrook
– Jeni Mundy
Role and Terms of ReferenceReviews the structure, size and composition of the Board and its Committees, and makes recommendations to the Board. Also covers diversity, talent development and succession planning.
Remuneration Committee
Members – Jill Easterbrook (Chairman)
– David Keens
– Jeni Mundy
Role and Terms of ReferenceResponsible for all elements of the remuneration of the Executive Directors, the Chairman and senior employees.
Audit Committee
Members – David Keens (Chairman)
– Jill Easterbrook
– Jeni Mundy
Role and Terms of ReferenceReviews and reports to the Board on the Group’s financial reporting, internal control, whistleblowing, internal audit and the independence and effectiveness of the external auditors.
Disclosure Committee
Members – Trevor Mather
– Nathan Coe
– Claire Baty
Role and Terms of ReferenceAssists the Board in discharging its responsibilities relating to monitoring the existence of Inside Information and its disclosure to the market.
Read more page 60
Read more page 62
Read more page 66
plc.autotrader.co.uk/investors
Strategic report / Governance / Financial statements
51Auto Trader Group plc Annual Report and Financial Statements 2018

Board of Directors
The dates of appointment shown are the dates on which the Directors were first appointed to the Board of Auto Trader Group plc or the Group’s previous parent company, Auto Trader Holding Limited.
1
3
5
2
4
6
52 Auto Trader Group plc Annual Report and Financial Statements 2018

1. Ed WilliamsChairman
2. Trevor MatherChief Executive Officer
3. Nathan CoeChief Financial Officer and Chief Operating Officer
Biography Ed has been a Non-Executive Director of Auto Trader since November 2010 and Chairman since March 2014.
He was the founding Chief Executive of Rightmove plc, serving in that capacity from November 2000 until his retirement from the business in April 2013. Rightmove plc was floated on the London Stock Exchange in February 2006. Prior to Rightmove, Ed spent the majority of his career as a management consultant with Accenture and McKinsey & Co. Ed holds an MA in Philosophy, Politics and Economics from St Anne’s College, Oxford.
BiographyTrevor joined Auto Trader as Chief Executive Officer in June 2013. Previously, Trevor was President and CEO of ThoughtWorks, a global IT and software consulting company.
Trevor joined ThoughtWorks in 2001, to kick-start the UK branch of the company, and then took responsibility for all international operations before becoming CEO in 2007. He helped oversee the business grow from a 300-person North American company to a 2,200-person global business with operations in 29 cities around the world with a particular personal focus on helping businesses become truly digital. Before his time at ThoughtWorks, Trevor spent almost 10 years at Andersen Consulting (now Accenture) focusing on e-business solutions. Trevor holds an MEng in Aeronautics and Astronautics from Southampton University.
BiographyNathan was appointed to the Board as Chief Operating Officer (‘COO’) in April 2017 and as Chief Financial Officer (‘CFO’) in July 2017. Nathan joined Auto Trader in 2007 to oversee the transition from a magazine business to being a pure digital company. He was responsible for launching a number of new business areas, and led the Company’s early entry and subsequent growth in mobile and online. For the past two years, Nathan has been the joint Operations Director, sharing responsibility for the day-to-day operations of the business.
Prior to joining Auto Trader, Nathan was at Telstra, Australia’s leading telecommunications company, where he led Mergers and Acquisitions and Corporate Development for its media and internet businesses. He was previously a consultant at PwC, having graduated from the University of Sydney with a B.Com. (Hons).
Appointed to Board: November 2010. Appointed to Board: June 2013. Appointed to Board: April 2017.
Independent on appointment: Yes. Independent: N/A. Independent: N/A.
External appointments: Idealista S.A. External appointments: Burns Sheehan Limited; Forever Manchester.
External appointments: None.
Committee memberships: Nomination (Chairman).
Committee memberships: Disclosure.
Committee memberships: Disclosure.
4. David KeensSenior Independent Non-Executive Director
5. Jill EasterbrookIndependent Non-Executive Director
6. Jeni MundyIndependent Non-Executive Director
Biography David was appointed as a Non-Executive Director on 1 May 2015.
David was previously Group Finance Director of NEXT plc (1991 to 2015) and its Group Treasurer (1986 to 1991). Previous management experience includes nine years in the UK and overseas operations of multinational food manufacturer Nabisco (1977 to 1986) and prior to that seven years in the accountancy profession. David is a member of the Association of Chartered Certified Accountants and of the Association of Corporate Treasurers.
Biography Jill was appointed as a Non-Executive Director to the Board on 1 July 2015.
Jill is currently the CEO of Boden, the clothing retailer.
Jill was previously at Tesco PLC (2001-16) where she was a member of the Executive Committee, having held a variety of roles across Strategy and Operations.
Jill started her career at Marks & Spencer in buying and merchandising and also spent time as a management consultant with Capgemini Ernst & Young.
Biography Jeni was appointed as a Non-Executive Director on 1 March 2016.
Jeni was previously at Vodafone (1998 to 2017). Most recently she held Group Director roles across Product Management and Sales. Prior to that she was Chief Technology Officer on the UK and New Zealand Executive Boards.
Jeni started her career as a Telecommunications Engineer with BellSouth in New Zealand and holds an MSc in Electronic Engineering from Cardiff University.
Appointed to Board: May 2015. Appointed to Board: July 2015. Appointed to Board: March 2016.
Independent: Yes. Independent: Yes. Independent: Yes.
External appointments: J Sainsbury plc. External appointments: Boden Limited. External appointments: None.
Committee memberships: Audit (Chairman), Nomination, Remuneration.
Committee memberships: Remuneration (Chairman), Nomination, Audit.
Committee memberships: Remuneration, Nomination, Audit.
Strategic report / Governance / Financial statements
53Auto Trader Group plc Annual Report and Financial Statements 2018
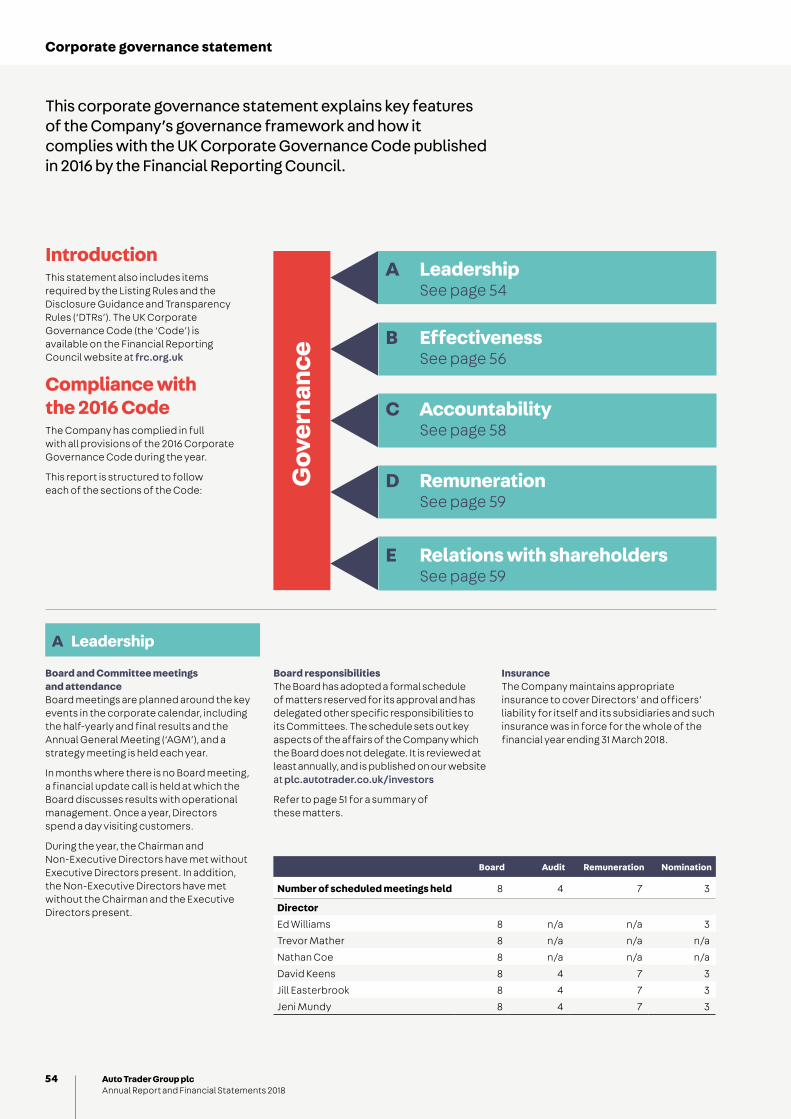
Corporate governance statement
IntroductionThis statement also includes items required by the Listing Rules and the Disclosure Guidance and Transparency Rules (‘DTRs’). The UK Corporate Governance Code (the ‘Code’) is available on the Financial Reporting Council website at frc.org.uk
Compliance with the 2016 CodeThe Company has complied in full with all provisions of the 2016 Corporate Governance Code during the year.
This report is structured to follow each of the sections of the Code:
This corporate governance statement explains key features of the Company’s governance framework and how it complies with the UK Corporate Governance Code published in 2016 by the Financial Reporting Council.
A Leadership
Board responsibilitiesThe Board has adopted a formal schedule of matters reserved for its approval and has delegated other specific responsibilities to its Committees. The schedule sets out key aspects of the affairs of the Company which the Board does not delegate. It is reviewed at least annually, and is published on our website at plc.autotrader.co.uk/investors
Refer to page 51 for a summary of these matters.
InsuranceThe Company maintains appropriate insurance to cover Directors’ and officers’ liability for itself and its subsidiaries and such insurance was in force for the whole of the financial year ending 31 March 2018.
A Leadership See page 54
C Accountability See page 58
B Effectiveness See page 56
D Remuneration See page 59
E Relations with shareholders See page 59
Gov
erna
nce
Board Audit Remuneration Nomination
Number of scheduled meetings held 8 4 7 3
DirectorEd Williams 8 n/a n/a 3
Trevor Mather 8 n/a n/a n/a
Nathan Coe 8 n/a n/a n/a
David Keens 8 4 7 3
Jill Easterbrook 8 4 7 3
Jeni Mundy 8 4 7 3
Board and Committee meetings and attendanceBoard meetings are planned around the key events in the corporate calendar, including the half-yearly and final results and the Annual General Meeting (‘AGM’), and a strategy meeting is held each year.
In months where there is no Board meeting, a financial update call is held at which the Board discusses results with operational management. Once a year, Directors spend a day visiting customers.
During the year, the Chairman and Non-Executive Directors have met without Executive Directors present. In addition, the Non-Executive Directors have met without the Chairman and the Executive Directors present.
54 Auto Trader Group plc Annual Report and Financial Statements 2018
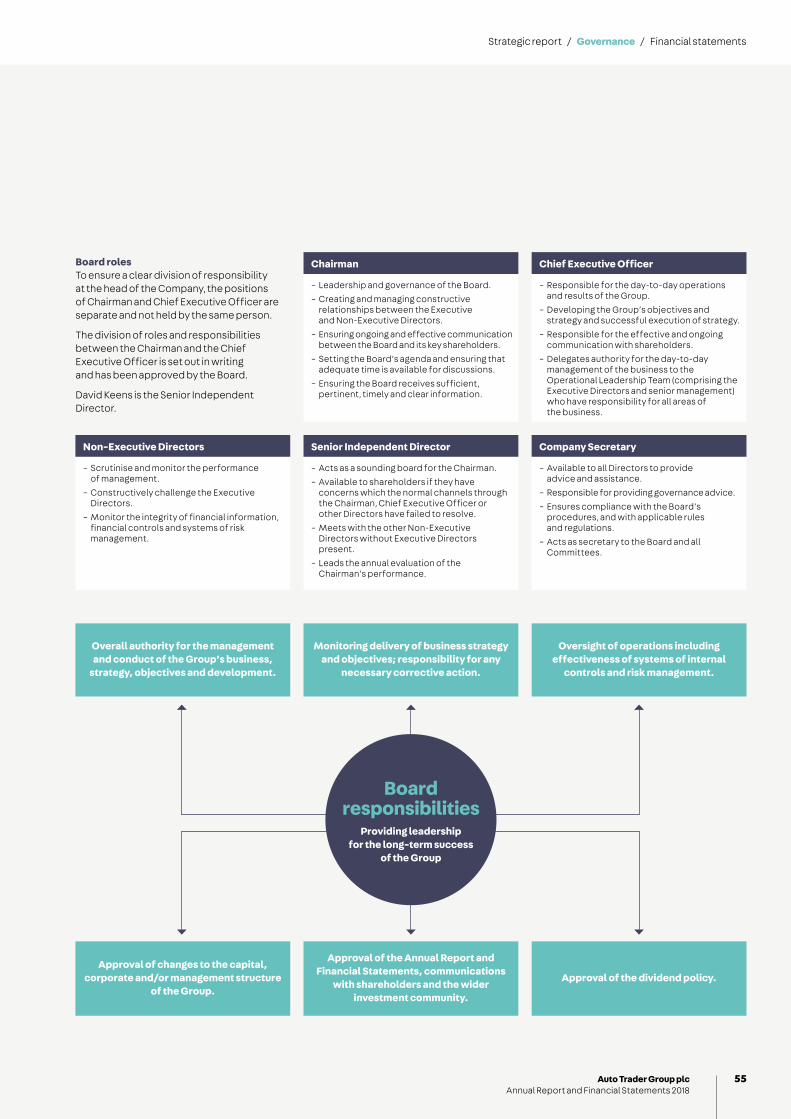
Board rolesTo ensure a clear division of responsibility at the head of the Company, the positions of Chairman and Chief Executive Officer are separate and not held by the same person.
The division of roles and responsibilities between the Chairman and the Chief Executive Officer is set out in writing and has been approved by the Board.
David Keens is the Senior Independent Director.
Chairman Chief Executive Officer
– Leadership and governance of the Board.
– Creating and managing constructive relationships between the Executive and Non-Executive Directors.
– Ensuring ongoing and effective communication between the Board and its key shareholders.
– Setting the Board’s agenda and ensuring that adequate time is available for discussions.
– Ensuring the Board receives sufficient, pertinent, timely and clear information.
– Responsible for the day-to-day operations and results of the Group.
– Developing the Group’s objectives and strategy and successful execution of strategy.
– Responsible for the effective and ongoing communication with shareholders.
– Delegates authority for the day-to-day management of the business to the Operational Leadership Team (comprising the Executive Directors and senior management) who have responsibility for all areas of the business.
Non-Executive Directors Senior Independent Director Company Secretary
– Scrutinise and monitor the performance of management.
– Constructively challenge the Executive Directors.
– Monitor the integrity of financial information, financial controls and systems of risk management.
– Acts as a sounding board for the Chairman.
– Available to shareholders if they have concerns which the normal channels through the Chairman, Chief Executive Officer or other Directors have failed to resolve.
– Meets with the other Non-Executive Directors without Executive Directors present.
– Leads the annual evaluation of the Chairman’s performance.
– Available to all Directors to provide advice and assistance.
– Responsible for providing governance advice.
– Ensures compliance with the Board’s procedures, and with applicable rules and regulations.
– Acts as secretary to the Board and all Committees.
Overall authority for the management and conduct of the Group’s business,
strategy, objectives and development.
Approval of changes to the capital, corporate and/or management structure
of the Group.
Monitoring delivery of business strategy and objectives; responsibility for any
necessary corrective action.
Approval of the Annual Report and Financial Statements, communications
with shareholders and the wider investment community.
Oversight of operations including effectiveness of systems of internal
controls and risk management.
Approval of the dividend policy.
Board responsibilities
Providing leadership for the long-term success
of the Group
Strategic report / Governance / Financial statements
55Auto Trader Group plc Annual Report and Financial Statements 2018

Corporate governance statement continued
B Effectiveness
Board composition, balance and independenceAt the date of this report, the Board consists of the Non-Executive Chairman, three independent Non-Executive Directors and two Executive Directors.
All of the Non-Executive Directors (David Keens, Jill Easterbrook and Jeni Mundy) are considered to be independent in character and judgement, and free of any business or other relationship which could materially influence their judgement. Ed Williams was considered to be independent on appointment. The Chairman’s fees and the Non-Executive Directors’ fees are disclosed on pages 75 and 79, and they received no additional remuneration from the Company during the year.
Therefore, at 31 March 2018 and to the date of this report, the Company is compliant with the Code provision that at least half the Board, excluding the Chairman, should comprise independent Non-Executive Directors.
The Board and its Committees have an appropriate balance of skills, experience and knowledge of the Group to enable them to discharge their respective duties and responsibilities effectively in accordance with main principle B.1 of the Code. Biographies of all members of the Board appear on pages 52 and 53.
Appointments to the BoardThe Board has established a Nomination Committee, chaired by Ed Williams, with all other members comprising independent Non-Executive Directors, and one of the main responsibilities of this Committee is to identify and nominate candidates for appointment as Directors to the Board. The work of the Committee is described on pages 60 and 61.
Non-Executive appointments to the Board are for an initial term of up to three years. Non-Executive Directors are typically expected to serve two three-year terms, although the Board may invite the Director to serve for an additional period.
Letters of appointmentThe Chairman and the Non-Executive Directors have letters of appointment which are available for inspection at the registered office of the Company during normal business hours and at the place of the AGM from at least 15 minutes before and until the end of the meeting. These letters set out the expected time commitment from each Director.
External directorshipsAny external appointments or other significant commitments of the Directors require the prior approval of the Board. Trevor Mather is a director on the board of Burns Sheehan Limited, a recruitment business, for which he does not receive any remuneration. The Board approved the appointment and confirmed that it was satisfied that there was no conflict of interest arising. Trevor is also Chair of Forever Manchester, a charity which Auto Trader supports through donations. Nathan Coe does not have any external directorships as at the date of this report. The Board is comfortable that external appointments of the Chairman and the Non-Executive Directors do not impact on the time that any Director devotes to the Company.
In accordance with the Company’s Articles of Association, the Board has a formal system in place for Directors to declare conflicts of interests and for such conflicts to be considered for authorisation.
Induction and developmentAll newly appointed Directors receive an induction briefing on their duties and responsibilities as Directors of a publicly quoted company. There is a formal induction programme to ensure that newly appointed Directors familiarise themselves with the Group and its activities, either through reading, meetings with the relevant member of senior management or through sessions in the Board meetings.
Each Board meeting contains a presentation from senior management on one of the focus areas for the year. Specific business-related presentations are given to the Board by senior management and external advisors when appropriate – refer to the table of activities opposite.
All Directors are offered the opportunity to meet with customers and take part in sales calls to understand the business from a customer’s perspective. There is a formal day of ‘dual calling’ where Board members accompany the sales force on their visits to customers. All Directors now receive a weekly newsletter from our sales and service team to ensure they are kept informed of the latest customer dialogue and sentiment.
The Board as a whole is updated, as necessary, in light of any governance developments as and when they occur, and there is an annual Legal and Regulatory Update provided as part of the Board meeting. All Directors are required to complete our annual compliance training modules covering anti-bribery, anti-money laundering, data protection and information security.
As part of the Board evaluation, the Chairman meets with each Director to discuss any individual training and development needs.
Information and support available to DirectorsFull and timely access to all relevant information is given to the Board. For Board meetings, this consists of a formal agenda, minutes of previous meetings and a comprehensive set of papers including regular operational and financial reports, provided to Directors in a timely manner in advance of meetings.
All of the Directors have the right to have their opposition to, or concerns over, any Board decision noted in the minutes. Directors are entitled to take independent professional advice at the Company’s expense in the furtherance of their duties, where considered necessary.
All Directors have access to the advice and services of the Company Secretary, Claire Baty.
Election of DirectorsThe Board can appoint any person to be a Director, either to fill a vacancy or as an addition to the existing Board. Any Director so appointed by the Board shall hold office only until the next AGM and shall then be eligible for election by the shareholders.
56 Auto Trader Group plc Annual Report and Financial Statements 2018
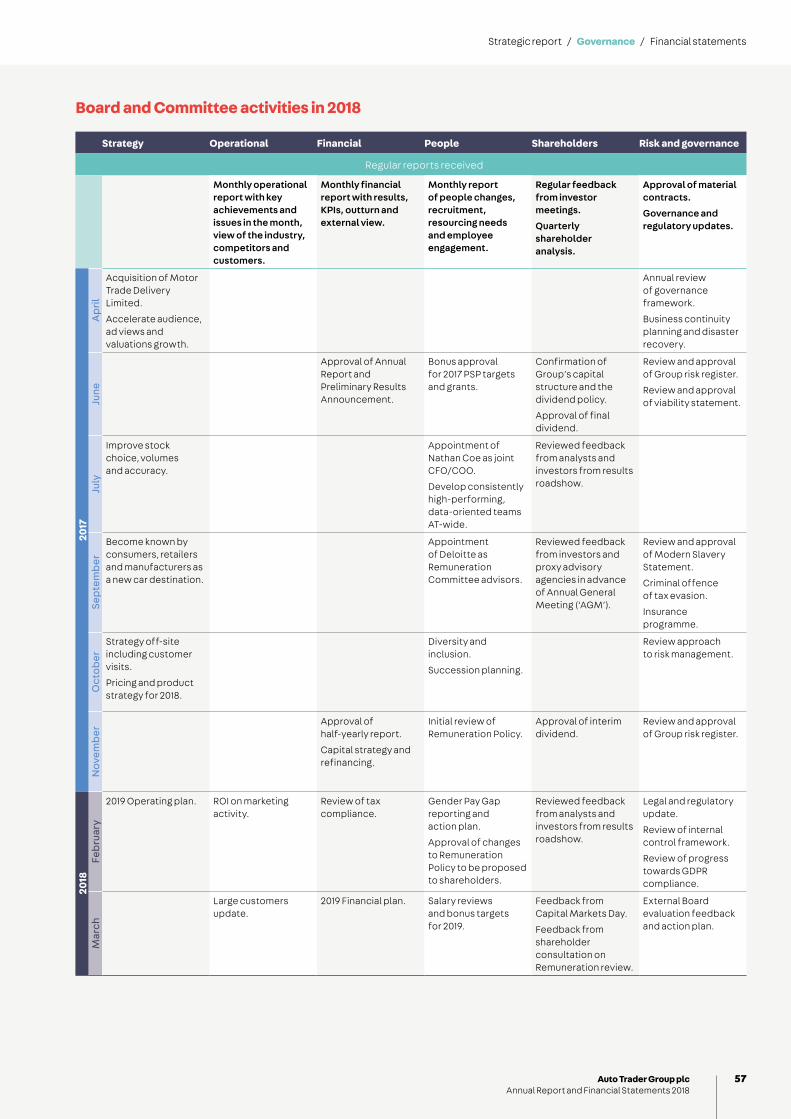
Board and Committee activities in 2018
Strategy Operational Financial People Shareholders Risk and governance
Regular reports received
Monthly operational report with key achievements and issues in the month, view of the industry, competitors and customers.
Monthly financial report with results, KPIs, outturn and external view.
Monthly report of people changes, recruitment, resourcing needs and employee engagement.
Regular feedback from investor meetings.
Quarterly shareholder analysis.
Approval of material contracts.
Governance and regulatory updates.
2017
Ap
ril
Acquisition of Motor Trade Delivery Limited.
Accelerate audience, ad views and valuations growth.
Annual review of governance framework.
Business continuity planning and disaster recovery.
June
Approval of Annual Report and Preliminary Results Announcement.
Bonus approval for 2017 PSP targets and grants.
Confirmation of Group’s capital structure and the dividend policy.
Approval of final dividend.
Review and approval of Group risk register.
Review and approval of viability statement.
July
Improve stock choice, volumes and accuracy.
Appointment of Nathan Coe as joint CFO/COO.
Develop consistently high-performing, data-oriented teams AT-wide.
Reviewed feedback from analysts and investors from results roadshow.
Sep
tem
ber
Become known by consumers, retailers and manufacturers as a new car destination.
Appointment of Deloitte as Remuneration Committee advisors.
Reviewed feedback from investors and proxy advisory agencies in advance of Annual General Meeting (‘AGM’).
Review and approval of Modern Slavery Statement.
Criminal offence of tax evasion.
Insurance programme.
Oct
ober
Strategy off-site including customer visits.
Pricing and product strategy for 2018.
Diversity and inclusion.
Succession planning.
Review approach to risk management.
Nov
emb
er
Approval of half-yearly report.
Capital strategy and refinancing.
Initial review of Remuneration Policy.
Approval of interim dividend.
Review and approval of Group risk register.
2018
Feb
ruar
y
2019 Operating plan. ROI on marketing activity.
Review of tax compliance.
Gender Pay Gap reporting and action plan.
Approval of changes to Remuneration Policy to be proposed to shareholders.
Reviewed feedback from analysts and investors from results roadshow.
Legal and regulatory update.
Review of internal control framework.
Review of progress towards GDPR compliance.
Mar
ch
Large customers update.
2019 Financial plan. Salary reviews and bonus targets for 2019.
Feedback from Capital Markets Day.
Feedback from shareholder consultation on Remuneration review.
External Board evaluation feedback and action plan.
Strategic report / Governance / Financial statements
57Auto Trader Group plc Annual Report and Financial Statements 2018

Corporate governance statement continued
Board evaluation and effectivenessIn the third year as a listed company, the Board engaged Independent Audit Limited to facilitate an external evaluation of the Board, Committees and individual Directors during the year.
This included interviews with each of the Board Directors and members of senior management, review of Board and Committee papers and observation of Board and Committee meetings. The draft findings were discussed with the Chairman and then presented to the Board in March 2018.
Actions arising from the review
The Board and Committees operate with a relatively informal and high trust approach, and should monitor that this continues to function well.
This will be kept under continuous review, and specifically focused on during meetings of the Chairman and Non-Executive Directors, including review of any behavioural early warnings, weakening business performance relative to the economic cycle, and retrospective review of major decisions taken.
The Board should develop a systematic approach to building a view of and measuring the culture of the business.
A cultural scorecard will be developed and used by the Board to formally measure and track culture.
The Nomination Committee should focus on succession planning and motivation of senior managers beyond the Board.
The Terms of Reference of the Nomination Committee have been broadened to explicitly include talent development and succession planning below Board level.
The Board should consider opportunities for deeper and wider contact between the Non-Executive Directors and the wider workforce.
More opportunities for contact are being developed, including employee forums, attendance at all-employee events and greater exposure to areas of the business on an ad hoc and informal basis.
Board papers should be reviewed to ensure they are consistent and concise, and address the desired areas.
The Company Secretary will review all Board papers to ensure that every paper has a clear purpose and positioning to give focus to Board discussions.
In addition, an assessment of the Chairman’s performance was carried out, led by the Senior Independent Director, and feedback was provided to him individually.
Overall, the results showed that the Board and its Committees continue to operate well, and that each individual Director continues to make an effective contribution.
C Accountability
The Board has established an Audit Committee, chaired by David Keens and comprised entirely of Independent Non-Executive Directors. The Committee has defined Terms of Reference which include assisting the Board in discharging many of its responsibilities with respect to financial and business reporting, risk management and internal control. The work of the Committee is described on pages 62 to 65.
Financial and business reportingAssisted by the Audit Committee, the Board has carried out a review of the 2018 Annual Report and considers that, in its opinion, the report is fair, balanced and understandable and provides the information necessary for shareholders to assess the Company’s position and performance, business model and strategy. Refer to the Audit Committee report on page 63 for details of the review process.
See pages 18 to 21 in the Strategic report for a description of our business model, strategy and focus areas.
See page 38 for the Board’s statement on going concern and the viability statement.
Risk management and internal controlThe Company does not have a separate Risk Committee; the Board is collectively responsible for determining the nature and extent of the principal risks it is willing to take in achieving its strategic objectives. The processes in place for assessment, management and monitoring of risks are described in a separate section on pages 32 to 33.
The Board acknowledges its responsibility for establishing and maintaining the Group’s system of risk management and internal controls and it receives regular reports from management identifying, evaluating and managing the risks within the business. The system of internal controls is designed to manage, rather than eliminate, the risk of failure to achieve business objectives and can provide only reasonable, and not absolute, assurance against material misstatement or loss. The Audit Committee reviews the system of internal controls through reports received from management, along with others from internal and external auditors. Management continues to focus on how internal controls and risk management can be further embedded into the operations of the business and on how to deal with areas of improvement which come to the attention of management and the Board.
The Board, assisted by the Audit Committee, has carried out a review of the effectiveness of the system of risk management and internal controls during the year ended 31 March 2018 and for the period up to the date of approval of the consolidated financial statements contained in the Annual Report. The review covered all material controls, including financial, operational and compliance controls and risk management systems. The Board considered the weaknesses identified and reviewed the developing actions, plans and programmes that it considered necessary. The Board confirms that no significant weaknesses or failings were identified as a result of the review of effectiveness.
58 Auto Trader Group plc Annual Report and Financial Statements 2018

D Remuneration
The Board has established a Remuneration Committee, chaired by Jill Easterbrook and comprised entirely of Independent Non-Executive Directors. The work of the Committee is described on pages 66 to 80.
E Relations with shareholders
The Board has a comprehensive investor relations programme to ensure that existing and potential investors understand the Company’s strategy and performance. As part of this programme, the Executive Directors give formal presentations to investors and analysts on the half-year and full-year results in November and June respectively. These updates are webcast live and then posted on the Group’s website and are available to all shareholders.
The results presentations are followed by formal investor roadshows in the UK and overseas.
In March 2018, a Capital Markets Day was held, attended by institutional investors, buy-side and sell-side analysts. During the Capital Markets Day, the Executive Directors presented an update on progress made since the IPO, information about long-term risks and opportunities, the automotive market and the competitive environment. Members of senior management also presented more detail on the Company’s customers, consumers and products, including product demonstrations.
All announcements, investor presentations, the Capital Markets Day presentations and the Annual Report are on the Company’s website: plc.autotrader.co.uk/investors
During the year, the Company carried out an extensive consultation process in relation to the Remuneration Policy to be proposed at the 2018 AGM, which included contact with the top 30 investors, and with proxy advisory agencies.
There is also an ongoing programme of attendance at conferences, one-to-one meetings and group meetings with institutional investors, fund managers and analysts. These meetings cover a wide range of issues, including strategy, performance and governance, but care is exercised to ensure that any price-sensitive information is released to all shareholders, institutional and private, at the same time. Meetings which relate to governance are attended by the Chairman or another Non-Executive Director as appropriate. Private shareholders are encouraged to give feedback and communicate with the Board through [email protected]
The Board receives regular reports on issues relating to share price, trading activity and movements in institutional investor shareholdings. The Board is also provided with current analyst opinions, forecasts and feedback from its joint corporate brokers, Bank of America, Merrill Lynch and Numis, on the views of institutional investors on a non-attributed and attributed basis, and on the views of analysts from its finance PR agency, Powerscourt. Any major shareholders’ concerns are communicated to the Board by the Executive Directors.
The Chairman, the Senior Independent Director and other Non-Executive Directors are available to meet with shareholders and arrangements can be made through the Company Secretary.
Annual General MeetingThe AGM of the Company will take place at 10.00 am on Thursday 20 September 2018 at the Company’s registered office at 4th Floor, 1 Tony Wilson Place, Manchester, M15 4FN. All shareholders have the opportunity to attend and vote, in person or by proxy, at the AGM.
All proxy votes received in respect of each resolution at the AGM are counted and the balance for and against, and any votes withheld, are indicated. At the meeting itself, voting on all the proposed resolutions is conducted on a poll rather than a show of hands, in line with recommended best practice. The Chairman, the Chair of each of the Committees and the Executive Directors are present at the AGM and available to answer shareholders’ questions.
The Notice of the AGM can be found in a booklet which is being mailed out at the same time as this Annual Report. The Notice of the AGM sets out the business of the meeting and an explanatory note on all resolutions. Separate resolutions are proposed in respect of each substantive issue. Results of resolutions proposed at the AGM will be published on the Company’s website: plc.autotrader.co.uk/investors following the AGM.
Strategic report / Governance / Financial statements
59Auto Trader Group plc Annual Report and Financial Statements 2018

Report of the Nomination Committee
Ed WilliamsChairman of the Nomination Committee
Composed of the Chairman and three independent Non-Executive Directors.
At least one meeting held per year.
Meetings are attended by the Chief Executive Officer and other relevant attendees by invitation.
For more information on the Committee’s Terms of Reference visit plc.autotrader.co.uk/investors
Three meetings were held during the year:
Meetings attended/ total meetings held
Percentage of meetings attended
Ed Williams (Chairman) 3/3 100%
David Keens 3/3 100%
Jill Easterbrook 3/3 100%
Jeni Mundy 3/3 100%
Our progress in 2018: – Appointment of Nathan Coe in joint role of Chief Financial Officer and Chief Operating Officer and continued monitoring of succession planning.
– Further focus on diversity and inclusion.
– Renewal of additional three-year term for the Chairman and Senior Independent Director.
– Engagement of external Board evaluators and review of the recommendations.
In 2019 we will: – Continue to monitor Board and senior management succession in the context of the Company’s long-term strategy.
– Renewal of additional three-year terms for Non-Executive Directors.
– Support management and the Board in promoting diversity in senior management and across the workforce.
Dear shareholders,I am pleased to present the Report of the Nomination Committee for 2018.
Role of the CommitteeThe Committee reviews the structure, size and composition of the Board and its Committees, and makes appropriate recommendations to the Board for appointments to the Board.
The Committee also has specific responsibility to oversee diversity and inclusion across the whole Group; and as a result of the external Board evaluation, now monitors talent development below Board level.
How the Committee operatesAll members of the Committee are independent Non-Executive Directors. The Chairman of the Board chairs all meetings of the Committee unless they relate to the appointment of his successor; for these meetings, the Senior Independent Director (‘SID’) is invited to take the Chair unless the SID is in contention for the role.
The Committee meets at least annually, and on an ad hoc basis as required throughout the year. Only members of the Committee have the right to attend meetings; however, the Chief Executive Officer attends for all or part of meetings so that the Committee can understand his views, particularly on key talent within the business.
Succession planning in action The Committee recognises that effective succession planning is critical to the Company’s long-term success.
Our succession plans were put into action when Sean Glithero announced his intention to resign in July 2017. The Committee considered the options for replacing Sean, and agreed that, in line with the succession plan, Nathan Coe was the most suitable candidate for CFO in addition to his existing role as COO, and so was appointed as joint CFO/COO with effect from 21 September 2017.
Following Nathan’s appointment and Sean’s departure, the Committee reviewed and updated the succession plan to ensure orderly succession for the Board and senior management, in the context of the Group’s strategy. The succession plan takes into account future skills requirements in the context of the Group’s strategy, as well as recognising the importance of growing and developing our internal talent.
Policy on appointments to the BoardThe most important priority of the Committee has been, and will continue to be, ensuring that members of the Board should collectively possess the broad range of skills, expertise and industry knowledge, and business and other experience necessary for the effective oversight of the Group.
Appointments are made on merit, against objective criteria and with due regard to the benefits of diversity on the Board. The Committee takes account of a variety of factors before recommending any new appointments to the Board, including relevant skills to perform the role, experience, knowledge and diversity, including gender diversity.
We have a target of women representation on our Board of 25%, and we continue to meet this target, as two of our six Board members are women.
60 Auto Trader Group plc Annual Report and Financial Statements 2018

Board compositionAs at 31 March 2018
ChairmanIndependent Non-Executive DirectorsExecutive Directors
1
3
2
4
2
Board diversityAs at 31 March 2018
MenWomen
4
1 1
Board tenureAs at 31 March 2018
Over 5 years2-5 yearsUp to 2 years
Diversity and inclusionThe Nomination Committee’s Terms of Reference also include the responsibility to oversee diversity and inclusion across the whole Group, not just at Board and senior management level.
The Company has established a Diversity and Inclusion Guild, with representation from across all parts of the business and led by members of our Operational Leadership Team. This guild is responsible for developing and driving our strategy to create a diverse, inclusive and conscious Auto Trader, and reports to the Nomination Committee on its activities and progress.
Diversity at Auto Trader means respect for and appreciation of differences in: gender, age, sexual orientation, disability, race and ethnic origin, religion and faith, marital status, social, educational background and way of thinking. We do not set targets but we do aim for our employee workforce to be reflective of the communities in which we operate, across all aspects of diversity.
We acknowledge the recommendations of the Hampton-Alexander Review and we are committed to strengthening women representation at senior management level and throughout the organisation, particularly in parts of the business where women are currently unrepresented, such as technology.
We are pleased to report that 50% of our Operational Leadership Team (‘OLT’) and 27% of the OLT’s direct reports are women.
External Board evaluationDuring the year, there was an externally facilitated Board evaluation. This is described in detail on page 58 of the corporate governance statement.
Independence and re-election to the BoardIn accordance with the UK Corporate Governance Code, all Directors will retire and offer themselves for election or re-election to the Board.
The Directors who have been in post throughout the year have been subject to a formal evaluation process, and both the Committee and the Board are satisfied that all Directors continue to be effective in, and demonstrate commitment to, their respective roles on the Board and that each makes a valuable contribution to the leadership of the Company.
The Board therefore recommends that shareholders approve the resolutions to be proposed at the 2018 AGM relating to the election and re-election of the Directors.
I will be available at the AGM to answer any questions on the work of the Committee.
Ed WilliamsChairman of the Nomination Committee 7 June 2018
Strategic report / Governance / Financial statements
61Auto Trader Group plc Annual Report and Financial Statements 2018

Report of the Audit Committee
David KeensChairman of the Audit Committee
Composed of three independent Non-Executive Directors.
David Keens is considered by the Board to have recent and relevant experience. All members have significant commercial and operating experience in consumer and digital businesses.
At least three meetings held per year.
Meetings are attended by the Chief Financial Officer and Chief Operating Officer, Chief Executive Officer, internal auditors and external auditors by invitation.
For more information on the Committee’s Terms of Reference visit plc.autotrader.co.uk/investors
Dear shareholders,I am pleased to introduce the Audit Committee report for 2018.
The Committee operates under defined Terms of Reference and assists the Board in discharging many of its responsibilities over monitoring the integrity of the Group’s financial reporting; the effectiveness of the internal control and risk management framework; the internal audit function; and the independence and effectiveness of the external auditors. The Committee is comprised entirely of independent Non-Executive Directors. I fulfil the requirement for a Committee member to have recent and relevant financial experience, and all members (and therefore the Committee as a whole) have competence in consumer and digital businesses.
The Committee met four times during the year, arranged around our external reporting and audit cycle and with an additional meeting this year in relation to GDPR compliance. Meetings are attended by the CFO/COO and other members of management by invitation, and with representation from KPMG and Deloitte. The Committee reviewed significant accounting matters with an appropriate level of challenge and debate. We believe that the information in this Annual Report clearly explains progress against our strategic objectives and is fair, balanced and understandable.
The Committee plays a key role in ensuring that we continue to have a robust internal control and risk management process. Our internal audit function is outsourced to Deloitte LLP, who continue to provide us with specialist expertise in delivering a risk-based rolling review programme.
At the 2017 AGM, shareholders approved the Board’s recommendation to re-appoint KPMG LLP as our external auditors. The Committee has carried out a review of the effectiveness and independence of KPMG and has recommended to the Board that they are re-appointed at the 2018 AGM.
David KeensChairman of the Audit Committee 7 June 2018
Four meetings were held during the year:
Meetings attended/ total meetings held
Percentage of meetings attended
David Keens (Chairman) 4/4 100%
Jill Easterbrook 4/4 100%
Jeni Mundy 4/4 100%
Our progress in 2018: – Focus on key areas of judgement, including acquisition accounting for Motor Trade Delivery and treatment of contingent liability for VAT treatment of insurance revenue.
– Review of effectiveness of internal audit function, internal controls and risk management framework.
– Evaluate effectiveness and independence of external audit.
– Review of GDPR compliance.
In 2019 we will: – Agree with KPMG any changes for their 2019 audit.
– Review the impact of changes to accounting policies for IFRS 9, IFRS 15 and IFRS 16.
– Continue to review the effectiveness of the internal audit function and risk management framework.
62 Auto Trader Group plc Annual Report and Financial Statements 2018
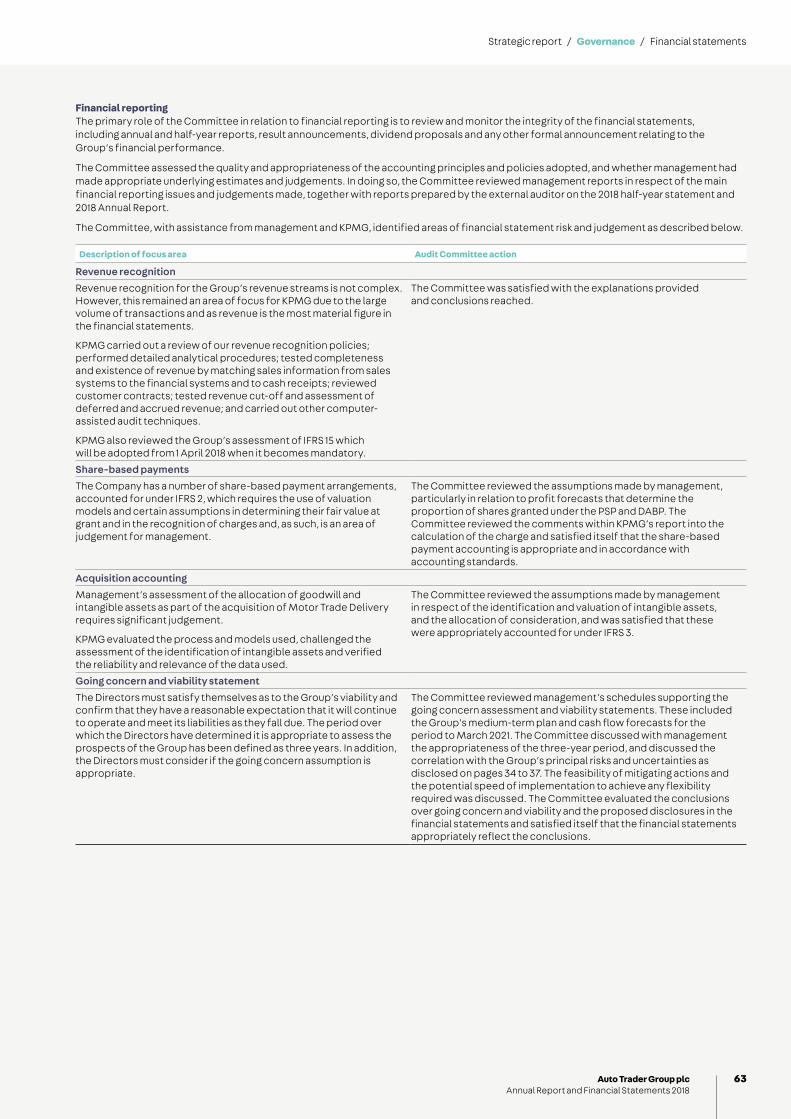
Financial reportingThe primary role of the Committee in relation to financial reporting is to review and monitor the integrity of the financial statements, including annual and half-year reports, result announcements, dividend proposals and any other formal announcement relating to the Group’s financial performance.
The Committee assessed the quality and appropriateness of the accounting principles and policies adopted, and whether management had made appropriate underlying estimates and judgements. In doing so, the Committee reviewed management reports in respect of the main financial reporting issues and judgements made, together with reports prepared by the external auditor on the 2018 half-year statement and 2018 Annual Report.
The Committee, with assistance from management and KPMG, identified areas of financial statement risk and judgement as described below.
Description of focus area Audit Committee action
Revenue recognitionRevenue recognition for the Group’s revenue streams is not complex. However, this remained an area of focus for KPMG due to the large volume of transactions and as revenue is the most material figure in the financial statements.
KPMG carried out a review of our revenue recognition policies; performed detailed analytical procedures; tested completeness and existence of revenue by matching sales information from sales systems to the financial systems and to cash receipts; reviewed customer contracts; tested revenue cut-off and assessment of deferred and accrued revenue; and carried out other computer-assisted audit techniques.
KPMG also reviewed the Group’s assessment of IFRS 15 which will be adopted from 1 April 2018 when it becomes mandatory.
The Committee was satisfied with the explanations provided and conclusions reached.
Share-based paymentsThe Company has a number of share-based payment arrangements, accounted for under IFRS 2, which requires the use of valuation models and certain assumptions in determining their fair value at grant and in the recognition of charges and, as such, is an area of judgement for management.
The Committee reviewed the assumptions made by management, particularly in relation to profit forecasts that determine the proportion of shares granted under the PSP and DABP. The Committee reviewed the comments within KPMG’s report into the calculation of the charge and satisfied itself that the share-based payment accounting is appropriate and in accordance with accounting standards.
Acquisition accounting Management’s assessment of the allocation of goodwill and intangible assets as part of the acquisition of Motor Trade Delivery requires significant judgement.
KPMG evaluated the process and models used, challenged the assessment of the identification of intangible assets and verified the reliability and relevance of the data used.
The Committee reviewed the assumptions made by management in respect of the identification and valuation of intangible assets, and the allocation of consideration, and was satisfied that these were appropriately accounted for under IFRS 3.
Going concern and viability statementThe Directors must satisfy themselves as to the Group’s viability and confirm that they have a reasonable expectation that it will continue to operate and meet its liabilities as they fall due. The period over which the Directors have determined it is appropriate to assess the prospects of the Group has been defined as three years. In addition, the Directors must consider if the going concern assumption is appropriate.
The Committee reviewed management’s schedules supporting the going concern assessment and viability statements. These included the Group’s medium-term plan and cash flow forecasts for the period to March 2021. The Committee discussed with management the appropriateness of the three-year period, and discussed the correlation with the Group’s principal risks and uncertainties as disclosed on pages 34 to 37. The feasibility of mitigating actions and the potential speed of implementation to achieve any flexibility required was discussed. The Committee evaluated the conclusions over going concern and viability and the proposed disclosures in the financial statements and satisfied itself that the financial statements appropriately reflect the conclusions.
Strategic report / Governance / Financial statements
63Auto Trader Group plc Annual Report and Financial Statements 2018

Report of the Audit Committee continued
Fair, balanced and understandableAt the request of the Board, the Committee has reviewed the content of the 2018 Annual Report and considered whether, taken as a whole, in its opinion it is fair, balanced and understandable and provides the information necessary for shareholders to assess the Company’s position, performance, business model and strategy. The Committee was provided with an early draft of the Annual Report, and provided feedback on areas where further clarity or information was required in order to provide a complete picture of the Group’s performance. The final draft was then presented to the Audit Committee for review before being recommended for approval by the Board. When forming its opinion, the Committee reflected on discussions held during the year and reports received from the external auditor and considered the following main areas:
Is the report fair?
– Is a complete picture presented and has any sensitive material been omitted that should have been included?
– Are key messages in the narrative aligned with the KPIs and are they reflected in the financial reporting?
– Are the revenue streams described in the narrative consistent with those used for financial reporting in the financial statements?
Is the report balanced?
– Is there a good level of consistency between the reports in the front and the reporting in the back of the Annual Report?
– Do you get the same messages when reading the front end and the back end independently?
– Is there an appropriate balance between statutory and adjusted measures and are any adjustments explained clearly with appropriate prominence?
– Are the key judgements referred to in the narrative reporting and significant issues reported in the Report of the Audit Committee consistent with disclosures of key estimation uncertainties and critical judgements set out in the financial statements?
– How do these compare with the risks that KPMG are planning to include in their report?
Is the report understandable?
– Is there a clear and cohesive framework for the Annual Report?
– Are the important messages highlighted and appropriately themed throughout the document?
– Is the report written in accessible language and are the messages clearly drawn out?
Following the Committee’s review, the Directors confirm that, in their opinion, the 2018 Annual Report, taken as a whole, is fair, balanced and understandable and provides the information necessary for shareholders to assess the Company’s position and performance, business model and strategy.
Risk management and internal controlThe Committee’s responsibilities include a review of the risk management systems and internal controls to ensure that they remain effective and that any identified weaknesses are properly dealt with. The Committee:
– reviews annually the effectiveness of the Group’s internal control framework;
– receives reports from the Group’s outsourced internal audit function and ensures recommendations are implemented where appropriate; and
– reviews reports from the external auditors on any issues identified in the course of their work, including any internal control reports received on control weaknesses, and ensures that there is an appropriate response from management.
The Group has internal controls and risk management systems in place in relation to its financial reporting processes and preparation of consolidated accounts. These systems include policies and procedures to ensure that adequate accounting records are maintained and transactions are recorded accurately and fairly to permit the preparation of financial statements in accordance with IFRS. The internal control systems include the elements described below.
Element Approach and basis for assurance
Risk management
Whilst risk management is a matter for the Board as a whole, the day-to-day management of the Group’s key risks resides with the Operational Leadership Team (‘OLT’) and is documented in a risk register. A review and update of the risk register is undertaken twice a year and reviewed by the Board. The management of identified risks is delegated to the OLT, and regular updates are given to executive management at quarterly steering group meetings.
Financial reporting
Group consolidation is performed on a monthly basis with a month-end pack produced that includes an income statement, balance sheet, cash flow statement and detailed analysis. The month-end pack also includes KPIs and these are reviewed each month by the OLT and the Board. Results are compared against the Plan or Reforecast and narrative provided by management to explain significant variances.
Budgeting and reforecasting
An annual Plan is produced and monthly results are reported against this. A half-year Reforecast is produced. The Plan and the Reforecast are prepared using a bottom up approach, informed by a high-level assessment of market and economic conditions. Reviews are performed by the OLT and the Board whilst the Plan is also compared to the top down Medium Term Plan (‘MTP’) as a sense check. The Plan is approved by the OLT and the Board, and the Reforecast is approved by the OLT and reported to the Board.
Delegation of authority and approval limits
A documented structure of delegated authorities and approval for transactions is maintained beyond the Board’s Terms of Reference. This is reviewed regularly by management to ensure it remains appropriate for the business.
Segregation of duties
Procedures are defined to segregate duties over significant transactions, including procurement, payments to suppliers, payroll and discounts/refunds. Key reconciliations are prepared and reviewed on a monthly basis to ensure accurate reporting.
64 Auto Trader Group plc Annual Report and Financial Statements 2018

Internal auditDeloitte has been appointed as the Group’s outsourced internal audit function. They are accountable to the Audit Committee and use a risk-based approach to provide independent assurance over the adequacy and effectiveness of the control environment. The internal audit work plan for 2018 was approved by the Audit Committee and covers a broad range of core financial and operational processes and controls, focusing on specific risk areas, including:
– FCA compliance framework
– Fraud risk management
– Business continuity planning
– GDPR readiness
– Key financial controls
Management actions that are recommended following the audits are tracked to completion and reviewed by the Committee to ensure that identified risks are mitigated appropriately.
The Committee met with representatives from Deloitte without management present and with management without representatives of Deloitte present. There were no issues of significance raised during these meetings.
WhistleblowingA whistleblowing policy has been adopted which includes access to a whistleblowing telephone service run by an independent organisation, allowing employees to raise concerns on an entirely confidential basis. The Committee receives regular reports on the use of the service, any significant reports that have been received, the investigations carried out and any actions arising as a result.
External auditorsOne of the Committee’s roles is to oversee the relationship with the external auditor, KPMG, and to evaluate the effectiveness of the service provided and their ongoing independence. The Committee has carried out a review based on discussion of audit scope and plans, materiality assessments, review of auditors’ reports and feedback from management on the effectiveness of the audit process, and has concluded that the external auditor remains effective and independent.
During the year the Committee reviewed KPMG’s findings of the external auditor in respect of their review of the half-yearly report for the six-month period ending 30 September 2017, and in respect of the audit of the financial statements for the year ended 31 March 2018. The Committee met with representatives from KPMG without management present and with management without representatives of KPMG present, to ensure that there were no issues in the relationship between management and the external auditor which it should address. There were none.
The Committee has reviewed, and is satisfied with, the independence of KPMG as the external auditor.
Non-audit services provided by the external auditorThe external auditor is primarily engaged to carry out statutory audit work. There may be other services where the external auditor is considered to be the most suitable supplier by reference to their skills and experience. It is the Group’s practice that it will seek quotes from several firms, which may include KPMG, before engagements for non-audit projects are awarded. Contracts are awarded based on individual merits. A policy is in place for the provision of non-audit services by the external auditor, to ensure that the provision of such services does not impair the external auditor’s independence or objectivity, in accordance with the EU Audit Reform.
Non-audit service Policy
Audit-related services directly related to the audit For example, the review of interim financial statements, compliance certificates and reports to regulators.
Considered to be approved by the Committee up to a level of £100,000 for each individual engagement, and to a maximum aggregate in any financial year of the higher of £200,000 and 70% of the average audit fees paid to the audit firm in the last three consecutive years.
Any engagement of the external auditor to provide permitted services over these limits is subject to the specific approval in advance by the Audit Committee.
Acceptable non-audit servicesIncluding, but not limited to: work related to mergers, acquisitions, disposals, joint ventures or circulars; benchmarking services; and corporate governance advice.
Prohibited services In line with the EU Audit Reform, services where the auditor’s objectivity and independence may be compromised by the threat of self-interest, self-review, management, advocacy, familiarity or intimidation – for example, tax services, accounting services, internal audit services, valuation services and financial systems consultancy.
Prohibited, with the exception of certain services which are subject to derogation if certain conditions are met, in accordance with the EU Audit Reform.
Refer to plc.autotrader.co.uk/investors for full details of the policy. During the year, KPMG charged the Group £37,575 for audit-related assurance services.
The Statutory Audit Services for Large Companies Market Investigation (Mandatory Use of Competitive Tender Processes and Audit Committee Responsibilities) Order 2014 – statement of complianceAs a competitive tender was carried out in 2016, and KPMG LLP were first appointed as statutory auditors in the financial year to March 2017, we have complied with the requirement that the external audit contract is tendered within the 10 years prescribed by EU and UK legislation and the Code’s recommendation. The Company confirms that it complied with the provisions of the Competition and Markets Authority’s Order for the financial year under review.
David KeensChairman of the Audit Committee 7 June 2018
Strategic report / Governance / Financial statements
65Auto Trader Group plc Annual Report and Financial Statements 2018

Directors’ remuneration report
Jill EasterbrookChairman of the Remuneration Committee
Composed of three independent Non-Executive Directors.
At least two meetings held per year.
The Company Chairman, Chief Executive Officer, the Chief Financial Officer and Chief Operating Officer and other relevant individuals are invited to attend the meetings – no person is present during any discussion relating to their own remuneration.
The Company Secretary acts as secretary to the Committee.
For more information on the Committee’s Terms of Reference visit plc.autotrader.co.uk/investors
Three meetings were held during the year:
Meetings attended/ total meetings held
Percentage of meetings attended
Jill Easterbrook (Chairman) 3/3 100%
David Keens 3/3 100%
Jeni Mundy 3/3 100%
Our progress in 2018: – Reviewed our remuneration framework to ensure it remains aligned with our strategy in advance of submitting a revised Directors’ Remuneration Policy for approval at the 2018 AGM.
– Consulted with shareholders in relation to this revised framework, the most notable aspect of which is the replacement of TSR with Total Group revenue growth in our PSP.
– Assessed the achievement of targets for the 2018 annual bonus and 2015 PSP awards.
– Determined the remuneration packages in respect of the exit of Sean Glithero and the change in role of Nathan Coe.
– Set appropriate targets for 2019 bonuses and PSP awards to be granted in 2018.
– Gave consideration to the approach to equity participation across the workforce and launched our second SAYE scheme in 2018.
– Approved the 2017/18 Directors’ remuneration report.
In 2019 we will: – Continue to monitor the executive pay environment, governance developments and market practice.
– Determine how pay should be implemented for 2019/20 and set appropriate targets for annual bonus and long-term awards.
– Assess the achievement of targets for the 2019 annual bonus and 2016 PSP awards.
Dear shareholders,I am pleased to present, on behalf of the Board, the Report of the Remuneration Committee (the ‘Committee’) in respect of the year ended 31 March 2018.
Performance and reward in 20182018 has been another strong year, with revenue growth of 7% and Operating profit growth of 10%. We have also continued to deliver good progress against our strategy. Further details can be found on pages 20 to 21 of the Strategic report.
Annual bonusThe annual bonus for 2018 was based 75% on Operating profit and 25% on strategic targets (growth in full page advert views and penetration of managing products). Operating profit was £220.6m, slightly above our target of £219.0m, which resulted in a payout of 62% of maximum for this element. Full page advert views showed a slight decline, which was below the threshold for this element. Managing forecourts grew by a further 20% to 3,000 which was just below our target of 3,100. Total bonus for 2017/18 was therefore 50.3% of maximum, resulting in payments of £411,830 for the CEO and £228,706 for the CFO & COO. Half of this bonus will be deferred into shares for a two-year period.
Performance Share Plan (‘PSP’)Our first PSP award following IPO was awarded in 2015 and will vest in June 2018 based on performance over the three years to 31 March 2018. The award was based 75% on Cumulative Underlying operating profit performance and 25% on Total Shareholder Return (‘TSR’) relative to the FTSE 250 (excluding investment trusts). Cumulative Underlying operating profit performance for the three years to 31 March 2018 was £603m, which was above the maximum of £550m. TSR performance exceeded the index by 27%, which is again above the maximum target of 25%, and so overall, this award will vest in full in June 2018. Under the terms of the PSP holding period, the Directors will retain the vested shares received for at least two years from the point of vesting.
The Committee judged that annual bonus plan payouts and the level of PSP award vesting appropriately reflected the underlying performance of the Company.
Remuneration reviewIn light of the requirement to seek shareholder approval for a new policy at the 2018 AGM, during 2017/18 the Committee undertook a thorough review of our current remuneration arrangements. The Committee considered a range of options for the structure of remuneration going forward, but ultimately concluded that our current remuneration framework has been successful and continues to be appropriate for the Executive Directors.
The Committee has, however, made some modifications to the structure and assessment of performance measures for the PSP to better align performance measures with our strategy as well as to simplify and increase the transparency of our approach to assessing performance and setting targets. These modifications are as follows:
– Total Group revenue growth will replace relative TSR as a performance measure for 25% of the PSP award from 2018 onwards. Revenue growth is an important performance indicator of the business and the Committee believes that incentivising management to continue to grow revenue performance through our three business lines – Trade, Consumer services and Manufacturer and Agency – will support long-term profit growth and shareholder value creation.
Annual statement by the Chairman of the Remuneration Committee
66 Auto Trader Group plc Annual Report and Financial Statements 2018

– To ensure revenue performance is aligned with long-term value creation the vesting for the revenue portion of the award will be subject to an ‘underpin’ whereby the Operating profit measure must be at least at threshold levels of performance for any portion of the Total Group revenue element to pay out.
– To ensure sustained long-term value creation for shareholders, a further underpin will apply to the two-year post-vesting holding period, whereby the Committee has discretion to make a downward adjustment if there has been a material subsequent deterioration in underlying performance which significantly departs from any market deterioration.
– The Committee reconfirmed that Operating profit remains the most appropriate profit measure for the remainder of the PSP. Although EPS is widely used by other companies for long-term incentives, the Committee believes that the method by which cash may be returned to shareholders (e.g. through share buybacks) should not affect executive compensation and therefore believes that Operating profit is a more appropriate performance measure for the PSP.
– Operating profit will be assessed based on growth over the three-year performance period rather than Cumulative Operating profit as used previously, aligning with the way revenue growth is assessed.
– Taking into account shareholder feedback and to increase transparency, we will disclose Total Group revenue and Operating profit PSP targets at the time of award rather than with a one-year delay. Targets for 2018 PSP awards are set out on page 70.
75% based onCumulative Operating
profit
75% on Operatingprofit growth
25% based on TSRrelative to the FTSE 250 (excl. investment trusts)
25% based on GroupTotal revenue growth
Current Proposed
Other elements of our policy will continue unchanged.
Board changesSean Glithero left the Board on 21 September 2017. He received salary, benefits and pension to this date. No further payments were made in lieu of notice. On his departure all his long-term incentives and deferred bonus shares lapsed.
Implementation of policy for 2018/19Salary and incentive opportunities On 3 July 2017, it was announced that following Sean Glithero’s departure, Nathan Coe would be taking on the role of Chief Financial Officer in addition to his existing role of Chief Operating Officer. The Committee reviewed Nathan’s package and agreed the following changes to reflect the significant increase in the size and the scope of his responsibilities given his combined CFO & COO role:
– His base salary was increased to £370,000 with effect from 1 April 2018. This is an increase of 5.7% on his current salary and represents both an annual adjustment and an increment to reflect his promotion to CFO, in addition to his previous COO responsibilities. For reference, across the Group for the 2018/19 financial year, the average increase in salary was around 3.5%, reflecting both the general market, promotions and individual rewards for performance.
– His annual bonus opportunity will be increased, subject to the approval of our new Remuneration Policy, to 150% of base salary (from 130%). His PSP opportunity will be increased to 200% of base salary (from 150%). This brings his incentive package in line with the current award opportunities for the CEO.
– Note that Nathan’s shareholding guideline will also increase from 150% to 200% of salary, in line with the increase to the PSP award.
This approach creates a market competitive total package, but with the increase to quantum driven primarily via the annual bonus and PSP, which are subject to the achievement of stretching short and long-term performance targets, which is best aligned to the interests of our investors. Fixed pay would continue to be positioned towards the lower end of market practice compared to companies of a similar size and complexity to Auto Trader. Following this increase the Committee believes that Nathan’s salary and total compensation package will be appropriately positioned to reflect the size and scope of his dual role and it is intended that any future salary increases will be in line with those awarded to other employees in the business.
For our CEO, Trevor Mather, his salary was increased by 2% to £557,134 with effect from 1 April 2018 in line with the general increase for other employees across the Group. His maximum bonus opportunity and his PSP award will continue to be 150% and 200% of salary, respectively, in line with the Policy.
Annual bonus75% of the maximum bonus opportunity will be based on Operating profit with the remaining 25% being based on two strategic metrics (based on stock and audience targets, which underpin the core health and position of our business). Targets will be disclosed retrospectively in next year’s report.
PSPFor the 2018 award, 75% will be based on Operating profit growth, requiring compound annual growth over a three-year period of 10% for maximum vesting. As outlined above, the remaining 25% will be based on Total Group revenue growth, requiring 8% growth for maximum vesting. The targets are disclosed in full on page 70.
The Committee consulted with our main shareholders regarding the proposed changes set out above and was pleased with the level of support received.
This remuneration report is in three parts.
– This Annual Statement by the Chairman of the Remuneration Committee.
– The Directors’ Remuneration Policy (set out on pages 68 to 73), which sets out our Policy for Executive Director and Non-Executive Director remuneration. The Policy will be subject to a binding shareholder vote at the AGM on 20 September 2018.
– The Annual Report on Remuneration (set out on pages 74 to 80), which sets out how the Policy has been implemented during 2017/18 and how we intend to implement the Policy for 2018/19. The Annual Statement by the Chairman, together with the Annual Report on Remuneration, will be subject to an advisory vote at the AGM on 20 September 2018.
This report has been prepared in accordance with the Companies Act 2006, Schedule 8 of the Large and Medium-sized Companies and Groups (Accounts and Reports) Regulations 2008 (as amended in 2013) and the UKLA’s Listing Rules.
I hope that you will be supportive of the AGM resolutions to approve our Directors’ Remuneration Policy and our Annual Report on Remuneration for 2017/18. I shall be available at the AGM to answer any specific questions that you may have.
Jill EasterbrookChairman of the Remuneration Committee 7 June 2018
Strategic report / Governance / Financial statements
67Auto Trader Group plc Annual Report and Financial Statements 2018

Directors’ remuneration report continued
This Remuneration Policy will be put to shareholders for approval in a binding vote at the AGM on 20 September 2018 and will be effective from this date.
Policy overviewAs outlined in the Remuneration Committee Chairman’s statement, in light of the requirement to seek shareholder approval for a new Remuneration Policy, the Committee undertook a thorough review of the current remuneration arrangements for Executive Directors, considering a range of potential approaches. The Committee concluded that the current framework remains appropriate and therefore the Policy will be re-submitted to shareholders largely unchanged from the version approved by shareholders at the 2015 AGM. Minor changes have been made to the Policy to clarify its practical operation and to reflect prevailing market practice.
The Policy is structured so as to ensure that the main elements of remuneration are linked to Company strategy, in line with best practice and aligned with shareholders’ interests. The Policy is designed to reward Executive Directors by offering competitive remuneration packages, which are prudently constructed, sufficiently stretching and linked to long-term profitability. In promoting these objectives, the Policy aims to be simple in design, transparent and structured so as to adhere to the principles of good corporate governance and appropriate risk management.
A further aim of the Remuneration Policy is to encourage a culture of share ownership by colleagues throughout the Company, and in support of this we have both a SIP, under which an award of free shares to commemorate the Admission was granted, and a SAYE scheme. In November 2017 we launched our second SAYE programme.
How the views of shareholders and employees are taken into accountWhilst the Committee does not consult directly with employees on the Directors’ Remuneration Policy, the Committee does receive regular updates regarding remuneration arrangements across the Group. These updates are taken into consideration when determining the Remuneration Policy for the Executive Directors and in particular when considering any changes to policy and increases in the level of fixed remuneration. The Company regularly undertakes an employee engagement survey which includes questions to understand employees’ views on their own remuneration and benefits, which the Committee also reviews.
The Committee is committed to a constructive dialogue with our shareholders in order to ensure that our Remuneration Policy is aligned with their views. The Committee consulted with shareholders in advance of submitting our revised Policy to the shareholder vote and carefully considered the feedback received. In conjunction with any additional feedback received from time to time, this will be considered as part of the Committee’s annual review of how we intend to implement our Remuneration Policy.
If any significant changes to our Remuneration Policy which require shareholder approval are proposed, the Committee will seek to engage with major shareholders to explain our proposals and obtain feedback.
Remuneration Policy for Executive DirectorsOur Policy is designed to offer competitive, but not excessive, remuneration structured so that there is a significant weighting towards performance-based elements. A significant proportion of our variable pay is delivered in shares with deferral and holding periods being mandatory, and with appropriate recovery and withholding provisions in place to safeguard against overpayments in the event of certain negative events occurring. The table below provides a full summary of the Policy elements for Executive Directors.
ElementPurpose and linkto strategy
Operation and performance conditions
Maximumopportunity
Performance assessment
Salary To recruit and reward executives of high calibre.
Recognises individual’s experience, responsibility and performance.
Salaries are normally reviewed annually with changes effective from 1 April but may be reviewed at other times if considered appropriate.
Salary reviews will consider:
– personal performance;
– Group performance;
– the nature and scope of the role;
– the individual’s experience; and
– increases elsewhere in the Company.
Periodic reviews of market practice (for example, in comparable companies in terms of size and complexity) will also be undertaken.
The Committee considers the impact of any salary increase on the total remuneration package.
There is no prescribed maximum salary level or salary increase; however, any base salary increases will normally be in line with the percentage increases awarded to other employees of the Group.
However, increases may be made outside of this policy in appropriate circumstances, such as:
– Where a Director is appointed on a salary that is at the lower end of the market practice range, larger increases may be awarded as the executive gains experience to move the salary closer to a more typical market level.
– Where there has been a change in the nature and scope of the role.
– Where there has been a significant and sustained change in the size and complexity of the business.
– Where there has been a significant change in market practice.
The Committee reviews the salaries of Executive Directors each year taking due account of all the factors described in how the salary policy operates.
Directors’ Remuneration Policy
68 Auto Trader Group plc Annual Report and Financial Statements 2018

ElementPurpose and linkto strategy
Operation and performance conditions
Maximumopportunity
Performance assessment
Benefits To provide competitive benefits to ensure the wellbeing of employees.
Executive Directors are entitled to the following benefits:
– life assurance;
– income protection insurance; and
– private medical insurance.
The Committee may determine that Executive Directors should receive additional reasonable benefits if appropriate, taking into account typical market practice and practice throughout the Group.
Executive Directors may be reimbursed for all reasonable expenses and the Company may settle any tax incurred in relation to these.
Where an Executive Director is required to relocate to perform their role, they may be provided with reasonable benefits as determined by the Committee in connection with this relocation (on either a one-off or ongoing basis), including any benefits such as housing, travel or education allowances.
The value of benefits is not capped as it is determined by the cost to the Company, which may vary.
N/A
Pension To provide retirement benefits for employees.
Directors are eligible to receive employer contributions to the Company’s pension plan (which is a defined contribution plan), a salary supplement in lieu of pension benefits (or combination of the above) or similar arrangement.
Maximum contribution in line with the contribution of other employees in the Group, currently 5% of salary.
N/A
Annual bonus
To incentivise and reward the achievement of annual financial and operational objectives which are closely linked to the corporate strategy.
The annual bonus is based predominantly on stretching financial and operational objectives set at the beginning of the year and assessed by the Committee following the year end.
Half of any bonus earned is normally subject to deferral into shares under the Deferred Annual Bonus Plan (‘DABP’), typically for a period of two years from the date of award. The deferred shares will vest subject to continued employment, but there are no further performance targets.
A dividend equivalent provision applies, as described below.
Recovery and withholding provisions apply, as described below.
Participation in the bonus plan, and all bonus payments, are at the discretion of the Committee.
Maximum of 150% of salary. Financial measures will normally represent the majority of bonus, with strategic or operational non-financial targets representing the balance (if any).
Not more than 20% of each part of the bonus will be payable for achieving the relevant threshold hurdle.
Measures and weightings may change each year to reflect any year-on-year changes to business priorities.
The Committee has the discretion to adjust targets for any exceptional events including acquisitions or disposals that may occur during the year.
Strategic report / Governance / Financial statements
69Auto Trader Group plc Annual Report and Financial Statements 2018

Directors’ remuneration report continued
ElementPurpose and linkto strategy
Operation and performance conditions
Maximumopportunity
Performance assessment
Performance Share Plan (‘PSP’) Note, PSP awards granted in June 2018 will take effect under this Policy.
To incentivise and recognise successful execution of the business strategy over the longer term.
To align the long-term interests of Executive Directors with those of shareholders.
Awards will normally be made annually under the PSP, and will take the form of nil-cost options or conditional share awards. Participation and individual award levels will be determined at the discretion of the Committee within the Policy.
Awards normally vest after three years subject to the extent to which the performance conditions specified for the awards are satisfied, and continued service.
Recovery and withholding provisions apply, as described below.
Executive Directors are required to retain vested shares delivered under the PSP for at least two years from the point of vesting, subject to the terms of the holding period described below.
A dividend equivalent provision applies, as described below.
Normal: maximum of 200% of salary.
Exceptional circumstances: maximum of 300% of salary.
The vesting of awards will be subject to the achievement of performance metrics which may be financial, share price or strategic in nature.
The metrics and weightings for each award will be set out in the Annual Report on Remuneration. Any strategic measure(s) will account for no more than 25% of the award.
The Committee has the discretion to adjust targets for any exceptional events (including acquisitions and disposals) that occur during the performance period.
No more than 25% of the award vests for achieving threshold performance.
All-employee Share Plans – SIP & SAYE
To encourage Group-wide equity ownership across all employees, and create a culture of ownership.
The Company operates two all-employee tax-advantaged plans, namely a Save As You Earn (‘SAYE’) and a Share Incentive Plan (‘SIP’) for the benefit of Group employees.
The operation of these plans will be at the discretion of the Committee, and Executive Directors will be eligible to participate on the same basis as other employees.
Maximum permitted based on HMRC limits from time to time.
N/A
Share ownership guidelines
To increase alignment between executives and shareholders.
Executive Directors are expected to build and maintain a holding of shares in the Company. This is expected to be built through retaining a minimum of 50% of the net of tax vested PSP and DABP shares, until the guideline level is met.
The minimum share ownership guideline is 200% of salary for current Executive Directors.
N/A
Notes to the Policy tableRecovery and withholding provisionsRecovery and withholding provisions apply to variable pay, to enable the Company to recover amounts paid under the annual bonus and PSP in the event of the following negative events occurring within three years of the payment of a cash bonus, the grant date of an award under the DABP or the vesting date of PSP awards:
– a material misstatement of or restatement to the audited financial statements or other data;
– an error in calculation leading to over-payment of bonus; or
– individual gross misconduct.
Should such an event be suspected, there will be a further two years in which the Committee may investigate the event. The amount to be recovered would generally be the excess payment over the amount which would otherwise be paid, and recovery may be satisfied in a variety of ways, including through the reduction of outstanding deferred awards, reduction of the net bonus or PSP vesting and seeking a cash repayment.
Dividend equivalentsUnder the DABP and the PSP, the Committee may also pay the value of dividends, at the Committee’s discretion, on vested shares (in cash or shares) which may assume the reinvestment of dividends on a cumulative basis.
Discretion available under the PolicyIn order to ensure that the Remuneration Policy is capable of achieving its intended aims, the Committee retains certain discretions over the operation of the variable pay policy. These include the ability to vary the operation of the plans in certain circumstances (such as a change of control, rights issue, corporate restructuring event, special dividend or acquisition or disposal) including the timing and determination of payouts/vesting; and making appropriate adjustments to performance measures or targets as necessary to ensure that performance conditions remain appropriate. However, it should be noted that in the event that the measures or targets are varied for outstanding awards in the light of a corporate event, the revised targets may not be materially less difficult to satisfy. Should these discretions be used, they would be explained in the Annual Report on Remuneration and may be subject to consultation with shareholders as appropriate.
70 Auto Trader Group plc Annual Report and Financial Statements 2018
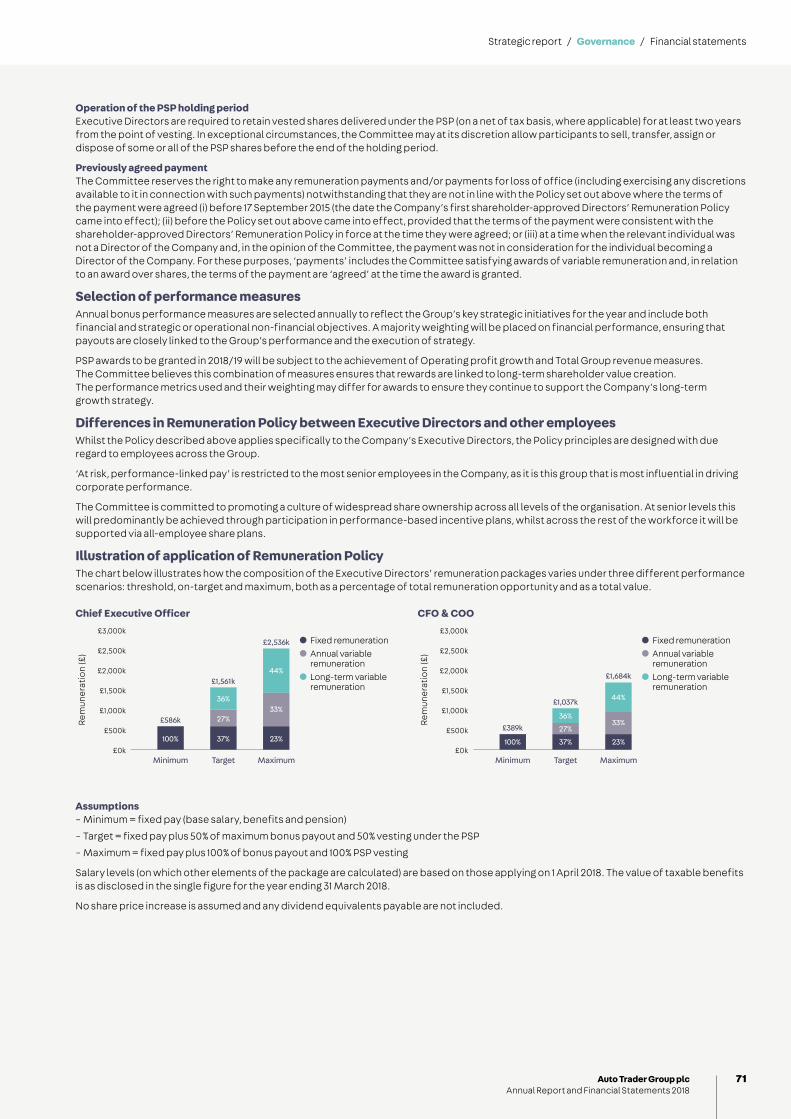
Operation of the PSP holding periodExecutive Directors are required to retain vested shares delivered under the PSP (on a net of tax basis, where applicable) for at least two years from the point of vesting. In exceptional circumstances, the Committee may at its discretion allow participants to sell, transfer, assign or dispose of some or all of the PSP shares before the end of the holding period.
Previously agreed paymentThe Committee reserves the right to make any remuneration payments and/or payments for loss of office (including exercising any discretions available to it in connection with such payments) notwithstanding that they are not in line with the Policy set out above where the terms of the payment were agreed (i) before 17 September 2015 (the date the Company’s first shareholder-approved Directors’ Remuneration Policy came into effect); (ii) before the Policy set out above came into effect, provided that the terms of the payment were consistent with the shareholder-approved Directors’ Remuneration Policy in force at the time they were agreed; or (iii) at a time when the relevant individual was not a Director of the Company and, in the opinion of the Committee, the payment was not in consideration for the individual becoming a Director of the Company. For these purposes, ‘payments’ includes the Committee satisfying awards of variable remuneration and, in relation to an award over shares, the terms of the payment are ‘agreed’ at the time the award is granted.
Selection of performance measuresAnnual bonus performance measures are selected annually to reflect the Group’s key strategic initiatives for the year and include both financial and strategic or operational non-financial objectives. A majority weighting will be placed on financial performance, ensuring that payouts are closely linked to the Group’s performance and the execution of strategy.
PSP awards to be granted in 2018/19 will be subject to the achievement of Operating profit growth and Total Group revenue measures. The Committee believes this combination of measures ensures that rewards are linked to long-term shareholder value creation. The performance metrics used and their weighting may differ for awards to ensure they continue to support the Company’s long-term growth strategy.
Differences in Remuneration Policy between Executive Directors and other employeesWhilst the Policy described above applies specifically to the Company’s Executive Directors, the Policy principles are designed with due regard to employees across the Group.
‘At risk, performance-linked pay’ is restricted to the most senior employees in the Company, as it is this group that is most influential in driving corporate performance.
The Committee is committed to promoting a culture of widespread share ownership across all levels of the organisation. At senior levels this will predominantly be achieved through participation in performance-based incentive plans, whilst across the rest of the workforce it will be supported via all-employee share plans.
Illustration of application of Remuneration PolicyThe chart below illustrates how the composition of the Executive Directors’ remuneration packages varies under three different performance scenarios: threshold, on-target and maximum, both as a percentage of total remuneration opportunity and as a total value.
Minimum Target Maximum
£586k
100% 37% 23%
27%33%
36%
44%£1,561k
Chief Executive Officer
£2,536k£3,000k
£2,500k
£2,000k
£1,500k
£1,000k
£500k
£0k
Rem
uner
atio
n (£
)
Fixed remunerationAnnual variable remunerationLong-term variable remuneration
Minimum Target Maximum
£389k
100% 37% 23%
27%33%
36%
44%£1,037k
CFO & COO
£1,684k
Fixed remunerationAnnual variable remunerationLong-term variable remuneration
£3,000k
£2,500k
£2,000k
£1,500k
£1,000k
£500k
£0k
Rem
uner
atio
n (£
)
Assumptions – Minimum = fixed pay (base salary, benefits and pension)
– Target = fixed pay plus 50% of maximum bonus payout and 50% vesting under the PSP
– Maximum = fixed pay plus 100% of bonus payout and 100% PSP vesting
Salary levels (on which other elements of the package are calculated) are based on those applying on 1 April 2018. The value of taxable benefits is as disclosed in the single figure for the year ending 31 March 2018.
No share price increase is assumed and any dividend equivalents payable are not included.
Strategic report / Governance / Financial statements
71Auto Trader Group plc Annual Report and Financial Statements 2018
Directors’ remuneration report continued
Service contracts and policy for payments on loss of officeThe service contracts for the Executive Directors are terminable by either the Company or the Executive Director on 12 months’ notice and make provision for early termination by way of payment of a cash sum equal to 12 months’ salary and pension. The Company may continue to provide benefits until the end of the notice period or may make a payment to the value of 12 months’ contractual benefits.
Payment in lieu of notice can be paid either as a lump sum or in equal monthly instalments over the notice period and will normally be subject to mitigation. The Committee will consider the particular circumstances of each leaver and retains flexibility as to at what point, and the extent to which, payments are reduced.
The Committee reserves the right to make any other payments in connection with a Director’s cessation of office or employment where the payments are made in good faith in discharge of an existing legal obligation (or by way of damages for breach of such an obligation) or by way of settlement of any claim arising in connection with the cessation of a Director’s office or employment or for any fees for outplacement assistance and/or the Director’s legal and/or professional advice fees in connection with his cessation of office or employment. SAYE options will become exercisable on cessation of employment to the extent permitted in accordance with the rules of the SAYE scheme, which does not provide for the exercise of discretion by the Committee. On cessation, a payment may be made in respect of accrued but untaken holiday.
Relevant details will be provided in the Annual Report on Remuneration should such circumstances apply.
In summary, the contractual provisions on termination where the Company elects to make a payment in lieu of notice are as follows:
Provision Detailed terms
Notice period 12 months by either party.
Termination payments over the notice period 100% of salary and pension contribution for the relevant period.
The Company may continue to provide benefits until the end of the notice period or may make a payment to the value of 12 months’ contractual benefits.
Change of control No enhanced provisions on a change of control.
The Executive Directors are subject to annual re-election at the AGM. Service contracts are available for inspection at the Company’s registered office.
Annual bonus on terminationThere is no automatic or contractual right to bonus payment. At the discretion of the Committee, for certain leavers, a bonus may become payable at the normal payment date based on performance. Such bonus would normally be pro-rated for time in employment unless the Committee determines otherwise. At its discretion the Committee may also pay such bonus at the time of cessation of employment based on performance to that date. Any bonus paid may be paid 100% in cash for the year of departure or preceding financial year if the bonus for that year has not yet been awarded. Should the Committee decide to make a payment in such circumstances, the rationale would be fully disclosed in the Annual Report on Remuneration.
DABP awards on terminationAny existing awards under the DABP will lapse on termination unless the termination is due to death, the sale of the employing company from the business or otherwise at the discretion of the Committee. Where an award does not lapse it will vest on cessation (or on such later date as the Committee determines), to the extent determined by the Committee.
PSP on terminationShare-based awards are outside of service contracts provisions. Normally, PSP awards will lapse upon a participant ceasing to hold employment. However, under the rules of the PSP, in certain prescribed circumstances (namely death, sale of employing company from the business or otherwise at the discretion of the Committee), ‘good leaver’ status can be applied. In exercising its discretion as to whether an Executive Director should be treated as a good leaver, the Committee will take into account the performance of the individual and the reasons for their departure and, in the event of this determination being made, will set out its rationale in the following Annual Report on Remuneration. Awards will typically vest on the originally anticipated date, although the Committee has discretion to vest awards sooner (and to assess performance conditions accordingly if vesting occurs before the end of the performance period).
The extent to which PSP awards will vest in good leaver circumstances will depend on:
(i) the extent to which the performance conditions have been satisfied at the end of the performance period (or such other relevant time as the Committee determines); and
(ii) unless the Committee determines otherwise, the pro-rating of the award determined by the period of time served in employment during the vesting period.
Change of controlIn the event of a change of control of the Company or other relevant event, awards under the PSP, DABP and SIP and options under the SAYE scheme will vest early. Vesting of awards under the PSP will be determined by applying any relevant performance condition and, unless the Committee determines otherwise, pro-rating the award by reference to the period of time from grant to vest as a proportion of a period of three years. DABP award shall vest in full, and the extent to which an SAYE option can be exercised will be determined by the Committee in accordance with the rules of the SAYE scheme on the same basis as for other employees.
72 Auto Trader Group plc Annual Report and Financial Statements 2018

Approach to recruitment and promotionsThe recruitment package for a new Executive Director would normally be set in accordance with the terms of the Company’s approved Remuneration Policy. Currently, this would include an annual bonus opportunity of up to 150% of salary and policy PSP award of up to 200% of salary (other than in exceptional circumstances where up to 300% of salary may be made). The Committee, however, retains discretion to include any other remuneration component or award which it feels is appropriate taking into account the specific circumstances of the recruitment, subject to the limit on variable remuneration of 350% of salary (450% of salary in exceptional circumstances) which is in line with current Policy limits. This limit does not include any payment(s) or award(s) made to ‘buy-out’ remuneration forfeited on leaving a previous employer. The key terms and rationale for any such component would be disclosed as appropriate in that year’s Annual Report on Remuneration.
On recruitment, salary will be set so as to reflect the individual’s experience and skills. It may be set at a level below the normal market rate, with phased increases greater than those received by others as the Executive Director gains experience.
Where an individual forfeits outstanding variable pay opportunities or contractual rights at a previous employer as a result of appointment, the Committee may offer compensatory payments or awards, in such form as the Committee considers appropriate taking into account relevant factors which may include the form of awards, expected value and vesting timeframe of forfeited opportunities. When determining any such ‘buyout’, the principle would be that awards would be on a ‘like-for-like’ basis unless this is considered by the Committee not to be practical or appropriate.
Where an Executive Director is required to relocate from their home location to take up their role, the Committee may provide assistance with relocation (either via one-off or ongoing payments or benefits).
If an internal candidate is promoted to the Board, legacy terms and conditions would normally be honoured, including pension entitlements and any outstanding incentive awards.
In the event of recruitment, the Committee may grant awards to a new Executive Director relying on the exemption in the Listing Rules which allows for the grant of awards, to facilitate, in unusual circumstances, the recruitment of an Executive Director, without seeking prior shareholder approval or under any other appropriate Company incentive plan.
Policy on external appointments Subject to Board approval, Executive Directors are permitted to take on one non-executive position with another company and to retain their fees in respect of such position. Additional appointments may be undertaken in exceptional circumstances. Details of outside directorships held by the Executive Directors and any fees that they received are provided in the Annual Report on Remuneration.
Remuneration Policy for the Chairman and Non-Executive DirectorsThe Non-Executive Directors do not have service contracts with the Company, but instead have letters of appointment.
Element Purpose and link to strategy Operation Maximum opportunity
Fees To attract and retain a high-calibre Chairman and Non-Executive Directors by offering a market competitive fee level.
Fees are reviewed periodically and approved by the Board, with Non-Executive Directors abstaining from any discussion in relation to their fees. Both the Chairman and the Non-Executive Directors are paid annual fees and do not participate in any of the Company’s incentive arrangements, or receive any pension provision or other benefits.
The Chairman receives a single fee covering all of his duties.
The Non-Executive Directors receive a basic Board fee, with additional fees payable for chairing the Audit and Remuneration Committees and for performing the Senior Independent Director role.
Additional fees may be paid to reflect additional Board or Committee responsibilities or an increased time commitment as appropriate.
The Chairman and Non-Executive Directors shall be entitled to have reimbursed all expenses that they reasonably incur in the performance of their duties. The Company may meet any tax liabilities that may arise on such expenses.
The Board may introduce benefits for the Chairman or Non-Executive Directors if it is considered appropriate to do so.
There is no prescribed maximum annual increase or fee level.
The fee levels are reviewed on a periodic basis, with reference to the time commitment of the role and market levels (for example in companies of comparable size and complexity).
Letters of appointmentAll Non-Executive Directors have letters of appointment with the Company for an initial period of three years, subject to annual re-election at the AGM. Appointment is terminable on six months’ written notice. The appointment letters for the Non-Executive Directors provide that no compensation is payable upon termination of employment.
Letters of appointment are available for inspection at the Company’s registered office.
Approach to recruitmentFor the appointment of a new Chairman or Non-Executive Director, the fee arrangement would be set in accordance with the approved remuneration policy in force at that time.
Strategic report / Governance / Financial statements
73Auto Trader Group plc Annual Report and Financial Statements 2018
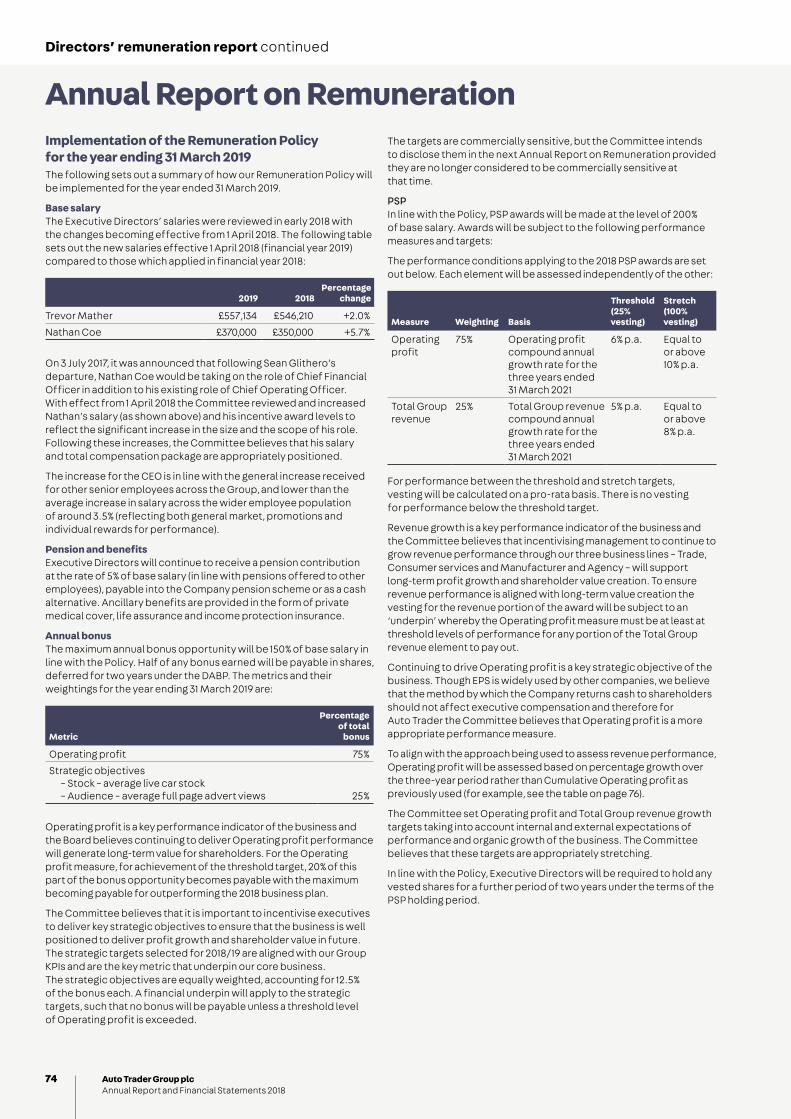
Directors’ remuneration report continued
The targets are commercially sensitive, but the Committee intends to disclose them in the next Annual Report on Remuneration provided they are no longer considered to be commercially sensitive at that time.
PSPIn line with the Policy, PSP awards will be made at the level of 200% of base salary. Awards will be subject to the following performance measures and targets:
The performance conditions applying to the 2018 PSP awards are set out below. Each element will be assessed independently of the other:
Measure Weighting Basis
Threshold (25% vesting)
Stretch (100% vesting)
Operating profit
75% Operating profit compound annual growth rate for the three years ended 31 March 2021
6% p.a. Equal to or above 10% p.a.
Total Group revenue
25% Total Group revenue compound annual growth rate for the three years ended 31 March 2021
5% p.a. Equal to or above 8% p.a.
For performance between the threshold and stretch targets, vesting will be calculated on a pro-rata basis. There is no vesting for performance below the threshold target.
Revenue growth is a key performance indicator of the business and the Committee believes that incentivising management to continue to grow revenue performance through our three business lines – Trade, Consumer services and Manufacturer and Agency – will support long-term profit growth and shareholder value creation. To ensure revenue performance is aligned with long-term value creation the vesting for the revenue portion of the award will be subject to an ‘underpin’ whereby the Operating profit measure must be at least at threshold levels of performance for any portion of the Total Group revenue element to pay out.
Continuing to drive Operating profit is a key strategic objective of the business. Though EPS is widely used by other companies, we believe that the method by which the Company returns cash to shareholders should not affect executive compensation and therefore for Auto Trader the Committee believes that Operating profit is a more appropriate performance measure.
To align with the approach being used to assess revenue performance, Operating profit will be assessed based on percentage growth over the three-year period rather than Cumulative Operating profit as previously used (for example, see the table on page 76).
The Committee set Operating profit and Total Group revenue growth targets taking into account internal and external expectations of performance and organic growth of the business. The Committee believes that these targets are appropriately stretching.
In line with the Policy, Executive Directors will be required to hold any vested shares for a further period of two years under the terms of the PSP holding period.
Implementation of the Remuneration Policy for the year ending 31 March 2019The following sets out a summary of how our Remuneration Policy will be implemented for the year ended 31 March 2019.
Base salaryThe Executive Directors’ salaries were reviewed in early 2018 with the changes becoming effective from 1 April 2018. The following table sets out the new salaries effective 1 April 2018 (financial year 2019) compared to those which applied in financial year 2018:
2019 2018Percentage
change
Trevor Mather £557,134 £546,210 +2.0%
Nathan Coe £370,000 £350,000 +5.7%
On 3 July 2017, it was announced that following Sean Glithero’s departure, Nathan Coe would be taking on the role of Chief Financial Officer in addition to his existing role of Chief Operating Officer. With effect from 1 April 2018 the Committee reviewed and increased Nathan’s salary (as shown above) and his incentive award levels to reflect the significant increase in the size and the scope of his role. Following these increases, the Committee believes that his salary and total compensation package are appropriately positioned.
The increase for the CEO is in line with the general increase received for other senior employees across the Group, and lower than the average increase in salary across the wider employee population of around 3.5% (reflecting both general market, promotions and individual rewards for performance).
Pension and benefitsExecutive Directors will continue to receive a pension contribution at the rate of 5% of base salary (in line with pensions offered to other employees), payable into the Company pension scheme or as a cash alternative. Ancillary benefits are provided in the form of private medical cover, life assurance and income protection insurance.
Annual bonusThe maximum annual bonus opportunity will be 150% of base salary in line with the Policy. Half of any bonus earned will be payable in shares, deferred for two years under the DABP. The metrics and their weightings for the year ending 31 March 2019 are:
Metric
Percentage of total
bonus
Operating profit 75%
Strategic objectives – Stock – average live car stock – Audience – average full page advert views 25%
Operating profit is a key performance indicator of the business and the Board believes continuing to deliver Operating profit performance will generate long-term value for shareholders. For the Operating profit measure, for achievement of the threshold target, 20% of this part of the bonus opportunity becomes payable with the maximum becoming payable for outperforming the 2018 business plan.
The Committee believes that it is important to incentivise executives to deliver key strategic objectives to ensure that the business is well positioned to deliver profit growth and shareholder value in future. The strategic targets selected for 2018/19 are aligned with our Group KPIs and are the key metric that underpin our core business. The strategic objectives are equally weighted, accounting for 12.5% of the bonus each. A financial underpin will apply to the strategic targets, such that no bonus will be payable unless a threshold level of Operating profit is exceeded.
Annual Report on Remuneration
74 Auto Trader Group plc Annual Report and Financial Statements 2018

Single figure of remuneration for the year ended 31 March 2018 (Audited)The table below shows the aggregate emoluments earned by the Directors of the Company in the year ended 31 March 2018.
£’000Salary and
fees Benefits Annual
bonusLong-termincentives 3 Pension Total
ExecutiveTrevor Mather 546 1 412 1,644 27 2,630
Nathan Coe 1 350 1 229 705 18 1,302
Sean Glithero 2 143 – – – 7 150
Non-ExecutiveEd Williams 176 – – – – 176
David Keens 73 – – – – 73
Jill Easterbrook 64 – – – – 64
Jeni Mundy 55 – – – – 55
The following table shows the aggregate emoluments earned in the year ended 31 March 2017.
£’000Salary and
fees Benefits Annual
bonusLong-termincentives 4 Pension Total
ExecutiveTrevor Mather 536 1 416 – 27 980
Sean Glithero 296 1 199 – 15 511
Non-ExecutiveEd Williams 173 – – – – 173
David Keens 72 – – – – 72
Jill Easterbrook 63 – – – – 63
Jeni Mundy 54 – – – – 54
1 Nathan Coe was appointed to the Board on 1 April 2017.2 Sean Glithero stepped down from the Board on 21 September 2017.3 100% of PSP awards granted in 2015 will vest in June 2018. For the purpose of the single figure the vested shares have been valued based on the three-month average share price
to 31 March 2018 of 359.58p. Dividend equivalents to the value of £37,386 for Trevor Mather and £16,019 for Nathan Coe have also been included.4 There were no long-term incentives eligible to vest in respect of performance to 31 March 2017.
Additional information to support the single figureBenefitsBenefits include: private healthcare, life assurance and income protection insurance.
Pension Employer’s pension contributions of 5% of salary were paid in respect of Executive Directors.
Annual bonus for the year ended 31 March 2018The performance measures, targets and actual outcomes for the annual bonus for the year ended 31 March 2018 are shown in the following table:
Performance measures Weighting Threshold Target StretchActual
performancePayout (as a % of
maximum)
Financial Operating profit 75% £211m £219m £226m £220.6m 46.3% of the 75%
Strategic targets
Growth in full page advert views 12.5% >0% >2% >4% <0% 0% of the 12.5%
New product initiatives (the adoption of Managing products)
12.5% >2,800 >3,100 >3,400 3,000 4% of the 12.5%
Total 100% 50.3% of the 100%
Payout for performance between threshold and stretch is calculated on a pro-rata basis. The payout at threshold is 20% of maximum for Financial measures and 32% for the Strategic measures. The payout at target is 50% of maximum for Financial measures and 64% for Strategic measures.
This level of performance resulted in a bonus payout of £411,830 for Trevor Mather (CEO) and of £228,706 for Nathan Coe (CFO & COO). Half of the bonus earned will be payable in shares, deferred for two years under the DABP in line with the Policy.
In light of the Company’s performance during the year under review, the Committee was comfortable with the overall level of annual bonus payout.
Strategic report / Governance / Financial statements
75Auto Trader Group plc Annual Report and Financial Statements 2018

Directors’ remuneration report continued
Performance Share Plan vesting for year ended 31 March 2018Our first PSP award following IPO was awarded in 2015 and will vest in June 2018 based on performance to 31 March 2018. The performance conditions this award was based on, the targets and performance delivered are set out in the table below:
Measure WeightingThreshold (25% vesting)
Stretch (100% vesting)
Actual performance
Payout (as a percentage of maximum)
Cumulative Underlying operating profit
75% £510m Equal to or above £550m
£603m 75% of the 75%
TSR compared to the FTSE 250 Index (excluding investment trusts) 1
25% Equal to Index TSR Equal to Index TSR plus 25% or above
Index TSR plus 27%
25% of the 25%
Total vesting 100% of the 100%
1 End average TSR performance is calculated based on a three-month average to 31 March 2018; start average TSR performance is the IPO price.
For performance between the threshold and stretch targets, vesting is calculated on a pro-rata basis.
Executive Directors will be required to retain vested shares delivered under this PSP for at least two years from the point of vesting, subject to the terms of the PSP holding period.
Scheme interests awarded during the year (Audited)Awards granted in the year under the DABP and PSP are shown in the table below.
Executive DirectorNumber of
shares awardedMultiple of
salary
Face/maximum value of awards
at grant date 4
% award vesting at threshold
(% maximum)Performance
period 2
DABP awards1
Trevor Mather 52,062 £208,092
Nathan Coe 25,783 £103,055
Sean Glithero3 24,923 £99,617
PSP awards2
Trevor Mather 273,309 200% £1,092,416 25%1 April 2017 to
31 March 2020Nathan Coe 131,348 150% £524,998
Sean Glithero3 113,228 150% £452,572
Awards are granted as nil-cost options.
1 DABP awards were granted in respect of the annual bonus for the year to 31 March 2017. The awards will normally be eligible to vest two years from grant (16 June 2019) based on continuous employment.
2 PSP awards will normally be eligible to vest three years from grant (16 June 2020) based on performance over the three years to 31 March 2020 and continuous employment. 3 Sean Glithero’s award lapsed when he left the Company on 21 September 2017.4 Face/maximum value was calculated based on the closing share price on the day before grant date (16 June 2017) of £3.997.
The performance conditions applying to the 2017 PSP awards shown in the table above are set out below. Each element will be assessed independently.
Measure Weighting BasisThreshold (25% vesting)
Stretch (100% vesting)
Cumulative Operating profit 75% The sum of the Group’s Operating profit result over the three consecutive financial years ending on 31 March 2020
£690m Equal to or above £750m
TSR 25% Performance relative to the FTSE 250 Index (excluding investment trusts)1
Equal to Index TSR Equal to Index TSR plus 25% or above
1 Start and end average TSR will be calculated based on the three-month average TSR to 31 March.
For performance between the threshold and stretch targets, vesting will be calculated on a pro-rata basis. There is no vesting below threshold performance.
Executive Directors will ordinarily be required to retain their net of tax number of vested shares delivered under the PSP for at least two years from the point of vesting.
76 Auto Trader Group plc Annual Report and Financial Statements 2018

Directors’ shareholding and share interests (Audited)The Group has adopted shareholding guidelines in order to encourage Executive Directors to maintain a shareholding in the Company equivalent in value to 200% of salary. If an Executive Director does not meet the guideline, they will be expected to retain at least half of the net shares vesting under the Company’s discretionary share-based employee incentive schemes until the guideline is met. Both Executive Directors currently hold well in excess of this limit. Non-Executive Directors do not have shareholding guidelines.
The table below sets out the number of shares held or potentially held by Directors (including their connected persons where relevant) as at 31 March 2018.
DirectorBeneficially
owned shares 1
Number of awards held under the
PSP conditional on performance
Number of awards held under the
DABP conditional on continued employment
Target shareholding
guideline (as a % of salary)
Percentage of salary held in
shares as at31 March 2018 2
Executive DirectorsTrevor Mather 12,000,000 995,438 153,283 200% 7,703%
Nathan Coe 2,883,252 440,831 75,911 200% 2,888%
Sean Glithero 3 2,997,581 381,741 73,380 150% N/A
Non-Executive DirectorsEd Williams 6,875,444 – – N/A N/A
Jill Easterbrook – – – N/A N/A
David Keens 25,000 – – N/A N/A
Jeni Mundy – – – N/A N/A
1 Includes shares owned by connected persons. Only beneficially owned shares count towards the shareholding guideline.2 Based on the Director’s salary and the mid-market price at close of business on 31 March 2018 of 350.6p.3 Sean Glithero stepped down from the Board on 21 September 2017 and his shareholding is shown at this date. Awards held by Sean under the PSP and DABP lapsed on the date
he left the business.
Trevor Mather
Scheme
No. of shares/ options at
31 March 2017
Shares/options granted
in the year
Shares/options lapsed
in the year
Options exercised in the year
No. of shares/ options at
31 March 2018 Date of grant
Date from which
exercisable Expiry date
PSP 1 446,808 – – – 446,808 19/6/2015 19/6/2018 19/6/2025
PSP 2 275,321 – – – 275,321 17/6/2016 17/6/2019 17/6/2026
PSP 3 – 273,309 – – 273,309 16/6/2017 16/6/2020 16/6/2027
DABP 101,221 – – – 101,221 17/6/2016 17/6/2018 17/6/2026
DABP – 52,062 – – 52,062 16/6/2017 16/6/2019 16/6/2027
Total 823,350 325,371 – – 1,148,721
Nathan Coe
Scheme
No. of shares/ options at
31 March 2017
Shares/options granted
in the year
Shares/options lapsed
in the year
Options exercised in the year
No. of shares/ options at
31 March 2018 Date of grant
Date from which
exercisable Expiry date
PSP 1 191,489 – – – 191,489 19/6/2015 19/6/2018 19/6/2025
PSP 2 117,994 – – – 117,994 17/6/2016 17/6/2019 17/6/2026
PSP 3 – 131,348 – – 131,348 16/6/2017 16/6/2020 16/6/2027
DABP 50,128 – – – 50,128 17/6/2016 17/6/2018 17/6/2026
DABP – 25,783 – – 25,783 16/6/2017 16/6/2019 16/6/2027
Total 359,611 157,131 – – 516,742
1 As noted above, 100% of the PSP award granted in 2015 will vest in June 2018 based on Cumulative Underlying operating profit and relative TSR performance compared to the FTSE 250 (excluding investment trusts) to 31 March 2018.
2 2016 PSP awards are subject 75% to Cumulative Underlying Operating profit and 25% to relative TSR performance compared to the FTSE 250 (excluding investment trusts) over the three-year period to 31 March 2019. For the Cumulative Underlying operating profit portion, 25% will vest if Cumulative Underlying operating profit is £660m or greater. 100% will vest if Cumulative Underlying operating profit is £710m or above. For performance between these points, vesting will be calculated on a pro-rata basis. For the Relative TSR portion, 25% will vest if Auto Trader’s TSR performance is equal to the FTSE 250 Index (excluding investment trusts). 100% will vest if Auto Trader’s TSR performance exceeds the FTSE 250 Index (excluding investment trusts) by 25% or more. For performance between these points, vesting will be calculated on a pro-rata basis.
3 Performance measures for 2017 PSP awards are set out on page 76.
Remuneration on departure of Sean Glithero (Audited)Sean Glithero left the Board on 21 September 2017. He received salary, benefits and pension to this date. No further payments were made in lieu of notice. On his departure all his long-term incentives and deferred bonus shares lapsed.
Payments to former Directors (Audited)There were no payments made to former Directors during the year.
Strategic report / Governance / Financial statements
77Auto Trader Group plc Annual Report and Financial Statements 2018
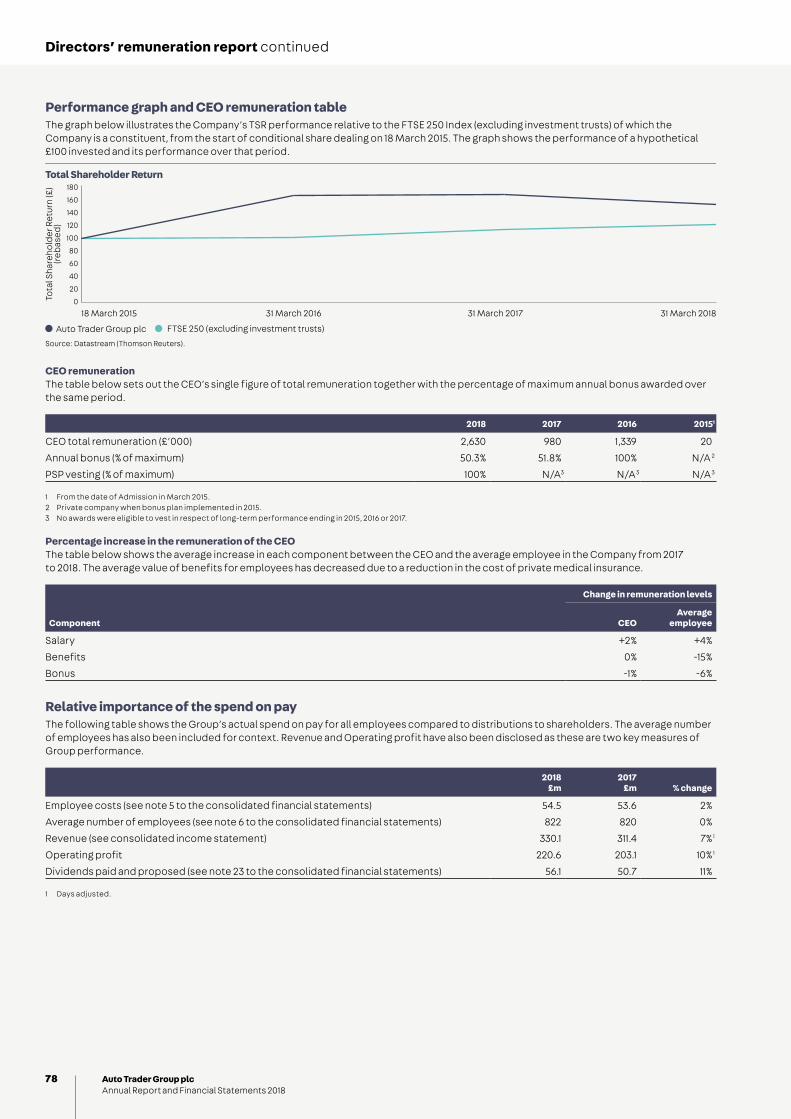
Directors’ remuneration report continued
Performance graph and CEO remuneration tableThe graph below illustrates the Company’s TSR performance relative to the FTSE 250 Index (excluding investment trusts) of which the Company is a constituent, from the start of conditional share dealing on 18 March 2015. The graph shows the performance of a hypothetical £100 invested and its performance over that period.
Auto Trader Group plc FTSE 250 (excluding investment trusts)
180
0
20
40
60
80
100
120
140
160
Tota
l Sha
reho
lder
Ret
urn
(£)
(reb
ased
)
Total Shareholder Return
31 March 2016 31 March 2017 31 March 201818 March 2015
Source: Datastream (Thomson Reuters).
CEO remunerationThe table below sets out the CEO’s single figure of total remuneration together with the percentage of maximum annual bonus awarded over the same period.
2018 2017 2016 2015 1
CEO total remuneration (£’000) 2,630 980 1,339 20
Annual bonus (% of maximum) 50.3% 51.8% 100% N/A 2
PSP vesting (% of maximum) 100% N/A 3 N/A3 N/A3
1 From the date of Admission in March 2015.2 Private company when bonus plan implemented in 2015.3 No awards were eligible to vest in respect of long-term performance ending in 2015, 2016 or 2017.
Percentage increase in the remuneration of the CEO The table below shows the average increase in each component between the CEO and the average employee in the Company from 2017 to 2018. The average value of benefits for employees has decreased due to a reduction in the cost of private medical insurance.
Change in remuneration levels
Component CEOAverage
employee
Salary +2% +4%
Benefits 0% -15%
Bonus -1% -6%
Relative importance of the spend on payThe following table shows the Group’s actual spend on pay for all employees compared to distributions to shareholders. The average number of employees has also been included for context. Revenue and Operating profit have also been disclosed as these are two key measures of Group performance.
2018 £m
2017 £m % change
Employee costs (see note 5 to the consolidated financial statements) 54.5 53.6 2%
Average number of employees (see note 6 to the consolidated financial statements) 822 820 0%
Revenue (see consolidated income statement) 330.1 311.4 7% 1
Operating profit 220.6 203.1 10% 1
Dividends paid and proposed (see note 23 to the consolidated financial statements) 56.1 50.7 11%
1 Days adjusted.
78 Auto Trader Group plc Annual Report and Financial Statements 2018

Fees for the Chairman and Non-Executive DirectorsThe fees were reviewed in early 2018 and were increased by 2% with effect from 1 April 2018. The Chairman and Non-Executive Directors’ fees will next be reviewed in early 2019, with any increase becoming effective from 1 April 2019.
The following table sets out the new fees effective from 1 April 2018 (financial year 2019) compared to those which applied in financial year 2018:
2019 2018Percentage
change
Base feesChairman £180,405 £176,868 +2%
Non-Executive Director £55,713 £54,621 +2%
Additional feesSenior Independent Director £9,551 £9,364 +2%
Audit Committee Chairman £9,551 £9,364 +2%
Remuneration Committee Chairman £9,551 £9,364 +2%
There is no additional fee payable to the Chairman of the Nomination Committee. The Company Chairman is currently Chair of the Nomination Committee.
All Non-Executive Directors have letters of appointment with the Company for an initial period of three years, subject to annual re-appointment at the AGM. Appointment is terminable on six months’ written notice. The appointment letters for the Non-Executive Directors provide that no compensation is payable upon termination of employment. The letters of appointment are available for inspection at the Company’s registered office. Details of the appointment terms of the Non-Executive Directors are as follows:
Start of current term Expiry of current term
Ed Williams 6 March 2018 5 March 2021
David Keens 1 May 2018 30 April 2021
Jill Easterbrook 1 July 2015 30 June 2018 1
Jeni Mundy 1 March 2016 28 February 2019
1 The Board has approved the renewal of this term with effect from 1 July 2018 to expire on 30 June 2021.
Funding of equity awardsShare awards may be funded by a combination of newly issued shares, treasury shares and shares purchased in the market. Where shares are newly issued or from treasury, the Company complies with Investment Association dilution guidelines on their issue. The current dilution usage of all share plans is c.0.53% of shares in issue.
Where shares are purchased in the market, these will be held by a trust, in which case the voting rights relating to the shares are exercisable by the Trustees in accordance with their fiduciary duties. At 31 March 2018 the Trust held 932,761 shares in respect of the Share Incentive Plan.
External directorshipsAuto Trader recognises that its Executive Directors may be invited to become non-executive directors of other companies. Such non-executive duties can broaden a Director’s experience and knowledge which can benefit Auto Trader. The Company Chairman would approve any such directorships in advance to ensure that there was no conflict of interest. Trevor Mather is a director on the board of Burns Sheehan Limited, a recruitment business, for which he does not receive any remuneration. The Board approved the appointment and confirmed that it was satisfied that there was no conflict of interest arising.
Membership of the CommitteeJill Easterbrook is the Committee Chairman, and its other members are David Keens and Jeni Mundy. Refer to page 66 to 67 for further details of the membership of the Committee, the Terms of Reference, the meetings held and activities during the year.
Strategic report / Governance / Financial statements
79Auto Trader Group plc Annual Report and Financial Statements 2018

Directors’ remuneration report continued
External advisorsDuring the year the Committee undertook a review of advisors and from October 2017 appointed Deloitte following a competitive tender process.
Deloitte are founding members of the Remuneration Consultants Code of Conduct and adhere to this Code in its dealings with the Committee. The Committee is satisfied that the advice provided by Deloitte is objective and independent. The Committee is comfortable that the Deloitte engagement partner and team that provide remuneration advice to the Committee do not have connections with the Company that may impair their independence. The Committee reviewed the potential for conflicts of interest and judged that there were appropriate safeguards against such conflicts.
Fees are charged on a time and materials basis. During the year Deloitte was paid £62,450 for advice provided to the Committee. Deloitte provided additional services to the Company in relation to internal audit and tax services.
Prior to this date, the Committee received advice from New Bridge Street (‘NBS’), part of Aon plc. NBS are also a founding member of the Remuneration Consultants Code of Conduct and the Committee is satisfied that the advice received by NBS in relation to remuneration matters during the year was objective and independent. NBS did not provide any other services to the Company during the year. Aon currently provides actuarial, valuation and administration services in relation to the defined benefit pension scheme of the Company. The fees payable to NBS for providing advice in relation to executive remuneration over the financial year under review were £12,429, charged on a time-spent basis.
Statement of shareholder votingShareholder voting in relation to recent AGM resolutions is as follows:
Votes for
% of votes cast for
Votes against
% of votes cast against Abstentions
2015 AGM: Remuneration policy (binding) 797,281,130 98.20 14,637,737 1.80 7,139,212
2017 AGM: Annual Report on Remuneration (advisory) 809,249,426 99.12 7,198,204 0.88 51,313
ApprovalThis Directors’ remuneration report has been approved by the Board of Directors.
Signed on behalf of the Board of Directors.
Jill EasterbrookChairman of the Remuneration Committee 7 June 2018
80 Auto Trader Group plc Annual Report and Financial Statements 2018
Directors’ report
The Directors have pleasure in submitting their Report and the audited financial statements of Auto Trader Group plc (the ‘Company’) and its subsidiaries (together the ‘Group’) for the financial year to 31 March 2018.Statutory informationInformation required to be part of the Directors’ report can be found elsewhere in this document, as indicated in the table below, and is incorporated into this Report by reference:
Section of Annual Report Page reference
Employee involvement
Strategic report; Corporate social responsibility (page 44)
Employees with disabilities
Strategic report; Corporate social responsibility (page 45)
Financial instruments
Note 2 to the consolidated financial statements
Future developments of the business
Strategic report (pages 1 to 49)
Greenhouse gas emissions
Strategic report; Corporate social responsibility (page 47)
Non-financial reporting
Strategic report: Corporate social responsibility (page 39)
Information required by LR 9.8Information required to be included in the Annual Financial Report by LR 9.8 can be found in this document as indicated in the table below:
Section of Annual Report Page reference
Allotment of shares during the year
Note 21 to the consolidated financial statements
Directors’ interests Remuneration report (page 77)
Significant shareholders Directors’ report (page 82)
Going concern Principal risks and uncertainties (page 38)
Long-term incentive schemes
Directors’ remuneration report (pages 74 to 78)
Powers for the Company to buy back its shares
Directors’ report (page 82)
Significant contracts Directors’ report (page 82)
Significant related party agreements
Directors’ report (page 82)
Statement of corporate governance
Corporate governance statement (pages 50 to 80)
Management reportThis Directors’ report, on pages 81 to 83, together with the Strategic report on pages 1 to 49, form the Management Report for the purposes of DTR 4.1.5R.
Strategic reportThe Strategic report, which can be found on pages 1 to 49, sets out the Group’s strategy, objectives and business model; the development, performance and position of the Group’s business (including financial and operating key performance indicators); a description of the principal risks and uncertainties; and the main trends and factors likely to affect the future development, performance and position of the Group’s business.
UK Corporate Governance CodeThe Company’s statement on corporate governance can be found in the Corporate governance statement, the Report of the Nomination Committee, the Report of the Audit Committee and the Directors’ remuneration report on pages 54 to 80, all of which form part of this Directors’ report and are incorporated into it by reference.
2018 Annual General MeetingThe Annual General Meeting (‘AGM’) will be held at 10.00 am on 20 September 2018 at the Company’s registered office at 4th Floor, 1 Tony Wilson Place, Manchester, M15 4FN. The Notice of Meeting sets out the resolutions to be proposed and specifies the deadlines for exercising voting rights and appointing a proxy or proxies to vote in relation to resolutions to be passed at the AGM. All proxy votes will be counted and the numbers for, against or withheld in relation to each resolution will be announced at the AGM and published on the Company’s website.
Board of DirectorsThe following individuals were Directors of the Company for the whole of the financial year ending 31 March 2018, and to the date of approving this report unless otherwise stated:
– Ed Williams
– Trevor Mather
– Nathan Coe
– David Keens
– Jill Easterbrook
– Jeni Mundy
Sean Glithero resigned as a Director on 21 September 2017. All Directors will stand for election or re-election at the 2018 AGM in line with the recommendations of the Code.
Appointment and replacement of DirectorsAt each AGM each Director then in office shall retire from office with effect from the conclusion of the meeting. When a Director retires at an AGM in accordance with the Articles of Association of the Company, the Company may, by ordinary resolution at the meeting, fill the office being vacated by re-electing the retiring Director. In the absence of such a resolution, the retiring Director shall nevertheless be deemed to have been re-elected, except in the cases identified by the Articles.
Results and dividendsThe Group’s and Company’s audited financial statements for the year are set out on pages 88 to 130.
The Company declared an interim dividend on 9 November 2017 of 1.9 pence per share which was paid on 26 January 2018.
The Directors recommend payment of a final dividend of 4.0 pence per share (2017: 3.5 pence per share) to be paid on 28 September 2018 to shareholders on the register of members at 31 August 2018, subject to approval at the 2018 AGM.
Amendment of the ArticlesThe Company’s Articles of Association may only be amended by a special resolution at a general meeting of shareholders. No amendments are proposed to be made to the existing Articles of Association at the forthcoming AGM.
Authority to allot sharesUnder the 2006 Act, the Directors may only allot shares if authorised to do so by shareholders in a general meeting. The authority conferred on the Directors at the 2017 AGM under section 551 of the 2006 Act expires on the date of the forthcoming AGM, and ordinary resolution 13 seeks a new authority to allow the Directors to allot ordinary shares up to a maximum nominal amount of £6,320,335 (632,033,500 shares, representing approximately two thirds of the Company’s existing share capital at 7 June 2018), of which 315,969,350 shares (representing approximately one third of the Company’s issued ordinary share capital) can only be allotted pursuant to a rights issue. The Directors have no present intention of exercising this authority which will expire at the conclusion of the AGM in 2019 or 19 December 2019 if earlier.
Strategic report / Governance / Financial statements
81Auto Trader Group plc Annual Report and Financial Statements 2018

Directors’ report continued
Restrictions on transfer of securitiesThe Articles do not contain any restrictions on the transfer of ordinary shares in the Company other than the usual restrictions applicable where any amount is unpaid on a share. Certain restrictions are also imposed by laws and regulations (such as insider trading and marketing requirements relating to close periods) and requirements of the Company’s share dealing code whereby Directors and certain employees of the Company require approval to deal in the Company’s securities.
Change of controlSave in respect of a provision of the Company’s share schemes which may cause options and awards granted to employees under such schemes to vest on takeover, there are no agreements between the Company and its Directors or employees providing for compensation for loss of office or employment (whether through resignation, purported redundancy or otherwise) because of a takeover bid.
Significant contractsThe only significant agreements to which the Company is a party that take effect, alter or terminate upon a change of control of the Company following a takeover bid, and the effect thereof, are the Term Loan and Revolving Credit Facility agreements, which contain customary prepayment, cancellation and default provisions including, if required by a lender, mandatory prepayment of all utilisations provided by that lender upon the sale of all or substantially all of the business and assets of the Group or a change of control.
Interests in voting rightsAt the year end the Company had been notified, in accordance with Chapter 5 of the Financial Conduct Authority’s Disclosure Guidance and Transparency Rules, of the following significant interests in the issued ordinary share capital of the Company:
At 31 March 2018 At 7 June 2018
Shareholder
Number of ordinary
shares/ voting rights
notified
Percentage of voting
rights over ordinary
shares of £0.01 each
Number of ordinary
shares/ voting rights
notified
Percentage of voting
rights over ordinary
shares of £0.01 each
BlackRock Inc. 100,307,795 10.55% 80,654,003 8.50%
Baillie Gifford & Co. n/a n/a 47,482,549 5.01%
Kayne Anderson Rudnick Investment Management LLC
26,770,275 2.82% 49,059,618 5.18%
CI Investments Inc. 37,805,677 3.93% 27,343,814 2.88%
Transactions with related partiesAs described in note 28, during the year, the Group transacted with Burns Sheehan Limited, a third party which a Director holds a shareholding. This company is deemed to be a related party. Costs incurred were in respect of recruitment consultancy services which amounted to £35k (2017: £nil). There were no amounts outstanding at the year end. All transactions were completed at an arm’s length basis.
Compensation paid to Directors and Key Management is as disclosed in note 6 to the Group financial statements.
Research and developmentInnovation, specifically in software, is a critical element of Auto Trader’s strategy and therefore of the future success of the Group. Accordingly, the majority of the Group’s research and development expenditure is predominantly related to this area. Since 30 September 2013, the Group has changed its approach to technology development such that the Group now develops its core infrastructure through small-scale, maintenance-like incremental improvements, and as a result the amount of capitalised development costs has decreased as less expenditure meets the requirements of IAS 38 Intangible assets.
Authority to purchase own sharesThe Company’s share buyback programme continued during the year. By resolutions passed at the 2017 AGM the Company was authorised to make market purchases of up to 97,476,919 of its ordinary shares, subject to minimum and maximum price restrictions. A total of 26,809,702 ordinary shares of £0.01 each were purchased in the year to 31 March 2018, being 2.75% of the shares in issue at the time the authority was granted. The average price paid per share was 358.5p with a total consideration paid (inclusive of all costs) of £96.7 million, and all shares were purchased to be immediately cancelled. The Directors will seek authority from shareholders at the forthcoming AGM for the Company to purchase, in the market, up to a maximum of 10% of its own ordinary shares (excluding shares held in treasury) either to be cancelled or retained as treasury shares.
Share capital and controlThe Company’s issued share capital comprises ordinary shares of £0.01 each which are listed on the London Stock Exchange (LSE: AUTO.L). The ISIN of the shares is GB00BVYVFW23.
The issued share capital of the Company as at 31 March 2018 and 7 June 2018 comprises 952,161,444 of £0.01 each. 4,194,989 shares were held in treasury at 31 March 2018. Further information regarding the Company’s issued share capital and details of the movements in issued share capital during the year are provided in note 21 to the Group’s financial statements. All the information detailed in note 21 forms part of this Directors’ report and is incorporated into it by reference.
Details of employee share schemes are provided in note 25 to the Group financial statements.
Rights attaching to sharesAll shares have the same rights (including voting and dividend rights and rights on a return of capital) and restrictions as set out in the Articles, described below. Except in relation to dividends which have been declared and rights on a liquidation of the Company, the shareholders have no rights to share in the profits of the Company. The Company’s shares are not redeemable. However, following any grant of authority from shareholders, the Company may purchase or contract to purchase any of the shares on or off market, subject to the Companies Act 2006 and the requirements of the Listing Rules.
No shareholder holds shares in the Company which carry special rights with regard to control of the Company. There are no shares relating to an employee share scheme which have rights with regard to control of the Company that are not exercisable directly and solely by the employees, other than in the case of the Auto Trader Group Share Incentive Plan, where share interests of a participant in such scheme can be exercised by the personal representatives of a deceased participant in accordance with the Scheme rules.
Voting rightsEach ordinary share entitles the holder to vote at general meetings of the Company. A resolution put to the vote of the meeting shall be decided on a show of hands unless a poll is demanded. On a show of hands, every member who is present in person or by proxy at a general meeting of the Company shall have one vote. On a poll, every member who is present in person or by proxy shall have one vote for every share of which they are a holder. The Articles provide a deadline for submission of proxy forms of not less than 48 hours before the time appointed for the holding of the meeting or adjourned meeting. No member shall be entitled to vote at any general meeting either in person or by proxy, in respect of any share held by him, unless all amounts presently payable by him in respect of that share have been paid. Save as noted, there are no restrictions on voting rights nor any agreement that may result in such restrictions.
82 Auto Trader Group plc Annual Report and Financial Statements 2018

Indemnities and insuranceThe Company maintains appropriate insurance to cover Directors’ and officers’ liability for itself and its subsidiaries and such insurance was in force for the whole of the financial year ending 31 March 2018. The Company also indemnifies the Directors under a qualifying indemnity for the purposes of section 236 of the Companies Act 2006: in the case of the Non-Executive Directors in their respective letters of appointment and in the case of the Executive Directors in a separate deed of indemnity. Such indemnities contain provisions that are permitted by the Director Liability provisions of the Companies Act and the Company’s Articles.
EnvironmentalInformation on the Group’s greenhouse gas emissions is set out in the Corporate social responsibility section on page 47 and forms part of this Report by reference.
Political donationsThere were no political donations made during the year or the previous year.
Post balance sheet eventsOn 6 June 2018 the Group signed into a new Revolving Credit Facility (the ‘New RCF’) to replace the existing Senior Syndicated Term Loan and revolving credit facility. The New RCF, which is unsecured, has total commitments of £400m and a termination date of June 2023.
External branchesThe Group had no active registered external branches during the reporting period.
Financial instrumentsDetails of the financial risk management objectives and policies of the Group, including hedging policies and exposure of the entity to price risk, credit risk, liquidity risk and cash flow risk, are given in note 2 to the consolidated financial statements.
Disclosure of information to auditorsEach of the Directors has confirmed that:
– so far as the Director is aware, there is no relevant audit information of which the Company’s auditors are unaware; and
– the Director has taken all the steps that he/she ought to have taken as a Director to make him/herself aware of any relevant audit information and to establish that the Company’s auditor is aware of that information.
This confirmation is given and should be interpreted in accordance with the provisions of Section 418 of the Companies Act 2006.
Statement of Directors’ responsibilities in respect of the Annual Report and Financial StatementsThe Directors are responsible for preparing the Annual Report and the Group and parent company financial statements in accordance with applicable law and regulations.
Company law requires the Directors to prepare Group and parent Company financial statements for each financial year. Under that law they are required to prepare the Group financial statements in accordance with International Financial Reporting Standards as adopted by the European Union (‘IFRSs as adopted by the EU’) and applicable law, and have elected to prepare the parent company financial statements in accordance with UK Accounting Standards, including FRS 102 ‘The Financial Reporting Standard Applicable in the UK and Republic of Ireland’.
Under company law the Directors must not approve the financial statements unless they are satisfied that they give a true and fair view of the state of affairs of the Group and parent company and of their profit or loss for that period. In preparing each of the Group and parent company financial statements, the Directors are required to:
– select suitable accounting policies and then apply them consistently;
– make judgements and accounting estimates that are reasonable, relevant, reliable and prudent;
– for the Group financial statements, state whether they have been prepared in accordance with IFRSs as adopted by the EU;
– for the parent company financial statements, state whether applicable UK Accounting Standards have been followed, subject to any material departures disclosed and explained in the parent Company financial statements;
– assess the Group and parent company’s ability to continue as a going concern, disclosing, as applicable, matters related to going concern; and
– use the going concern basis of accounting unless they either intend to liquidate the Group or the parent company or to cease operations, or have no realistic alternative but to do so.
The Directors are responsible for keeping adequate accounting records that are sufficient to show and explain the parent company’s transactions and disclose with reasonable accuracy at any time the financial position of the parent company and enable them to ensure that its financial statements comply with the Companies Act 2006. They are responsible for such internal control as they determine is necessary to enable the preparation of financial statements that are free from material misstatement, whether due to fraud or error, and have general responsibility for taking such steps as are reasonably open to them to safeguard the assets of the Group and to prevent and detect fraud and other irregularities.
Under applicable law and regulations, the Directors are also responsible for preparing a Strategic Report, Directors’ Report, Directors’ Remuneration Report and Corporate Governance Statement that complies with that law and those regulations.
The Directors are responsible for the maintenance and integrity of the corporate and financial information included on the Company’s website. Legislation in the UK governing the preparation and dissemination of financial statements may differ from legislation in other jurisdictions.
Responsibility statement of the Directors in respect of the annual financial reportWe confirm, to the best of our knowledge:
– the financial statements, prepared in accordance with the applicable set of accounting standards, give a true and fair view of the assets, liabilities, financial position and profit or loss of the Company and the undertakings included in the consolidation taken as a whole; and
– the Strategic report includes a fair review of the development and performance of the business and the position of the issuer and the undertakings included in the consolidation taken as a whole, together with a description of the principal risks and uncertainties that they face.
We consider that the Annual Report and Accounts, taken as a whole, is fair, balanced and understandable and provides the information necessary for shareholders to assess the Group’s position and performance, business model and strategy.
Approval of Annual ReportThe Strategic report and the Corporate governance report were approved by the Board on 7 June 2018.
Approved by the Board and signed on its behalf.
Claire BatyCompany Secretary 7 June 2018
Strategic report / Governance / Financial statements
83Auto Trader Group plc Annual Report and Financial Statements 2018

Independent auditors’ report to the members of Auto Trader Group plc only1. Our opinion is unmodifiedWe have audited the financial statements of Auto Trader Group plc for the year ended 31 March 2018 which comprise the Group Statement of Financial Position and Parent Company Balance Sheet, the Group Statement of Comprehensive Income, the Group Statement of Cash Flows, the Group and Parent Company’s Statements of Changes in Equity, and related notes including the accounting policies in note 1.
In our opinion: – the financial statements give a true and fair view of the state of the Group’s and of the Parent Company’s affairs as at 31 March 2018 and of the Group’s profit for the year then ended;
– the Group financial statements have been properly prepared in accordance with International Financial Reporting Standards as adopted by the European Union;
– the Parent Company financial statements have been properly prepared in accordance with UK Accounting Standards, including FRS 102 The Financial Reporting Standard applicable in the UK and Republic of Ireland; and
– the financial statements have been prepared in accordance with the requirements of the Companies Act 2006; and, as regards the Group financial statements, Article 4 of the IAS Regulation.
Basis for opinion We conducted our audit in accordance with International Standards on Auditing (UK) (“ISAs (UK)”) and applicable law. Our responsibilities are described below. We believe that the audit evidence we have obtained is a sufficient and appropriate basis for our opinion. Our audit opinion is consistent with our report to the Audit Committee.
We were appointed as auditor by the shareholders on 22 September 2016. The period of total uninterrupted engagement is for the two financial years ended 31 March 2018. We have fulfilled our ethical responsibilities under, and we remain independent of the Group in accordance with, UK ethical requirements including the FRC Ethical Standard as applied to listed public interest entities. No non-audit services prohibited by that standard were provided.
Overview
Materiality: Group financial statements as a whole
£8.0m (2017: £8.0m) 3.8% (2017: 4.1%) of Group profit before tax
Coverage 100% (2017: 100%) of Group profit before tax
Risks of material misstatement vs 2017Recurring risks Revenue recognition
Recoverability of Parent Company’s investment in subsidiary
2. Key audit matters: our assessment of risks of material misstatementKey audit matters are those matters that, in our professional judgement, were of most significance in the audit of the financial statements and include the most significant assessed risks of material misstatement (whether or not due to fraud) identified by us, including those which had the greatest effect on: the overall audit strategy; the allocation of resources in the audit; and directing the efforts of the engagement team. We summarise below the key audit matters (unchanged from 2017), in decreasing order of audit significance, in arriving at our audit opinion above, together with our key audit procedures to address those matters and, as required for public interest entities, our results from those procedures. These matters were addressed, and our results are based on procedures undertaken, in the context of, and solely for the purpose of, our audit of the financial statements as a whole, and in forming our opinion thereon, and consequently are incidental to that opinion, and we do not provide a separate opinion on these.
The risk Our response
Revenue recognition(£330.1 million; 2017: £311.4 million)Refer to page 62 (Audit Committee Report), page 93 (accounting policy) and page 102 (financial disclosures).
Data processingRevenue primarily consists of fees for advertising on the Group’s website and web-related activities, along with retailer website build and hosting subscription fees, maintenance contracts and other subscription fees. Given the variety of packages available, the ability of retailers to bespoke the combination of products they receive, and to amend this through time, as well as the large volume of transactions, there is a risk that revenue may be misstated due to errors made in capturing and processing this large variety of data.
Our procedures included: – Data comparisons: Using computer assisted audit techniques to match sales information from the billing system to the accounting records;
– Tests of details: Using computer assisted audit techniques to match entire population of billings to cash received during the year and trade debtors outstanding at the year end. Selecting a sample of trade debtors and assessing their recoverability with reference to post year end cash receipts;
– Expectation vs outcome: For customers with bespoke contracts, obtaining these contracts and forming an expectation of the revenue to be recognised in the period, comparing this to the actual;
– Tests of details: Selecting a sample of transactions recorded within a month before and after the period end and assessing whether revenue has been recognised in the correct period with reference to supporting invoices and cash receipts;
– Tests of details: Assessing the appropriateness of accrued income at the year end with reference to post year end billings and cash receipts. Assessing the appropriateness of deferred income at the year end with reference to the prior year and our knowledge of the billing pattern of each revenue stream;
– Tests of details: Performing a review of credit notes raised in the year and post year end to assess the adequacy of the credit note provision and that revenue is not overstated; and
– Analytic sampling: Obtaining all journals posted to revenue and, using computer assisted audit techniques, analysing these to identify those with unusual attributes or those with corresponding postings to unexpected accounts. Agreeing any journals identified back to relevant supporting documentation.
Our results: – We found the amount of revenue recognised to be acceptable (2017: acceptable).
84 Auto Trader Group plc Annual Report and Financial Statements 2018

100% 100%
Group revenue%
100%
100% 100%
100%
Group total assets%
Group profit before tax%
Full scope for Group audit purposes 2018
Full scope for Group audit purposes 2017
Profit before tax£210.8m (2017: £193.4m)
Materiality£8.0m
Profit before taxGroup materiality
£7.5mRange of materiality at four components (£0.2m–£7.5m)
£8.0mWhole financialstatements materiality
£0.4mMisstatements reportedto the Audit Committee
The risk Our response
Recoverability of parent company’s investment in subsidiary (£1,212.9 million; 2017: £1,210.5 million)Refer to page 62 (Audit Committee Report), page 92 (accounting policy) and page 128 (financial disclosures).
Low risk, high value:The carrying amount of the parent company’s investment in subsidiary represents 73% (2017: 74%) of the Company’s total assets. Its recoverability is not at a high risk of significant misstatement or subject to significant judgement. However, due to its materiality in the context of the parent company financial statements, this is considered to be the area that had the greatest effect on our overall parent company audit.
Our procedures included: – Comparing valuations: comparing the carrying amount of the investment to the market capitalisation of the Group, as all of the Group’s trading operations are contained within the subsidiary and its subgroup.
Our results : – We found the parent company’s assessment of the recoverability of the investment in subsidiary to be acceptable (2017 result: acceptable).
3. Our application of materiality and an overview of the scope of our auditMateriality for the Group financial statements as a whole was set at £8.0m (2017: £8.0m), determined with reference to a benchmark of Group profit before tax of £210.8m (2017: £193.4m), of which it represents 3.8% (2017: 4.1%).
The materiality of the parent company financial statements as a whole was set at £5.0m (2017: £5.0m), determined with reference to a benchmark of parent company net assets, of which it represents 0.4% (2017: 0.4%).
We reported to the Audit Committee any corrected or uncorrected identified misstatements exceeding £0.4m (2017: £0.4m), in addition to other identified misstatements that warranted reporting on qualitative grounds.
Of the Group’s four (2017: four) reporting components, we subjected four (2017: four) to full scope audits for Group purposes, all of which were performed by the Group audit team.
The components within the scope of our work accounted for the percentages illustrated below.
Strategic report / Governance / Financial statements
85Auto Trader Group plc Annual Report and Financial Statements 2018

4. We have nothing to report on going concern We are required to report to you if:
– we have anything material to add or draw attention to in relation to the Directors’ statement in note 1 to the financial statements on the use of the going concern basis of accounting with no material uncertainties that may cast significant doubt over the Group and Company’s use of that basis for a period of at least 12 months from the date of approval of the financial statements; or
– if the related statement under the Listing Rules set out on page 50 is materially inconsistent with our audit knowledge.
We have nothing to report in these respects.
5. We have nothing to report on the other information in the Annual ReportThe Directors are responsible for the other information presented in the Annual Report together with the financial statements. Our opinion on the financial statements does not cover the other information and, accordingly, we do not express an audit opinion or, except as explicitly stated below, any form of assurance conclusion thereon.
Our responsibility is to read the other information and, in doing so, consider whether, based on our financial statements audit work, the information therein is materially misstated or inconsistent with the financial statements or our audit knowledge. Based solely on that work we have not identified material misstatements in the other information.
Strategic Report and Directors’ Report Based solely on our work on the other information:
– we have not identified material misstatements in the Strategic Report and the Directors’ Report;
– in our opinion the information given in those reports for the financial year is consistent with the financial statements; and
– in our opinion those reports have been prepared in accordance with the Companies Act 2006.
Directors’ Remuneration Report In our opinion the part of the Directors’ Remuneration Report to be audited has been properly prepared in accordance with the Companies Act 2006.
Disclosures of principal risks and longer-term viability Based on the knowledge we acquired during our financial statements audit, we have nothing material to add or draw attention to in relation to:
– the Directors’ confirmation within the Viability statement page 38 that they have carried out a robust assessment of the principal risks facing the Group, including those that would threaten its business model, future performance, solvency and liquidity;
– the Principal Risks disclosures describing these risks and explaining how they are being managed and mitigated; and
– the Directors’ explanation in the Viability statement of how they have assessed the prospects of the Group, over what period they have done so and why they considered that period to be appropriate, and their statement as to whether they have a reasonable expectation that the Group will be able to continue in operation and meet its liabilities as they fall due over the period of their assessment, including any related disclosures drawing attention to any necessary qualifications or assumptions.
Under the Listing Rules we are required to review the viability statement. We have nothing to report in this respect.
Corporate governance disclosures We are required to report to you if:
– we have identified material inconsistencies between the knowledge we acquired during our financial statements audit and the Directors’ statement that they consider that the Annual Report and Financial Statements taken as a whole is fair, balanced and understandable and provides the information necessary for shareholders to assess the Group’s position and performance, business model and strategy; or
– the section of the Annual Report describing the work of the Audit Committee does not appropriately address matters communicated by us to the Audit Committee.
We are required to report to you if the Corporate Governance Statement does not properly disclose a departure from the 11 provisions of the UK Corporate Governance Code specified by the Listing Rules for our review.
We have nothing to report in these respects.
6. We have nothing to report on the other matters on which we are required to report by exception Under the Companies Act 2006, we are required to report to you if, in our opinion:
– adequate accounting records have not been kept by the parent company, or returns adequate for our audit have not been received from branches not visited by us; or
– the parent company financial statements and the part of the Directors’ Remuneration Report to be audited are not in agreement with the accounting records and returns; or
– certain disclosures of Directors’ remuneration specified by law are not made; or
– we have not received all the information and explanations we require for our audit.
We have nothing to report in these respects.
Independent auditors’ report to the members of Auto Trader Group plc only continued
86 Auto Trader Group plc Annual Report and Financial Statements 2018

7. Respective responsibilities Directors’ responsibilities As explained more fully in their statement set out on page 83, the Directors are responsible for: the preparation of the financial statements including being satisfied that they give a true and fair view; such internal control as they determine is necessary to enable the preparation of financial statements that are free from material misstatement, whether due to fraud or error; assessing the Group and parent company’s ability to continue as a going concern, disclosing, as applicable, matters related to going concern; and using the going concern basis of accounting unless they either intend to liquidate the Group or the parent company or to cease operations, or have no realistic alternative but to do so.
Auditor’s responsibilities Our objectives are to obtain reasonable assurance about whether the financial statements as a whole are free from material misstatement, whether due to fraud or other irregularities (see below), or error, and to issue our opinion in an auditor’s report. Reasonable assurance is a high level of assurance, but does not guarantee that an audit conducted in accordance with ISAs (UK) will always detect a material misstatement when it exists. Misstatements can arise from fraud, other irregularities or error and are considered material if, individually or in aggregate, they could reasonably be expected to influence the economic decisions of users taken on the basis of the financial statements.
A fuller description of our responsibilities is provided on the FRC’s website at frc.org.uk/auditorsresponsibilities
Irregularities – ability to detectWe identified areas of laws and regulations that could reasonably be expected to have a material effect on the financial statements from our sector experience and through discussion with the Directors (as required by auditing standards).
We had regard to laws and regulations in areas that directly affect the financial statements including financial reporting (including related company legislation) and taxation legislation. We considered the extent of compliance with those laws and regulations as part of our procedures on the related financial statement items.
We communicated identified laws and regulations throughout our team and remained alert to any indications of non-compliance throughout the audit.
As with any audit, there remained a higher risk of non-detection of non-compliance with relevant laws and regulations (irregularities), as these may involve collusion, forgery, intentional omissions, misrepresentations, or the override of internal controls.
8. The purpose of our audit work and to whom we owe our responsibilities This report is made solely to the Company’s members, as a body, in accordance with Chapter 3 of Part 16 of the Companies Act 2006. Our audit work has been undertaken so that we might state to the Company’s members those matters we are required to state to them in an auditor’s report and for no other purpose. To the fullest extent permitted by law, we do not accept or assume responsibility to anyone other than the Company and the Company’s members, as a body, for our audit work, for this report, or for the opinions we have formed.
Mick Davies (Senior Statutory Auditor) for and on behalf of KPMG LLP, Statutory Auditor Chartered Accountants 1 St Peter’s Square Manchester M2 3AE
7 June 2018
Strategic report / Governance / Financial statements
87Auto Trader Group plc Annual Report and Financial Statements 2018

Consolidated income statementFor the year ended 31 March 2018
Note2018
£m2017
£m
Revenue 3 330.1 311.4
Administrative expenses (109.5) (108.3)
Operating profit 4 220.6 203.1
Finance costs 7 (9.8) (9.7)
Profit before taxation 210.8 193.4
Taxation 8 (39.5) (38.7)
Profit for the year attributable to equity holders of the parent 171.3 154.7
Basic earnings per share 9
From profit for the year (pence per share) 17.76 15.64
Diluted earnings per share 9
From profit for the year (pence per share) 17.70 15.60
As outlined in the basis of preparation on page 93, the current period is for the 365 days ended 31 March 2018 and the comparative period is for the 369 days ended 31 March 2017.
88 Auto Trader Group plc Annual Report and Financial Statements 2018

Consolidated statement of comprehensive incomeFor the year ended 31 March 2018
2018£m
2017£m
Profit for the year 171.3 154.7
Items that may be subsequently reclassified to profit or lossCurrency translation differences 0.2 0.5
Other comprehensive income for the year, net of tax 0.2 0.5
Total comprehensive income for the year attributable to equity holders of the parent 171.5 155.2
Currency translation differences arise on the consolidation of the Group’s subsidiaries that have a functional currency other than sterling.
As outlined in the basis of preparation on page 93, the current period is for the 365 days ended 31 March 2018 and the comparative period is for the 369 days ended 31 March 2017.
Strategic report / Governance / Financial statements
89Auto Trader Group plc Annual Report and Financial Statements 2018

Consolidated balance sheetAt 31 March 2018
Note2018
£m2017
£m
AssetsNon-current assetsIntangible assets 10 329.8 320.4
Property, plant and equipment 11 6.0 6.7
Deferred taxation assets 19 5.1 4.7
340.9 331.8
Current assetsTrade and other receivables 14 55.5 50.7
Cash and cash equivalents 15 4.3 8.0
59.8 58.7
Total assets 400.7 390.5
Equity and liabilitiesEquity attributable to equity holders of the parentShare capital 21 9.5 9.8
Retained earnings 1,041.7 1,015.9
Capital reorganisation reserve (1,060.8) (1,060.8)
Own shares held 22 (16.9) (16.9)
Capital redemption reserve 0.5 0.2
Other reserves 30.6 30.4
Total equity 4.6 (21.4)
LiabilitiesNon-current liabilitiesBorrowings 17 340.8 357.8
Deferred taxation liabilities 19 0.7 0.2
Retirement benefit obligations 20 – –
Provisions for other liabilities and charges 18 1.1 1.1
342.6 359.1
Current liabilitiesTrade and other payables 16 33.3 33.3
Current income tax liabilities 19.9 19.2
Provisions for other liabilities and charges 18 0.3 0.3
53.5 52.8
Total liabilities 396.1 411.9
Total equity and liabilities 400.7 390.5
The financial statements from pages 88 to 123 were approved by the Board of Directors and authorised for issue.
Nathan CoeChief Financial Officer and Chief Operating Officer7 June 2018
Auto Trader Group plc Registered number 09439967
90 Auto Trader Group plc Annual Report and Financial Statements 2018
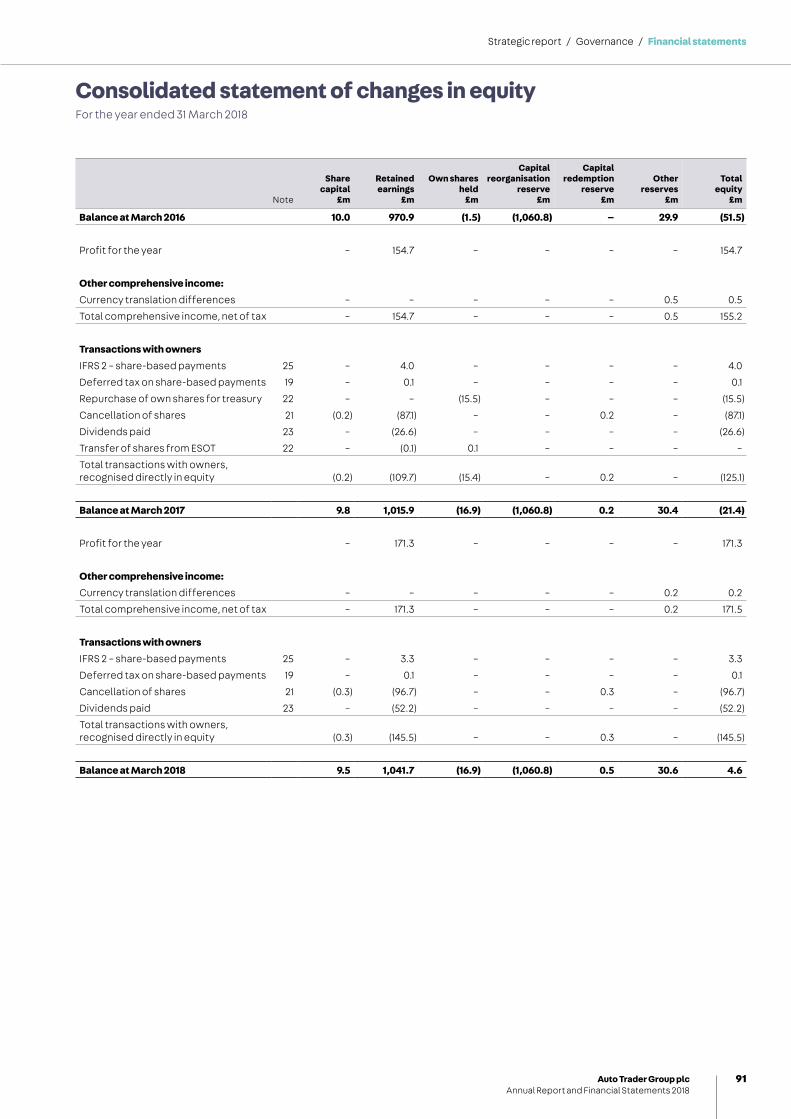
Consolidated statement of changes in equityFor the year ended 31 March 2018
Note
Sharecapital
£m
Retainedearnings
£m
Own shares held
£m
Capitalreorganisation
reserve£m
Capitalredemption
reserve£m
Otherreserves
£m
Totalequity
£m
Balance at March 2016 10.0 970.9 (1.5) (1,060.8) – 29.9 (51.5)
Profit for the year – 154.7 – – – – 154.7
Other comprehensive income:Currency translation differences – – – – – 0.5 0.5
Total comprehensive income, net of tax – 154.7 – – – 0.5 155.2
Transactions with ownersIFRS 2 – share-based payments 25 – 4.0 – – – – 4.0
Deferred tax on share-based payments 19 – 0.1 – – – – 0.1
Repurchase of own shares for treasury 22 – – (15.5) – – – (15.5)
Cancellation of shares 21 (0.2) (87.1) – – 0.2 – (87.1)
Dividends paid 23 – (26.6) – – – – (26.6)
Transfer of shares from ESOT 22 – (0.1) 0.1 – – – –
Total transactions with owners, recognised directly in equity (0.2) (109.7) (15.4) – 0.2 – (125.1)
Balance at March 2017 9.8 1,015.9 (16.9) (1,060.8) 0.2 30.4 (21.4)
Profit for the year – 171.3 – – – – 171.3
Other comprehensive income:Currency translation differences – – – – – 0.2 0.2
Total comprehensive income, net of tax – 171.3 – – – 0.2 171.5
Transactions with ownersIFRS 2 – share-based payments 25 – 3.3 – – – – 3.3
Deferred tax on share-based payments 19 – 0.1 – – – – 0.1
Cancellation of shares 21 (0.3) (96.7) – – 0.3 – (96.7)
Dividends paid 23 – (52.2) – – – – (52.2)
Total transactions with owners, recognised directly in equity (0.3) (145.5) – – 0.3 – (145.5)
Balance at March 2018 9.5 1,041.7 (16.9) (1,060.8) 0.5 30.6 4.6
Strategic report / Governance / Financial statements
91Auto Trader Group plc Annual Report and Financial Statements 2018

Consolidated statement of cash flowsFor the year ended 31 March 2018
Note2018
£m2017
£m
Cash flows from operating activitiesCash generated from operations 24 226.1 212.9
Tax paid (39.4) (34.8)
Net cash generated from operating activities 186.7 178.1
Cash flows from investing activitiesPurchases of intangible assets – financial systems (0.3) (0.7)
Purchases of intangible assets – other (0.3) (0.5)
Purchases of property, plant and equipment (2.3) (2.5)
Net cash outflow on acquisition of subsidiary 26 (11.9) –
Net cash used in investing activities (14.8) (3.7)
Cash flows from financing activitiesDividends paid to Company’s shareholders 23 (52.2) (26.6)
Repayment of Syndicated Term Loan 17 (20.0) (40.0)
Payment of interest on borrowings (6.7) (7.6)
Purchase of own shares for cancellation (96.2) (86.7)
Purchase of own shares for treasury – (15.4)
Payment of fees on repurchase of own shares (0.5) (0.5)
Net cash used in financing activities (175.6) (176.8)
Net decrease in cash and cash equivalents (3.7) (2.4)
Cash and cash equivalents at beginning of year 15 8.0 10.4
Cash and cash equivalents at end of year 15 4.3 8.0
As outlined in the basis of preparation on page 93, the current period is for the 365 days ended 31 March 2018 and the comparative period is for the 369 days ended 31 March 2017.
92 Auto Trader Group plc Annual Report and Financial Statements 2018
General informationAuto Trader Group plc is a public limited company which is listed on the London Stock Exchange and is domiciled and incorporated in the United Kingdom under the Companies Act 2006. The address of the registered office is given on the inside back cover.
1. Accounting policiesBasis of preparationThe principal accounting policies applied in the preparation of the consolidated financial statements are set out below. These policies have been consistently applied to all the periods presented, unless otherwise stated. The financial information presented is at and for the year (365 days) ended 31 March 2018 and for the 369-day period ended 31 March 2017. Due to the publishing heritage of the business, results have historically been reported on a 52-week basis, with the accounting period ending on the closest Sunday to 31 March. During the year ended 31 March 2017, the Board made the decision to change the period end date to be 31 March every year, to better align with our customers’ needs and to the products and services we offer. As a consequence of this change, the 2017 financial year was four days longer than the current year.
The consolidated financial statements have been prepared in accordance with International Financial Reporting Standards (‘IFRS’) as adopted by the European Union (‘EU’), IFRS Interpretation Committee (‘IFRS IC’), certain interpretations as adopted by the EU, and the Companies Act 2006 applicable to companies reporting under IFRS. The consolidated financial statements have been prepared on the going concern basis and under the historical cost convention, as modified by the revaluation of certain financial assets and financial liabilities (including derivative instruments) at fair value through profit or loss.
Going concernThe Directors, after making enquiries and on the basis of current financial projections and facilities available, believe that the Group has adequate financial resources to continue in operation for a period not less than 12 months from the date of this report. For this reason, they continue to adopt the going concern basis in preparing the financial statements.
Accounting estimates and judgementsThe preparation of financial statements in conformity with IFRS requires the use of certain accounting estimates and assumptions. It also requires management to exercise its judgement in the process of applying the Group’s accounting policies. Estimates and judgements are continually evaluated and are based on historical experience and other factors, including expectations of future events that are believed to be reasonable under the circumstances.
There are no accounting estimates or judgements which are critical to the reporting of results of operations and financial position.
The accounting estimates believed to require the most difficult, subjective or complex judgements are as follows:
– carrying values of goodwill; and
– share-based payments.
The Group tests annually whether goodwill has suffered any impairment in accordance with the accounting policy stated. The recoverable amounts of cash-generating units have been determined based on value-in-use calculations, which require the use of estimates; see note 10.
Share-based payment arrangements in which the Group receives goods or services as consideration for its own equity instruments are accounted for as equity-settled share-based payment transactions. The fair value of services received in return for share options is calculated with reference to the fair value of the award on the date of grant. Black-Scholes and Monte Carlo models have been used where appropriate to calculate the fair value and the Directors have therefore made estimates with regard to the inputs to that model and the period over which the share award is expected to vest (note 25).
Notes to the consolidated financial statements
Strategic report / Governance / Financial statements
93Auto Trader Group plc Annual Report and Financial Statements 2018
Notes to the consolidated financial statements continued
1. Accounting policies continued
New accounting standards and IFRS IC interpretationsThe Group has adopted the following new and amended IFRSs in the consolidated financial statements with no significant impact on its consolidated results or financial position:
– Amendments to IAS 12 ‘Income Taxes’
– Amendments to IAS 7 ‘Statement of Cash Flows’
The following standards and interpretations were issued by the IASB but have not been adopted, either because they were not endorsed by the EU as at 31 March 2018 or they are not yet mandatory:
– IFRS 9 ‘Financial Instruments‘ and IFRS 15 ‘Revenue from Contracts with Customers’
The Group is required to adopt IFRS 9 and IFRS 15 from 1 April 2018. The Group has assessed the estimated impact that the initial application of IFRS 9 and IFRS 15 will have on its consolidated financial statements and does not expect this to be material.
– IFRS 16 ‘Leases’
IFRS 16 replaces IAS 17 ‘Leases’ and is effective for annual periods beginning on or after 1 January 2019. Early adoption is permitted for entities that apply IFRS 15 at or before the date of initial application of IFRS 16. The Group intends to early adopt IFRS 16 when IFRS 15 becomes mandatory, being 1 April 2018, using the fully retrospective approach.
The Group’s lease commitments will be brought onto the consolidated statement of financial position, as a liability with a corresponding asset, both of which are immaterial in relation to the net assets of the Group.
Total costs incurred remain unchanged over the life of the lease but the timing of when those costs are recognised within the consolidated income statement will be impacted. Based on analysis of lease commitments held by the Group at 31 March 2018, and using estimated discount rates, the net impact on profit is expected to be immaterial to the Group. This does not impact the Group’s cash flows.
– Amendment to IFRS 2 – Classification and Measurement of Share-Based Payments Transactions (not yet EU endorsed). This standard is not anticipated to have a significant impact on the financial statements.
– Annual improvements to IFRSs 2014–2016 (not yet EU endorsed).
– IFRIC Interpretation 22 Foreign Currency Transactions and Advance Consideration (not yet EU endorsed).
– IFRIC 23 Uncertainty over Income Tax Treatments (not yet EU endorsed).
Basis of consolidationThe Group’s consolidated financial statements consolidate the financial statements of Auto Trader Group plc and all of its subsidiary undertakings.
Subsidiaries are all entities (including structured entities) over which the Group has control. The Group controls an entity when the Group is exposed to, or has rights to, variable returns from its involvement with the entity and has the ability to affect those returns through its power over the entity. Subsidiaries are fully consolidated from the date on which control is transferred to the Group. They are de-consolidated from the date that control ceases.
The purchase method of accounting is used to account for the acquisition of subsidiaries by the Group. The cost of an acquisition is measured as the fair value of the assets given, equity instruments issued and liabilities incurred or assumed at the date of exchange. Costs directly attributable to the acquisition are expensed. Identifiable assets acquired and liabilities and contingent liabilities assumed in a business combination are measured initially at their fair values at the acquisition date, irrespective of the extent of any non-controlling interest. The excess of the consideration transferred, the amount of any non-controlling interest in the acquiree and the acquisition-date fair value of any previous equity interest in the acquiree over the fair value of the identifiable net assets acquired is recorded as goodwill. If the total of consideration transferred, non-controlling interest recognised and previously held interest measured is less than the fair value of the net assets of the subsidiary acquired in the case of a bargain purchase, the difference is recognised directly in the income statement.
Intercompany transactions and balances between Group companies are eliminated on consolidation.
Associates are all entities over which the Group has significant influence but not control, generally accompanying a shareholding of between 20% and 50% of the voting rights. Where significant influence is not demonstrated but the shareholding is between 20% and 50% the Group would account for its interest as an investment. All investments are initially recognised at cost and the carrying value is reviewed for impairment.
94 Auto Trader Group plc Annual Report and Financial Statements 2018

Segment reportingOperating segments are reported in a manner consistent with the internal reporting provided to the chief operating decision-maker. The chief operating decision-maker, who is responsible for allocating resources and assessing performance of the operating segments, has been identified as the Operational Leadership Team that makes strategic decisions (note 3).
Revenue recognitionRevenue comprises the fair value of the consideration received or receivable for the sale of goods and services in the ordinary course of the Group’s activities. Revenue is stated net of discounts, rebates, refunds and value-added tax.
The Group recognises revenue when the amount of revenue can be reliably measured, it is probable that future economic benefits will flow to the entity and when specific criteria have been met for each of the Group’s activities as described below.
Revenue is recognised as follows:
– Trade revenue: fees from retailer and home trader customers for advertising on the Group’s websites and web-related activities are recognised on a straight-line basis as the service is provided. Retailer website build and hosting subscription fees, maintenance contracts and other subscription fees are recognised on a straight-line basis over the period to which they relate. Fees from logistic firms and retailers for facilitating the move of vehicles on the Group’s Motor Trade Delivery platform are recognised at the point the vehicle has been delivered.
– Consumer services revenue: fees from private sellers for advertising on the Group’s websites are recognised on a straight-line basis as the service is provided. Revenues from third-party partners who provide services to consumers relating to their motoring needs, such as insurance and loan finance, are recognised as the service is provided to the third-party partner.
– Manufacturer & Agency revenue: revenue from manufacturers and their advertising agencies for placing display advertising on the Group’s websites is recognised on a straight-line basis as the service is provided.
Dividend distributionDividend distribution to the Company’s shareholders is recognised as a liability in the Group’s financial statements in the period in which the dividend is approved by the Company’s shareholders in the case of final dividends, or the date at which they are paid in the case of interim dividends.
Employee benefitsThe Group operates several pension schemes and all except one are defined contribution schemes. Within the UK all pension schemes set up prior to 2001 have been closed to new members and only one defined contribution scheme is now open to new employees.
a) Defined contribution schemeThe assets of the defined contribution scheme are held separately from those of the Group in independently administered funds. The costs in respect of this scheme are charged to the income statement as incurred.
b) Defined benefit schemeThe Group operates one defined benefit pension scheme that is closed to new members. The asset or liability recognised in the balance sheet in respect of the defined benefit scheme is the present value of the defined benefit obligation at the balance sheet date less the fair value of the scheme’s assets. The defined benefit obligation is calculated annually by independent actuaries using the projected unit credit method. The present value of the defined benefit obligation is determined by discounting the estimated future cash outflows using interest rates of high-quality corporate bonds that are denominated in the currency in which the benefits will be paid, and that have terms to maturity approximating those of the related pension liability. Remeasurement gains and losses arising from experience adjustments and changes in actuarial assumptions are charged or credited to equity in ‘other comprehensive income’ in the period in which they arise. Any scheme surplus (to the extent it can be recovered) or deficit is recognised in full on the balance sheet.
c) Share-based paymentsEquity-settled awards are valued at grant date, and the difference between the grant date fair value and the consideration paid by the employee is charged as an expense in the income statement spread over the vesting period. Fair value of the awards are measured using Black-Scholes and Monte Carlo pricing models. The credit side of the entry is recorded in equity. Cash-settled awards are revalued at each reporting date with the fair value of the award charged to the profit and loss account over the vesting period and the credit side of the entry recognised as a liability.
Exceptional itemsSignificant non-recurring items of income and expense are disclosed as ‘exceptional items’. Examples of items that may give rise to disclosure as exceptional items include costs of major restructuring and reorganisation of the business, corporate refinancing and restructuring costs, gains on the early extinguishment of borrowings or impairments of intangible assets, property, plant and equipment, as well as the reversal of such writedowns or impairments, material disposals of property, plant and equipment and litigation settlements. A full analysis of exceptional items is provided in note 4.
Foreign currency translationa) Functional and presentation currencyItems included in the financial statements of each of the Group’s entities are measured using the currency of the primary economic environment in which the entity operates. The consolidated financial statements are presented in sterling (£), which is the Group’s presentation currency, and rounded to the nearest hundred thousand (£0.1m) except when otherwise indicated.
Strategic report / Governance / Financial statements
95Auto Trader Group plc Annual Report and Financial Statements 2018
Notes to the consolidated financial statements continued
1. Accounting policies continued
b) Transactions and balancesForeign currency transactions are translated into the functional currency using the exchange rates prevailing at the dates of the transactions. Foreign exchange gains and losses resulting from the settlement of such transactions and from the translation at the period end exchange rates of monetary assets and liabilities denominated in foreign currencies are recognised in the income statement within administrative expenses.
c) Group companiesThe results and financial position of all Group entities (none of which has the currency of a hyper-inflationary economy) that have a functional currency other than sterling are translated into sterling as follows:
– assets and liabilities for each balance sheet presented are translated at the closing rate at the date of that balance sheet; and
– income and expenses for each income statement are translated at average exchange rates.
On the disposal of a foreign operation, the cumulative exchange differences that were recorded in equity are recognised in the income statement as part of the gain or loss on sale. Goodwill and fair value adjustments arising on the acquisition of a foreign entity are treated as assets and liabilities of the foreign entity and translated at the closing rate.
Intangible assetsa) GoodwillGoodwill represents the excess cost of an acquisition over the fair value of the Group’s share of the net identifiable assets of the acquired subsidiary at the date of acquisition.
Goodwill is tested annually for impairment and is carried at cost less accumulated impairment losses. Impairment losses are charged to the income statement and are not reversed. The gain or loss on the disposal of an entity includes the carrying amount of goodwill relating to the entity sold.
Goodwill is allocated to cash-generating units for the purpose of impairment testing. The allocation is made to those cash-generating units that are expected to benefit from the business combination in which the goodwill arose.
b) Trademarks, trade names, technology, non-compete agreements and customer relationships Separately acquired trademarks, trade names, technology and customer relationships are recognised at historical cost. They have a finite useful life and are carried at cost less accumulated amortisation. Amortisation is calculated using the straight-line method to allocate the cost over their estimated useful lives of between one and 15 years. Trademarks, trade names, technology, non-compete agreements and customer relationships acquired in a business combination are recognised at fair value at the acquisition date and subsequently amortised.
c) SoftwareAcquired computer software is capitalised at cost, including any costs to bring it into use, and is carried at cost less accumulated amortisation. Amortisation is calculated using the straight-line method to allocate the cost over the estimated useful life of three to five years.
d) Software and website development costs and financial systemsDevelopment costs that are directly attributable to the design and testing of identifiable and unique software products, websites and systems controlled by the Group are recognised as intangible assets when the following criteria are met:
– it is technically feasible to complete the software product or website so that it will be available for use;
– management intends to complete the software product or website and use or sell it;
– there is an ability to use or sell the software product or website;
– it can be demonstrated how the software product or website will generate probable future economic benefits;
– adequate technical, financial and other resources to complete the development and to use or sell the software product or website are available; and
– the expenditure attributable to the software product or website during its development can be reliably measured.
Directly attributable costs that are capitalised as part of the software product, website or system include employee and contractor costs.
Other development expenditures that do not meet these criteria, as well as ongoing maintenance and costs associated with routine upgrades and enhancements, are recognised as an expense as incurred.
Development costs for software, websites and systems are carried at cost less accumulated amortisation and are amortised over their useful lives (not exceeding five years) at the point in which they come into use.
96 Auto Trader Group plc Annual Report and Financial Statements 2018

Property, plant and equipmentAll property, plant and equipment is stated at historical cost less accumulated depreciation and impairment losses. Historical cost comprises the purchase price of the asset and expenditure directly attributable to the acquisition of the item.
Freehold land is not depreciated. Depreciation on other assets is calculated using the straight-line method to allocate their cost less their estimated residual values over the estimated useful lives as follows:
Land, buildings and leasehold improvements:
– Freehold buildings 50 years
– Leasehold land and buildings life of lease
– Leasehold improvements life of lease
– Plant and equipment 3–10 years
The assets’ residual values and useful lives are reviewed, and adjusted if appropriate, at each balance sheet date. The carrying value of assets is reviewed for impairment if events or changes in circumstances suggest that the carrying value may not be recoverable. Assets will be written down to their recoverable amount if lower than the carrying value, and any impairment is charged to the income statement.
Gains and losses on disposals are determined by comparing the proceeds with the carrying amount and are recognised in the income statement within administrative expenses.
Impairment of non-financial assetsAssets that have an indefinite useful life, for example goodwill, are not subject to amortisation and are tested annually for impairment. Assets that are subject to amortisation and depreciation are reviewed for impairment whenever events or changes in circumstances indicate that the carrying amount may not be recoverable. An impairment loss is recognised for the amount by which the asset’s carrying amount exceeds its recoverable amount. The recoverable amount is the higher of an asset’s fair value less costs to sell and value in use. For the purposes of assessing impairment, assets are grouped at the lowest levels for which there are separately identifiable cash flows (cash-generating units). Non-financial assets other than goodwill that have suffered an impairment are reviewed for possible reversal of the impairment at each reporting date.
In assessing value in use, the estimated future cash flows are discounted to their present value using a pre-tax discount rate that reflects current market assessments of the time value of money and the risks specific to the asset. For an asset that does not generate largely independent cash flows, the recoverable amount is determined for the cash-generating unit to which the asset belongs.
Impairment losses recognised in respect of cash-generating units are allocated first to reduce the carrying amount of any goodwill allocated to the cash-generating unit (or group of units) and then to reduce the carrying amount of other assets in the unit (or group of units) on a pro-rata basis.
Financial assetsThe Group classifies its financial assets in the categories of loans and receivables and at fair value through profit or loss. The classification depends on the purpose for which the financial assets were acquired. Management determines the classification of its financial assets at initial recognition.
Loans and receivables are non-derivative financial assets with fixed or determinable payments that are not quoted in an active market. They are included in current assets, except for maturities greater than 12 months after the balance sheet date which are classified as non-current assets. The Group’s loans and receivables comprise trade and other receivables and cash and cash equivalents in the balance sheet. Loans and receivables are initially recognised at fair value and subsequently carried at amortised cost using the effective interest method.
Financial assets measured at fair value are those held for trading or designated at fair value through profit or loss. Derivatives are categorised as held for trading unless they are designated as hedges. Assets in this category are classified as current assets. Financial assets carried at fair value through the profit or loss account are initially recognised at fair value, and transaction costs are expensed in the income statement. They are subsequently re-measured to fair value and gains or losses arising from changes in the fair value are recognised in the income statement in the period in which they arise.
Financial assets and liabilities are offset and the net amount reported in the balance sheet when there is a legally enforceable right to offset the recognised amounts and there is an intention to settle on a net basis, or realise the asset and settle the liability simultaneously.
The Group assesses at the end of each reporting period whether there is objective evidence that a financial asset or group of financial assets is impaired. A financial asset is impaired only if there is objective evidence of impairment as a result of one or more events that occurred after the initial recognition of the asset and that this event has an impact on the estimated future cash flows of the financial asset that can be reliably estimated. The amount of the loss is measured as the difference between the asset’s carrying amount and the present value of estimated future cash flows discounted at the financial asset’s original effective interest rate. The carrying amount of the asset is reduced and the amount of the loss is recognised in the income statement.
If, in a subsequent period, the amount of the impairment loss decreased and the decrease can be related objectively to an event occurring after the impairment was recognised, the reversal of the previously recognised impairment loss is credited to the income statement.
Strategic report / Governance / Financial statements
97Auto Trader Group plc Annual Report and Financial Statements 2018
Notes to the consolidated financial statements continued
1. Accounting policies continued
Derivative financial instruments and hedgingThe Group does not currently use derivative financial instruments for hedging or for speculative purposes.
Trade receivablesTrade receivables are recognised initially at fair value and subsequently measured at amortised cost using the effective interest method, less provision for impairment. A provision for impairment of trade receivables is established when there is objective evidence that the Group will not be able to collect all amounts due according to the original terms of the receivables.
Cash and cash equivalentsCash and cash equivalents include cash in hand, short-term deposits held on call with banks and bank overdrafts. Bank overdrafts are shown within borrowings in ‘current liabilities’ on the balance sheet.
Trade payablesTrade and other payables are recognised initially at fair value and subsequently measured at amortised cost using the effective interest method.
BorrowingsBorrowings are recognised initially at fair value, net of transaction costs incurred, and are subsequently carried at amortised cost, with any difference between the proceeds (net of transaction costs) and the redemption value being recognised in the income statement over the period of the borrowings using the effective interest method.
Finance and issue costs associated with the borrowings are charged to the income statement using the effective interest rate method from the date of issue over the estimated life of the borrowings to which the costs relate.
Borrowings are derecognised when the obligation under the liability is discharged, cancelled or expired. Where an existing financial liability is replaced by another from the same lender on substantially different terms, or the terms of an existing liability are substantially modified, such an exchange or modification is treated as a de-recognition of the original liability and the recognition of a new liability, such that the difference in respective carrying amounts together with any costs or fees incurred are recognised in the income statement.
The buyback of bank borrowings represents the discharge of the obligation to repay the debt. The difference between the carrying amount of the financial liability extinguished and the consideration paid is recognised as an exceptional gain in the income statement, as it is a significant non-recurring item.
Borrowings are classified as current liabilities unless the Group has an unconditional right to defer settlement of the liability for at least 12 months after the balance sheet date.
ProvisionsA provision is recognised when a present legal or constructive obligation exists at the balance sheet date as a result of a past event, it is probable that an outflow of resources will be required to settle the obligation and a reliable estimate of that obligation can be made. Where there are a number of similar obligations, the likelihood that an outflow will be required in settlement is determined by considering the class of obligations as a whole. If the effect is material, provisions are determined by discounting the expected future cash flows at a pre-tax rate that reflects current market assessments of the time value of money and, where appropriate, the risks specific to the obligation.
Contingent liabilities are not recognised but are disclosed unless an outflow of resources is remote. Contingent assets are not recognised but are disclosed where an inflow of economic benefits is probable.
LeasesLeases in which a significant portion of the risks and rewards of ownership are retained by the lessor are classified as operating leases. Payments made under operating leases (net of any incentives received from the lessor) are charged to the income statement on a straight-line basis over the period of the lease.
98 Auto Trader Group plc Annual Report and Financial Statements 2018

TaxationThe tax expense for the period comprises current and deferred taxation. Tax is recognised in the income statement, except to the extent that it relates to items recognised in ‘other comprehensive income’ or directly in equity. In this case the tax is also recognised in ‘other comprehensive income’ or directly in equity, respectively. Management periodically evaluates positions taken in tax returns with respect to situations in which applicable tax regulation is subject to interpretation. It establishes provisions where appropriate on the basis of amounts expected to be paid to the tax authorities.
Current taxation is provided at amounts expected to be paid (or recovered) calculated using the rates of tax and laws that have been enacted or substantively enacted at the balance sheet date in the countries where the Group operates and generates taxable income.
Deferred taxation is provided in full, using the liability method, on temporary differences arising between the tax base of assets and liabilities and their carrying amounts in the consolidated financial statements.
Deferred taxation is determined using tax rates and laws that have been enacted or substantively enacted by the balance sheet date and are expected to apply when the related deferred tax asset is realised or the deferred tax liability is settled.
Deferred taxation assets are recognised only to the extent that it is probable that future taxable profit will be available against which the temporary differences can be utilised.
Deferred taxation is provided on temporary differences arising on investments in subsidiaries except where the timing of the reversal of the temporary difference is controlled by the Group and it is probable that the temporary difference will not reverse in the foreseeable future.
Deferred taxation assets and liabilities are offset when there is a legally enforceable right to offset current tax assets against current tax liabilities and when the deferred taxation assets and liabilities relate to taxes levied by the same taxation authority on either the taxable entity or different taxable entities where there is an intention to settle the balance on a net basis.
Share capitalOrdinary shares are classified as equity. Incremental costs directly attributable to the issue of new shares are shown in equity as a deduction from the proceeds.
Where the Group purchases its own equity share capital, the consideration paid is deducted from equity attributable to the Group’s shareholders. Where such shares are subsequently cancelled, the nominal value of the shares repurchased is deducted from share capital and transferred to a capital redemption reserve.
Where the Group purchases its own equity share capital to hold in Treasury, the consideration paid for the shares is shown as own shares held within equity.
Shares held by the Employee Share Option TrustThe Employee Share Option Trust (‘ESOT’) provides for the issue of shares to Group employees principally under share option schemes. The Group has control of the ESOT and therefore consolidates the ESOT in the Group financial statements. Accordingly, shares in the Company held by the ESOT are included in the balance sheet at cost as a deduction from equity.
Share premium and other reservesThe amount subscribed for the ordinary shares in excess of the nominal value of these new shares is recorded in ‘share premium’. Costs that directly relate to the issue of ordinary shares are deducted from share premium net of corporation tax.
The capital reorganisation reserve arose on consolidation as a result of the share-for-share exchange on 24 March 2015. It represents the difference between the nominal value of shares issued by Auto Trader Group plc in this transaction and the share capital and reserves of Auto Trader Holding Limited.
The capital redemption reserve arises from the purchase and subsequent cancellation of the Group’s own equity share capital.
Other reserves comprise the currency translation reserve on the consolidation of entities whose functional currency is other than sterling.
Earnings per shareThe Group presents basic and diluted earnings per share (‘EPS’) for its ordinary shares. Basic EPS is calculated by dividing the profit attributable to ordinary shareholders by the weighted average number of ordinary shares outstanding during the period. For diluted EPS, the weighted average number of ordinary shares is adjusted to assume conversion of all dilutive potential ordinary shares.
Strategic report / Governance / Financial statements
99Auto Trader Group plc Annual Report and Financial Statements 2018

Notes to the consolidated financial statements continued
2. Financial risk managementa) Financial risk factorsIn the course of its business the Group is exposed to market risk (including foreign exchange risk and interest rate risk), credit risk, liquidity risk and technology risk. The Group’s overall risk management strategy is to minimise potential adverse effects on the financial performance and net assets of the Group. These policies are set and reviewed by senior finance management and all significant financing transactions are authorised by the Board of Directors.
Market riski. Foreign exchange riskThe Group has no significant foreign exchange risk as 98% of the Group’s revenue and 97% of costs are sterling-denominated. As the amounts are not significant, no sensitivity analysis has been presented.
The Group operates in Ireland. Foreign currency-denominated net assets of overseas operations are not hedged as they represent a relatively small proportion of the Group’s net assets. The Group operates a dividend policy, ensuring any surplus cash is remitted to the UK and translated into sterling, thereby minimising the impact of exchange volatility.
ii. Interest rate riskThe Group’s interest rate risk arises from long-term borrowings under the Senior Facilities Agreement with floating rates of interest linked to LIBOR. The Group monitors interest rates on an ongoing basis but does not currently hedge interest rate risk.
iii. Credit riskCredit risk is the risk that financial loss arises from the failure of a customer or counterparty to meet its obligations under a contract. The Group has dedicated standards, policies and procedures to control and monitor all such risks. Although the Group is potentially exposed to credit loss in the event of non-performance by counterparties, such credit risk is controlled through credit rating reviews of the counterparties and by limiting the total amount of exposure to any one party. The Group does not believe it is exposed to any material concentrations of credit risk.
Trade receivablesCredit risk relating to trade receivables is managed centrally and the credit risk for new customers is analysed before standard payment terms and conditions are offered. Policies and procedures exist to ensure that existing customers have an appropriate credit history and a significant number of balances are prepaid or collected via direct debit. Sales to private customers are primarily settled using major debit or credit cards which reduces the risk in this area. Overall, the Group considers that it is not exposed to a significant amount of either customer credit or bad debt risk, due to the diversified and fragmented nature of the customer base.
The cost of bad debts for the year ended 31 March 2018 was 0.6% of revenue (2017: 0.6%).
Cash and cash equivalentsAs at 31 March 2018, the Group held cash and cash equivalents of £4.3m (2017: £8.0m). The cash and cash equivalents are held with bank and financial institution counterparties, which are rated between P-1 and P-2 based on Moody’s ratings.
iv. Liquidity riskCash flow forecasting is performed centrally by the Group treasury manager. Rolling forecasts of the Group’s liquidity requirements are monitored to ensure it has sufficient cash to meet operational needs. Such forecasting takes into consideration the Group’s debt financing plans.
Surplus cash held by operating entities over and above the balance required for working capital management is invested centrally in interest-bearing current accounts and money market deposits with appropriate maturities or sufficient liquidity as required by the above-mentioned forecasts.
100 Auto Trader Group plc Annual Report and Financial Statements 2018

The tables below analyse the Group’s financial liabilities and undrawn commitments into relevant maturity groupings based on the remaining period at the balance sheet date to contractual maturity date. Derivative financial instruments are included in the analysis if their contractual maturities are essential for an understanding of the timing of the cash flows. The amounts disclosed in the table are the contractual undiscounted cash flows. As disclosed in note 17 of these consolidated financial statements, the borrowings are currently drawn down under a syndicated debt arrangement and repayments can be made at any time without penalty. As such, there is no contractual interest cost. Interest paid in the year in relation to borrowings amounted to £6.7m.
At 31 March 2018
Less than1 year
£m
Between1 and 2
years£m
Between2 and 5
years£m
Over5 years
£m
Borrowings - 343.0 - -Trade and other payables 5.1 - - -Undrawn revolving credit and other facilities - - 30.0 -Total 5.1 343.0 30.0 -
At 31 March 2017
Less than1 year
£m
Between1 and 2
years£m
Between2 and 5
years£m
Over5 years
£m
Borrowings – – 363.0 –
Trade and other payables 7.1 – – –
Undrawn revolving credit and other facilities – – 30.0 –
Total 7.1 – 393.0 –
b) Capital risk managementThe Group considers capital to be net debt plus total equity. Net debt is defined as borrowings excluding debt issue costs less cash and short-term deposits. Total equity is as shown in the consolidated balance sheet.
The calculation of total capital is shown in the table below:
2018£m
2017£m
Loans due within one year - –
Loans and overdrafts greater than one year 343.0 363.0
Less: Cash and cash equivalents (4.3) (8.0)
Total net debt 338.7 355.0
Total equity 4.6 (21.4)
Total capital 343.3 333.6
The objectives for managing capital are to safeguard the Group’s ability to continue as a going concern, in order to provide returns for shareholders and benefits for other stakeholders and to maintain an efficient capital structure to optimise the cost of capital. In order to maintain or adjust the capital structure, the Group may adjust the amount of dividends paid to shareholders, return capital to shareholders, issue new shares or take other steps to increase share capital and reduce or increase debt facilities.
As at 31 March 2018, the Group had borrowings of £343.0m (2017: £363.0m) through its Syndicated Term Loan. Interest was payable on this facility at a rate of LIBOR plus a margin of between 1.5% and 3.25% depending on the consolidated leverage ratio of Auto Trader Group plc and its subsidiaries, which was calculated and reviewed on a biannual basis. Repayments could be made without penalty.
On 6 June 2018, the Group signed into a new Revolving Credit Facility (the ‘new RCF’) to replace the existing Syndicated Term Loan and revolving credit facility. The new RCF, which is unsecured, has total commitments of £400m and a termination date of June 2023.
Interest on the new RCF is charged at LIBOR plus a margin of between 1.2% and 2.1% depending on the consolidated leverage of Auto Trader Group plc. A commitment fee of 35% of the margin applicable to the new RCF is payable quarterly in arrears on unutilised amounts of the new RCF. There is no requirement to settle all, or part, of the debt earlier than the termination date.
The Group remains in compliance with its banking covenants.
c) Fair value estimationAt 31 March 2018 and 31 March 2017, the Group had no financial instruments held at fair value through profit and loss.
Strategic report / Governance / Financial statements
101Auto Trader Group plc Annual Report and Financial Statements 2018

Notes to the consolidated financial statements continued
3. Segmental informationIFRS 8 ‘Operating segments’ requires the Group to determine its operating segments based on information which is provided internally. Based on the internal reporting information and management structures within the Group, it has been determined that there is only one operating segment, being the Group, as the information reported includes operating results at a consolidated Group level only. This reflects the nature of the business, where the major cost is to support the IT platforms upon which all of the Group’s customers are serviced. These costs are borne centrally and are not attributable to any specific customer type or revenue stream. There is also considered to be only one reporting segment, which is the Group, the results of which are shown in the consolidated income statement.
Management has determined that there is one operating and reporting segment based on the reports reviewed by the Operational Leadership Team (‘OLT’) which is the chief operating decision-maker (‘CODM’). The OLT is made up of the Executive Directors and Key Management and is responsible for the strategic decision-making of the Group.
To assist in the analysis of the Group’s revenue-generating trends, the OLT reviews revenue from three customer types as detailed below:
– Trade: revenue from retailer and home trader customers advertising their vehicles and utilising the Group’s products. Following the acquisition of Motor Trade Delivery (‘MTD’) in April 2017, this category also includes revenue from logistics firms who pay to access the MTD website;
– Consumer services: revenue from private sellers for vehicle advertisements on the Group’s websites. This category also includes revenue from third-party partners who provide services to consumers relating to their motoring needs, such as insurance and loan finance; and
– Manufacturer & Agency: revenue from manufacturers and their advertising agencies for placing display advertising on the Group’s websites.
The reporting information provided to the OLT, which presents revenue by customer type, has been voluntarily disclosed below:
Revenue2018
£m2017
£m
Trade 281.2 262.1
Consumer services 29.8 31.8
Manufacturer & Agency 19.1 17.5
Total revenue 330.1 311.4
The revenue from external parties reported to the OLT is measured in a manner consistent with that in the income statement.
Operating profitAs disclosed in the 2017 Annual Report and Financial Statements, from this financial year, the business now reports against the statutory measure of Operating profit as opposed to the non-GAAP measure of Underlying operating profit. A reconciliation of prior year comparatives has been shown for completeness.
2018£m
2017£m
Operating profit 220.6 203.1
– Share-based payments and associated NI 3.7 4.5
– Exceptional items – (0.4)
Underlying operating profit 224.3 207.2
A reconciliation of the total segment Operating profit to the Profit before tax is provided as follows:
2018£m
2017£m
Total segment Operating profit 220.6 203.1
Finance costs – net (9.8) (9.7)
Profit before tax 210.8 193.4
The OLT reviews the balance sheet information for the one operating segment. The segment’s assets and liabilities are presented in a manner consistent with that of these consolidated financial statements.
102 Auto Trader Group plc Annual Report and Financial Statements 2018
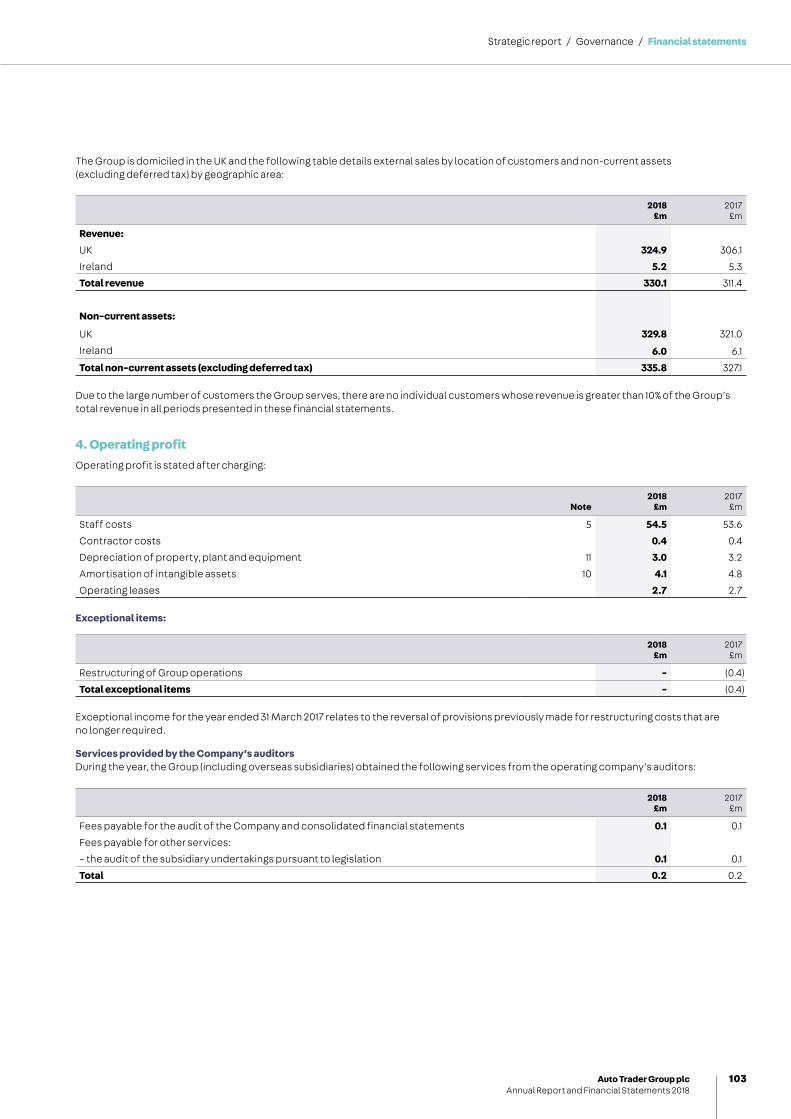
The Group is domiciled in the UK and the following table details external sales by location of customers and non-current assets (excluding deferred tax) by geographic area:
2018£m
2017£m
Revenue:UK 324.9 306.1
Ireland 5.2 5.3
Total revenue 330.1 311.4
Non-current assets:
UK 329.8 321.0
Ireland 6.0 6.1
Total non-current assets (excluding deferred tax) 335.8 327.1
Due to the large number of customers the Group serves, there are no individual customers whose revenue is greater than 10% of the Group’s total revenue in all periods presented in these financial statements.
4. Operating profitOperating profit is stated after charging:
Note2018
£m2017
£m
Staff costs 5 54.5 53.6
Contractor costs 0.4 0.4
Depreciation of property, plant and equipment 11 3.0 3.2
Amortisation of intangible assets 10 4.1 4.8
Operating leases 2.7 2.7
Exceptional items:
2018£m
2017£m
Restructuring of Group operations - (0.4)
Total exceptional items - (0.4)
Exceptional income for the year ended 31 March 2017 relates to the reversal of provisions previously made for restructuring costs that are no longer required.
Services provided by the Company’s auditorsDuring the year, the Group (including overseas subsidiaries) obtained the following services from the operating company’s auditors:
2018£m
2017£m
Fees payable for the audit of the Company and consolidated financial statements 0.1 0.1
Fees payable for other services:
– the audit of the subsidiary undertakings pursuant to legislation 0.1 0.1
Total 0.2 0.2
Strategic report / Governance / Financial statements
103Auto Trader Group plc Annual Report and Financial Statements 2018

Notes to the consolidated financial statements continued
5. Employees and Directors
2018£m
2017£m
Wages and salaries 44.1 42.5
Social security costs 4.8 4.7
Other pension costs (note 20) 1.9 1.9
50.8 49.1
Share-based payments and associated NI (note 25) 3.7 4.5
Total 54.5 53.6
The average monthly number of employees (including Executive Directors but excluding third-party contractors) employed by the Group was as follows:
2018Number
2017Number
Customer operations 331 339
Product and technology 312 311
Display 49 46
Corporate 130 124
Total 822 820
6. Directors and Key Management remunerationThe remuneration of Directors was as follows:
2018£m
2017£m
Aggregate Directors’ emoluments 1.6 1.5
Share-based payments charge 1.5 1.3
Total 3.1 2.8
During the year ended 31 March 2018, three Directors (2017: two Directors) were members of the Group’s defined pension contribution scheme.
The remuneration of the highest paid Director was as follows:
2018£m
2017£m
Aggregate emoluments 0.7 0.7
Share-based payments charge 1.0 0.9
Total 1.7 1.6
During the year to 31 March 2018, Trevor Mather, Sean Glithero and Nathan Coe (2017: Trevor Mather and Sean Glithero) received remuneration in respect of their services as Directors of the Company and subsidiary undertakings. Ed Williams (2017: Ed Williams) received remuneration in respect of his services as a Director of the Company.
Refer to the Directors’ remuneration report on pages 74 to 80 for further detail.
Key Management compensationDuring the year to 31 March 2018, Key Management comprised the members of the OLT (2017: OLT). The remuneration of all Key Management (including Directors) was as follows:
2018£m
2017£m
Short-term employee benefits 4.9 5.0
Share-based payments 2.6 2.6
Termination benefits 0.1 –
Pension contributions 0.2 0.2
Total 7.8 7.8
104 Auto Trader Group plc Annual Report and Financial Statements 2018

7. Finance costs
2018£m
2017£m
Finance costsOn bank loans and overdrafts 6.8 7.5
Amortisation of debt issue costs 3.0 2.2
Total 9.8 9.7
Debt issue costs incurred on the original Senior Facilities Agreement were accelerated in the year with an additional £1.1m recognised in the consolidated income statement (2017: additional charge of £nil).
8. Taxation
2018£m
2017£m
Current taxationUK corporation taxation 40.7 39.3
Foreign taxation 0.2 0.2
Adjustments in respect of prior years (0.9) (0.4)
Total current taxation 40.0 39.1
Deferred taxationOrigination and reversal of temporary differences (0.3) (0.3)
Adjustments in respect of prior years (0.2) (0.1)
Total deferred taxation (0.5) (0.4)
Total taxation charge 39.5 38.7
The taxation charge for the year is lower than (2017: the same as) the effective rate of corporation tax in the UK of 19% (2017: 20%). The differences are explained below:
2018£m
2017£m
Profit before taxation 210.8 193.4
Tax on profit on ordinary activities at the standard UK corporation tax rate of 19% (2017: 20%) 40.1 38.7
Expenses not deductible for taxation purposes 0.6 0.6
Adjustments in respect of foreign tax rates (0.1) (0.1)
Adjustments in respect of prior years (1.1) (0.5)
Total taxation charge 39.5 38.7
Taxation on items taken directly to equity was a credit of £0.1m (2017: £0.1m) relating to deferred tax on share-based payments.
The tax charge for the year is based on the standard rate of UK corporation tax for the period of 19% (2017: 20%). Deferred income taxes have been measured at the tax rate expected to be applicable at the date the deferred income tax assets and liabilities are realised. Management has performed an assessment, for all material deferred income tax assets and liabilities, to determine the period over which the deferred income tax assets and liabilities are forecast to be realised, which has resulted in an average deferred income tax rate of 17% being used to measure all deferred tax balances as at 31 March 2018 (2017: 17%).
Strategic report / Governance / Financial statements
105Auto Trader Group plc Annual Report and Financial Statements 2018
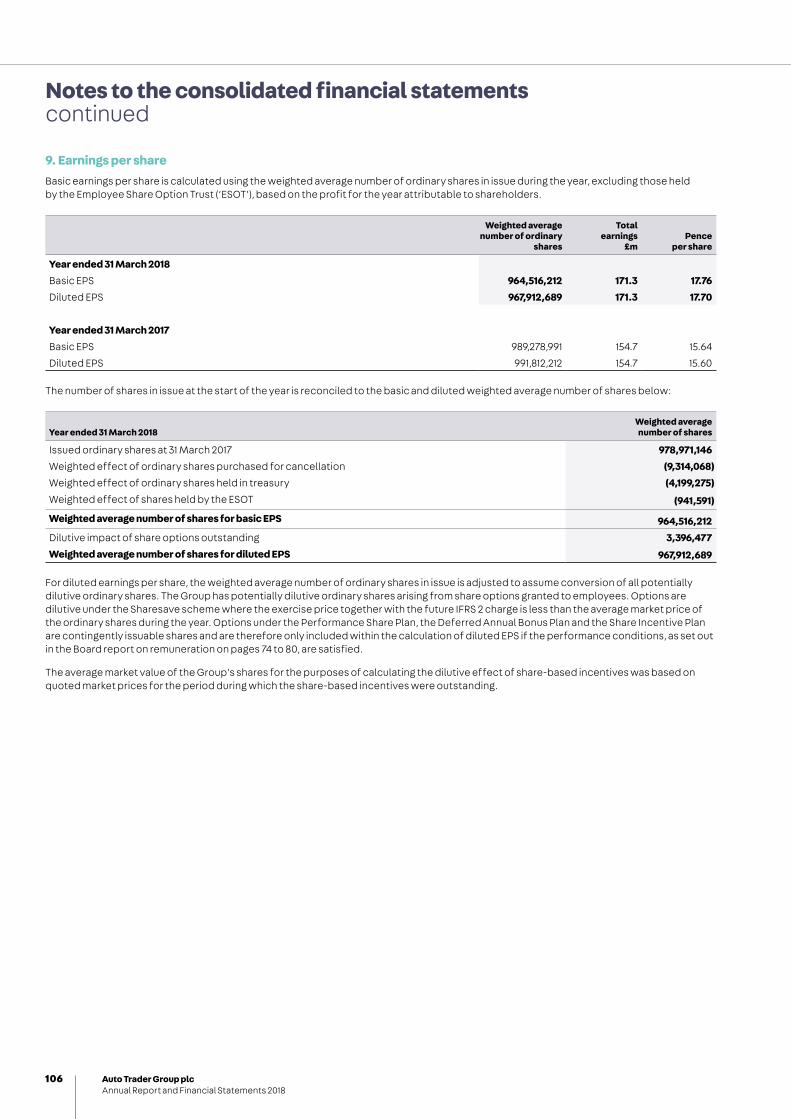
Notes to the consolidated financial statements continued
9. Earnings per shareBasic earnings per share is calculated using the weighted average number of ordinary shares in issue during the year, excluding those held by the Employee Share Option Trust (‘ESOT’), based on the profit for the year attributable to shareholders.
Weighted average number of ordinary
shares
Totalearnings
£mPence
per share
Year ended 31 March 2018Basic EPS 964,516,212 171.3 17.76Diluted EPS 967,912,689 171.3 17.70
Year ended 31 March 2017Basic EPS 989,278,991 154.7 15.64
Diluted EPS 991,812,212 154.7 15.60
The number of shares in issue at the start of the year is reconciled to the basic and diluted weighted average number of shares below:
Year ended 31 March 2018Weighted averagenumber of shares
Issued ordinary shares at 31 March 2017 978,971,146Weighted effect of ordinary shares purchased for cancellation (9,314,068)Weighted effect of ordinary shares held in treasury (4,199,275)Weighted effect of shares held by the ESOT (941,591)
Weighted average number of shares for basic EPS 964,516,212Dilutive impact of share options outstanding 3,396,477Weighted average number of shares for diluted EPS 967,912,689
For diluted earnings per share, the weighted average number of ordinary shares in issue is adjusted to assume conversion of all potentially dilutive ordinary shares. The Group has potentially dilutive ordinary shares arising from share options granted to employees. Options are dilutive under the Sharesave scheme where the exercise price together with the future IFRS 2 charge is less than the average market price of the ordinary shares during the year. Options under the Performance Share Plan, the Deferred Annual Bonus Plan and the Share Incentive Plan are contingently issuable shares and are therefore only included within the calculation of diluted EPS if the performance conditions, as set out in the Board report on remuneration on pages 74 to 80, are satisfied.
The average market value of the Group’s shares for the purposes of calculating the dilutive effect of share-based incentives was based on quoted market prices for the period during which the share-based incentives were outstanding.
106 Auto Trader Group plc Annual Report and Financial Statements 2018

10. Intangible assets
Goodwill£m
Software and website
development costs£m
Financial systems
£mOther
£mTotal
£m
CostAt 31 March 2016 433.6 54.0 11.6 13.3 512.5Additions – 0.5 0.7 – 1.2Exchange differences 0.5 0.1 – – 0.6At 31 March 2017 434.1 54.6 12.3 13.3 514.3Acquired through a business combination 8.5 0.4 – 3.8 12.7Additions – 0.3 0.3 – 0.6Exchange differences 0.2 – – – 0.2At 31 March 2018 442.8 55.3 12.6 17.1 527.8
Accumulated amortisation and impairmentsAt 31 March 2016 120.8 52.3 4.2 11.8 189.1Amortisation charge – 1.5 2.3 1.0 4.8At 31 March 2017 120.8 53.8 6.5 12.8 193.9Amortisation charge – 0.6 2.4 1.1 4.1At 31 March 2018 120.8 54.4 8.9 13.9 198.0
Net book value at 31 March 2018 322.0 0.9 3.7 3.2 329.8Net book value at 31 March 2017 313.3 0.8 5.8 0.5 320.4Net book value at 31 March 2016 312.8 1.7 7.4 1.5 323.4
Other intangibles include customer relationships, technology, trade names, trademarks and non-compete agreements.
Intangible assets which have a finite useful life are carried at cost less accumulated amortisation. Amortisation of these intangible assets is calculated using the straight-line method to allocate the cost of the assets over their estimated useful lives (three to 15 years). The longest estimated useful life remaining at 31 March 2018 is five years.
For the year to 31 March 2018, the amortisation charge of £4.1m (2017: £4.8m) has been charged to administrative expenses in the income statement.
At 31 March 2018, £0.1m (2017: £0.1m) of software and website development costs represented assets under construction. Amortisation of these assets will commence when they are brought into use.
In accordance with International Financial Reporting Standards, goodwill is not amortised, but instead is tested annually for impairment, or more frequently if there are indicators of impairment. Goodwill is carried at cost less accumulated impairment losses.
Impairment test for goodwillGoodwill is allocated to the appropriate cash-generating unit (‘CGU’) based on the smallest identifiable group of assets that generates cash inflows independently in relation to the specific goodwill. The recoverable amount of the CGU is determined from value-in-use calculations that use cash flow projections from the latest three-year plan. The carrying value of CGUs is the sum of goodwill, property, plant and equipment and intangibles and is as follows:
2018£m
2017£m
Digital 330.2 307.6
Webzone 6.1 5.7
Total 336.3 313.3
Income and costs within the budget are derived on a detailed ‘bottom up’ basis – all income streams and cost lines are considered and appropriate growth, or decline, rates are assumed. Income and cost growth forecasts are risk adjusted to reflect specific risks facing each CGU and take into account the markets in which they operate. Key assumptions include revenue growth rates, associated levels of marketing support and directly associated overheads. Cash flows beyond the budgeted period are extrapolated using the estimated growth rate stated below into perpetuity. The growth rate does not exceed the long-term average growth rate for the markets in which the CGUs operate. Other than as included in the financial budgets, it is assumed that there are no material adverse changes in legislation that would affect the forecast cash flows.
Strategic report / Governance / Financial statements
107Auto Trader Group plc Annual Report and Financial Statements 2018

Notes to the consolidated financial statements continued
10. Intangible assets continued
The pre-tax discount rate used within the recoverable amount calculations was 8.0% (2017: 8.0%) and is based upon the weighted average cost of capital reflecting specific principal risks and uncertainties. The discount rate takes into account the risk-free rate of return, the market risk premium and beta factor reflecting the average beta for the Group and comparator companies which are used in deriving the cost of equity.
The same discount rate has been applied to both CGUs as the principal risks and uncertainties associated with the Group, as highlighted on pages 34 to 37, would also impact each CGU in a similar manner. The Board acknowledges that there are additional factors that could impact the risk profile of each CGU, which have been considered by way of sensitivity analysis performed as part of the annual impairment tests. Significant headroom exists in both CGUs. The level of headroom may change if different growth rate assumptions or a different pre-tax discount rate were used in the cash flow projections, however there are no likely changes to these assumptions that would result in any impairment recorded in each of the years presented in these financial statements.
11. Property, plant and equipment
Land, buildings and leasehold
improvements£m
Officeequipment
£mTotal
£m
CostAt 31 March 2016 3.9 17.9 21.8Additions – 2.5 2.5At 31 March 2017 3.9 20.4 24.3Additions – 2.3 2.3Disposals – (6.0) (6.0)At 31 March 2018 3.9 16.7 20.6
Accumulated depreciationAt 31 March 2016 1.1 13.3 14.4Charge for the year 0.3 2.9 3.2At 31 March 2017 1.4 16.2 17.6Charge for the year 0.3 2.7 3.0Disposals – (6.0) (6.0)At 31 March 2018 1.7 12.9 14.6
Net book value at 31 March 2018 2.2 3.8 6.0Net book value at 31 March 2017 2.5 4.2 6.7Net book value at 31 March 2016 2.8 4.6 7.4
The depreciation expense of £3.0m for the year to 31 March 2018 (2017: £3.2m) has been recorded in administrative expenses.
During the year, £6.0m (2017: £nil) worth of office equipment with £nil net book values were disposed of.
108 Auto Trader Group plc Annual Report and Financial Statements 2018

12. InvestmentsShares in other undertakings
£m
CostAt 31 March 2018 and 31 March 2017 3.2
Provision for impairmentAt 31 March 2018 and 31 March 2017 3.2
Net book value at 31 March 2018 –Net book value at 31 March 2017 –
At the balance sheet date, the Group holds a 16.0% (2017: 19.4%) interest in the preferred share capital of IAUTOS Company Limited. IAUTOS Company Limited is an intermediate holding company through which trading companies incorporated in the People’s Republic of China are held. It is not considered an associate as the Group does not have significant influence over this entity. This investment was fully impaired in the year to 31 March 2014 as the Chinese trading companies are loss-making with forecast future cash outflows.
Subsidiary undertakingsAt 31 March 2018 the Group’s related undertakings were:
Subsidiary undertakingsCountry of registration or
incorporation Principal activityClass of shares
held
Percentage owned by the
parent
Percentage owned by the
Group
Auto Trader Holding Limited 1 England and Wales Financing company Ordinary 100% 100%
Auto Trader Limited 1 England and Wales Online marketplace Ordinary – 100%
Trader Licensing Limited 1 England and Wales Dormant company Ordinary – 100%
Webzone Limited 2 Republic of Ireland Online marketplace Ordinary – 100%
Motor Trade Delivery Limited 1 England and Wales Online marketplace Ordinary – 100%
1 Registered office address for UK companies is shown on page 131.2 Registered office address for the Republic of Ireland companies is Paramount Court, Corrig Road, Sandyford Industrial Estate, Dublin 18, D18 R9C7.
A guarantee exists in respect of the wholly owned subsidiary that is incorporated in the Republic of Ireland and consolidated within these financial statements. They have availed themselves of an exemption from filing their individual financial statements in accordance with Section 357 of the Companies (Amendment) Act, 2014, Ireland.
Strategic report / Governance / Financial statements
109Auto Trader Group plc Annual Report and Financial Statements 2018

Notes to the consolidated financial statements continued
13. Financial instruments by categoryThe accounting policies for financial instruments have been applied to the loans and receivables and financial liabilities as detailed in the table below:
31 March 2018
Loans and receivables
£m
Non-financialassets
£mTotal
£m
Financial assets as per balance sheet:
Trade and other receivables 25.5 30.0 55.5Cash and cash equivalents 4.3 – 4.3Total 29.8 30.0 59.8
31 March 2018
Financial liabilities measured at
amortised cost£m
Non-financial liabilities
£mTotal
£m
Financial liabilities as per balance sheet:
Borrowings (340.8) – (340.8)Trade and other payables (5.1) (28.2) (33.3)Total (345.9) (28.2) (374.1)
31 March 2017
Loans andreceivables
£m
Non-financialassets
£mTotal
£m
Financial assets as per balance sheet:
Trade and other receivables 21.4 29.3 50.7
Cash and cash equivalents 8.0 – 8.0
Total 29.4 29.3 58.7
31 March 2017
Financial liabilities measured at
amortised cost£m
Non-financialliabilities
£mTotal
£m
Financial liabilities as per balance sheet:
Borrowings (357.8) – (357.8)
Trade and other payables (7.1) (26.2) (33.3)
Total (364.9) (26.2) (391.1)
Non-financial assets include prepayments and accrued income. Non-financial liabilities include other taxes and social security, accruals and deferred income.
The carrying amounts of financial assets and liabilities approximate their fair values.
110 Auto Trader Group plc Annual Report and Financial Statements 2018

14. Trade and other receivables
2018£m
2017£m
Trade receivables 28.8 24.4
Less: provision for impairment of trade receivables (3.4) (3.1)
Trade receivables – net 25.4 21.3
Accrued income 26.7 26.1
Prepayments 3.3 3.2
Other receivables 0.1 0.1
Total 55.5 50.7
The ageing analysis of trade receivables is as follows:
2018£m
2017£m
Fully performing 21.5 17.8
Past due but not impaired:
Up to three months 3.3 2.8
Impaired 4.0 3.8
Total 28.8 24.4
Trade receivables which are less than three months past due are not considered impaired unless specific information indicates otherwise. Trade receivables greater than three months past due are considered for recoverability, and where appropriate, a provision against bad debt is recognised.
It was assessed that a portion of the impaired receivables is expected to be recovered.
Movements on the provision for impairment of trade receivables are as follows:
2018£m
2017£m
At beginning of year 3.1 3.2
Provision for receivables impairment 2.0 1.7
Receivables written off during the year as uncollectible (1.7) (1.8)
Total 3.4 3.1
The creation and release of the provision for impaired trade receivables is included in administrative expenses in the income statement. The other classes within ‘trade and other receivables’ do not contain impaired assets.
The maximum exposure to credit risk at the reporting date is the carrying value of each class of receivable included within ‘trade and other receivables’. The Group does not hold any collateral as security. Due to the large number of customers the Group services, the credit quality of trade receivables is not deemed a significant risk.
The carrying amount of the Group’s trade receivables is denominated in the following currencies:
2018£m
2017£m
Sterling 28.0 23.6
Euro 0.8 0.8
Total 28.8 24.4
At 31 March 2018 and 31 March 2017 all other financial receivables are primarily denominated in sterling.
Strategic report / Governance / Financial statements
111Auto Trader Group plc Annual Report and Financial Statements 2018

Notes to the consolidated financial statements continued
15. Cash and cash equivalentsCash at bank and in hand is denominated in the following currencies:
2018£m
2017£m
Sterling 4.1 7.4
Euro 0.2 0.6
Cash at bank and in hand 4.3 8.0
16. Trade and other payables
2018£m
2017£m
Trade payables 3.7 6.1
Accruals 14.6 14.3
Other taxes and social security 11.8 10.0
Deferred income 1.8 1.9
Other payables 0.9 0.5
Accrued interest payable 0.5 0.5
Total 33.3 33.3
17. Borrowings
Non-current2018
£m2017
£m
Syndicated Term Loan gross of unamortised debt issue costs 343.0 363.0
Unamortised debt issue costs (2.2) (5.2)
Total 340.8 357.8
The Syndicated Term Loan is repayable as follows:
2018£m
2017£m
One to two years 343.0 -
Two to five years - 363.0
Total 343.0 363.0
The carrying amounts of borrowings approximate their fair values.
A reconciliation of changes in borrowings arising from financing activities is as follows:
At 1 April 2017
£m
Cash movement
£m
Non-cashmovement
£m
At 31 March 2018
£m
Total borrowings 357.8 (20.0) 3.0 340.8
During the year to 31 March 2018 the Group repaid £20.0m of the Syndicated Term Loan (2017: £40.0m).
112 Auto Trader Group plc Annual Report and Financial Statements 2018

Senior Facilities Agreement (including the Syndicated Term Loan)On 24 March 2015, the Company and a subsidiary undertaking, Auto Trader Holding Limited, entered into a £550.0m Senior Facilities Agreement. The associated debt transaction costs were £9.4m. The first utilisation was made on 24 March 2015 when £550.0m was drawn.
Interest on the Syndicated Term Loan was charged at LIBOR plus a margin of between 1.5% and 3.25% depending on the consolidated leverage ratio of the Group. There was no requirement to settle all or part of the debt earlier than the termination date in March 2020.
Under the Senior Facilities Agreement, the lenders also made available to the Company and Auto Trader Holding Limited a £30.0m revolving credit facility (the ‘RCF’). The RCF was undrawn at 31 March 2018 (2017: undrawn). Cash drawings under the RCF would incur interest at LIBOR plus a margin of between 1.25% and 3.0% depending on the consolidated leverage of the Group (31 March 2017: 1.25% and 3.0%). A commitment fee of 35% of the margin applicable to the RCF from time to time was payable quarterly in arrears on the unutilised amounts of the RCF.
On 6 June 2018, the Group signed into a new Revolving Credit Facility (the ‘new RCF’) to replace the existing Syndicated Term Loan and revolving credit facility. The new RCF, which is unsecured, has total commitments of £400m and a termination date of June 2023.
Interest on the new RCF is charged at LIBOR plus a margin of between 1.2% and 2.1% depending on the consolidated leverage of Auto Trader Group plc. A commitment fee of 35% of the margin applicable to the new RCF is payable quarterly in arrears on unutilised amounts of the new RCF. There is no requirement to settle all, or part, of the debt earlier than the termination date.
The exposure of the Group’s borrowings (excluding debt issue costs) to LIBOR rate changes and the contractual repricing dates at the balance sheet date are as follows:
2018£m
2017£m
One month or less 343.0 363.0
Total 343.0 363.0
18. Provisions for other liabilities and charges
Onerous lease and dilapidations provision
£m
Holiday pay provision
£mTotal
£m
At 31 March 2017 1.1 0.3 1.4
Charged to the income statement 0.1 0.3 0.4
Utilised in the year (0.1) (0.3) (0.4)
At 31 March 2018 1.1 0.3 1.4
2018£m
2017£m
Current 0.3 0.3
Non-current 1.1 1.1
Total 1.4 1.4
The onerous lease provision was provided for future payments under property leases in respect of unoccupied properties no longer suitable for the Group’s use. This has been fully utilised in the current year.
Dilapidations have been provided for all UK and Ireland properties based on the estimate of costs upon exit of the leases, which expire between April 2025 and February 2029.
The holiday pay provision relates to liabilities for holiday pay in relation to the UK and Ireland operations for leave days accrued and not yet taken at the end of the financial year, and is expected to be fully utilised in the year to 31 March 2019.
Strategic report / Governance / Financial statements
113Auto Trader Group plc Annual Report and Financial Statements 2018

Notes to the consolidated financial statements continued
19. Deferred taxationThe movement in deferred taxation assets and liabilities during the year, without taking into consideration the offsetting of balances within the same tax jurisdiction, is as follows:
Deferred taxation assets
Share-based payments
£m
Accelerated capital
allowances£m
Other temporary
differences£m
Total£m
At 31 March 2016 0.4 3.9 – 4.3Credited/(charged) to the income statement 0.4 (0.1) – 0.3Credited directly to equity 0.1 – – 0.1At 31 March 2017 0.9 3.8 – 4.7Credited to the income statement 0.2 0.1 – 0.3Credited directly to equity 0.1 – – 0.1At 31 March 2018 1.2 3.9 – 5.1
Deferred taxation liabilities
Share-basedpayments
£m
Acceleratedcapital
allowances £m
Other temporary
differences£m
Total£m
At 31 March 2016 – – 0.3 0.3Credited to the income statement – – (0.1) (0.1)At 31 March 2017 – – 0.2 0.2Acquired in business combination – – 0.7 0.7Credited to the income statement – – (0.2) (0.2)At 31 March 2018 – – 0.7 0.7
The Group has estimated that £0.8m (2017: £nil) of the Group’s net deferred income tax asset will be realised in the next 12 months. This is management’s current best estimate and may not reflect the actual outcome in the next 12 months.
20. Retirement benefit obligationsAcross the UK and Ireland the Group operates several pension schemes. All except one are defined contribution schemes. Within the UK, all pension schemes set up prior to 2001 have been closed to new members and only one defined contribution scheme is now open to new employees.
In the year to 31 March 2018 the pension contributions to the Group defined contribution scheme amounted to £1.9m (2017: £1.9m). At 31 March 2018, there were £0.3m (31 March 2017: £0.3m) of pension contributions outstanding relating to the Group’s defined contribution scheme.
The defined benefit pension scheme provides benefits based on final pensionable pay and this scheme was closed to new joiners with effect from May 2002. New employees after that date have been offered membership of the Group’s defined contribution scheme.
The most recent actuarial valuation of the defined benefit obligations was performed as at 31 March 2018 by a qualified independent actuary.
The amounts recognised in the balance sheet are determined as follows:
2018£m
2017£m
Present value of funded obligations 19.7 21.0
Fair value of plan assets (21.0) (21.4)
Effect of surplus cap 1.3 0.4
Net liability recognised in the balance sheet – –
The surplus of £1.3m (2017: £0.4m) has not been recognised as an asset as it is not deemed to be recoverable by the Group.
114 Auto Trader Group plc Annual Report and Financial Statements 2018

The net retirement benefit income before taxation recognised in the income statement in respect of the defined benefit schemes is summarised as follows:
2018£m
2017£m
Interest income on net defined benefit obligation – –
Administration expenses paid by the scheme – –
Net retirement benefit income before taxation – –
The amounts recognised in the statement of other comprehensive income are as follows:
2018£m
2017£m
Remeasurement gains/(losses) recognised in the year (before tax) 0.9 (0.5)
Effect of surplus cap (0.9) 0.5
Total – –
The movement in the defined benefit obligations over the year is as follows:
Present value of obligation
£m
Fair value of plan assets
£mTotal
£m
At 31 March 2016 17.5 (17.5) –
Interest expense/(income) 0.6 (0.6) –
Remeasurements:
Loss from changes in financial assumptions 3.9 – 3.9Gains arising from experience (0.2) – (0.2)Return on plan assets, excluding amounts included in interest income – (3.2) (3.2)
Benefits paid (0.8) 0.8 –Effect of surplus cap – (0.5) (0.5)At 31 March 2017 21.0 (21.0) –
Interest expense/(income) 0.5 (0.5) –
Remeasurements:
Gain from changes in financial assumptions (0.9) – (0.9)Loss arising from experience 0.1 – 0.1
Other:
Contributions paid by the employer – (0.1) (0.1)Benefits paid (1.0) 1.0 –Effect of surplus cap – 0.9 0.9At 31 March 2018 19.7 (19.7) –
The Company has agreed to contribute £70,000 per annum to the scheme with effect from 1 October 2016 for a period of three years. During the year to 31 March 2018, the Group contributed £70,000 to the scheme (2017: £29,165).
As at 31 March 2018, approximately 65% of the liabilities (2017: 65%) are attributable to former employees who have yet to reach retirement and 35% to current pensioners (2017: 35%).
Strategic report / Governance / Financial statements
115Auto Trader Group plc Annual Report and Financial Statements 2018

Notes to the consolidated financial statements continued
20. Retirement benefit obligations continued
The significant actuarial assumptions were as follows:
2018%
2017%
Discount rate 2.60 2.60
Pension growth rate 2.25 2.35
Inflation rate (‘RPI’) 3.35 3.45
Sensitivity to key assumptions has not been disclosed as any reasonable possible changes would not result in a significant change to the amounts recorded in the financial statements.
The Group has assumed that mortality will be in line with nationally published mortality table S2NA with CMI 2017 projections related to members’ years of birth with long-term rate of improvement of 1.5% per annum. These tables translate into an average life expectancy for a pensioner retiring at age 65 as follows:
2018 2017
MenYears
WomenYears
MenYears
WomenYears
Member aged 65 (current life expectancy) 87 89 88 90
Member aged 45 (life expectancy at age 65) 89 91 90 92
Plan assets are comprised as follows:
2018 2017
£m % £m %
Equities 11.4 54.3 12.0 56.1
Corporate bonds 8.5 40.5 8.3 38.8
Real estate 1.1 5.2 1.1 5.1
Total 21.0 100.0 21.4 100.0
All plan assets have a quoted market price.
This defined benefit pension scheme exposes the Group to a number of risks, the most significant of which are:
Asset volatilityThe scheme liabilities are calculated using a discount rate set with reference to corporate bond yields; if assets underperform this yield, this will create a deficit. The scheme holds a significant proportion of equities, which are expected to outperform corporate bonds in the long term while creating volatility and risk in the short term. The allocation to equities is monitored to ensure it remains appropriate given the scheme’s long-term objectives.
Changes in bond yieldsA decrease in corporate bond yields will increase the scheme liabilities, although this will be partially offset by an increase in the value of the scheme’s bond holdings.
Inflation riskA proportion of the scheme’s benefit obligations are linked to inflation and higher inflation will lead to higher liabilities (although in most cases caps on the level of inflationary increases are in place to protect against extreme inflation). The majority of the assets are either unaffected by or only loosely correlated with inflation, meaning that an increase in inflation will also increase the deficit.
Life expectancyThe majority of the scheme’s obligations are to provide benefits for the life of the member, so increases in life expectancy will result in an increase in the liabilities.
The weighted average duration of the defined benefit obligation is 22 years.
116 Auto Trader Group plc Annual Report and Financial Statements 2018

21. Share capital
2018 2017
Share capitalNumber
’000Amount
£mNumber
’000Amount
£m
Allotted, called-up and fully paid ordinary shares of 1p eachAt 1 April 978,971 9.8 1,001,052 10.0
Purchase and cancellation of own shares (26,810) (0.3) (22,081) (0.2)
Total 952,161 9.5 978,971 9.8
In the year ended 31 March 2017, the Company commenced a share buyback programme. By resolutions passed at the 2017 AGM, the Company was authorised to make market purchases of up to 97,476,919 of its ordinary shares, subject to minimum and maximum price restrictions.
A total of 26,809,702 ordinary shares of £0.01 were purchased in the year (2017: 26,292,510). The average price paid per share was 358.5p (2017: 387.9p), with a total consideration paid (inclusive of all costs) of £96.7m (2017: £102.6m).
No shares were purchased to be held in treasury (2017: 4,211,957).
Included within shares in issue at 31 March 2018 are 932,761 (2017: 948,924) shares held by the ESOT and 4,194,989 (2017: 4,203,277) shares held in treasury, as detailed in note 22.
22. Own shares held
Own shares held – £m
ESOT shares reserve
£m
Treasury shares
£mTotal
£m
Own shares held as at 1 April 2016 (1.5) – (1.5)
Transfer of shares from ESOT 0.1 – 0.1
Repurchase of own shares for treasury – (15.5) (15.5)
Own shares held as at 31 March 2017 (1.4) (15.5) (16.9)
Own shares held as at 1 April 2017 (1.4) (15.5) (16.9)
Own shares held as at 31 March 2018 (1.4) (15.5) (16.9)
Own shares held – number
ESOT shares reserve
Number of shares
Treasuryshares
Number of shares
Totalnumber of
own shares held
Own shares held as at 1 April 2016 1,021,224 – 1,021,224
Transfer of shares from ESOT (72,300) – (72,300)
Shares purchased for treasury – 4,211,957 4,211,957
Share-based incentives exercised in the year – (8,680) (8,680)
Own shares held as at 31 March 2017 948,924 4,203,277 5,152,201
Own shares held as at 1 April 2017 948,924 4,203,277 5,152,201
Transfer of shares from ESOT (16,163) – (16,163)
Share-based incentives exercised in the year – (8,288) (8,288)
Own shares held as at 31 March 2018 932,761 4,194,989 5,127,750
Strategic report / Governance / Financial statements
117Auto Trader Group plc Annual Report and Financial Statements 2018

Notes to the consolidated financial statements continued
23. DividendsDividends declared and paid by the Company were as follows:
2018 2017
Penceper share £m
Penceper share £m
2016 final dividend paid – – 1.0 9.9
2017 interim dividend paid – – 1.7 16.7
2017 final dividend paid 3.5 34.0 – –
2018 interim dividend paid 1.9 18.2 – –
5.4 52.2 2.7 26.6
The proposed final dividend for the year ended 31 March 2018 of 4.0p per share, totalling £37.9m, is subject to approval by shareholders at the Annual General Meeting (‘AGM’) and hence has not been included as a liability in the financial statements.
The 2018 interim dividend paid on 26 January 2018 was £18.2m, being a difference of £0.1m compared to that reported in the 2017 half year results. This was due to a decrease in the ordinary shares entitled to a dividend between the date that the dividend was declared on 9 November 2017 and the dividend record date of 5 January 2018.
The 2017 final dividend paid on 29 September 2017 was £34.0m, being a difference of £0.1m compared to that reported in the 2017 Annual Report. This was due to a decrease in the ordinary shares entitled to a dividend between the date that the dividend was proposed on 8 June 2017 and the final dividend record date of 1 September 2017.
The Directors’ policy with regard to future dividends is set out in the Strategic report on page 31.
24. Cash generated from operations
2018£m
2017£m
Profit before taxation 210.8 193.4
Adjustments for:
Depreciation 3.0 3.2
Amortisation 4.1 4.8
Share-based payments charge (excluding associated NI) 3.3 4.0
Finance costs 9.8 9.7
Changes in working capital (excluding the effects of exchange differences on consolidation):
Trade and other receivables (3.5) 0.7
Trade and other payables (1.5) (2.3)
Provisions 0.1 (0.6)
Cash generated from operations 226.1 212.9
118 Auto Trader Group plc Annual Report and Financial Statements 2018

25. Share-based paymentsThe Group currently operates four share schemes: the Performance Share Plan, Deferred Annual Bonus Plan, Share Incentive Plan and the Sharesave scheme.
All share-based incentives are subject to a service condition. Such conditions are not taken into account in the fair value of the service received. The fair value of services received in return for share-based incentives is measured by reference to the fair value of share-based incentives granted. The estimate of the fair value of the share-based incentives is measured using either the Monte Carlo or Black-Scholes pricing model as is most appropriate for each scheme.
The total charge in the year relating to the four schemes was £3.7m (2017: £4.5m) with a Company charge of £1.0m (2017: £1.5m). This included associated national insurance (‘NI’) at 13.8%, which management expects to be the prevailing rate when the awards are exercised, and apprenticeship levy at 0.5%, based on the share price at the reporting date.
Group Company
2018 £m
2017 £m
2018 £m
2017 £m
Share Incentive Plan (‘SIP’) 0.8 0.8 – –
Sharesave scheme (‘SAYE’) 0.3 0.3 – –
Performance Share Plan (‘PSP’) 1.8 2.4 0.7 1.0
Deferred Annual Bonus Plan (‘DABP’) 0.4 0.5 0.2 0.3
Total share-based payment charge 3.3 4.0 0.9 1.3
NI and apprenticeship levy on applicable schemes 0.4 0.5 0.1 0.2
Total charge 3.7 4.5 1.0 1.5
Share Incentive PlanIn 2015, the Group established a Share Incentive Plan (‘SIP’). All eligible employees were awarded free shares (or nil-cost options in the case of employees in Ireland) valued at £3,600 each based on the share price at the time of the Company’s admission to the Stock Exchange in March 2015, subject to a three-year service period (‘Vesting Period’). The SIP shareholders are entitled to dividends over the Vesting Period. There are no performance conditions applicable to the vesting of SIP shares. The fair value of the SIP awards at the grant date was measured to be £2.72 using the Black-Scholes model. The resulting share-based payments charge is being spread evenly over the Vesting Period.
UK SIP
2018Number
2017Number
Outstanding at 1 April 776,045 913,917
Dividend shares awarded 9,778 6,139
Forfeited (75,986) (69,589)
Released (19,046) (74,422)
Outstanding at 31 March 690,791 776,045
Vested and outstanding at 31 March – –
Irish SIP
2018Number
2017Number
Outstanding at 1 April 44,431 45,491
Dividend shares awarded 788 –
Forfeited (7,950) (1,060)
Released (1,347) –
Outstanding at 31 March 35,922 44,431
Vested and outstanding at 31 March – –
The weighted average market value per ordinary share for SIP awards released in 2018 was 372.01p (2017: 387.14p).
The SIP shares outstanding at 31 March 2018 have a weighted average remaining vesting period of 0.1 years (2017: 1.1 years).
Shares released relate to those attributable to good leavers as defined by the scheme rules.
Strategic report / Governance / Financial statements
119Auto Trader Group plc Annual Report and Financial Statements 2018
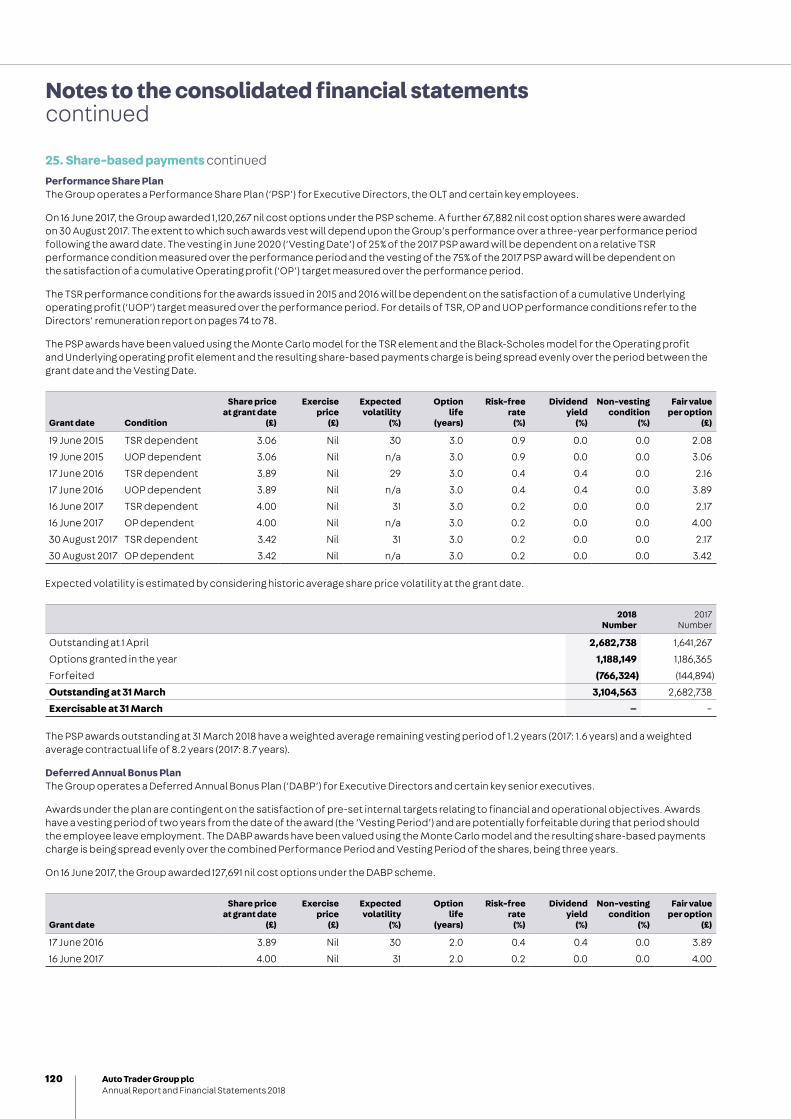
Notes to the consolidated financial statements continued
25. Share-based payments continued
Performance Share PlanThe Group operates a Performance Share Plan (‘PSP’) for Executive Directors, the OLT and certain key employees.
On 16 June 2017, the Group awarded 1,120,267 nil cost options under the PSP scheme. A further 67,882 nil cost option shares were awarded on 30 August 2017. The extent to which such awards vest will depend upon the Group’s performance over a three-year performance period following the award date. The vesting in June 2020 (‘Vesting Date’) of 25% of the 2017 PSP award will be dependent on a relative TSR performance condition measured over the performance period and the vesting of the 75% of the 2017 PSP award will be dependent on the satisfaction of a cumulative Operating profit (‘OP’) target measured over the performance period.
The TSR performance conditions for the awards issued in 2015 and 2016 will be dependent on the satisfaction of a cumulative Underlying operating profit (‘UOP’) target measured over the performance period. For details of TSR, OP and UOP performance conditions refer to the Directors’ remuneration report on pages 74 to 78.
The PSP awards have been valued using the Monte Carlo model for the TSR element and the Black-Scholes model for the Operating profit and Underlying operating profit element and the resulting share-based payments charge is being spread evenly over the period between the grant date and the Vesting Date.
Grant date Condition
Share price at grant date
(£)
Exerciseprice
(£)
Expected volatility
(%)
Option life
(years)
Risk-free rate
(%)
Dividend yield
(%)
Non-vesting condition
(%)
Fair value per option
(£)
19 June 2015 TSR dependent 3.06 Nil 30 3.0 0.9 0.0 0.0 2.08
19 June 2015 UOP dependent 3.06 Nil n/a 3.0 0.9 0.0 0.0 3.06
17 June 2016 TSR dependent 3.89 Nil 29 3.0 0.4 0.4 0.0 2.16
17 June 2016 UOP dependent 3.89 Nil n/a 3.0 0.4 0.4 0.0 3.89
16 June 2017 TSR dependent 4.00 Nil 31 3.0 0.2 0.0 0.0 2.17
16 June 2017 OP dependent 4.00 Nil n/a 3.0 0.2 0.0 0.0 4.00
30 August 2017 TSR dependent 3.42 Nil 31 3.0 0.2 0.0 0.0 2.17
30 August 2017 OP dependent 3.42 Nil n/a 3.0 0.2 0.0 0.0 3.42
Expected volatility is estimated by considering historic average share price volatility at the grant date.
2018Number
2017Number
Outstanding at 1 April 2,682,738 1,641,267
Options granted in the year 1,188,149 1,186,365
Forfeited (766,324) (144,894)
Outstanding at 31 March 3,104,563 2,682,738
Exercisable at 31 March – –
The PSP awards outstanding at 31 March 2018 have a weighted average remaining vesting period of 1.2 years (2017: 1.6 years) and a weighted average contractual life of 8.2 years (2017: 8.7 years).
Deferred Annual Bonus Plan The Group operates a Deferred Annual Bonus Plan (‘DABP’) for Executive Directors and certain key senior executives.
Awards under the plan are contingent on the satisfaction of pre-set internal targets relating to financial and operational objectives. Awards have a vesting period of two years from the date of the award (the ‘Vesting Period’) and are potentially forfeitable during that period should the employee leave employment. The DABP awards have been valued using the Monte Carlo model and the resulting share-based payments charge is being spread evenly over the combined Performance Period and Vesting Period of the shares, being three years.
On 16 June 2017, the Group awarded 127,691 nil cost options under the DABP scheme.
Grant date
Share price at grant date
(£)
Exercise price
(£)
Expected volatility
(%)
Option life
(years)
Risk-free rate
(%)
Dividend yield
(%)
Non-vesting condition
(%)
Fair value per option
(£)
17 June 2016 3.89 Nil 30 2.0 0.4 0.4 0.0 3.89
16 June 2017 4.00 Nil 31 2.0 0.2 0.0 0.0 4.00
120 Auto Trader Group plc Annual Report and Financial Statements 2018

Expected volatility is estimated by considering historic average share price volatility at the grant date.
2018Number
2017Number
Outstanding at 1 April 248,263 –
Options granted in the year 127,691 248,263
Dividend shares awarded 1,306 –
Options forfeited in the year (73,380) –
Outstanding at 31 March 303,880 248,263
Exercisable at 31 March 74,686 –
The DABP awards outstanding at 31 March 2018 have a weighted average remaining vesting period of 1.2 years (2017: 2.2 years) and a weighted average contractual life of 8.6 years (2017: 9.2 years).
The charge for the year includes an estimate of the awards to be granted after the balance sheet date in respect of achievement of 2018 targets.
Sharesave schemeThe Group operates a Sharesave (‘SAYE’) scheme for all employees under which employees are granted an option to purchase ordinary shares in the Company at up to 20% less than the market price at invitation, in three years’ time, dependent on their entering into a contract to make monthly contributions into a savings account over the relevant period. Options are granted and are linked to a savings contract with a term of three years. These funds are used to fund the option exercise. No performance criteria are applied to the exercise of Sharesave options. The assumptions used in the measurement of the fair value at grant date of the Sharesave plan are as follows:
Share price at grant date
(£)
Exercise price
(£)
Expected volatility
(%)
Option life
(years)
Risk-free rate
(%)
Dividend yield
(%)
Non-vesting condition
(%)
Fair value per option
(£)
25 September 2015 3.28 2.64 30 3.0 1.0 0.0 33 0.96
13 December 2017 3.48 2.59 31 3.0 0.6 1.3 14 1.12
Expected volatility is estimated by considering historic average share price volatility at the grant date. The requirement that an employee has to save in order to purchase shares under the Sharesave plan is a non-vesting condition. This feature has been incorporated into the fair value at grant date by applying a discount to the valuation obtained from the Black-Scholes pricing model.
2018 2017
Number of share options
Weighted average exercise price
£Number of
share options
Weighted average exercise price
£
Outstanding at 1 April 919,281 2.64 1,060,225 2.64
Options granted in the year 728,520 2.59 – –
Exercised (6,941) 2.64 (8,680) 2.64
Lapsed (110,008) 2.63 (132,264) 2.64
Outstanding at 31 March 1,530,852 2.61 919,281 2.64
Exercisable at 31 March – – – –
The weighted average market value per ordinary share for Sharesave options exercised in 2018 was 372.52p (2017: 369.51p).
The Sharesave options outstanding at 31 March 2018 have a weighted average remaining vesting period of 1.7 years (2017: 1.7 years) and a weighted average contractual life of 2.2 years (2017: 2.2 years).
Sharesave options exercised relate to those attributable to good leavers as defined by the scheme rules.
Strategic report / Governance / Financial statements
121Auto Trader Group plc Annual Report and Financial Statements 2018

Notes to the consolidated financial statements continued
26. Acquisition of a subsidiaryOn 25 April 2017, Auto Trader Limited, a subsidiary of Auto Trader Group plc, acquired the entire share capital of Motor Trade Delivery Limited (‘MTD’), an online real-time marketplace for the trade delivery of vehicles across the UK. Through the platform, car dealerships and rental companies list ‘jobs’ – vehicles that need moving to another retailer site or a customer – and logistics providers bid for the jobs via a live auction process. This acquisition is an extension of Auto Trader’s overall strategy of using digital technology to improve efficiencies for retailer customers.
The total cash consideration paid of £12.2 million excludes acquisition costs of £0.2 million, £0.1 million of which was recognised as an expense in the year ended 31 March 2017. The remainder has been recognised in the current period within administrative expenses in the consolidated income statement.
The following table provides a reconciliation of the amounts included in the consolidated statement of cash flows:
2018 £m
Cash paid for subsidiary 12.2Less: cash acquired (0.3)Net cash outflow 11.9
From the period from acquisition to 31 March 2018, MTD contributed revenue of £1.1 million, and a loss of £0.5 million (after an amortisation charge of £1.0 million) to the Group’s results.
The purchase has been accounted for as a business combination under the acquisition method in accordance with IFRS 3. The fair value of net assets acquired was assessed and no material adjustments from book value were made to existing assets and liabilities. The following table represents the fair value of the net assets acquired at the date of acquisition:
Fair value£m
Intangible assets recognised on acquisition:Customer relationships 3.2
Non-compete agreement 0.6
Website 0.4
Deferred tax liability arising on intangible assets (0.7)
3.5
Current assetsTrade and other receivables 0.7
Cash and cash equivalents 0.3
1.0
Current liabilities (0.8)
Total net assets acquired 3.7
Goodwill on acquisition 8.5
12.2
Cash consideration 12.2
The goodwill recognised on acquisition relates to value arising from intangible assets that are not separately identifiable under IFRS 3. This represents synergies expected to arise from combining with the existing business of Auto Trader Limited. None of the acquired intangible assets or goodwill is expected to be deductible for tax purposes.
In addition to the goodwill recognised, the customer relationships, non-compete agreement and website obtained through the acquisition met the requirements to be separately identifiable under IFRS 3.
122 Auto Trader Group plc Annual Report and Financial Statements 2018
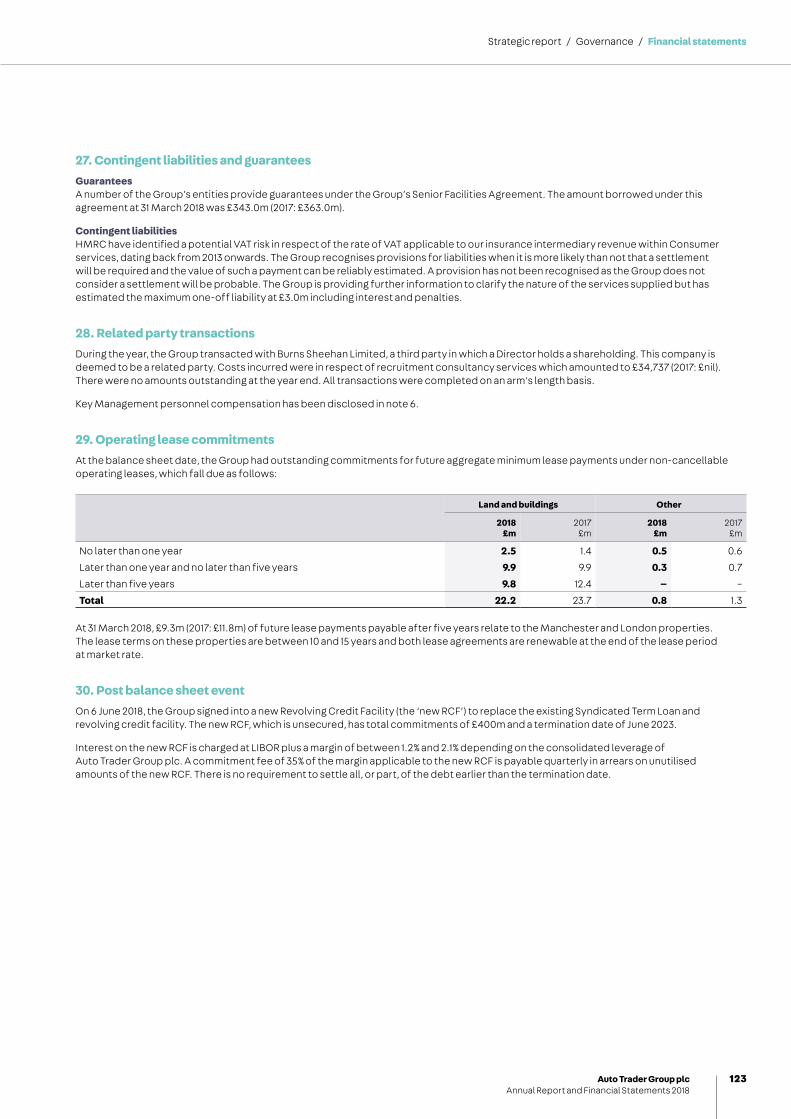
27. Contingent liabilities and guaranteesGuarantees A number of the Group’s entities provide guarantees under the Group’s Senior Facilities Agreement. The amount borrowed under this agreement at 31 March 2018 was £343.0m (2017: £363.0m).
Contingent liabilitiesHMRC have identified a potential VAT risk in respect of the rate of VAT applicable to our insurance intermediary revenue within Consumer services, dating back from 2013 onwards. The Group recognises provisions for liabilities when it is more likely than not that a settlement will be required and the value of such a payment can be reliably estimated. A provision has not been recognised as the Group does not consider a settlement will be probable. The Group is providing further information to clarify the nature of the services supplied but has estimated the maximum one-off liability at £3.0m including interest and penalties.
28. Related party transactionsDuring the year, the Group transacted with Burns Sheehan Limited, a third party in which a Director holds a shareholding. This company is deemed to be a related party. Costs incurred were in respect of recruitment consultancy services which amounted to £34,737 (2017: £nil). There were no amounts outstanding at the year end. All transactions were completed on an arm’s length basis.
Key Management personnel compensation has been disclosed in note 6.
29. Operating lease commitmentsAt the balance sheet date, the Group had outstanding commitments for future aggregate minimum lease payments under non-cancellable operating leases, which fall due as follows:
Land and buildings Other
2018£m
2017£m
2018£m
2017£m
No later than one year 2.5 1.4 0.5 0.6
Later than one year and no later than five years 9.9 9.9 0.3 0.7
Later than five years 9.8 12.4 – –
Total 22.2 23.7 0.8 1.3
At 31 March 2018, £9.3m (2017: £11.8m) of future lease payments payable after five years relate to the Manchester and London properties. The lease terms on these properties are between 10 and 15 years and both lease agreements are renewable at the end of the lease period at market rate.
30. Post balance sheet eventOn 6 June 2018, the Group signed into a new Revolving Credit Facility (the ‘new RCF’) to replace the existing Syndicated Term Loan and revolving credit facility. The new RCF, which is unsecured, has total commitments of £400m and a termination date of June 2023.
Interest on the new RCF is charged at LIBOR plus a margin of between 1.2% and 2.1% depending on the consolidated leverage of Auto Trader Group plc. A commitment fee of 35% of the margin applicable to the new RCF is payable quarterly in arrears on unutilised amounts of the new RCF. There is no requirement to settle all, or part, of the debt earlier than the termination date.
Strategic report / Governance / Financial statements
123Auto Trader Group plc Annual Report and Financial Statements 2018

Note2018
£m2017
£m
Fixed assetsInvestments 3 1,212.9 1,210.5
1,212.9 1,210.5
Current assetsDebtors 4 440.7 420.1
Cash and cash equivalents 5 0.2 –
440.9 420.1
Creditors: amounts falling due within one year 6 (288.4) (118.4)
Net current assets 152.5 301.7
Net assets 1,365.4 1,512.2
Capital and reservesCalled-up share capital 9 9.5 9.8
Own shares held 10 (16.9) (16.9)
Capital redemption reserve 0.5 0.2
Retained earnings 1,372.3 1,519.1
Total equity 1,365.4 1,512.2
The financial statements from pages 124 to 130 were approved by the Board of Directors and authorised for issue.
Nathan CoeDirector7 June 2018
Auto Trader Group plc Registered number 09439967
Company balance sheetAt 31 March 2018
124 Auto Trader Group plc Annual Report and Financial Statements 2018

Company statement of changes in equityFor the year ended 31 March 2018
Share capital
£m
Own shares held
£m
Capital redemption
reserve £m
Retainedearnings
£m
Total equity
£m
Balance at March 2016 10.0 (1.5) – 1,630.8 1,639.3
Loss for the year – – – (1.9) (1.9)Total comprehensive expense, net of tax – – – (1.9) (1.9)
Transactions with owners:Purchase and cancellation of own shares (0.2) – 0.2 (87.1) (87.1)Purchase of treasury shares – (15.5) – – (15.5)Transfer from ESOT – 0.1 – (0.1) –Dividends paid – – – (26.6) (26.6)Share-based payments – – – 4.0 4.0Total transactions with owners recognised directly in equity (0.2) (15.4) 0.2 (109.8) (125.2)
Balance at March 2017 9.8 (16.9) 0.2 1,519.1 1,512.2
Loss for the year – – – (1.4) (1.4)Total comprehensive expense, net of tax – – – (1.4) (1.4)
Transactions with owners:Purchase and cancellation of own shares (0.3) – 0.3 (96.7) (96.7)Dividends paid – – – (52.2) (52.2)Share-based payments – – – 3.3 3.3Deferred tax on share-based payments – – – 0.2 0.2Total transactions with owners recognised directly in equity (0.3) – 0.3 (145.4) (145.4)
Balance at March 2018 9.5 (16.9) 0.5 1,372.3 1,365.4
As at 31 March 2018, the Company had distributable reserves of £1,372.3m (2017: £1,519.1m). When required, the Company can receive dividends from its subsidiaries to further increase distributable reserves.
Strategic report / Governance / Financial statements
125Auto Trader Group plc Annual Report and Financial Statements 2018

Notes to the Company financial statements
1. Accounting policiesAuto Trader Group plc is a public limited company which is listed on the London Stock Exchange and is domiciled and incorporated in the United Kingdom under the Companies Act 2006. The Company was incorporated on 13 February 2015 and adopted FRS 102 from that date.
Statement of compliance and basis of preparationThe Company financial statements of Auto Trader Group plc have been prepared in compliance with United Kingdom Accounting Standards, including Financial Reporting Standard 102 ‘The Financial Reporting Standard applicable in the United Kingdom and the Republic of Ireland’ (‘FRS 102’) and the Companies Act 2006. The Company financial statements have been prepared under the historic cost convention, as modified for the revaluation of certain financial assets and liabilities through profit or loss. The current year financial information presented is at and for the year (365 days) ended 31 March 2018. The comparative financial information presented is at and for the 369-day period ended 31 March 2017. During the year ended 31 March 2017, the Board made the decision to change the period end date to be 31 March every year, to better align with our customers’ needs and to the products and services we offer. As a consequence of the change, the 2017 financial year was four days longer than the current year.
The Directors have used the going concern principle on the basis that the current profitable financial projections and facilities of the consolidated Group will continue in operation for a period not less than 12 months from the date of this report.
The Company financial statements have been prepared in sterling (£), which is the functional and presentational currency of the Company, and have been rounded to the nearest hundred thousand (£0.1m) except where otherwise indicated.
As permitted by Section 408 of the Companies Act 2006, an entity profit and loss account is not included as part of the published consolidated financial statements of Auto Trader Group plc. The loss for the financial period dealt with in the financial statements of the parent Company was £1.4m (2017: loss of £1.9m).
As the Company is included in the consolidated financial statements and is considered to be a qualifying entity under FRS 102 paragraphs 1.8 to 1.12, the following exemptions have been applied:
– no separate parent Company cash flow statement with related notes has been included; and
– Key Management personnel compensation has not been included a second time.
Amounts paid to the Company’s auditors in respect of the statutory audit were £56,650 (2017: £55,000).
Estimation techniquesThe preparation of financial statements in conformity with FRS 102 requires the use of certain critical accounting estimates. It also requires management to exercise their judgement in the process of applying the Company’s accounting policies. The areas involving a higher degree of judgement or complexity, or areas where assumptions and estimates are significant to the financial statements, are:
– share-based payments; and
– carrying value of investments.
Share-based payment arrangements in which the Group receives goods or services as consideration for its own equity instruments are accounted for as equity-settled share-based payment transactions. The accounting policies of such arrangements are disclosed in note 1 of the Group accounts. The fair value of services received in return for share options is calculated with reference to the fair value of the award on the date of grant. Black-Scholes and Monte Carlo models have been used where appropriate to calculate the fair value and the Directors have therefore made estimates with regard to the inputs to that model and the period over which the share award is expected to vest (note 25 of the consolidated Group financial statements).
The Group considers annually whether the carrying value of investments has suffered any impairment in accordance with the accounting policy stated. The recoverable amounts of investments have been determined based on value-in-use calculations, which require the use of estimates.
Investments in subsidiariesInvestments in subsidiaries are held at cost, less any provision for impairment. Annually, the Directors consider whether any events or circumstances have occurred that could indicate that the carrying amount of fixed asset investments may not be recoverable. If such circumstances do exist, a full impairment review is undertaken to establish whether the carrying amount exceeds the higher of net realisable value or value in use. If this is the case, an impairment charge is recorded to reduce the carrying value of the related investment.
Where equity-settled share-based payments are granted to the employees of subsidiary companies, the fair value of the award is treated as a capital contribution by the Company and the investments in subsidiaries are adjusted to reflect this capital contribution.
Share capitalOrdinary shares are classified as equity. Incremental costs directly attributable to the issue of new shares are shown in equity as a deduction from the proceeds.
Where the Group purchases its own equity share capital, the consideration paid is deducted from equity attributable to the Group’s shareholders. Where such shares are subsequently cancelled, the nominal value of the shares repurchased is deducted from share capital and transferred to a capital redemption reserve. Where the Group purchases its own equity share capital to hold in Treasury, the consideration paid for the shares is shown as own shares held within equity.
Shares held by the Employee Share Option TrustShares in the Company held by the Employee Share Option Trust (‘ESOT’) are included in the balance sheet at cost as a deduction from equity.
126 Auto Trader Group plc Annual Report and Financial Statements 2018

TaxationUK corporation tax is provided at amounts expected to be paid or recovered using the tax rates and laws that have been enacted or substantively enacted by the balance sheet date.
Deferred tax is recognised in respect of all timing differences that have originated but not reversed at the balance sheet date, where transactions or events that result in an obligation to pay more tax in the future or a right to pay less tax in the future have occurred on the balance sheet date.
A net deferred tax asset is regarded as recoverable and therefore recognised only when, on the basis of all evidence available, it can be regarded as more likely than not that there will be suitable taxable profits against which to recover carried-forward tax losses and from which the future reversal of underlying timing differences can be deducted.
Deferred tax is measured at the average rates that are expected to apply in the periods in which the timing differences are expected to reverse based on the tax rates and laws that have been enacted or substantively enacted by the balance sheet date. Deferred tax is measured on an undiscounted basis.
Financial instrumentsThe Company has chosen to adopt Sections 11 and 12 of FRS 102 in respect of financial instruments.
a) Financial assetsBasic financial assets, including trade and other receivables, cash and bank balances and investments in commercial paper, are initially recognised at transaction price (unless the arrangement constitutes a financing transaction) and are subsequently carried at amortised cost using the effective interest method.
Financial assets which constitute a financing transaction are measured at the present value of the future receipts discounted at a market rate of interest. Such assets are subsequently carried at fair value and the changes in fair value are recognised in profit or loss, except that investments in equity instruments that are not publicly traded and whose fair values cannot be measured reliably are measured at cost less impairment.
At the end of each reporting period financial assets measured at amortised cost are assessed for objective evidence of impairment. If an asset is impaired the impairment loss is the difference between the carrying amount and the present value of the estimated cash flows discounted at the asset’s original effective interest rate. The impairment loss is recognised in profit or loss.
If there is a decrease in the impairment loss arising from an event occurring after the impairment was recognised, the impairment is reversed. The reversal is such that the current carrying amount does not exceed what the carrying amount would have been had the impairment not previously been recognised. The impairment reversal is recognised in profit or loss.
Financial assets are derecognised when (a) the contractual rights to the cash flows from the asset expire or are settled, or (b) substantially all the risks and rewards of the ownership of the asset are transferred to another party or (c) despite having retained some significant risks and rewards of ownership, control of the asset has been transferred to another party who has the practical ability to unilaterally sell the asset to an unrelated third party without imposing additional restrictions.
b) Financial liabilitiesBasic financial liabilities, including trade and other payables, bank loans, loans from fellow Group companies and preference shares that are classified as debt, are initially recognised at transaction price, unless the arrangement constitutes a financing transaction, where the debt instrument is measured at the present value of the future receipts discounted at a market rate of interest. Debt instruments are subsequently carried at amortised cost, using the effective interest rate method.
Fees paid on the establishment of loan facilities are recognised as transaction costs of the loan to the extent that it is probable that some or all of the facility will be drawn down. In this case, the fee is deferred until the draw-down occurs. To the extent there is no evidence that it is probable that some or all of the facility will be drawn down, the fee is capitalised as a prepayment for liquidity services and amortised over the period of the facility to which it relates.
Trade payables are obligations to pay for goods or services that have been acquired in the ordinary course of business from suppliers. Accounts payable are classified as current liabilities if payment is due within one year or less. If not, they are presented as non-current liabilities. Trade payables are recognised initially at transaction price and subsequently measured at amortised cost using the effective interest method.
Dividend distributionDividends to the Company’s shareholders are recognised as a liability in the Company’s financial statements in the period in which the dividends are approved by the Company’s shareholders in the case of final dividends. In respect of interim dividends, these are recognised once paid.
2. Directors’ emolumentsThe Company has no employees other than the Directors. Full details of the Directors’ remuneration and interests are set out in the Directors’ remuneration report on pages 74 to 78.
Strategic report / Governance / Financial statements
127Auto Trader Group plc Annual Report and Financial Statements 2018
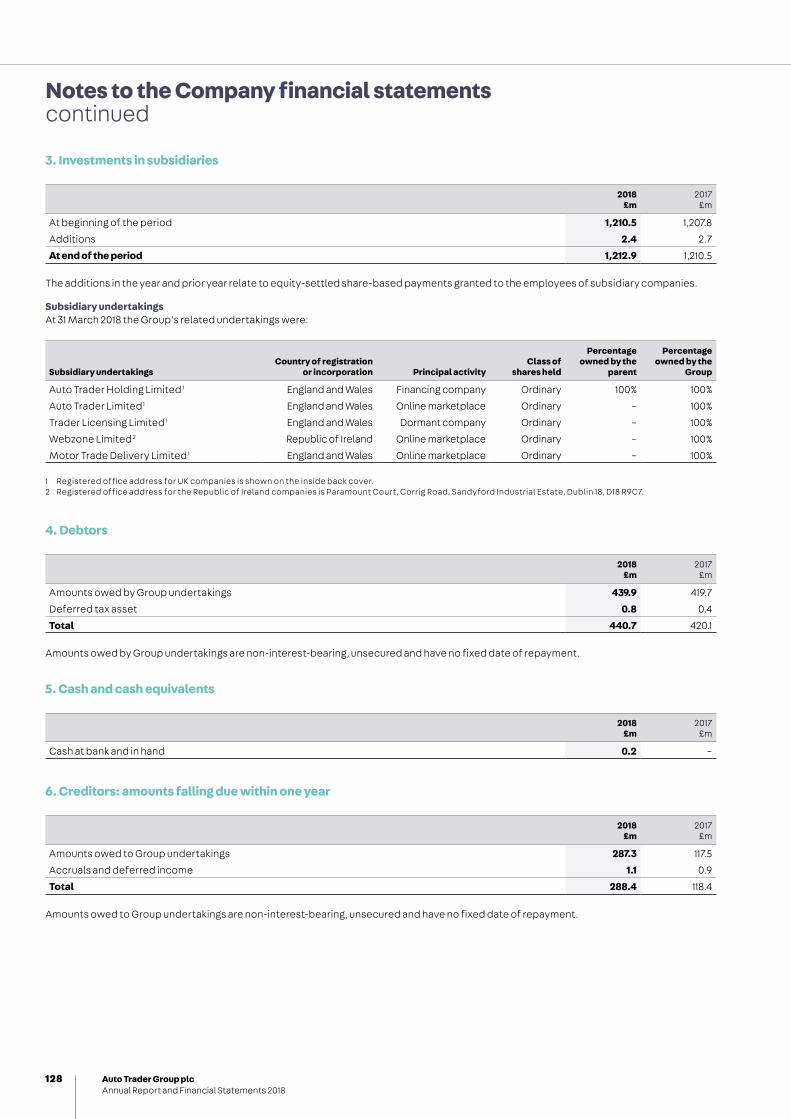
Notes to the Company financial statements continued
3. Investments in subsidiaries
2018£m
2017£m
At beginning of the period 1,210.5 1,207.8
Additions 2.4 2.7
At end of the period 1,212.9 1,210.5
The additions in the year and prior year relate to equity-settled share-based payments granted to the employees of subsidiary companies.
Subsidiary undertakingsAt 31 March 2018 the Group’s related undertakings were:
Subsidiary undertakingsCountry of registration
or incorporation Principal activityClass of
shares held
Percentage owned by the
parent
Percentage owned by the
Group
Auto Trader Holding Limited 1 England and Wales Financing company Ordinary 100% 100%
Auto Trader Limited 1 England and Wales Online marketplace Ordinary – 100%
Trader Licensing Limited 1 England and Wales Dormant company Ordinary – 100%
Webzone Limited 2 Republic of Ireland Online marketplace Ordinary – 100%
Motor Trade Delivery Limited 1 England and Wales Online marketplace Ordinary – 100%
1 Registered office address for UK companies is shown on the inside back cover.2 Registered office address for the Republic of Ireland companies is Paramount Court, Corrig Road, Sandyford Industrial Estate, Dublin 18, D18 R9C7.
4. Debtors
2018£m
2017£m
Amounts owed by Group undertakings 439.9 419.7
Deferred tax asset 0.8 0.4
Total 440.7 420.1
Amounts owed by Group undertakings are non-interest-bearing, unsecured and have no fixed date of repayment.
5. Cash and cash equivalents
2018£m
2017£m
Cash at bank and in hand 0.2 –
6. Creditors: amounts falling due within one year
2018£m
2017£m
Amounts owed to Group undertakings 287.3 117.5
Accruals and deferred income 1.1 0.9
Total 288.4 118.4
Amounts owed to Group undertakings are non-interest-bearing, unsecured and have no fixed date of repayment.
128 Auto Trader Group plc Annual Report and Financial Statements 2018

7. Financial instrumentsFinancial instruments utilised by the Company during the year ended 31 March 2018 and period ended 31 March 2017 may be analysed as follows:
Financial assets2018
£m2017
£m
Financial assets measured at amortised cost 439.9 419.7
Financial liabilities2018
£m2017
£m
Financial liabilities measured at amortised cost 288.4 118.4
Current assets and liabilitiesFinancial instruments included within current assets and liabilities (excluding cash and borrowings) are generally short term in nature and accordingly their fair values approximate to their book values.
8. DividendsDividends declared and paid by the Company were as follows:
2018 2017
Penceper share £m
Penceper share £m
2016 final dividend paid – – 1.0 9.9
2017 interim dividend paid – – 1.7 16.7
2017 final dividend paid 3.5 34.0 – –
2018 interim dividend paid 1.9 18.2 – –
5.4 52.2 2.7 26.6
The proposed final dividend for the year ended 31 March 2018 of 4.0p per share, totalling £37.9m, is subject to approval by shareholders at the Annual General Meeting (‘AGM’) and hence has not been included as a liability in the financial statements.
The 2018 interim dividend paid on 26 January 2018 was £18.2m, being a difference of £0.1m compared to that reported in the 2017 half year results. This was due to a decrease in the ordinary shares entitled to a dividend between the date that the dividend was declared on 9 November 2017 and the dividend record date of 5 January 2018.
The 2017 final dividend paid on 29 September 2017 was £34.0m, being a difference of £0.1m compared to that reported in the 2017 Annual Report. This was due to a decrease in the ordinary shares entitled to a dividend between the date that the dividend was proposed on 8 June 2017 and the final dividend record date of 1 September 2017.
The Directors’ policy with regard to future dividends is set out in the Strategic report on page 31.
9. Called-up share capital
2018 2017
Share capitalNumber
’000Amount
£mNumber
’000Amount
£m
Allotted, called-up and fully paid ordinary shares of 1p eachAt 1 April 978,971 9.8 1,001,052 10.0
Purchase and cancellation of own shares (26,810) (0.3) (22,081) (0.2)
Total 952,161 9.5 978,971 9.8
In the year ended 31 March 2017, the Company commenced a share buyback programme. By resolutions passed at the 2017 AGM, the Company was authorised to make market purchases of up to 97,476, 919 of its ordinary shares, subject to minimum and maximum price restrictions.
A total of 26,809,702 ordinary shares of £0.01 were purchased in the year (2017: 26,292,510). The average price paid per share was 358.5p (2017: 387.9p), with a total consideration paid (inclusive of all costs) of £96.7m (2017: £102.6m).
No shares were purchased to be held in treasury (2017: 4,211,957).
Included within shares in issue at 31 March 2018 are 932,761 (2017: 948,924) shares held by the ESOT and 4,194,989 (2017: 4,203,277) shares held in treasury, as detailed in note 10.
Strategic report / Governance / Financial statements
129Auto Trader Group plc Annual Report and Financial Statements 2018
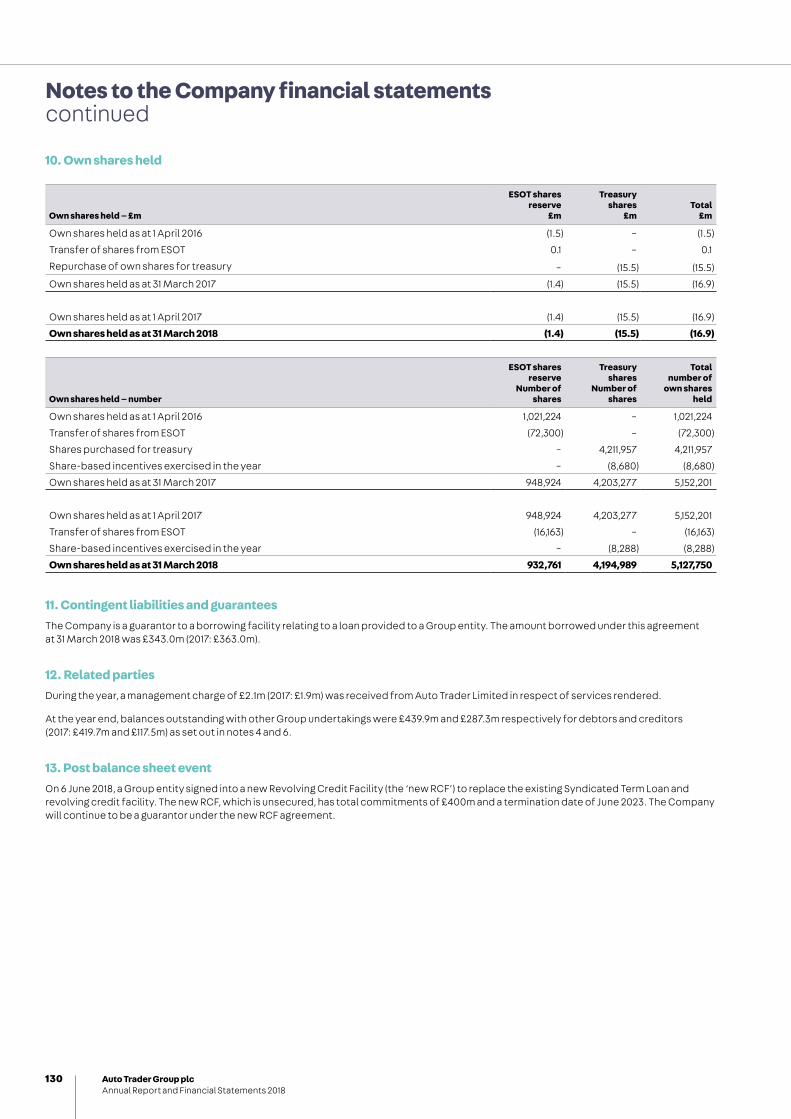
Notes to the Company financial statements continued
10. Own shares held
Own shares held – £m
ESOT shares reserve
£m
Treasury shares
£mTotal
£m
Own shares held as at 1 April 2016 (1.5) – (1.5)
Transfer of shares from ESOT 0.1 – 0.1
Repurchase of own shares for treasury – (15.5) (15.5)
Own shares held as at 31 March 2017 (1.4) (15.5) (16.9)
Own shares held as at 1 April 2017 (1.4) (15.5) (16.9)
Own shares held as at 31 March 2018 (1.4) (15.5) (16.9)
Own shares held – number
ESOT shares reserve
Number of shares
Treasuryshares
Number of shares
Totalnumber of
own shares held
Own shares held as at 1 April 2016 1,021,224 – 1,021,224
Transfer of shares from ESOT (72,300) – (72,300)
Shares purchased for treasury – 4,211,957 4,211,957
Share-based incentives exercised in the year – (8,680) (8,680)
Own shares held as at 31 March 2017 948,924 4,203,277 5,152,201
Own shares held as at 1 April 2017 948,924 4,203,277 5,152,201
Transfer of shares from ESOT (16,163) – (16,163)
Share-based incentives exercised in the year – (8,288) (8,288)
Own shares held as at 31 March 2018 932,761 4,194,989 5,127,750
11. Contingent liabilities and guaranteesThe Company is a guarantor to a borrowing facility relating to a loan provided to a Group entity. The amount borrowed under this agreement at 31 March 2018 was £343.0m (2017: £363.0m).
12. Related partiesDuring the year, a management charge of £2.1m (2017: £1.9m) was received from Auto Trader Limited in respect of services rendered.
At the year end, balances outstanding with other Group undertakings were £439.9m and £287.3m respectively for debtors and creditors (2017: £419.7m and £117.5m) as set out in notes 4 and 6.
13. Post balance sheet eventOn 6 June 2018, a Group entity signed into a new Revolving Credit Facility (the ‘new RCF’) to replace the existing Syndicated Term Loan and revolving credit facility. The new RCF, which is unsecured, has total commitments of £400m and a termination date of June 2023. The Company will continue to be a guarantor under the new RCF agreement.
130 Auto Trader Group plc Annual Report and Financial Statements 2018
Shareholder information
Registered office and headquartersAuto Trader Group plc 4th Floor, 1 Tony Wilson Place Manchester M15 4FN United Kingdom Registered number: 09439967 Tel: +44 (0) 161 669 9888 Web: autotrader.co.uk Web: plc.autotrader.co.uk Investor relations: [email protected]
Company SecretaryClaire Baty
Joint stockbrokersBank of America Merrill Lynch 2 King Edward Street London EC1A 1HQ Numis Securities Limited The London Stock Exchange Building 10 Paternoster Square London EC4M 7LT
Independent auditorsKPMG LLP 1 St. Peter’s Square Manchester M2 3AE
RegistrarLink Asset Services 34 Beckenham Road Beckenham BR3 4TU
Tel UK: +44 (0) 871 664 0300(calls cost 12p per minute plus network extras; lines are open 9.00am to 5.30pm Monday to Friday, excluding public holidays in England and Wales)
Tel international: +44 (0) 371 664 0300(charged at the appropriate international rate)
Web: linkassetservices.com Email: [email protected]
Financial calendar 2018–2019Annual General Meeting 20 September 2018 2019 Half-year results 8 November 2018 2019 Full-year results June 2019
Shareholder enquiriesOur registrars will be pleased to deal with any questions regarding your shareholdings (see contact details in the opposite column). Alternatively, if you have internet access, you can access https://www.autotradershares.co.uk where you can view and manage all aspects of your shareholding securely including electronic communications, account enquiries or amendment to address.
Investor relations websiteThe investor relations section of our website, plc.autotrader.co.uk/investors, provides further information for anyone interested in Auto Trader. In addition to the Annual Report and Financial Statements and share price, Company announcements including the full-year results announcements and associated presentations are also published there.
Cautionary note regarding forward-looking statementsCertain statements made in this Report are forward-looking statements. Such statements are based on current expectations and assumptions and are subject to a number of risks and uncertainties that could cause actual events or results to differ materially from any expected future events or results expressed or implied in these forward-looking statements. They appear in a number of places throughout this
Report and include statements regarding the intentions, beliefs or current expectations of the Directors concerning, amongst other things, the Group’s results of operations, financial condition, liquidity, prospects, growth, strategies and the business. Persons receiving this Report should not place undue reliance on forward-looking statements. Unless otherwise required by applicable law, regulation or accounting standard, Auto Trader Group plc does not undertake to update or revise any forward-looking statements, whether as a result of new information, future developments or otherwise.
Strategic report / Governance / Financial statements
131Auto Trader Group plc Annual Report and Financial Statements 2018

Notes
132 Auto Trader Group plc Annual Report and Financial Statements 2018

This report is printed on GenYous uncoated paper. Manufactured at a mill that is FSC® accredited.
Printed by Principal Colour.
Principal Colour are ISO 14001 certified, Alcohol Free and FSC® Chain of Custody certified.
Designed and produced by SampsonMay Telephone: 020 7403 4099 www.sampsonmay.com

Auto Trader G
roup plc Annual Rep
ort and
Financial Statements 20
18
ManchesterAuto Trader Group plc 4th Floor, 1 Tony Wilson Place Manchester M15 4FN United Kingdom
+44 (0) 161 669 9888
LondonAuto Trader Group plc 3rd Floor, 2 Pancras Square London N1C 4AG United Kingdom
+44 (0) 20 3747 7100
autotrader.co.uk plc.autotrader.co.uk