market analysis report 2017 agency debit memos - iata · pdf file2 adm market analysis notice...
TRANSCRIPT

Market analysis report 2017
Agency Debit Memos

2
ADM Market Analysis
NOTICE
DISCLAIMER. This Agency Debit Memo (ADM) Market Analysis Report (the “Report”) is based on the 2017 ADM survey, for which the International
Air Transport Association (IATA) has granted permission to use and publish the information. No reader should act on the basis of any such
information contained in the Report without taking appropriate professional advice. Although every effort has been made to ensure accuracy, IATA
shall not be held responsible for any loss or damage caused by errors, omissions, misprints or misinterpretation of the contents hereof. Furthermore,
IATA expressly disclaims any and all liability to any person or entity in respect of anything done or omitted, and the consequences of anything done
or omitted, by any such person or entity in reliance on the contents of this Report.
IATA takes sole responsibility for the final form and content of this document, subject to the limitations noted above. The mention of specific
companies or products in this Report does not imply that they are endorsed or recommended by IATA in preference to others of a similar nature
which are not mentioned or advertised.
2017 Agency Debit Memo (ADM) Market Analysis Report © international air transport association. Agency Debit Memo Market Analysis Report©
international air transport association. All Rights Reserved. No part of either publication may be used, reproduced, recast, reformatted or
transmitted in any form by any means, electronic or mechanical, including photocopying, recording or any information storage and retrieval system,
without the prior written permission from:
Senior Vice President
Financial and Distribution Services
International Air Transport Association
33, Route de l'Aeroport
PO Box 416
1215 Geneva - 15 Airport
Switzerland
3
ADM Market Analysis
Contents
01 Introduction
02 Executive Summary
03 Methodology
04 Market Research
Survey Completion Status & Geographic Distribution
05 Market Analysis- Survey results
06 Market Segmentation- Benchmark average research results
07 Key Opportunities & Recommendations
08 Annex
Page 4
Page 5
Page 5
Page 6
Page 8
Page 23
Page 28
Page 29

4
ADM Market Analysis
01 Introduction
Agent Debit Memo (ADM) is the legitimate accounting tool used by
airlines to collect adjustments for STDs issued by Agents. (Reso 850m).
There is a significant matter of contention with regard to ADMs and the
negative impact on the Air transport industry representing a substantial
administrative cost for Airlines, Travel Agents and the broader community
involved in the ticketing distribution chain. Over time, Airlines and Agent
community have expressed their respective concerns to IATA about their
challenges when managing ADMs.
As such, ADMs are an enormous source of friction between business
partners, therefore the Agency Debit Memo Working Group (ADMWG)
involves all industry actors (Airlines, Agents and their Associations, GDSs,
ATPCO, ARC & IATA SMEs) working together in a data-focused and blame-
free environment, where constructive solution-oriented discussions take
place to bring in reduction of the workload required for capturing revenue
leakages, thereby reducing ADM volumes and settlement timeframes, as
well as improving business relationships amongst the industry. The aim
of the Working Group is to improve the inefficiencies in the current
distribution chain, which have been identified through ADM data.
The ADM Management & Reduction Project consists of a set of actions to
categorize the issuances of ADM by formalizing the reporting of Reasons
for Memo issuance and reduce the number of issuances by analyzing the
root causes, through improved controls and training. The goal is to reduce
or eliminate ADMs by fixing problems in the industry supply chain through
the close collaboration of the stakeholders.
In the interest of assisting our members, we have undertaken a market
analysis in order to understand the situation of Airlines and Travel Agents
with respect to ADMs and to be able to offer concrete solutions for their
specific needs. On the other hand, this study aims to provide market
intelligence foundations that will help IATA to formulate a strategy for
promoting the ADMWG best practices more efficiently.
This analysis is built upon a market research of all Airlines and Travel
Agents that are BSP/ASD users around the world.
The report is structured with, first, the executive summary and
methodology of the assessment. This is followed by the market research
with the survey completion status report and geographic distribution. The
market analysis section sets out the research results including an
interpretation of the figures and specific objectives. Lastly, the market
segmentation and the final section includes a summary of the analysis
with the key challenges considered as actions to take.

5
ADM Market Analysis
02 Executive summary: Overall results
We received 54 responses from Airlines (18% response rate) to the
ADM survey; a result that reveals that IATA member Airlines are
not completely engaged with the ADM subject.
Travel Agents, however, corroborate a strong interest with a
number of 968 responses from a total of 31,000 Travel Agent Head
Offices; a high response rate considering the vast market segment
and that regardless the number of Head Offices per company, the
survey policy required only one response per company.
As a preliminary remark, this is the first time that IATA undertakes
a global market research to analyze all of the aspects respecting
ADMs. Despite the fact that this is a sensitive matter for both
Airlines and Agents, the results are quite useful and consistent
with the purpose of the market needs.
Airlines and Agents acknowledge the issues regarding ADMs and
the administration costs involved, although some Airlines were
unable to provide specific data. This suggests that in some cases
the data requested is difficult to obtain.
The 8 key focus areas to work on include:
→ Assist Agents and Airlines to reduce the administration costs
associated to the management of ADMs.
→ Elaborate a solid and effective communication strategy for
promoting the ADM best practices guideline to a global
community of Airlines and Agents.
→ Provide ADM business intelligence tools that are accountable
to the specific purposes of usage that Airlines and Agents
manifested separately.
→ Enhance the BSPLink/ASD communication functionalities in
order to offer a single and effective communication platform
for the parties involved in the ADM process.
→ Standardize a vehicle that helps to facilitate a process in
BSPLink/ASD that easily identifies an auto-priced transaction
and enables the GDS to have a direct dialogue with the Airline
when enabled by Airline.
→ Improve the overall relationship and communication between
the parties involved in the ADM distributing chain.
→ Design a competent and unique Airline ADM information
Central repository in BSP Link/ASD that is easy for Agents to
access.
→ Create an Airline standard dynamic ADM Policy module that is
flexible for Airlines to adopt and that can be easily understood
by Travel Agents and GDSs.
03 Methodology
As we embarked upon the ADM Market Analysis, we aimed to gain
insightful perspectives and market-based data around the topic of ADMs
from IATA members themselves, with a view to have a global
understanding of the ADM management situation. In other words, our
purpose was to capture the reality of the general and specific issues that
affect Airlines and Agents daily when dealing with ADMs.
To that end, the ADM Reduction Project team conducted an online survey
in January 2017 that was distributed to the pertinent Revenue Accounting
departments of 300 Airlines and 31,000 Agent Head Offices that are part
of BSP.

6
ADM Market Analysis
04 Market Research- Survey Completion Status & Geographic Distribution
Airlines
The ADM survey was sent to the Revenue Accounting departments of 300 Airlines and we received 54 responses to the questionnaire, a response rate of
18% that reflects a low engagement.
From a total of 39 countries that participated in the survey, the map highlights the response average distributed by IATA areas from which 20% of
responses were obtained from Area 2, 16% Area 3 and 13% from Area 1.
AREA 1 AREA 2 AREA 3
North
America
South
America
Europe
Africa
Asia
Middle
East
Southwest
Pacific

7
ADM Market Analysis
Travel Agents
The survey was send to around 31,000 Agent Head Offices from which 968 participated in the market research. We consider this a high response rate with
strong involvement taking into account that we addressed a vast market segment and that the survey was sent to all IATA Accredited Head Office
locations including international Agent groups that have more than one Head Office, only one response per company was required. Moreover, the survey
was distributed in English for all markets except China (simplified Chinese), causing language limitations for some French and Spanish speaking countries.
From the 108 countries that participated, the map points out the main countries where most responses came from. The top 4 are Russia and South Africa
(6%), continuing with a 5% presence from Canada, Germany and United Kingdom.

8
ADM Market Analysis
05 Market Analysis- Survey results
Q1- Agents where asked; what is the average administration cost of each ADM in USD? Please take into consideration man power and
external party company fees.
a) What is the average administration cost of each ADM (USD)?
b) Out of these, how much is allocated to external parties (USD)?
0%
5%
10%
15%
20%
25%
30%
35%
40%
45%
0
50
100
150
200
250
300
Responses Percentage
0%
10%
20%
30%
40%
50%
60%
70%
80%
0
50
100
150
200
250
300
350
400
450
Responses Percentage
Cost (USD)
Minimum cost: $0 Maximum cost: $285 Average cost: $46 Minimum cost: $0 Maximum cost: $250 Average cost: $15
Cost (USD)
Responses Responses

9
ADM Market Analysis
In order to showcase the results of 968 Travel Agents, responses were categorized and grouped by cost range (displayed in chart a. and b. in ‘Cost USD’
categories):
a) From the 968 Agents that participated in the survey, 721 provided a valid answer for the administration cost of an ADM for which we applied
the criteria of not taking into consideration responses such as; ‘not available’ or an incorrect answer with a figure that is equal or superior than
300 USD. The results reveal that the average administration cost of each ADM is 46 USD. In the same manner, most of the Agents’ cost do not
exceed the amount of 60 dollars per ADM with 39% paying an admin cost that is in a range between 0 to 20 dollars per ADM, consequently the
quantity drops to 22% whose cost is around 20 to 40 USD and 18% face a cost between 40 to 60 USD.
b) 61% of the Agents who replied the survey were able to specify how much of the administration cost is allocated to external parties. It is
important to remark that nearly all Agents allocate from 0 to 40 dollars to external parties and the average cost is 15 USD.
→ Objectives: The purpose of this study was to benchmark the administrative cost for an ADM versus the average value of ADMs to identify the level
of cost-efficiency for ADM management. In 2016, the global average value of a financial adjustment made through an ADM was USD213.3 per
transaction. For Travel Agents, the management of ADMs appears to be a costly yet unavoidable process to maintain as the cost is over 20% of the
average adjustment value itself.
→ Opportunities: There is significant room for improvement where the cost of ADM administration can be reduced by identifying solutions that will
streamline and simplify the ADM management process.

10
ADM Market Analysis
Q1- Airlines where asked; what is the average administration cost of each ADM in USD? Please take into consideration man power and external
party company fees.
a) What is the average administration cost of each ADM (USD)?
b) Out of these, how much is allocated to external parties (USD)?
0%
10%
20%
30%
40%
50%
60%
0
2
4
6
8
10
12
14
16
18
0-20 20-40 40-60 60-80 80-100 100-120
Responses Percentage
0%
10%
20%
30%
40%
50%
60%
70%
0
2
4
6
8
10
12
14
0-10 11-20 21-30 31-40 41-100
Responses Percentage
Cost (USD)
Cost (USD)
Minimum cost: $0 Maximum cost: $103 Average cost: $26 Minimum cost: $0 Maximum cost: $93 Average cost: $17
Responses
Responses

11
ADM Market Analysis
When asking Airlines the average administration cost of each ADM we were surprised to detect that 34 out of 54 who participated in the study were able
to respond with a direct number. Aside from those airlines that indicated this information cannot be provided, most of them shared; an approximation,
a percentage or stated that ‘it is not easy to obtain each ADM cost’. Nonetheless, for those Airlines that could not provide a direct cost but did mention
an indicative number or percentage, we were able to interpret the data and calculate the cost based on the Airlines ADM data obtained from the BSP
database.
a) Taking a look into the Airlines situation regarding the administration cost of ADMs, we can observe that the overall cost expenditure is lower
constituting over half of the agents cost. The average administration cost of each ADM is 26 USD, furthermore, 50% of the airlines cost is between 0
and 20 dollars per ADM, while a 24% have a cost of 20 to 40 USD.
b) 22 Airlines (41%) from the 54 that replied to the survey indicated the cost that is allocated to external parties. It is worth stressing that the vast
majority designate from 0 to 20 dollars to external parties and the average cost is 17 USD.
→ Objectives: The objective of this question, similarly to the one posed to the Travel Agents, would help the industry identify the cost-efficiency for
ADM Management. Whilst the response rate from Airlines was not strong enough to draw definite conclusions, the usable data indicated that the
administration cost of ADMs for Airlines are approximately 12.2% of an average ADM. During 2016, approximately 45% of global ADMs issued were
of a transaction value of less than 30 USD. Keeping in mind that ADMs are a mechanism to recover for revenue leakage, the cost associated to
administrating such leakages should be kept to a minimal as much as possible.
→ Opportunities: Whilst some Airlines do mitigate partially their cost via including administration fees in ADMs, the most effective way to improve this
cost proportion to the industry would be to consider a lean and efficient revenue auditing system, as well as solving some root causes that may
reduce the need for ADMs, thereby reducing the post-billing recovery workload altogether.
Further in the analysis (Refer to Q- Please indicate the revenue audit process that is used by your airline), it was indicated that the proportion of
Airlines using external auditing parties and in-house auditing systems were very similar, and therefore there was no indication that the
opportunities for cost reduction could come from either completely outsourcing or centrally managing this activity.

12
ADM Market Analysis
Q2- Agents and Airlines where asked; what would be the best way for IATA to promote best practices from the ADMWG to you and your
community?.
Travel Agents
*Respondents had the possibility to choose more than one answer
83% - E-mail
40% - ADMWG Website
39%- Monthly Newsletter
8% - Monthly Conference Calls
6% - Other
Only 8% chose monthly
conference calls; stating
that this is not a preferable
channel. Although, it has
been considered by the
ADMWG team that in some
cases calls are useful when
there is a need of
discussing specific matters.
From the ‘Other’ options
suggested by Agents; the
most popular was BSPLink
with 21%,
Workshops/Webinars with
11%, 10% mentioned
information should be
provided by GDS and 8%
prefer phone in terms of
calls or chats.
The majority of the Travel
Agents consider E-mail as
the best way for IATA to
promote the ADMWG best
practices. This indicates us
that the most effective way
of maintaining this
audience informed is the
use of direct
communication methods
such as e-mails.
40% Prefer the ADMWG
Website to be informed
about best practices. This
figure evidences that the
ADMWG Website is a
valuable source of
information, thus it should
be updated regularly
according to the latest
project updates.
Similar to ADMWG Website
39% of Agents selected the
ADMWG Newsletter, which
confirms that the ADMWG
team should evaluate the
alternative of sending
newsletters to the global
agent community to keep
them informed of the latest
project process, ADM data
and news.
83% 40% 39% 8% 6%

13
ADM Market Analysis
Airlines
*Respondents had the possibility to choose more than one answer
74% - E-mail
62% - Monthly Newsletter
55% - ADMWG Website
15% - Monthly Conference Calls
4% - Other
In the same position as
Agents, Airlines are not so
enthusiastic about having
conference calls for
learning about the best
practices.
Just a few Airlines
suggested ‘Other’ options
like webinars and trainings.
Reassuringly, E-mail is the
best way for IATA to
promote the ADMWG best
practices as it is considered
the first choice both
Airlines and Agents.
A higher number of Airlines
chose the ADMWG
Newsletter, proving again
that it is a competent
communication tool to take
into consideration.
55% said they’d prefer the
Website as a source of
reference. This indicates
that a higher proportion of
Airlines is willing to refer to
the Website when it comes
to best practices.
74% 62% 55% 15% 4%
→ Objectives- According to the study, the most effective communication strategy that the ADM Project team should pursue to promote the best practice
guideline to a global community of Airlines and Agents is the use of direct communication tools such as e-mails and newsletters. However, it is proven
that the ADMWG Website is a highly competitive source of reference especially for the Airlines.
→ Opportunity-
Analyze the possibility of incorporating the ADMWG best practices guideline in BSPLink and examine how to communicate it effectively via e-
mail and newsletter.
Liaise with the IATA training team to study all the ADM areas that are suitable for training development and review the feasibility of offering
new training proposals.

14
ADM Market Analysis
Q3- Agents and Airlines where asked; what is their main source of information for obtaining travel industry news?
68%
42%
28%
21%
21%
12%
8%
5%
3%
0% 10% 20% 30% 40% 50% 60% 70% 80%
Digital Press
Specialized Magazines
Specialized Newspapers
Other sources
Blogs
Social Media(s)
Airlines Travel Agents
It is shown here that Agents and Airlines have a similar ranking of preferences when it comes to their main source of information for obtaining travel
industry news. For both parties Digital Press is the most concurred source, followed by Specialized Magazines and Specialized Newspapers. While
Facebook scores the fourth position, it is clear that it is the most used Social Media source for travel industry news. Nevertheless, ‘Other sources’ also
seem to be significant for which ‘e-mails, newsletters and direct communication’ where mostly mentioned by Agents and ‘Webinars’ by Airlines.
* Social Media(s) refers to other forms of Social Media in markets where the mentioned applications are not available.
→ Objectives- The fact that Airlines and Agents are aligned when choosing their main information source for obtaining travel industry news leads the ADM Project team to focus in the same sources when trying to reach both parties. In future need of publishing relevant news about ADMs that will globally impact the travel industry, these figures determine the most appropriate channels for reaching the target audience efficiently.
84%
54%
36%
20%
14%
12%
12%
6%
0% 20% 40% 60% 80% 100%
Digital Press
Specialized Magazines
Specialized Newspapers
Blogs
Other sources

15
ADM Market Analysis
Q4- Agents and Airlines where asked; If IATA were to provide you with ADM business intelligence tools such as monthly dashboards, what main
purpose would you find for it?
0%
10%
20%
30%
40%
50%
60%
70%
80%
Decreaseoperating
costs
Gain marketintelligence
Identify key trends and patterns in
your organization’s
Identify newopportunities
Benchmarking Return ofInvestment
(ROI)
Other
When asked if IATA were to provide its members with
ADM business intelligence tools, Airlines and Agents
seem to have a different prioritization for the main
purpose of its usage. Whereas a wide range of Agents
(71%) will use the tools for ‘Decreasing operating cost’,
‘Gain market intelligence’ was considered by 40%
followed by ‘Identify key trends and patterns’ with 36%.
Moreover, the Airlines show a quite similar degree of
preferences amongst each of the purposes; 57%
selected ‘Gain market intelligence’ while 55% equally
chose ‘Identify key trends and patterns’, ‘Identify
opportunities’ and ‘Benchmarking’.
→ Objectives- The prevalent purposes lead us to
understand the common areas of significance when
designing ADM business intelligence tools. For
Travel Agents, the strong response rate in
decreasing operating costs are clear indications that
correlate to Q1 where ADM management activities
are more costly to Agents than Airlines.
→ Opportunities- There are strong opportunities for
IATA to support Travel Agents in helping them
identify weaknesses for improvement and thereby
decreasing operating costs; notwithstanding the
opportunities to also provide automation that may
reduce some manual work at the same time.
Therefore Operational tools would appear to be fit
for purpose for Travel Agents rather than Business
Intelligence tools.
On the contrary, the opportunities for Airlines
relate to organizational positioning and
strengthening competitive advantages and Business
Intelligence data would appear valuable for Airlines.
Travel Agents Travel Agents
Airlines
0%
10%
20%
30%
40%
50%
60%
Gain marketintelligence
Identify key trends and patterns in
your organization’s
Identify newopportunities
Benchmarking Decreaseoperating
costs
Return ofInvestment
(ROI)
Other

16
ADM Market Analysis
Q5- Agents and Airlines where asked what is their preferred method of communication with each other?
Agents preferred method of communication with the Airlines Airlines preferred method of communication with Agents
BSPLink/ASD
Other 17%
BSPLink/ASD
Other 12%
79% 86%
57% 75%
On the other hand, the majority of Airlines (79%) also
have a preference to use E-mail when communicating
with the Agents but we can see that BSPLink/ASD is also a
preferable channel by a close majority of 75%. These
figures implicate that BSPLink/ASD is currently considered
a valuable method for the Airlines. From the other
methods; phone calls and GDS’s communication platforms
were mostly mentioned.
A significant amount of Agents prefer E-mail to
communicate with Airlines, whilst more than a half prefer
BSPLink /ASD and 17% mentioned other methods from
which phone calls is the most common.
*Respondents had the possibility to choose more than one method
→ Objectives: For ADM matters the Passenger Agency Conference Resolutions govern the communication channel between agents and airlines to be
BSPLink/ASD. This question reflects how fit for purpose are the tools that IATA is currently providing to the industry. Despite having a Resolution
mandate, the research reflects that the current platforms provided to the industry cannot fully substitute Email usage and Travel Agents and
Airlines are still having to revert to Email communication in addition to essential BSPLink conversations. This contributes to a time and labor
intensive communication process.
→ Opportunity: Improve BSPLink/ASD communication functionalities that would facilitate a more efficient and effective dialogue between the parties
involved in an ADM research process (including the GDS), will encourage a gradual movement to a single communication platform and remove the
requirement for duplication in documentation efforts such as having to attach email communications to ADM comments, or taking discussions
outside of BSPLink/ASD due to character limits and access issues where not all users are authorized to utilize the full BSPLink/ASD functionalities
(not limited to ADMs).
→

17
ADM Market Analysis
Q6- Agents and Airlines where asked what is their preferred method of communication with the GDSs?
Agents preferred method of communication with the GDSs Airlines preferred method of communication with the GDSs
BSPLink/ASD
Other 23%
86%
34%
BSPLink/ASD
Other 13%
85%
32%
Similarly to Agents, 85% of Airlines favor E-mail as the
main communication channel with GDSs and that just 32%
chose BSPLink/ASD.
We found that the same range of 86% of Agents that
selected Email as main communication method with the
Airlines, have the same preference for communicating
with the GDSs. As suspected, this proves again that the
BSPLink /ASD platform is not beneficial for the
communication between agents and GDSs.
*Respondents had the possibility to choose more than one method
→ Objectives: These findings are reassuring that it is necessary to enhance the ADM communication channel in order to facilitate the dialogue
between Agents and Airlines with the GDSs. Certainly, E-mail is the top choice in view of the fact that BSPLink/ ASD has very limited functionalities
to support an easy and fluent communication between parties.
→ Opportunity: Assist the GDSs so that they are capable of supporting their customers through BSPLink accordingly. As a consequence, it will
indirectly encourage airlines and agents to use BSPLink/ASD for communicating with the GDSs.

18
ADM Market Analysis
Q7 & 8 - Airlines were asked:
Does your airline have any agreement with GDSs for recovering ADMs that are related to auto-priced transactions?
In case an ADM is related to auto-priced transactions, would your Airline be willing to engage in direct dialogue with the GDS?
88%
12%
NO
YES
We have discovered that a wide range of the Airlines
segment do not have any agreement with GDSs for
recovering ADMs that are related to auto-priced
transactions. This proves that the most important element
of communication lies between the travel agencies and
their system providers during the research process.
At first glance, Airlines appear to be willing to have direct
dialogue with the GDSs, with 80% saying yes and 20%
claiming they are not interested.
It’s important to highlight that the dialogue between
Airlines and GDSs is currently existing today through e-
mail as demonstrated in question 6 (preferred method of
communication with the GDSs). Thus, the existing
platform of communication is not standardized and to this
effect, our goal is to standardize a vehicle that helps to
facilitate a better interaction within parties through
BSPLink.
79%
21%
Yes
No
→ Objectives: This confirms again that it is primordial to improve the communication channel in BSPLink/ASD as it is shown that most Airlines do agree to
engage in a potential dialogue with the GDSs. Previous to this study, the ADMWG identified the need of implementing a solution to insert the GDSs
comment field into the ADM comment chain in BSPLink/ASD, as well as adding email functionality and additional alerts that would target specific
individuals. Implementation will be effective August 2017.
→ Opportunity: Whilst there is no significant evidence that Airlines are involving the GDSs directly in the financial transaction of the ADM, there is a strong
will for Airlines to liaise directly with the GDS when there is an ADM case that relates to auto-priced transactions.
Distinguishing between manual and automatic transactions today is not a straight forward process and involves individual investigation into each original
transaction. The ability to easily identify an auto-priced transaction and for the GDS to directly be able to engage dialogue with Airlines in these scenarios
would potentially reduce the need for mass issuance of ADMs to Travel Agents (and their individual efforts to investigate each ADM) when there is a
general issue with a certain GDS that could be directly solved with the GDS being informed at an early stage.

19
ADM Market Analysis
Q9- Airlines and Agents were asked to rate the Airline-Agent relationship for ADMs in general on a scale of 1 – 10 with 10 being the most
positive:
Agents Airlines
Rank 1-10 Percentage Frequency
5 22% 190
1 15% 135
2 12% 108
3 11% 95
7 10% 83
4 8% 69
8 8% 68
6 7% 65
9 4% 35
10 3% 24
Rank 1-10 Percentage Frequency
7 27% 14
5 23% 12
8 21% 11
6 17% 9
3 4% 2
10 4% 2
4 2% 1
9 2% 1
1 0% 0
2 0% 0
The Agents average rank is
4.5
The Airlines average rank is
7
Most Agents consider that the relationship with the Airlines when managing ADMs is unsatisfactory given that the average rate is 4.5 and more than a half
(68%) rated it with 5 points or lower. In the contrary, the Airlines perception of the relationship with the Agents is notoriously better and we can
conclude that they are overall satisfied since 71% rated it higher than 5 and the average rate is 7.
→ Objectives: One of the main goals of the ADMWG is to realize solutions that are able to improve the relationship between the parties involved in the
ADM processes and procedures. However, it is important to first understand the particular challenges faced by the Agents in order to develop a set of
actions for reducing the issues that cause friction in the relationship. To this interest, the working group should continue supporting a ‘blame free’
environment where both Agents and Airlines can openly raise their specific concerns and work together to address those in consensus.

20
ADM Market Analysis
Q10- Agents were asked: On a scale of 1 – 10 with 10 being the most positive, how would you rate your communication with the Airlines and
with the GDSs regarding ADMs
Communication with the Airlines regarding ADMs Communication with the GDSs regarding ADMs
Rank 1-10 Percentage Frequency
5 24% 217
1 12% 111
7 12% 111
2 11% 97
3 10% 88
4 9% 77
8 8% 72
6 8% 68
9 4% 32
10 3% 23
Rank 1-10 Percentage Frequency
5 22% 197
7 12% 110
8 11% 97
1 10% 86
2 9% 84
6 9% 80
4 7% 66
9 7% 66
3 7% 63
10 6% 52
→ Certainly, an average rank of 5 implies that the communication between Agents and Airlines is indeed regular. To this effect, 66% of Agents have rated the
communication with 5 or less. In addition, Agents think that the communication with the GDSs regarding ADMs is standard with an average rank of 5.4.
Despite the similar average rank between Agents communication with Airlines and GDSs, it is noteworthy that 67% of Agents ranked the communication
with the GDSs with 5 or higher.
→ Objectives: The first step for enhancing the relationship between the parties involved in the ADM process is to improve the communication by stablishing an
open dialogue flow during the process. These market indicators reinforce that there is ample room for improvement; starting by fostering a philosophy that
encourages data driven actions (leaving emotions and blame aside) as well as encourage Airlines, Agents and GDSs to be partners towards the common goal
of ADM reduction.
Secondly, the ADMWG is implementing a set of solutions (Direct link to access the list of solutions) which in practice have the aim of standardizing global
ADM policies and processes as well as solving the communication deficiencies.
The Average rank is
4 5
The Average rank is
4 5.4

21
ADM Market Analysis
Q11- Agents were asked where would be the best place to dispose a central repository for their Agency to access important information such as
query Airline's ADM policies, commission control setups and credit card acceptances?
84%
38%
13%
BSPLink/ASD IATA Customer Portal Other
It is demonstrated that BSPLink/ASD is the optimum place
to dispose a central repository by some considerable
margin of 84%. As other alternatives for placing the
repository, Agents proposed E-mail as a predominant
solution, followed by the idea to access the information
through the Airlines and GDSs source.
→ Objectives: Design an central repository in BSP Link/ASD with the purpose of assisting the ADM Project to provide a competent and unique source that
is easy for Agents to access, search and have visibility to stable and reliable information. This way we can help our members to spend less resources and
time when in the need of information related to ADMs and its research.

22
ADM Market Analysis
Q12 & 13- Airlines were asked:
Please indicate the revenue audit process that is used by your airline
Please identify the critical information that is in your ADM policy
0%
10%
20%
30%
40%
50%
60%
70%
80%
90%
100%
Conditions forADM issuance
AdministrationFees associated
with ADMissuance
Dispute contacts Conditions ofRevenue Auditing
Other
67%
In-house audit
Nearly the same volume of Airlines utilize ‘External party’
and ‘In-house audit’ as an option for their revenue audit
process. In like manner, 30% of the Airlines use both
internal and external parties at the same time.
67% of Airlines use external outsourcing wherein 4 main
companies seem have the strongest presence in this
market share.
→ Objectives: This question supports the analysis of Q1
for Airlines.
External party
63%
With this question Airlines have identified the critical
information that is in their ADM policies and the results
exhibit that the great majority of 86% took into account
‘Conditions for issuance’ and 62% ‘Administration Fees
associated with ADM issuance’. Furthermore, ‘Dispute
contacts’ and ‘Conditions of Revenue Auditing’ were less
recognized but they also seem to be a valued factor in the
ADM policy.
→ Objectives: There is a planned initiative to create a
dynamic ADM Policy module that would be standard
and caters for needs of all Airline business modes. The
responses to this question provides IATA with
guidance in which areas to focus on to identify
essential elements.
→ The low “skipped answer” rate (7%) and high
commonality to “Conditions for ADM issuance” show
that there is genuine similarities and strong
opportunity for the industry to share a dynamic ADM
Policy module that would at least host the essential
common conditions for each Airline’s ADM Policy,
with dynamic fields that will create flexibility for
Airlines to adopt the module to suit their specific
needs in a format that can be easily understood by
Travel Agents and GDSs.
*Respondents had the possibility to choose all that apply
23
ADM Market Analysis
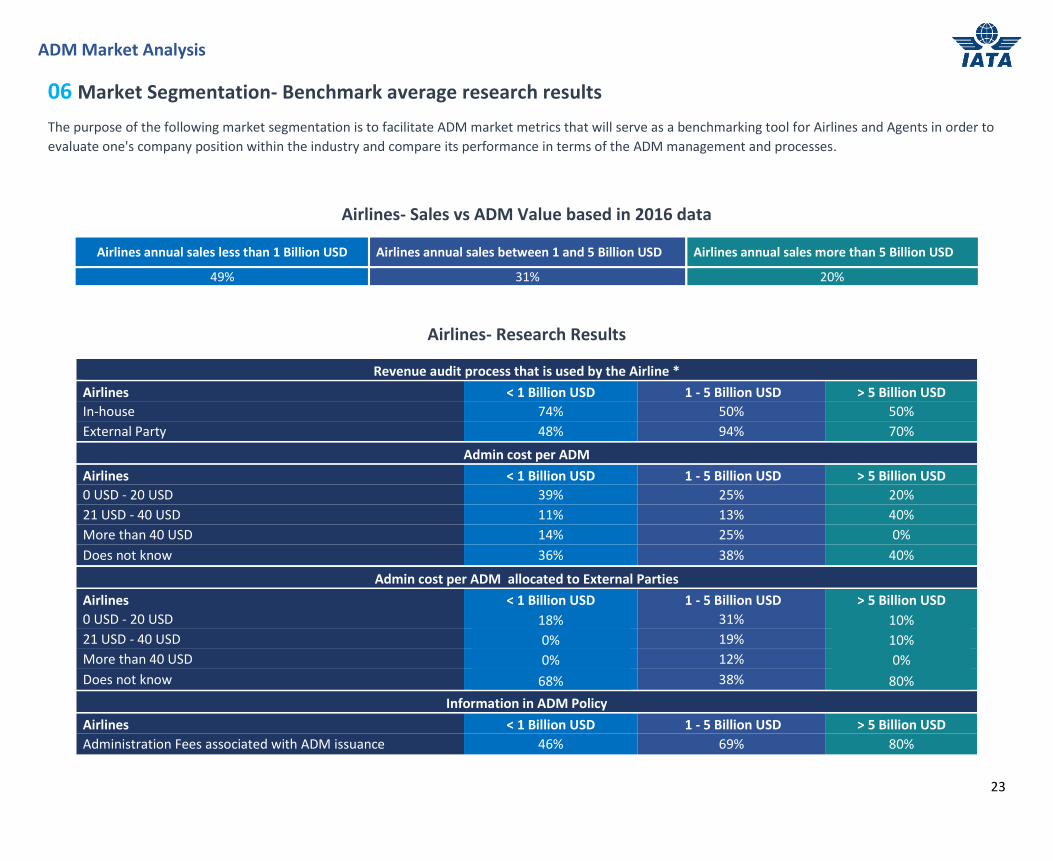
06 Market Segmentation- Benchmark average research results
The purpose of the following market segmentation is to facilitate ADM market metrics that will serve as a benchmarking tool for Airlines and Agents in order to
evaluate one's company position within the industry and compare its performance in terms of the ADM management and processes.
Airlines- Sales vs ADM Value based in 2016 data
Airlines annual sales less than 1 Billion USD Airlines annual sales between 1 and 5 Billion USD Airlines annual sales more than 5 Billion USD
49% 31% 20%
Airlines- Research Results
Revenue audit process that is used by the Airline *
Airlines < 1 Billion USD 1 - 5 Billion USD > 5 Billion USD
In-house 74% 50% 50%
External Party 48% 94% 70%
Admin cost per ADM
Airlines < 1 Billion USD 1 - 5 Billion USD > 5 Billion USD
0 USD - 20 USD 39% 25% 20%
21 USD - 40 USD 11% 13% 40%
More than 40 USD 14% 25% 0%
Does not know 36% 38% 40%
Admin cost per ADM allocated to External Parties
Airlines < 1 Billion USD 1 - 5 Billion USD > 5 Billion USD
0 USD - 20 USD 18% 31% 10%
21 USD - 40 USD 0% 19% 10%
More than 40 USD 0% 12% 0%
Does not know 68% 38% 80%
Information in ADM Policy
Airlines < 1 Billion USD 1 - 5 Billion USD > 5 Billion USD
Administration Fees associated with ADM issuance 46% 69% 80%
24
ADM Market Analysis
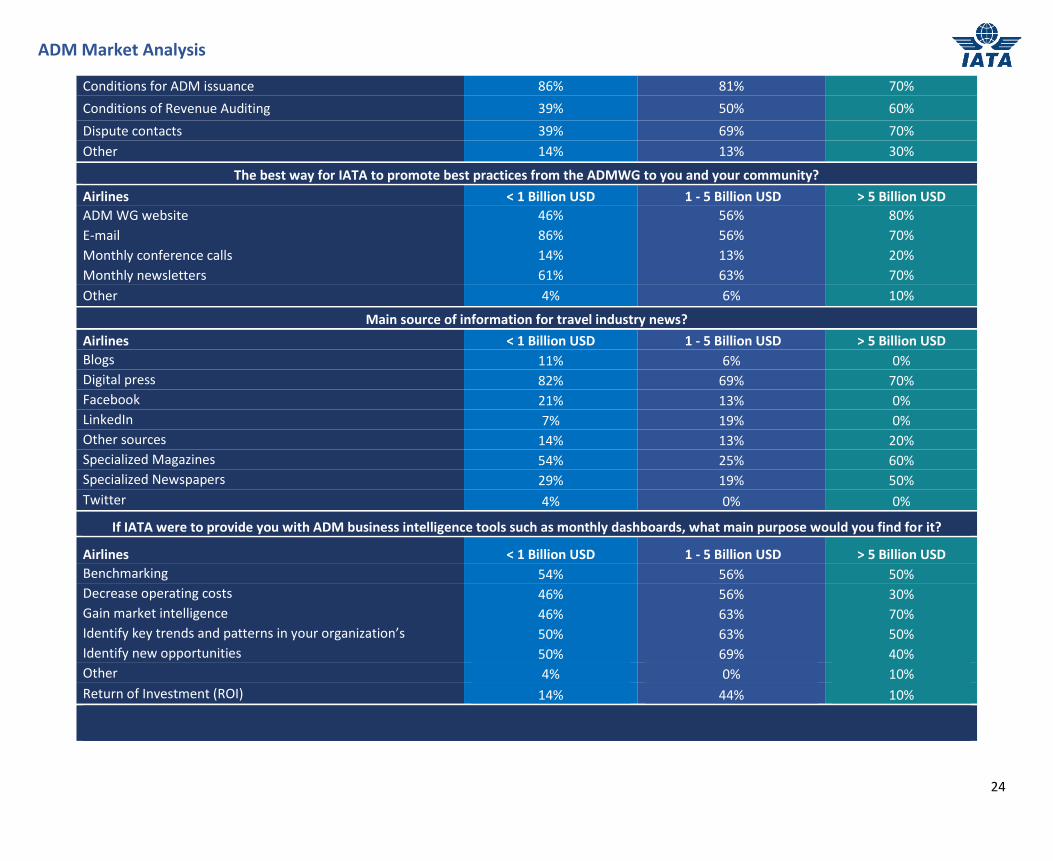
Conditions for ADM issuance 86% 81% 70%
Conditions of Revenue Auditing 39% 50% 60%
Dispute contacts 39% 69% 70%
Other 14% 13% 30%
The best way for IATA to promote best practices from the ADMWG to you and your community?
Airlines < 1 Billion USD 1 - 5 Billion USD > 5 Billion USD
ADM WG website 46% 56% 80%
E-mail 86% 56% 70%
Monthly conference calls 14% 13% 20%
Monthly newsletters 61% 63% 70%
Other 4% 6% 10%
Main source of information for travel industry news?
Airlines < 1 Billion USD 1 - 5 Billion USD > 5 Billion USD
Blogs 11% 6% 0%
Digital press 82% 69% 70%
Facebook 21% 13% 0%
LinkedIn 7% 19% 0%
Other sources 14% 13% 20%
Specialized Magazines 54% 25% 60%
Specialized Newspapers 29% 19% 50%
Twitter 4% 0% 0%
If IATA were to provide you with ADM business intelligence tools such as monthly dashboards, what main purpose would you find for it?
Airlines < 1 Billion USD 1 - 5 Billion USD > 5 Billion USD
Benchmarking 54% 56% 50%
Decrease operating costs 46% 56% 30%
Gain market intelligence 46% 63% 70%
Identify key trends and patterns in your organization’s 50% 63% 50%
Identify new opportunities 50% 69% 40%
Other 4% 0% 10%
Return of Investment (ROI) 14% 44% 10%

25
ADM Market Analysis
Preferred method of communication with the Travel Agents?
Airlines < 1 Billion USD 1 - 5 Billion USD > 5 Billion USD
BSPLink 68% 81% 80%
E-mail 79% 69% 80%
Other 4% 19% 20%
Preferred method of communication with the GDSs?
Airlines < 1 Billion USD 1 - 5 Billion USD > 5 Billion USD
BSPLink 36% 25% 30%
E-mail 82% 88% 90%
Other 18% 6% 20%
Does your airline have any agreement with GDSs for recovering ADMs that are related to auto-priced transactions?
Airlines < 1 Billion USD 1 - 5 Billion USD > 5 Billion USD
No 100% 63% 70%
Yes 0% 25% 20%
In case an ADM is related to auto-priced transactions, would your Airline be willing to engage in direct dialogue with the GDS?
Airlines < 1 Billion USD 1 - 5 Billion USD > 5 Billion USD
No 21% 13% 20%
Yes 71% 75% 70%
Rate the Airline-Agent relationship for ADMs in general
Airlines < 1 Billion USD 1 - 5 Billion USD > 5 Billion USD
Average 6 7 6
Most common answer (mode) 5 6 7
* Note:
- The average numbers in the market size segmentation are approximate as not all of the airlines provided responses to all of the survey questions. - The segmentation is based in a number of 51 surveys from airlines, 2 of the responses submitted were excluded as the airlines did not have any ADMs issued
in 2016, in addition, 1 response was removed as the airline did not have any sales.
- *Airlines might have both internal and external providers for the revenue audit process.

26
ADM Market Analysis
Travel Agents- Market Area
Region
Africa & Middle East
Asia Pacific
Europe
North Asia
The Americas
Total number of responses* 211 148 396 62 139
% 22% 15% 41% 6% 15%
Admin cost per ADM
Average in USD 42.76 48.08 41.43 45.52 59.99
0 USD - 20 USD 23% 26% 23% 27% 14% 21 USD - 40 USD 20% 14% 26% 19% 17%
More than 40 USD 27% 30% 30% 19% 42% Does not know 16% 18% 15% 26% 11%
Admin cost per ADM allocated to External Parties
Average in USD 14.10 15.01 10.54 14.91 19.26
0 USD - 20 USD 41% 43% 48% 34% 39% 21 USD - 40 USD 8% 7% 7% 10% 7% More than 40 USD 5% 7% 6% 8% 13% Does not know 32% 31% 34% 40% 25%
Best way for IATA to promote best practices from the ADMWG
ADMWG Website 36% 39% 36% 60% 46%
E-mail 83% 82% 79% 85% 86%
Monthly Conference Calls 7% 11% 4% 6% 17% Monthly Newsletter 35% 44% 40% 24% 42%
Other 7% 9% 4% 5% 8%
Main source of information for travel industry news
Blogs 9% 14% 9% 21% 19% Digital Press 57% 66% 72% 73% 68% Facebook 23% 32% 16% 10% 22% LinkedIn 6% 10% 8% 5% 9% Other sources 24% 27% 16% 18% 24% Social Media(s)** 0% 0% 0% 44% 0% Specialized Magazines 36% 41% 46% 27% 45% Specialized Newspapers 27% 29% 25% 29% 30%
Twitter 8% 6% 3% 2% 9%

27
ADM Market Analysis
If IATA were to provide you with ADM business intelligence tools such as monthly dashboards, what main purpose would you find for it?
Benchmarking 29% 30% 23% 45% 27% Decrease operating costs 71% 67% 63% 81% 69% Gain market intelligence 48% 41% 33% 60% 37% Identify key trends and patterns in your organization’s 45% 40% 31% 31% 45% Identify new opportunities 34% 36% 32% 31% 41% Other 4% 8% 5% 2% 5%
Return of Investment (ROI) 28% 26% 15% 16% 27%
Preferred method of communication with the Airlines
BSPLink/ASD 60% 59% 55% 44% 58% E-mail 86% 85% 85% 87% 81% Other 16% 17% 14% 32% 20%
Preferred method of communication with the GDSs
BSPLink/ASD 35% 38% 28% 34% 40%
E-mail 89% 85% 84% 82% 80%
Other 16% 22% 24% 31% 27%
Rate of the communication with the Airlines regarding ADMs
Average Most common answer (rate) from every region -> 5
4.3 4.9 4.7 5.5 5.1
Rate of the communication with GDS’s regarding ADMs
Average Most common answer (rate) from every region ->5
5.2 5.5 5.2 6.1 5.7
Rate the Airline-Agent relationship for ADMs in general
Average Most common answer (rate) from every region -> 5
3.9 4.9 4.3 5.3 5.2
Best place to dispose a central repository for important information
BSPLink/ASD 77% 84% 87% 71% 89% IATA Customer Portal 49% 45% 23% 66% 41%
Other 13% 14% 11% 18% 16%
* Note: * Three of the responses were removed from the data as they were provided by IATAN agencies with no representation in any BSP. ** The Social Media (s) option was included only in the survey to the Agents in China since the country has its own independent Social Media platform. The average numbers in the market size segmentation are approximate as not all of the Agencies provided responses to all of the survey questions.

28
ADM Market Analysis
07 Key Opportunities & Recommendations
1. Reduce ADM Management administration cost Travel Agents: Reduce the ADM administration cost by identifying solutions that will streamline and simplify the ADM management process. Airlines: Improve the cost proportion to the industry by considering a lean and efficient revenue auditing system, as well as solving some root causes that may reduce the need for ADMs, thereby reducing the post-billing recovery workload altogether.
2. Communicate effectively Define an effective communication strategy to promote the ADM best practices guideline to a global community of Airlines and Agents based in direct communication tools such as e-mails and newsletters.
3. Diversify Communication Channels When publishing relevant ADMs news that could potentially impact the industry, use the predominant travel news channels (Digital Press, Specialized Magazines and Newspapers & Facebook) to reach the target audience.
4. Elaborate ADM business intelligence tools As for Airlines, design Business Intelligence tools with the view of improving organizational positioning and strengthening competitive advantages. For Travel Agents, provide Operational tools that will help them to decrease operating costs as well as to automate processes that could reduce manual labor.
5. Optimize BSPLink/ASD communication functionalities - Enhance the communication
functionalities in BSPLink/ASD and encourage a gradual movement to a single and effective communication platform between the parties involved in an ADM research process.
- Assist the GDSs so that they are capable of supporting their customers through BSPLink/ASD accordingly.
6. ADMs related to auto-priced transactions: Standardize a vehicle for a better interaction Facilitate a process in BSPLink/ASD that easily identifies an auto-priced transaction and enables the GDSs to engage dialogue directly with Airlines in order to potentially reduce the need for mass issuance of ADMs to Travel Agents.
7. Improve the relationship between the parties involved in the ADM distributing chain Understand the particular challenges faced by Agents and Airlines and mitigate the issues that cause friction in the relationship. Support a ‘blame free’ environment amongst the ADMWG and extend to the whole industry.
8. Enhance the communication deficiencies between Airlines, Agents & GDS - Standardize global ADM policies and
processes. - Stablish an open dialogue flow during the
ADM process and foster a data driven action philosophy.
9. Central repository for BSP information Create a competent and unique source in BSP Link/ASD that is easy for Agents to access, search and have visibility to reliable information.
10. Airline standard dynamic ADM Policy module Host a module with the essential common conditions for each Airline’s ADM Policy in a format that is flexible for Airlines to adopt and that can be easily understood by Travel Agents and GDSs.

29
ADM Market Analysis
08 Annex
Annex A: Survey results
1. Agent’s average administration cost of each ADM.
a) What is the average administration cost of each ADM (USD)?
a) What is the average administration cost of each ADM (USD)? Response
Count Response
Percentage
Answered 812 84%
No Answer/ Not Available 156 16%
Invalid Answer equal or superior than 300 USD 89 9%
Valid Answers used for average 721 74%
b) Out of these, how much is allocated to external parties (USD)?
b) Out of these, how much is allocated to external parties (USD)? Response
Count Response
Percentage
Answered 637 66%
No Answer/ Not Available 331 34%
Invalid Answer equal or superior than 300 USD 49 5%
Valid Answers used for average 588 61%
2. Airline’s average administration cost of each ADM.
a) What is the average administration cost of each ADM (USD)?
a) What is the average administration cost of each ADM (USD)? Response
Count Response
Percentage
Answered 36 67%
No Answer/ Not Available 20 37%
Invalid Answer equal or superior than 300 USD 2 4%
Valid Answers for average 33 61%
30
ADM Market Analysis
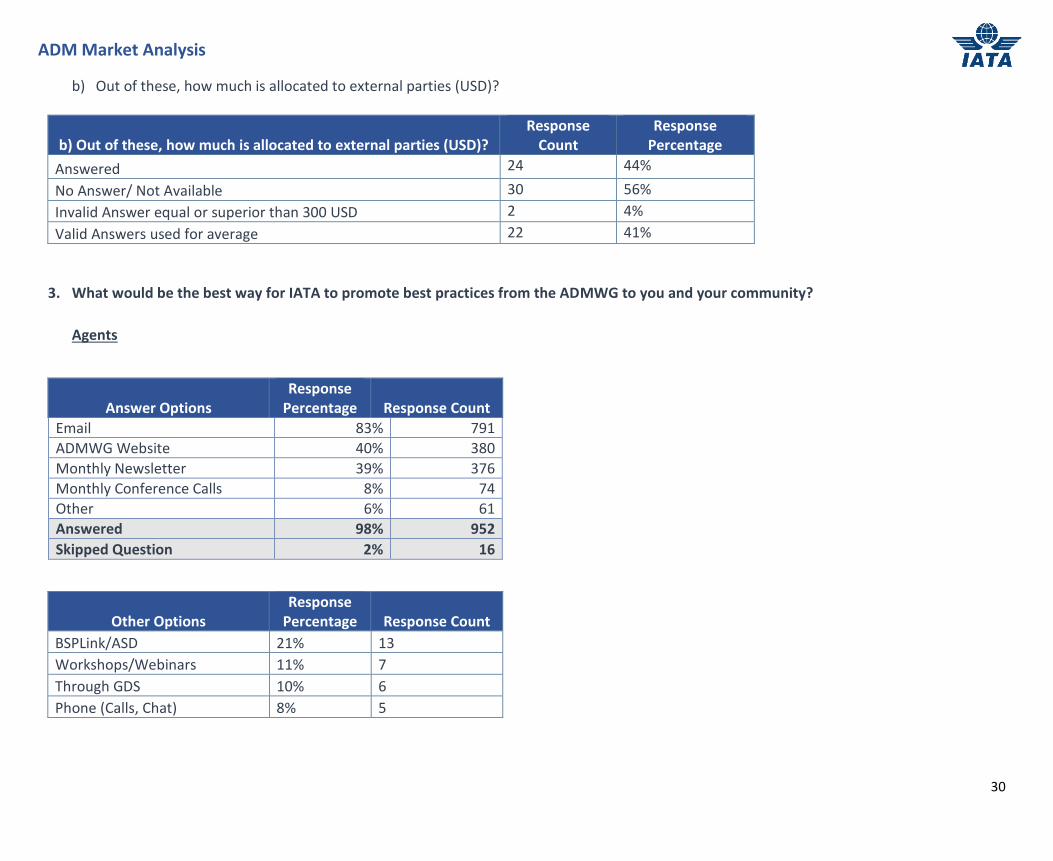
b) Out of these, how much is allocated to external parties (USD)?
b) Out of these, how much is allocated to external parties (USD)? Response
Count Response
Percentage
Answered 24 44%
No Answer/ Not Available 30 56%
Invalid Answer equal or superior than 300 USD 2 4%
Valid Answers used for average 22 41%
3. What would be the best way for IATA to promote best practices from the ADMWG to you and your community?
Agents
Answer Options Response
Percentage Response Count
Email 83% 791
ADMWG Website 40% 380
Monthly Newsletter 39% 376
Monthly Conference Calls 8% 74
Other 6% 61
Answered 98% 952
Skipped Question 2% 16
Other Options Response
Percentage Response Count
BSPLink/ASD 21% 13
Workshops/Webinars 11% 7
Through GDS 10% 6
Phone (Calls, Chat) 8% 5
31
ADM Market Analysis
Airlines
Answer Options Response
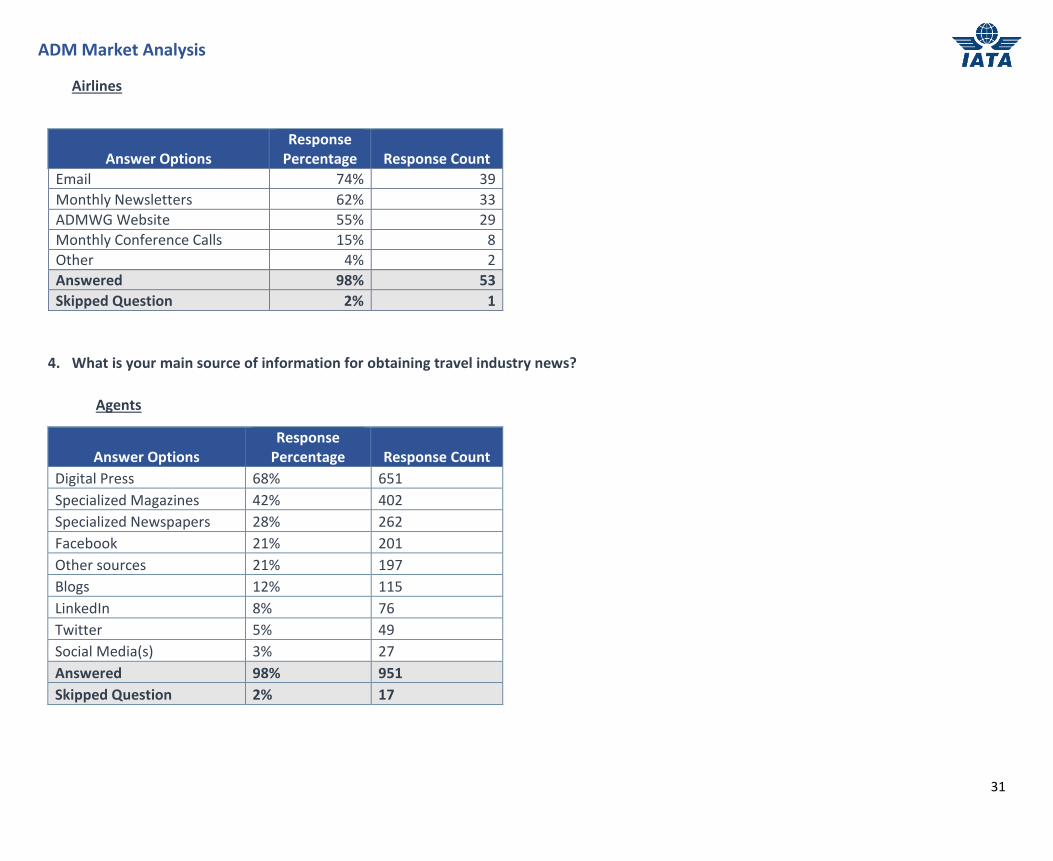
Percentage Response Count
Email 74% 39
Monthly Newsletters 62% 33
ADMWG Website 55% 29
Monthly Conference Calls 15% 8
Other 4% 2
Answered 98% 53
Skipped Question 2% 1
4. What is your main source of information for obtaining travel industry news?
Agents
Answer Options Response
Percentage Response Count
Digital Press 68% 651
Specialized Magazines 42% 402
Specialized Newspapers 28% 262
Facebook 21% 201
Other sources 21% 197
Blogs 12% 115
LinkedIn 8% 76
Twitter 5% 49
Social Media(s) 3% 27
Answered 98% 951
Skipped Question 2% 17

32
ADM Market Analysis
Airlines
Answer Options Response
Percentage Response Count
Digital Press 84% 42
Specialized Magazines 54% 27
Specialized Newspapers 36% 18
Facebook 20% 10
LinkedIn 14% 7
Blogs 12% 6
Other sources 12% 6
Twitter 6% 3
Answered 93% 50
Skipped Question 7% 4
5. If IATA were to provide you with ADM business intelligence tools such as monthly dashboards, what main purpose would you find for it?
Agents
Answer Options Response
Percentage Response
Count
Decrease operating costs 71% 653
Gain market intelligence 42% 386
Identify key trends and patterns in your organization’s 40% 365
Identify new opportunities 36% 331
Benchmarking 29% 267
Return of Investment (ROI) 22% 205
Other 5% 47
Answered 95% 916
Skipped Question 5% 52

33
ADM Market Analysis
Airlines
Answer Options Response
Percentage Response
Count
Gain market intelligence 57% 29
Identify key trends and patterns in your organization’s 55% 28
Identify new opportunities 55% 28
Benchmarking 55% 28
Decrease operating costs 47% 24
Return of Investment (ROI) 24% 12
Other 4% 2
Answered 94% 51
Skipped Question 6% 3
6. Agents and Airlines where asked; what is their preferred method of communication with each other?
Agents preferred method of communication with the Airlines
Answer Options Response
Percentage Response
Count
Email 86% 821
BSPLink/ASD 57% 546
Other 17% 163
Answered 99% 956
Skipped Question 1% 12

34
ADM Market Analysis
Airlines preferred method of communication with Agents
Answer Options Response
Percentage Response
Count
Email 79% 41
BSPLink/ASD 75% 39
Other 12% 6
Answered 98% 52
Skipped Question 4% 2
7. Agents and Airlines where asked; what is their preferred method of communication with the GDSs?
Agents
Answer Options Response
Percentage Response
Count
E-mail 86% 819
BSPLink/ASD 34% 323
Other 23% 218
Answered 99% 955
Skipped Question 1% 13
Airlines
Answer Options Response
Percentage Response
Count
BSPLink/ASD 32% 17
E-mail 85% 45
Other 13% 7
Answered 98% 53
Skipped Question 2% 1

35
ADM Market Analysis
8. Airlines where asked; does your airline have any agreement with GDSs for recovering ADMs that are related to auto-priced transactions?
Answer Options Response
Percentage Response
Count
Yes 12% 6
No 88% 44
Answered 93% 50
Skipped Question 7% 4
9. Airlines where asked; in case an ADM is related to auto-priced transactions, would your Airline be willing to engage in direct dialogue with
the GDS?
Answer Options Response
Percentage Response
Count
Yes 79% 38
No 21% 10
Answered 89% 48
Skipped Question 11% 6
12. Airlines and Agents were asked to rate the Airline-Agent relationship for ADMs in general on a scale of 1 – 10 with 10 being the most
positive:
Agents
Ranking 1-10 Response
Percentage Response
Count
5 22% 190
1 15% 135
2 12% 108
3 11% 95
7 10% 83
4 8% 69

36
ADM Market Analysis
8 8% 68
6 7% 65
9 4% 35
10 3% 24
Total 100% 872
Answered 98% 948
Skipped Question 2% 20
Airlines
Ranking 1-10 Response
Percentage Response
Count
7 26% 14
5 22% 12
8 20% 11
6 17% 9
3 4% 2
10 4% 2
4 2% 1
9 2% 1
1 0% 0
2 0% 0
Total 100% 52
Answered 96% 52
Skipped Question 4% 2

37
ADM Market Analysis
13. Agents were asked: On a scale of 1 – 10 with 10 being the most positive, how would you rate your communication with the Airlines and
with the GDSs regarding ADMs
Communication with the Airlines regarding ADMs
Ranking 1-10 Response
Percentage Response
Count
5 24% 217
1 12% 111
7 12% 111
2 11% 97
3 10% 88
4 9% 77
8 8% 72
6 8% 68
9 4% 32
10 3% 23
Total 100% 896
Answered 98% 946
Skipped Question 2% 22
Communication with the GDSs regarding ADMs
Ranking 1-10 Response
Percentage Response
Count
5 22% 197
7 12% 110
8 11% 97
1 10% 86

38
ADM Market Analysis
2 9% 84
6 9% 80
4 7% 66
9 7% 66
3 7% 63
10 6% 52
Total 100% 901
Answered 98% 947
Skipped Question 2% 21
14. Agents were asked where would be the best place to dispose a central repository for their Agency to access important information such
as query Airline's ADM policies, commission control setups and credit card acceptances?
Answer Options Response
Percentage Response
Count
BSPLink/ASD 84% 808
IATA Customer Portal 38% 364
Other 13% 126
Answered 99% 957
Skipped Question 1% 11
15. Airlines were asked; please indicate the revenue audit process that is used by your airline.
Answer Options Response
Percentage Response
Count
External party 67% 36
In-house audit 63% 34
External party, please specify 57% 31
Both External and Internal parties 30% 16
Answered 100% 54
Skipped Question 0% 0

39
ADM Market Analysis
16. Airlines were asked; please identify the critical information that is in your ADM policy.
Answer Options Response
Percentage Response
Count
Conditions for ADM issuance 86% 43
Administration Fees associated with ADM issuance 62% 31
Dispute contacts 58% 29
Conditions of Revenue Auditing 48% 24
Other 18% 9
Answered 93% 50
Skipped Question 7% 4

40
ADM Market Analysis
Find out more about the ADM
Reduction and Management
Project:
www.iata.org/adm
Contact us: