markestrated manual del profesor - …labsag.tlalpan.uvmnet.edu/sim/manuales...
TRANSCRIPT

MARKESTRATed
MANUAL DEL PROFESOR
4. Preparing the initial situationThe starting situation of Markestrated is the company report for Period 0 (the first set ofdecisions concerns Period 1). This company report is distributed to the teams during theintroductory session, and should thus be generated beforehand on the computer using theMarkestrated programs (see Chapter IV). If the Markestrated parameters are not modified, thestarting situation is always the same. In this case, one may choose to have the Period 0 reportsreproduced for subsequent administrations of the game, rather than generating them on thecomputer again.
OVERVIEW OF THE MARKESTRATED SEQUENCE
Over the simulation horizon, the situations of the five competing firms may evolve in variousways, depending on the actions they take. There does not appear to be any systematicallyrepeated pattern in the evolution of the firms from one administration of the game to another.Although they all start with different initial situations, it seems that none of them has asystematic competitive advantage at the end of the simulation.
While there is no repeated pattern in terms of competitive positions, there definitely is in thecourse of the game a systematic and predictable evolution in the nature of the key problemareas. This is represented schematically in Exhibit I. This evolution has been planned andimplemented in the design of the game. Although each team is faced each period with avariety of problems simultaneously, its efforts and learning will be
- 10 -
EXHIBIT 2.1
OVERVIEW OF THE MARKESTRATED SEQUENCE
Periods Key problem area1 Understanding the operations of a Markestrated firm.2 Analysis of marketing research studies.3 Undertaking R & D projects.4 – 6 Introduction of new Sonite and Vodite brands.7 – 8 Consolidation in the Sonite market.9 – 10 Consolidation in the Vodite market.
based on different key areas over periods. It is important that the administrator assimilate thissequence well to foresee future developments in the simulation, and to prepare hispedagogical activities in terms of these key areas.
I - Period I
The company reports at the end of Period 0 represent the initial situation, and the first set of

decisions thus concern Period I. Inthe group sessions for this period, the participants should concentrate their efforts inunderstanding the Markestrated environment and the operations of the firms. To this end, ithas been found highly desirable to give them the following information before they startworking on their first decisions:
- they are not allowed to give perceptual objectives for their advertising campaign as they donot have the relevant information yet. The corresponding columns on the decision formshould be filled with the code number 99 to indicate that no repositioning is desired
- for the same reason, they are not allowed to launch R & D projects yet. The number of R &D projects should be specified as zero and the corresponding entries on the decision formshould be left blank,
- they should be very conservative in making decisions for the first period. While they arefamiliarizing themselves with their new environment, they should try to avoid taking any riskwhich could jeopardize the future of their firm. Period I decisions should represent a conti-nuation of the firms' policies during period 0.
The administrator can reinforce the learning objective of this period by asking to the teamsquestions geared to the analysis of the Markestrated environment and of their firm: what wasthe size of the budget for period 0? and how does it compare with the budget for period I?How was the budget allocated for period 0? How does their firm compare to competitors interms of market share? Given their physical characteristics and prices, how are their brandspositioned relative to competitive brands? From which segments are they more likely to drawsales ? What is the expected evolution of these segments? What is their sales forecast?
Period I is largely a "warm-up" period. Participants will refer often to the manual, and will gothrough the company reports practically line by line. The decisions they must make are verysim lr and drawl mainly on Exhibit 13 of the Participant's manual (General BackgroundInformation) as well as the'company report. A typical decision-making process can go asfollows (ignoring the discussions, diversions, reading, and cross-checking which are all partof the learning experience): keep the same number of salesman and the same allocation ofsalesmen between channels; select marketing research studies to be purchased (only studiesfor the Sonite market should be considered at this point in time); allocate remaining budget toadvertising, with the same proportional split between the two brands as in period 1; spend 5%of the total advertising budget on advertising research, as this is an industry average; set therecommended retail prices to follow inflation or the 102 average yearly price increase in theSonite market; to forecast sales in period 1, assume a constant market share, a total marketgrowth equal to the 35% average figure over the last three years, and qualify the estimate ac-cording to the assumed positioning of the brand in the various segments; the productionplanning estimate can then be deduced from this sales forecast and the inventory level at theend of period 0; recognition of the fact that inventory holding costs are usually smaller thancosts of lost sales may then lead some teams to inflate their levels of production planning.Given the pedagogical objectives of this period and the lack of information at the start, thisprocess is as good as any. Obviously, several iterations will usually be needed for a group toreach consensus. The major arguments may center around the selection of marketing reserachstudies to be purchased. Some individuals will want to buy all available studies while otherswould rather invest as much as possible in advertising. In fact, at this stage, it is in the interestof the teams to buy the most relevant studies to understand their environment: studies I to 6,
12 and 13. The total cost of these studies is less than $400,000 compared to a total budget of 7million MMUS. They represent less than 62 of the total budget and usually less than 8% ofthe advertising budget. It will take a couple of periods before most of the teams realize thatthe prices of the marketing research studies are very small compared to the total budget.However, the real cost of these studies is the time which they take in analysis and discussions,and this is certainly close to reality.
- 13 -
2 - Period 2The teams will have the first opportunity to analyze the results of marketing research studiesin period 2. Apart from the obvious familiarization with marketing research tools and theiruse, an important advantage of these studies is that they incite the participants to think interms of more complex and realistic marketing phenomena than just the sales / advertisingresponse functions as is unfortunately the case with many marketing games. The mainelements of the market situation illustrated in these studies are the following:
- brand awareness (1 and 7)- purchase intentions (1 and 7)- shopping habits (1 and 7)- attitudes (4 and 10)- brand similarities (4,5 and 10)- brand preferences and evolution of market needs (4,5 and 10)- segments (1, 2, 4, 5, 6, 7, 8, 10, 11 and 15)- distribution (1, 3, 7, 9, 13 and 14)- competitive actions (12 and 13)- test of elements of the mix (14 and 15)- market forecasts (6 and 11)
The studies have been designed to illustrate these pedagogical points, while at the same timekeeping the complexity and volume of the outputs to a minimum. This has been achieved bymaking a number of simplifications of the elements which had only a secondary pedagogicalrole. Some of these simplifications_ are for instance: a global brand awareness figure, with noindication of the awareness of specific brand characteristics or advertising themes, and nosignificant observed difference between segments; only the three "most important" semanticscales are given rather than the results of a complete semantic-differential questionnaire; thetwo most important semantic scales are assumed to be practically orthogonal and similar tothe ones used for identifying the axes of the perceptual map; the stress level for the perceptualmap is assumed to be satisfactory for two dimensions, making possible a simple graphicalrepresentation; the perceptual maps based on similarities data alone are also assumed to besimilar for all segments (which thus differ on preferences, but not on perceptions) whichsimplifies the output of this study to one map instead of five; while brand perceptions andideal points evolve over time, the semantic scales classed as "most important" and theinterpretation of the perceptual map axes remain constant.
The game administrator will certainly be able to find many other simplifications that weremade in the design of Markestrated. An excellent exercise to test one's knowledge of the gameand mastery of the teaching situation is to make a list of the main simplifications one can find.Simplifications have never been found to harm the game in previous administrations and, onthe contrary, a higher degree of complexity would be detrimental to the pedagogical process.

Participants will generally use research data for three main purposes:- monitoring: checking the evolution of some critical values to identify problems which mayarise- auditing: investigating the possible causes of some problems by examining and comparingthe results of the various studies/- testing: measuring the effects of elements of the marketing mix on objectives in order toguide action.
Use of the studies for monitoring and testing purposes is straightforward. Participants tend toaccept the high reported accuracy of numbers at the beginning, but they soon learn to discountminor differences which may be due to measurement errors. One should note that participantsare sometimes surprised when using the results of the advertising or sales force experiments.These experiments were run in the previous period, and extrapolating their results to the totalmarket for the following period obviously assumes that everything else will remain constant.This is rarely the case, and possible competitive actions should be taken into account whenimplementing a marketing plan based on the results of the experiments.Use of the marketing research studies for investigating the possible causes of some problemsusually results in greater involvement, depth of analysis, and learning than their use formonitoring and testing. At the beginning of the simulation, students may incompletelyanalyze the marketing research studies and jump to conclusions. For instance, they mayattribute the cause of a small market share to an unsatisfactory awareness level, whileperceptual mapping, semantic scales, and purchase intention data may indicate a seriousproduct quality problem. However, they rapidly discover the need to systematically analyzethe market situation, and see that a marketing problem is more often due to a combination ofelements, rather than to a single one.
A procedure that the instructor may use to rapidly analyze marketing research studies whenconfronted with a problem by one of the firms is the following:
- Awareness. Check the trend in the awareness level of the various brands as forgetting mayhave caused a drop (study 1). Check the relative advertising budgets of these brands (study12).
- Positioning. The perceptual map (study 5) gives a clear graphical representation of brandsimilarities and preferences. The "design" dimension which is the third most importantsemantic scale (study 4), but which does not appear in the perceptual map, should also bechecked in the evaluation of the brands.- Purchase intentions. The analysis of the purchase intention figures for each brand in eachsegment (study 1), in the light of the perceptual mapping and semantic scale data, providesessential information about the relationship between positioning and marker share. It mayshow in particular that a brand primarily directed to a given segment is also attractive toanother segment, because of the lack of more suitable brands, or because of their lowawareness. The comparison between the purchase intent and awareness figures should alsogive a ,:rude evaluation of the respective merits of product improvement and communicationinvestments.
- Product availability in distribution channels. The shopping habits data (study 1) should beused to investigate the coherence of the brand / segment strategy and the allocation of thesales force. The evolution of a company's sales force should be analyzed relative to the
competition (study 13). The distribution panel (study 3) can be used as a global test ofcoherence between the brand / segment strategy and the allocation of the sales force.
- Market share. Although the market share figures by segment (study 2) and by distributionchannels (study 3) are essential for control purposes, their explanatory power is more limitedthan the above information. However, a comparison-of market share and purchase intentfigures may be used to investigate the effects of brand availability. In particular, if a brandruns out of stock, the difference between the corresponding purchase intent and market sharefigures may be used as a crude estimate of lost sales. On the other hand a market share higherthan the purchase intent value for a given brand is likely to be due to the unavailability ofcompeting brands.
3 - Period 3
Although most firms will have already launched R & D projects in Period 2, it is likely thatthey will have more time to spend on this activity in Period 3, having a better control of themanagement of existing products. The major issue in the management of the marketing / R &D interface will be the difference between the perception of a brand and its physicalcharacteristics, between what the consumer wants and the manager's own definition of a"good product". This "better mousetrap" phenomenon is largely discussed in marketingcourses and students can grasp very easily the marketing concept at the cognitive level. Butobservation of the Markestrated teams at this stage of the simulation clearly shows that it hasbeen assimilated in varying degrees by different individuals, and that personal interpretationsof "product quality" are sometimes more prevalent than market considerations. This oftenresults in heated and valuable discussions, but these issues are soon clarified either throughthe convincing arguments of some members of the team or( more expensively) by analyzingwhy this otherwise "perfect" newly introduced brand did not live up to expectations.
The first common mistake made by students in launching R & D projects is to investresources in trying to "improve" some physical characteristics of the brands which do notappear to be important to the consumers (for instance', the weight, volume, or maximumfrequency of the Sonites). The second one is to implicitly assume that increasing performancewill result in better market acceptance (for instance "the higher the power of a Sonite thebetter") when in fact the needs of the various segments do not support this assumption.
When the students have resolved these issues, the next problem is to translate the perceptualdata into physical characteristics. Applying a linear transformation between the range of aperceptual dimension (-20 to +20 on the perceptual map) and the feasible range of a physicalcharacteristic (0 to 100 for Sonite power) is certainly not appropriate. Instead one shoulddetermine the physical characteristics of the existing brands positioned closest to the targetzone on the perceptual map or semantic scales to infer the physical characteristics of the R &D project to be launched. This analysis should be repeated each period when new R 6 Dprojects are requested, as the relationship between a physical characteristic and thecorresponding perceptual dimension may evolve because of changing consumer needs(segment ideal points) or because of modifications in the set of existing products.
Specification of the cost characteristic requires special care. This characteristic represents theaverage variable unit production cost incurred in manufacturing the first 100,000 units of anew brand. Obviously, one should make sure that this cost is low enough to provide areasonable margin given the intended market price for the brand. On the other hand, if the

cost of the product is too low, it is possible that the intended price will not be accepted by themarket. In fact, the model will not accept a rice more than about four times the transfer cost ofthe brand, and will automatically reduce it to that level if it is higher (in this case, theappropriate message is given to the company). Conceptually, this may be explained by thefact that the cost of a product (discounting engineering ingenuity and productivity gains)represents to some extent a limit on the overall quality of the product. For instance, producinga powerful Sonite at a very low cost will require sacrificing other features of the product suchas reliability. Although these features may not explicitly appear to be important to consumers,they will certainly limit the price that consumers are ready to pay for the product.
Finally, a question that some students will ask is the following: "Given a project with thefollowing characteristics, what is a reasonable budget to complete it successfully within oneperiod ?" This is a difficult question to answer, in Markestrated as well as in practice. Apartfrom the ranges specified in the student's manual, comparison of the required R & D projectwith existing products, experience and trial and error are the only ways to, set the R & Dbudgets, except if one takes the "all I can afford" approach. In fact, the functions whichspecify the probability of success of a given R & D project are rather complex as they takeinto account the characteristics of the firm's existing products as well as the difficulty inreaching a given variable production cost. In addition, the outcome of a given R & D projectis subject to an unavoidable stochastic element, and the firm's willingness to take risk for agiven project may be determinative in specifying its budget.
The instructor may react to this question in three ways: by indicating that he does not possessadditional information and that each team should use its best judgment and learn over time;by going with the team through the various considerations in setting the R A D budgets, suchas the differences in the physical characteristics between the project and the firm's existingbrands, the cost requirements, and the risk level that they are ready to take with the project;finally by giving an estimate to the team. In the latter case, the instructor may use theexperience he has acquired in previous administrations of the game. He should take intoaccount the ranges given in the student's manual, adjusted for inflation, and should realize thatthe experience gained by the R & D department in the undertaking of projects facilitates thedevelopment of new ones in the future. Finally, the instructor should indicate that thisestimate represents his personal judgment given his own attitude toward risk, and that there isno guarantee that the project be successful for any budget level. The instructor should chargefor his services to avoid a "pass the buck" situation in which students pass on responSICAlityto the instructor for major decisions.
4 - Periods 4, 5 and 6
The introduction of new brands may create major disturbances in the markets. While in thefirst periods the students have learned to master the Markestrated environment, to use themarketing research studies, to launch It 6 D projects and to manage a small number of brandsin a growing but relatively stable market, they will npw have to take more risk and respondto1aggressive competitive actions.
After having determined global product / market strategies, which have to be planned well inadvance and in fact before the launching of R & D projects, they will now have to developspecific marketing programs for the introduction of new brands. Resources will have to be
allocated to the introduction of these brands and to the maintenance of the existing ones. Afruitful learning exercise is the estimation of the expected market share of a new product atthe end of the introduction period. In this process, students will in particular have to estimatethe expected awareness level of the new brand resulting from a given advertising level,consumer preferences for the new brand compared to competition, distribution coverage, andthe penetration of the various segments. This will most often result in an iterative revision ofthe objectives and the resources allocated to the new brand.
Two extreme strategies may be used in the introduction of a new brand. The first one consistsin investing a maximum amount of resources to rapidly gain a high level of awareness and,hopefully, a strong market penetration. In the second one, the objective is to test marketacceptance of the new brand, and minimum communication expenditures are involved. In thisfashion, the new brand will have a low awareness level and a low market share in the firstperiod, but the firm will be able to analyze whether the brand is correctly positioned and toevaluate market reaction by comparing the purchase intent and awareness figures. If theresults are satisfactory, the firm may invest heavily in the brand in the following period.Otherwise, a repositioning of the new brand will be relatively easy to achieve given its lowawareness level. Conceptually there are many analogies that one can draw between these twoapproaches, and regional vs. national introduction, or skimming vs. penetration strategies.Most importantly, the second strategy is less risky in terms of investments and inventory plan-ning and gives more posSICAlities for corrective actions. Penetration is however slower toachieve, and it leaves more time for competitive reactions.
In the Sonite market, introduction of new brands is likely to stimulate primary demand. Thiseffect will be greater if the new brands are well differentiated from existing ones and if theyare better adapted to segments which have been somewhat neglected in the past.
Entry to the Vodite market is-more risky than introducing a new Sonite brand in severalrespects:
- the "needs" of the consumers as expressed in the semantic scales are given in the absoluteand cannot be compared with Vodite brands as they do not exist at the beginning. Thedetermination of appropriate physical characteristics for R & D projects at this stage must restlargely on judgment, and one should expect many prudent adjustweuts for the early periods ofthe development of this market;
- the forecasts for the Vodite market are expected to he highly inaccurate and somewhatoptimistic until more experience is gained in this market.
- the first companies to launch Vodite brands must develop the market, and this may benefitlate-comers.
The Vodite market should be expected to be rather unstable and somewhat unprofitableduring the first periods of its development and some companies may wait and learn from thecompetitors' mistakes before making their entry. On the other hand, an entry too late may beunsuccessful or at least very expensive if positions of competitive brands are already wellestablished. Finally, one should note that differences between segments are not significant,contrary to the Sonite market.
5 - Periods 7 and 8
After having launched a number of new brands, some companies will discover that they havedispersed their resources and that their better brands may loose market share.
They may have reached the maximum number of five brands which they can carry and theymay be forced to eliminate an existing brand in order to be able to launch a new one. Inaddition, price controls which have been established by the Government since Period 6 maycreate cash problems for some of the firms. This will induce the teams to consolidate theiractivities, reallocate their resources with more discrimination, and to prune the product line.
By this time a market leader for Sonites is likely to have emerged, calling forth defensivestrategies, for instance, using multiple brands to protect a position in a segment or by buildingup marketing entry costs for a particular segment. Other firms may try to fight the leaderor to consolidate their positions in less attractive segments of the market. In a market which isglobally reaching maturity,one is also likely to witness a shakedown period where somecompanies want to pursue their growth at the expense of the weakest competitors throughprice wars or better control of the distribution channels.
During this period, the Vodite market experiences a high rate of growth, and severalcompanies may have elected to invest a good part of resources accrued in the Sonite market inVodite brands.
6 - Periods 9 and 10
By now, a number of brands have well-established positions in the Vodite market, whileseveral other ones have been the victims of rapid technological progress in a fast-growingmarket. This market is reaching maturity and becomes more price sensitive. It appears that tosurvive in this market in the long run, a brand needs to be cost effective. If the firms now inthe Vodite market have offered brands which are well adapted to the needs of consumers, ifthey have reached high productivity levels, and if they have developed the market to its fullpotential, it is unlikely that a newcomer can successfully enter the Vodite market at this point.
ROLE OF THE GAME ADMINISTRATOR
In the course of the simulation, the game administrator plays a number of roles which can begrouped under four headings: class activities, monitoring of the learning experience, externalpartner to the Markestrated firms, and running of the simulation.I - Class activities
At a minimum, two class sessions need to be planned in the administration of Markestrated:an introduction to the game before the first set of decisions, and a final wrap-up session at theend of the simulation. Other class sessions can be planned between the decision periods todiscuss marketing strategy concepts illustrated in Markestrated. In particular two reviewsessions, on segmentation and positioning and the marketing strategy process, have beenfound to be beneficial to the overall learning experience. Possible outlines of these classsessions are given in the following pages.
In most courses, with the exception of executive programs, the instructor will have to give aformal student evaluation in the form of a grade. This grade can be given on the basis of the

firms' overall performance or, preferably, on the basis of a team report presenting an analysisof their performance over the course of the simulation, the strategies pursued, the adjustmentsmade to changes in the environment, their conclusions in terms of the key learning points, andplans for the future. It can be suggested that they present this report as a document to help theoew tam wh,rh witl take over the management of their firm. There should be a minimum ofone week between the time they receive the results of the last simulated period and thedeadline for submitting the report. Other grading procedures can obviously be selected butone should be particularly careful that they are not detrimental to the learning experience. Inparticular, designing an "automatic" grading procedure in which a grade is given on the basisof a mathematical transformation of performance criteria (i.e. final market share, contribution,or return on marketing investment, compared to their initial values or SEFA-assignedobjectives) will inevitably induce "game beating" behavior at the expense of learningactivities. Likewise, the assignment of individual grades on Markestrated, rather than teamgrades, will enhance individual initiatives at the expense of group learning.
2 - Monitoring of the learning experience
The teams can be left to work by themselves, in which case the only interaction of theinstructor with the students over the course of the game is the collection of the decision formsand the distribution of the company reports for each period. The value of the pedagogicalexperience may be increased, especially when Markestrated is administered over a shortperiod of time, if the instructor is attentive to the following points:
a) Going over the returned decision form with each team. In addition to following a firm'sactivities and enquiring about the supportive rationale, the instructor can pinpoint flagranterrors which could place the firm in a difficult position and reduce the learning motivation ofthe team members. For example, one can rapidly check the number of brands, R d D projectsand marketing research studies requested; the reasonableness of the production planning andadvertising. budget levels (i.e. errors in the units used), and completeness of the decisionform.
b) Stimulating learning by asking questions . Asking questions of the managing team of aMarstrat firm is a good way to check if they have considered the relevant issues, and tostimulate their analysis. The instructor will have no difficulty in coming up with a largenumber of possible questions such as: Do you know the marketing budget of your firm inperiod 0 (while the team is working on the decisions for period 1)?
- 23 -
¿Have you estimated the marketing budget of your main competitor ? What would happen ifthe advertising budget of a given brand was drastically reduced (for instance for a wellestablished brand in a mature market )? Why did you select this specific allocation of the salesforce across channels ? Did you estimate the level of lost sales (in a stock-out situation)? Thisquestioning should be kept within limit for a given firm in a given period to avoid submergingthem with new issues.
c) Helping the laggards. Some teams may lag behind the other ones in mastering themarketing strategy concepts, or may be unable to recover from a difficult situation. In thiscase, the remainder of the simulation may be pedagogically more rewarding to them if they
receive some help from the instructor, and this will give a greater challenge to theircompetitors at the same time.
d) Encouraging planning activities. Planning activities should be encouraged, for instance byrequesting copies of the planning and budgeting forms any time the instructor is consulted ona specific problem.
e) In the last set of decisions, the students should be requested to purchase the complete set ofmarketing research studies in order to be able to make a detailed analysis of their firm'ssituation at the end of the simulation.
3 - External partner to the Markestrated firms
The instructor plays the role of various partners to the Markestrated firms: consultant onspecific problems; marketing research firm for "crash" marketing research studies when ateam forgot to request them in due time on the Decision Form; chief executive officer forchanges in the marketing budget; export firm to liquidate obsolete inventories; and justicecourt to settle espionage or cartel cases and assign fines. In each of these situations, the firmsconcerned will negotiate with the instructor. The instructor is obviously entirely free in hisdecisions, but the following may be useful as initial guidelines:
a) Crash marketing research studies. Each "crash" study may be charged at a 50%premium compared to its regular cost in the current period.
b) Consulting fees. Consulting fees may be araigee! in the tango of the marketingresearch studies costs for the current period, depending on the importance of the contributiongiven to the team. The a("pe and the price of the consultancy should be clearly establishedbeforehand, an the outcome of this type of service is most often intangible.
c) Fines. Fines should be set to represent a noticeable part of the marketing budget,without limiting too drastically the scope of activities of the penalized firm. For instance, afine should be set for each minute of delay in the submission of the decision form, in such away that a ten-minute delay represents around 10% of an average marketing budget for thecurrent period. In the first period this fine may be set at $ 100,000 per minute of delay. In fact,fines are mainly used as a deterrent to misbehaviour but rarely need to be enforced.
d) Budget increases. Budget increases should be given on the basis of a soundmarketing plan. They induce the students to take more initiatives and to be more creative thanif they had to stay in the limits of the budget which is automatically allocated. If no majorflaw can be detected in the proposed marketing plan, the requested budget increase should begranted with the following limitations, in order to protect competition: if a firm has already abudget substantially higher than its competitors, it should not receive any additional funds; thetotal marketing resources of a firm receiving an additional budget should not significantlyexceed those of the firm having the highest budget for the current period; and, finally, a firmshould not receive an additional budget for more than two successive periods, as moneyshould not be perceived as a substitute for thinking. It is best to avoid awarding budgetincreases until the Period 3 decisions.
e) Obsolete inventories. Obsolete inventories, when a firm wants to withdraw a brand

from the market or to modify it, can be purchased for from 10% below to 10% above transferprice. The instructor may specify that his "export firm" is ready to purchase these stocks for aone-shot action in markets outside the Markestrated world, which will in no way affect theMarkestrated markets.
These adjustments do not need to be very accurate, and the instructor should make hisproposals readily, without spending tier in detailed computations.
- 25 -
4 - Running the simulation
After having gathered the decision forms of all five firms in a given period, the instructor willhave to input these decisions to the computer, and run the simulation model which generatesthe company reports. This procedure is explained in detail in Chapter IV of this manual.
Before entering the decisions, the instructor will need to fill in the two cells in the bottomright-hand corner of the decision form.
The left-hand cell may contain an exceptional coat (negative number) or an exceptional profit(positive number), and the right-hand cell may contain a budget reduction (negative number)or a budget increase (positive number). These values should be expressed in thousand $ andallow the instructor to input all results of his negotiations with the teams. These values areobtained directly from the back of the decision form which recapitulates the negotiations forthe current period. If no exceptional cost or profit or budget change has been noted, the num-ber zero should be entered in the corresponding cell.
On the back of the decision form, one should note that various actions may result anexceptional profit or lost, or in a budget change, or in both. An exceptional prufit or lost willaffect the net marketing contribution of the firm in the next period, but does not change thelevel of its marketing resources for the current period. On the other hand, a budgetmodificatti_Q will change the funds available for marketing activities in the current period,but will not affect directly the net marketing contribution in the next period. Thus, if a firm isgranted a budget increase, this should be indicated only as a budget change; if it sells obsoleteinventory to the instructor, this will be represented only as an exceptional profit (in this case,the marketing department will also automatically incur an exceptional cost, equivalent to thevalue of the inventory at transfer cost, resulting from the accounting transfer of the inventoryfrom the production department to the marketing department); if it buys some informationfrom the instructor, this will be represented both as a budget reduction (to decrease the levelof resources remaining for other marketing activities), and as an exceptional cost (to includethe payment for the study in the contribution statement).
INTRODUCTORY SESSION
The purpose of this session is to present the Markestrated exercise to the students, to organizethe teams and to give them the necessary information to start making decisions for the firstsimulated period. Students should have read the participant's manual before the class. Thefollowing is a possible plan for the introductory session;

I - Objectives of the Harkstrat exerciseThe objectives of the Markestrated exercise should be presented in the context of the course inwhich it is administered. These objectives can be defined in terms of the concepts illustrated,the advantages of a simulation compared to the more traditional pedagogical tools used in theremaining of the course, and in terms of group behaviour.. In addition, the generalcharacteristics of Markestrated can be presented by comparing them to other games that thestudents may know, or may have previously used. Finally, if a grade is given for theMarkestrated exercise, the grading procedure and the relative importance of this grade for thecourse should clearly be indicated.
2 - Presenting the outline of the Markestrated exercise
The instructor should emphasize the following points:
- need to respect the deadline for each set of decisions- importance of penalties for delays in submitting the decision form- time periods at which the instructor is available for consultation- presentation byeach firmof theirexperience at the endof the simulation.
3 - Presentation of the Marstrat simulation
This presentation should recapitulate the main elements of the simulation, as the students willunavoidably feel that they have not assimilated all the information contained in theparticipant's manual. The transparencies included in Appendix II may be used as a basis forthe presentation. Thet are organized around the following themes:
- Markestrated objectives,- the Harkstrat world,- market structure,- company organization,- operating instructions.
- 27 -
The instructor should select the transparencies that he finds most appropriate, as the completeset is too large for a single session. In particular, all transparencies dealing with R & D, brandmodification or perceptual objectives for Vodites may be kept for another session, as they arenot of direct interest for the initial periods. Finally, the students should be reassured that it isabsolutely normal if they have not yet assimilated all information contained in the manual.The set of decisions for the first period is purposefully limited (no R & D, no perceptualobjectives) so that the teams may concentrate on learning the basic elements of the Markatratsimulation.
4 - Organization of industries and teams
The teams may be formed by the instructor or by the students themselves. Each team should
not be composed of more than eight students. Given the size of the class and five firms ineach industry, the instructor may choose the number of industries required to run theMarkestrated simulation, as well as the average team size. It is recommended that a team sizeof five be considered as optimal. Each team should then be assigned an industry number and afirm number. If time and the number of students per team allow it, the instructor may take thechallenge of managing one of the Markestrated firms by himSEFA.
5 - Distribution of the starting situations
After the teams have been assigned, the company reports for Period 0 which represent theinitial situation can be distributed to the corresponding firms. The instructor may wish toindicate that the teams are replacing the previous management, and that they should take thefirst couple of periods to familiarize themselves with the market and the operations of theirfirm before making any drastic changes.
CLASSROOM DISCUSSIONS
The purpose of these class sessions is to ensure that all students have mastered the basicconcepts and have seen how to use them in the formulation of the marketing strategy. Thesessions should decrease the competitive advantages of the more advanced groups, butincrease the pedagogical benefits for all students and the competitive challenge. The sessionscan be handled as a lecture or as a discussion between all students. In the latter case, theinstructor should encourage students to contribute and expose the main elements they use intheir own analysis. Because of the competitive situation, this will usually take someprovocative questions and good humor. Alternatively, questions can be asked by the gameadministrator of each group separately, to check that they have considered the main concepts.
I - Segmentation and positioning
This session should ideally be scheduled at a time between the second and fourth set ofdecisions. The first two parts of the session are reviews of segmentation and poses iti u ngconcepts, as they are found in marketing textbooks. They maybe rapidly reviewed as they willusually have been previously covered in a marketing course. The bulk of the session shouldbe devoted to the third part where the experience gained in the first Markestrated decisionsmay contribute best to the active application of segmentation and positioning concept.
Session outline
Review of segmentation:- the purpose of segmentation,- criteria for segmentation,- segmentation methods.
Review of positioning:- the concept of product positioning,- measurement of product positioning through scaling,
(should cover semantic scales and perceptual mapping)- strategies for product positioning and repositioning.
Implementation of segmentation and positioning concepts in the selection of product /market positions. A list of elements which should be considered in the evaluation ofproduct / market positions can be made with the participation of students. Specificexamples can be drawn from the Harkstrat experience inn the preceding periods.
Background readings
* Assael, A. "Perceptual Mapping to Reposition Brands"Journal of Advertising Research, February 1977, pp. 39-42.
- 29 -
* Barnett, N.L. "Beyond Market Segmentation",Harvard Business Review, vol. 47, January-February 1969,pp. 152-166.
* Beik, L.L., and Buzby, S.L.. "Profitability Analysis by Market Segments",Journal of Marketing, vol. 37 (July 1973),pp. 48-53.
* Doyle, P. "Nonmetric Multidimensional Scaling: A User's Guide",European Journal of Marketing, 1973, pp. 82-88.
* Foote, N.N. "Market Segmentation as a Competitive Strategy",in J.F. Engel, H.F. Fiorillo. and M.A. Cayley (Eds.),Market Segmentation, New York: Holt, Rinehart and Winston,1972, pp. 49-59.
* Haley, R.I. "Benefit Segmentation: A Decision-Oriented Research Tool",Journal of Marketing, vol. 32, July 1968, pp. 30-35.
* Johnson, R.M. "Market Segmentation: A Strategic Management Tool"Journal of Marketing Research, vol. VIII (February 1971)pp. 13-18.
* Perry, M., Izraeli, D., and Perry, A. "Image Change as a Result of Advertising",Journal of Advertising Research, February 1976,pp. 45-50.
* Smith, R.E., and Lusch, R.F. "How Advertising Can Position a Brand",Journal of Advertising Research, Vol. 16 February 1976, pp. 37-43
* Wind, Y., and Robinson, P.J. "Product Positioning: An Application of MultidimensionalScaling", in R.I. Haley, ed., Attitude Research in Transition, AmericanMarketing Association, 1972.
2 - The marketing strategy process
This session should be scheduled at least three periods before the end of the game, so thatstudents may benefit from it in making their decisions. It should particularly emphasize thebenefits for long-term marketing planning, and draw examples from previous periods in theMarkestrated simulation.
- 30 -
Session outlineSetting objectives. The meaning of market share as a marketing objective.
Analysis of opportunities. Add longer term considerations to the segmentation and positioningelements discussed in the previous session:, environmental changes, evolution in consumerneeds, product / market life-cycles...
Elaboration of a marketing strategy and a marketing plan.- the need for a marketing strategy,- matching marketing opportunities and corporate ressources- the selection of product / market strategies;- the planning of long term activities and allocation of resources.
Implementation of the marketing plan- coordination with other departments of the firm, in particular R d D;- elaboration of marketing programs;- contingency planning,
Evaluation of marketing performance and adaptation of the marketing plan.
Background readingsAnsoff, H.I. "Strategy as a Tool for Coping with Change",
Journal of Business Policy, Vol. I, Summer 1971, pp. 3-7.
Bloom, P.N., and Kotler, P. "Strategies for High Market Share Companies",Harvard Business Review, Vol. 53, November 1975, pp. 63-72.
Brien, R.H., and Stafford, J.E. "Marketing Information Systems: A New DimensionFor Marketing Research," Journal of Marketing, vol. 33, July 1968, pp. 19-23.
Buzzel, R.D., Gale, B.T., and Sultan, R.G.M. "Market Share:A Key To Profitability," Harvard Business Review, vol. 53, January 1975, pp. 97-106.
Catty, B., and Chevalier, M. "Market Share Strategy and the Product Life-Cycle,"Journal of Marketing, Vol. 38, October 1974, pp. 29-34.
- 32 -
. Cravens, D.W. "Marketing Strategy Positioning,"Business Horizons, Vol. 18, December 1975, pp. 53-61.
Fogg, C.D.'Planning Gains in Market Share,"Journal of Marketing, Vol. 38, July 1974, pp. 30-38.
Hedley, B. "A Fundamental Approach to Strategy Development,"Long-Range Planning, Vol. 9, No. 6, December 1976, pp. 2-II.
Hedley, B. "Strategy and the Business Portfolio,"Long-Range Planning, Vol. 10, February 1977, pp. 9-15.
Hopkins, D.S. "New Emphasis in Marketing Strategies,"The Conference Board Record, August 1976, pp. 35-39
Kotrba, R.W. "The Strategy Selection Chart,"Journal of Marketing, Vol. 30, No. 3 (July 1966), pp. 22-25.
Rossotti, C.O. "The Concepts of Long-Range Planning: An Analysis of CurrentPractice," Boston, Mass.:. The Boston Consulting Group.
Shoeffler, S., Buzzell, R.D., and Heany, D.V., "Impact of Strategic Planningon Profit Performance," Harvard Business Review, Vol. 52, March 1974, pp. 137-145.
Woodruff, R.B. "Market Opportunity Analysis: A Systematic Approach for PracticalApplications," Business Horizone, Vol. 19, No. 4 (1976), pp. 55-65.
3 - Common problem areas
In previous administrations of Markestrated, we have repeatedly observed that some teams lagbehind other ones in mastering some of the issues. The issues for which this effect has beenmost important are listed below. The instructor may choose to raise some of them in classdiscussions or during his interactions with the teams:
a) Limited purchase of marketine research studies. Students should realize the importance ofthese studies in understanding market behavior, and their moderate coat relative to the totalmarketing budget. They should recognize that the real cost of the studies is the time it takesto analyze them, given the limited time available for making decisions.b) Difficulties in forecasting brand sales. This requires analysing and integriting a number ofelements such as market growth, awareness, purchase intentions, distribution coverage andcompetitive actions.
c) Taking too much risk. In particular, launching a new brand with a high penetration strategyand inadequate preparation often results in excessive inventories and is usually an expensiveexperience. Although it leaves time foi competition to react, test marketing a new brand firstby introducing it smoothly with a moderate advertising budget is sometines preferable,especially with limited marketing budgets.
d) Scattering resources. Some companies tend to launch more brands than the number theycan satisfactorily maintain with their resources.
e) Failure to prune the product line. Some firms are satisfied to keep a brand as long as itgenerates a minimum level of sales, when in fact a crude economic analysis indicates that theresources it requires would provide a much higher return if used for other brands.
f) Underinvestment in R & D. The teams should recognize that successful R & D projects area scarce resource, that they take a minimum of one period to be available, and that promptreaction to competitive actions often requires the availability of new products for introduction.Underinvestment may be reflected in terms of the budget allocated to a given R & D project,or by the fact that firms search only for the products which they are sure to introduce later. Itmay be more desirable sometimes to think in terms of a pool of available R & D projects,some of which correspond to planned marketing actions, and others which are maintained torespond to competitive actions or new market developments.
g) Superficial analysis of the perceptual map. A superficial analysis of the perceptual mapmay provide erroneous interpretation of brand penetration in the various segments, and ofcompetitive structure. This should be cross-checked with awareness, purchase intent andconsumer panel data. In add1tion', some firms may take a long time to recognize the evolutionof the ideal points on the perceptual map, and the importance of the third dimension (Design)which appears in the semantic scale study but is absent from the perceptual map.
h) Advertising for mature brands. Some firms may invest large advertising budgets on maturebrands, especially if they think in terms of an advertising/sales ratio. Although this willundeniably protect the brand from competition and raise entry costs, such a brand already has
- 33 -
a high awareness level and can hardly be repositioned. It may be more appropriate to transferat least part of the resources to other brands in the introduction or growth stages, and considerthe mature one as a "cash cow".
i) Concentrating on absolute rather than relative marketing investments. Somestudents concentrate on the absolute marketing investments they make, comparing them withthe corresponding amounts in the previous periods. This fails to recognize the evolution incompetitive practices. A more appropriate approach is to follow the magnitude of theseinvestments compared to total industry marketing investments, for example, the share ofadvertising expenditures for a brand in the market or the size of the firm's sales forcecompared to the total number of salesman in the industry.
j) Integrating inflation in marketing decisions. With the observed inflation rates in theMarkestrated world, the consumer price index increases by approximately 250 percent fromPeriod 0 to Period 10. Some firms do not realize this effect when comparing prices, netmarketing contributions or budgets over time, and the evaluation of their own progress istherefore over-optimistic. They should recognize that a $ 2 million advertising budget inPeriod 8 only buys half of the advertising space resulting from the same budget in Period 0.
k) Analysis of opportunities. Firms tend to analyze product/ market opportunities in anabsolute fashion, discounting the fact that competitors are performing exactly the sameanalyses. As a result, competition tends to be rather intense in segments 3 and 4 which appear
to be more profitable, and segments 1, 2 and 5 are seriously considered only later in thesimulation. Firms with more limited resources could benefit by entering these segmentsearlier, after having performed appropriate R & D projects which would ensure them acomfortable margin in these segments.
l) Imitation vs. innovation. Most firms will usually define the desired characteristics ofnew brands by analyzing in detail the basic marketing research data. Most of the time theywill try to launch new products which represent differentiated advantages compared to com-petition. This is certainly a very good strategy in most cases. One should also recognize that,when a very successful new competitive brand has been introduced on the market, the easiestand sometimes most efficient approach is to imitate it plainly and benefit from its experience.As a matter of fact;, an instructor achieved very reasonable results in one administration ofMarkestrated by following this simple strategy without buying any marketing researchstudies.
m) Market maturation. As the Sonite market matures, it becomes more and moredifficult to introduce new brands, to gain awareness and a profitable market share level. Manyfirms will not have forecast this phenomenon and may persevere in making plans for theintroduction of new brands along the same lines as they used to do in the growth period.
FINAL SESSION
This session should be scheduled to leave sufficient time after the distribution of the lastperiod's results for each team to analyze their performance over all periods. The instructorwill have to decide on the importance to give to each part of the following session outline,depending on the time available.
1 - Presentation of general results by the instructor
The purpose of this presentation is to describe the overall development of thesimulated Markestrated industry over the course of the game, as a background to the grouppresentations. The evolution of the following elements from Period 0 to the end of the gamecan be presented, preferably on transoarettciea
- ideal points for each segment, for Sonites and Vodites, noting the lack of observeddifferentiation between the needs of the various segments in the Vodite market;- industry sales per segment;- major events in the Markestrated industry (such as price controls, entry in the Voditemarket, and major shifts in competitive strategies);- total industry investments (number of brands, advertising expenditures, sales force,average price index, R & D budgets);- global performance (company market shares and net marketing contributions).
- 35 -If several industries were simulated, the instructor may compare their evolution, and
pinpoint major differences. The data necessary to support this presentation may be obtainedfrom the complete output obtained by the instructor for each period, or by running an"automatic analysis" computer program, available with the Markestrated package. Thisprogram, described in Chapter IV, presents in tabular and graphical form the evolution of keydata over all periods of the simulation. In any event, the instructor should tell the students
beforehand exactly what material he will present in order that students can focus on thematerial that they can present to build upon the instructor's presentation.
2 - Group presentation
The preparation of this presentation and the exchange of experiences in the classroomis a major learning aspect of the Markestrated exercise. As previously indicated, each groupmay consider its presentation as a briefing to the new team which will take over themanagement of their firm, and should include the following elements:
- analysis of past performance;- main strategies pursued;- main adjustments made to changes in the environment;- key points learned through past successes and failures;- recommendations for the future.
If the presentations are well prepared In advance on paper charts or transparencies,each team can do a good job in fifteen minutes, and the instructor may choose the number ofgroups to call on according to the time available for the session.
3 - Overall description of the simulation model structure
The instructor may present some aspects of the simulation model, for instance, itsgeneral organization, and some specific elements of interest such as the treatment ofrepositioning through advertising. These may be extracted directly from Chapter V. Thepurpose of this presentation is to satisfy the understandable curiosity of the students, and toshow that the model interactions are such that a good understanding of marketing concepts ismore essential to succeed in the management of a Markestrated firm, than trying to find outthe model formulation of a specific relationship.In fact, this part does not need to be developed extensively as the objective of theMarkestrated simulation is to teach marketing strategy concepts and not marketing modelling.What is essential is the behavior of the simulation for an "outside" observer, and not thetreatment of specific interactions inside the model. Moreover, students will be more satisfiedwith only a general presentation of the simulation model structure.
4 - Conclusions
The instructor will obviously have to draw and present his own conclusions, according to theobjectives of the Markestrated exercise in the context of his course. It is however desirable tospend some minutes to discuss the transferability of marketing strategy concepts learned withMarkestrated to other cases or practical situations to which students will be exposed in thefuture. In particular, one may distinguish between specific characteristics of the Markestratedworld (such as segment definition, growth rates, company organization, and availability ofmarketing research data) and concepts of a more general nature.
- 37 -
Chapter III
THE STARTING SITUATION OF THE MARKESTRATED FIRMS
It is a particular characteristic of the MARKESTRATED simulation that the fivecompeting firms start in different situations. These starting situations are defined in theCompany Reports for Period 0 which are generated by the MARKESTRATED computerprograms and distributed to the corresponding teams. In addition, the instructor willautomatically obtain the complete net of errketing research studies for Period 0 when runningthe computer programs for the first time. The purpose of this chapter is to analyze thecharacteristics of the starting situation so that the instructor may readily comprehend the typesof problems that each firm faces and anticipate their possible courses of action.
CHARACTERISTICS OF THE INITIAL ENVIRONMENT
In Period 0, the GNP growth rate is 4 Z and the inflation rate 9 Z. These conditionswill prevail in the following year. The total Sonite market is equal to 872,000 units and $ 342million at retail level. It is expected to grow at the rate of 30 Z in the following years.
As indicated in Exhibit 3.1, the five segments are relatively comparable in size from113,000 units to 211,000 units. However, their expected rates of growth vary widely from - 5Z to 60 Z. In addition, they present significant differences in profitability. For example, theprice ranges dominating in segments 5 and 3 are $ 195-340 and $ 420-485, respectively.Segments 3 and 4 are the most profitable markets, followed by segments I and 2. Segment 5 isthe most price-conscious one.
Consumers in segments 2 and 4 tend to shop to a large extent in all three distributionchannels, while segments 1, 3 and 5 tend to favor two of the three channels. Trying to reachseveral segments will imply greater dispersion of the sales force across the three channelsdependingon the nature of the selected segments. It should be noted in particular that a strategy aiminguniquely at segments 3 and 5 will allow a concentration of the sales force on channels 2 and 3.Overall, a greater proportion of potential consumers would tend to prefer to buy a Sonite inchannel 3.
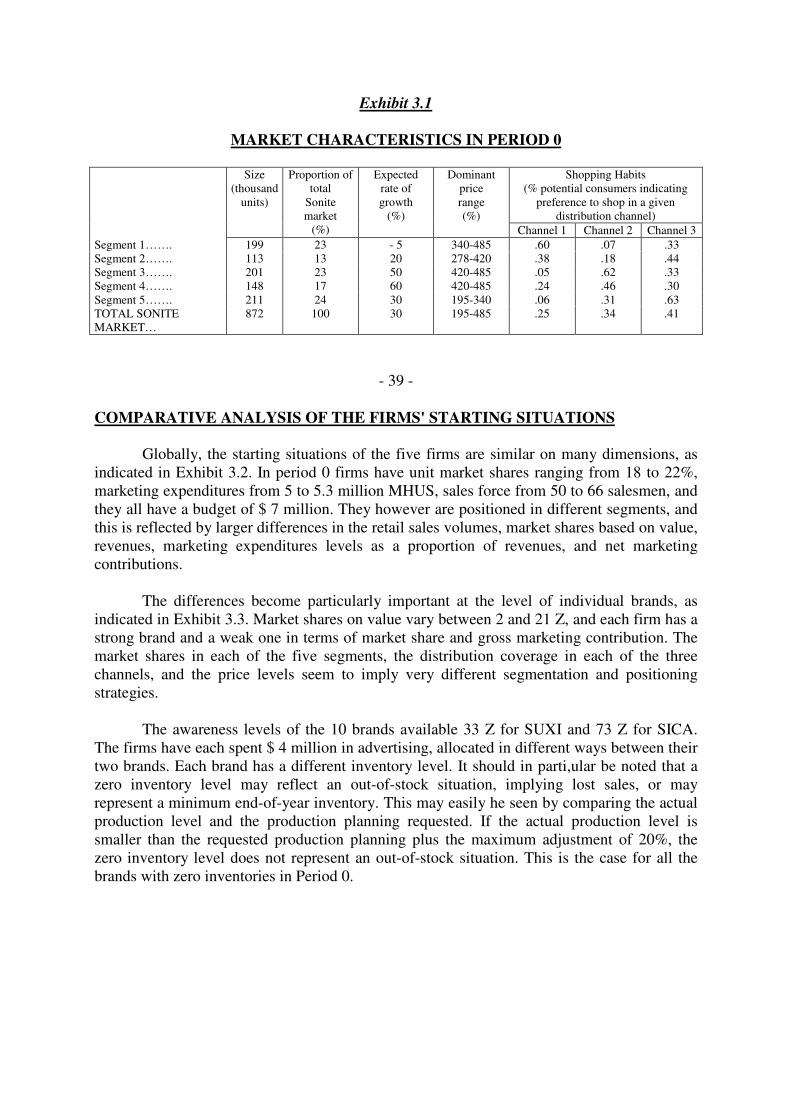
Exhibit 3.1
MARKET CHARACTERISTICS IN PERIOD 0
Shopping Habits(% potential consumers indicating
preference to shop in a givendistribution channel)
Size(thousand
units)
Proportion oftotal
Sonitemarket
(%)
Expectedrate ofgrowth
(%)
Dominantpricerange(%)
Channel 1 Channel 2 Channel 3Segment 1……. 199 23 - 5 340-485 .60 .07 .33Segment 2……. 113 13 20 278-420 .38 .18 .44Segment 3……. 201 23 50 420-485 .05 .62 .33Segment 4……. 148 17 60 420-485 .24 .46 .30Segment 5……. 211 24 30 195-340 .06 .31 .63TOTAL SONITEMARKET…
872 100 30 195-485 .25 .34 .41
- 39 -
COMPARATIVE ANALYSIS OF THE FIRMS' STARTING SITUATIONS
Globally, the starting situations of the five firms are similar on many dimensions, asindicated in Exhibit 3.2. In period 0 firms have unit market shares ranging from 18 to 22%,marketing expenditures from 5 to 5.3 million MHUS, sales force from 50 to 66 salesmen, andthey all have a budget of $ 7 million. They however are positioned in different segments, andthis is reflected by larger differences in the retail sales volumes, market shares based on value,revenues, marketing expenditures levels as a proportion of revenues, and net marketingcontributions.
The differences become particularly important at the level of individual brands, asindicated in Exhibit 3.3. Market shares on value vary between 2 and 21 Z, and each firm has astrong brand and a weak one in terms of market share and gross marketing contribution. Themarket shares in each of the five segments, the distribution coverage in each of the threechannels, and the price levels seem to imply very different segmentation and positioningstrategies.
The awareness levels of the 10 brands available 33 Z for SUXI and 73 Z for SICA.The firms have each spent $ 4 million in advertising, allocated in different ways between theirtwo brands. Each brand has a different inventory level. It should in parti,ular be noted that azero inventory level may reflect an out-of-stock situation, implying lost sales, or mayrepresent a minimum end-of-year inventory. This may easily he seen by comparing the actualproduction level and the production planning requested. If the actual production level issmaller than the requested production planning plus the maximum adjustment of 20%, thezero inventory level does not represent an out-of-stock situation. This is the case for all thebrands with zero inventories in Period 0.
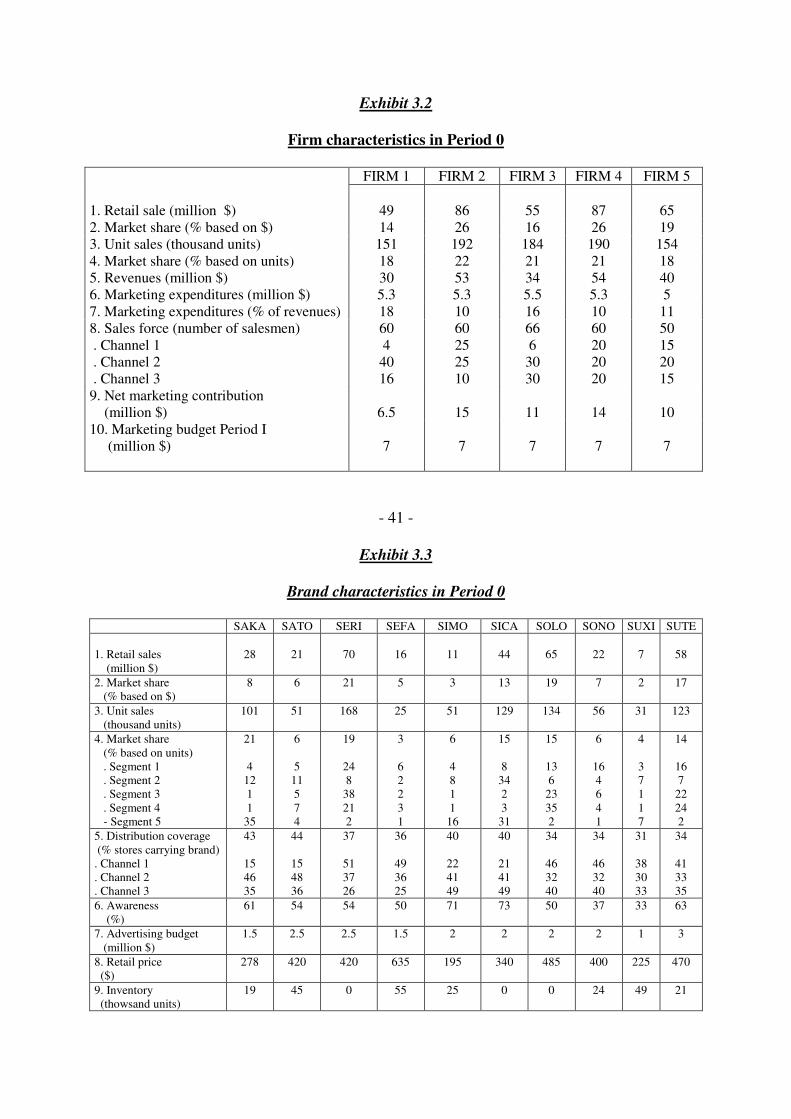
Exhibit 3.2
Firm characteristics in Period 0
FIRM 1 FIRM 2 FIRM 3 FIRM 4 FIRM 5
1. Retail sale (million $) 49 86 55 87 652. Market share (% based on $) 14 26 16 26 193. Unit sales (thousand units) 151 192 184 190 1544. Market share (% based on units) 18 22 21 21 185. Revenues (million $) 30 53 34 54 406. Marketing expenditures (million $) 5.3 5.3 5.5 5.3 57. Marketing expenditures (% of revenues) 18 10 16 10 118. Sales force (number of salesmen) . Channel 1 . Channel 2 . Channel 3
604
4016
60252510
666
3030
60202020
50152015
9. Net marketing contribution (million $) 6.5 15 11 14 1010. Marketing budget Period I (million $) 7 7 7 7 7
- 41 -
Exhibit 3.3
Brand characteristics in Period 0
SAKA SATO SERI SEFA SIMO SICA SOLO SONO SUXI SUTE
1. Retail sales (million $)
28 21 70 16 11 44 65 22 7 58
2. Market share (% based on $)
8 6 21 5 3 13 19 7 2 17
3. Unit sales (thousand units)
101 51 168 25 51 129 134 56 31 123
4. Market share (% based on units) . Segment 1 . Segment 2 . Segment 3 . Segment 4 - Segment 5
21
41211
35
6
511574
19
248
38212
3
62231
6
4811
16
15
83423
31
15
136
23352
6
164641
4
37117
14
167
22242
5. Distribution coverage (% stores carrying brand). Channel 1. Channel 2. Channel 3
43
154635
44
154836
37
513726
36
493625
40
224149
40
214149
34
463240
34
463240
31
383033
34
413335
6. Awareness (%)
61 54 54 50 71 73 50 37 33 63
7. Advertising budget (million $)
1.5 2.5 2.5 1.5 2 2 2 2 1 3
8. Retail price ($)
278 420 420 635 195 340 485 400 225 470
9. Inventory (thowsand units)
19 45 0 55 25 0 0 24 49 21
10. Selling price ($)
171 259 261 390 120 109 301 246 138 292
11. Unit transfer cost ($)
104 138 155 230 57 103 165 207 80 175
12. Unit contribution (% selling price)
39 47 41 41 52 49 45 16 42 41
13. Gross marketing con-tribution (million $)
5 3 15 1 1 12 16 0 0 11
- 42 -
EVALUATION OF THE STARTING SITUATION FOR EACH FIRM
Firm I has the smallest market share of the industry, based on unite SOLO (18 Z) or retailsales (14 Z). The unit sales of brand SAKA are dowilde those of brand SATO. SAKA is theleader in segment 5 with 35 Z unit market share, while the market share of SATO in eachsegment is smaller than one third df the leading brand in this segment. The unit contributionfor SATO is however higher than for SARA, and SATO represents nearly 40 Z of the totalgross marketing contribution of the firm.
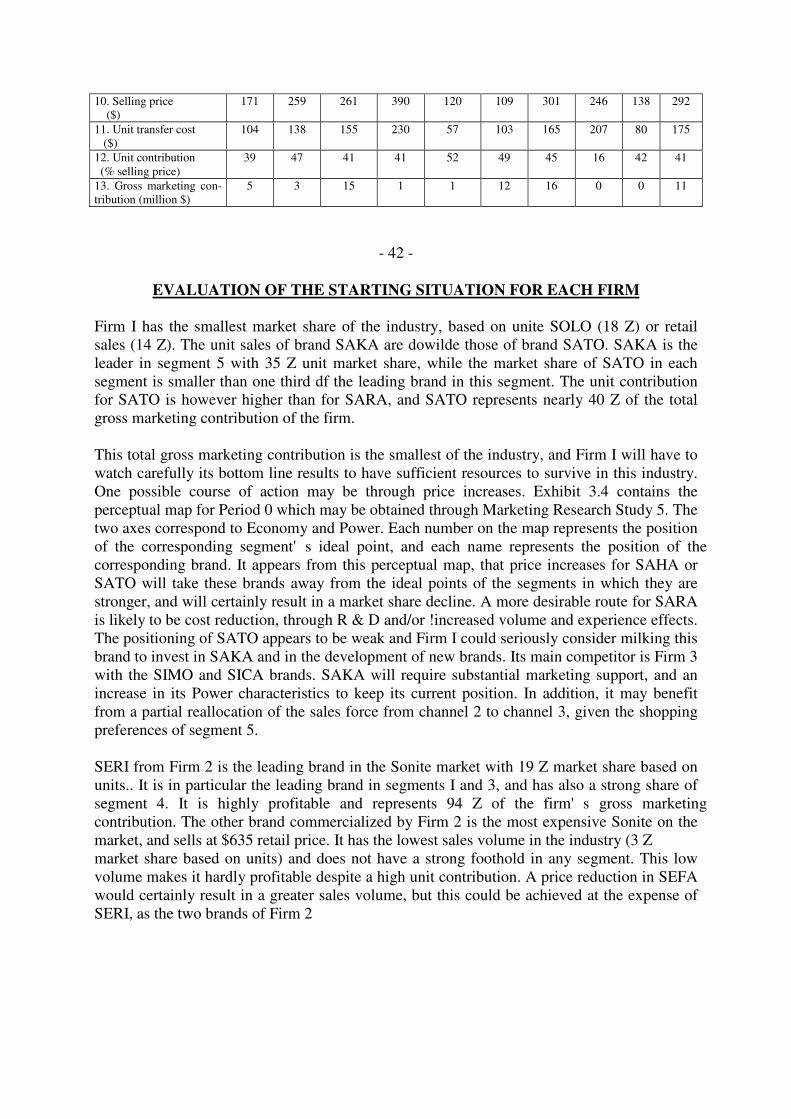
This total gross marketing contribution is the smallest of the industry, and Firm I will have towatch carefully its bottom line results to have sufficient resources to survive in this industry.One possible course of action may be through price increases. Exhibit 3.4 contains theperceptual map for Period 0 which may be obtained through Marketing Research Study 5. Thetwo axes correspond to Economy and Power. Each number on the map represents the positionof the corresponding segment's ideal point, and each name represents the position of thecorresponding brand. It appears from this perceptual map, that price increases for SAHA orSATO will take these brands away from the ideal points of the segments in which they arestronger, and will certainly result in a market share decline. A more desirable route for SARAis likely to be cost reduction, through R & D and/or !increased volume and experience effects.The positioning of SATO appears to be weak and Firm I could seriously consider milking thisbrand to invest in SAKA and in the development of new brands. Its main competitor is Firm 3with the SIMO and SICA brands. SAKA will require substantial marketing support, and anincrease in its Power characteristics to keep its current position. In addition, it may benefitfrom a partial reallocation of the sales force from channel 2 to channel 3, given the shoppingpreferences of segment 5.
SERI from Firm 2 is the leading brand in the Sonite market with 19 Z market share based onunits.. It is in particular the leading brand in segments I and 3, and has also a strong share ofsegment 4. It is highly profitable and represents 94 Z of the firm's gross marketingcontribution. The other brand commercialized by Firm 2 is the most expensive Sonite on themarket, and sells at $635 retail price. It has the lowest sales volume in the industry (3 Zmarket share based on units) and does not have a strong foothold in any segment. This lowvolume makes it hardly profitable despite a high unit contribution. A price reduction in SEFAwould certainly result in a greater sales volume, but this could be achieved at the expense ofSERI, as the two brands of Firm 2
- 43 -
Exhibit 3.4
PERCEPTUAL MAPPING IN PERIOD 0
+ 20 .
- 20 2 + 20Axis 1
-20 .
- 44 -
are closely positioned. On the other hand, it may be difficult for SERI to keep its market shareagainst two other strong brands, SUTE and SOLO, as well as against new competition whichwill inevitably be attracted by the potential and high profitability of segments 3 and 4. Firm 2may thus try to milk SEFA or to reposition it closer to segments 3 and 4 to support SERI. Inthe latter case, SEFA should be repositioned close to competitive brands and Axis 2 as far aspossible from SERI to reduce cannibalization. The sales force may Higher Power have to bereallocated partially from channel I to channel 3 if segments 3 and 4 become the primetargets. With its high level of profitability, Firm 2 may design new products for segments 4and 2, and may be the leader in developing the Vodite market. Resources will however beneeded to protect the highly profitable brand SERI.
Firm 3 dominates segment 5 with its two brands SIMO and SICA which together SERIaccount for 47% of the unit sales in this segment. SICA is the strongest of the two brands with15 1 of the total Sonite market and a unit contribution equal to $106, nearly double the unitcontribution of SIMO. It is the leading brand in segment 2 and close second to SAKA in
Axis 2Higher Power
Higher EconomyLower Economy
Lower Power
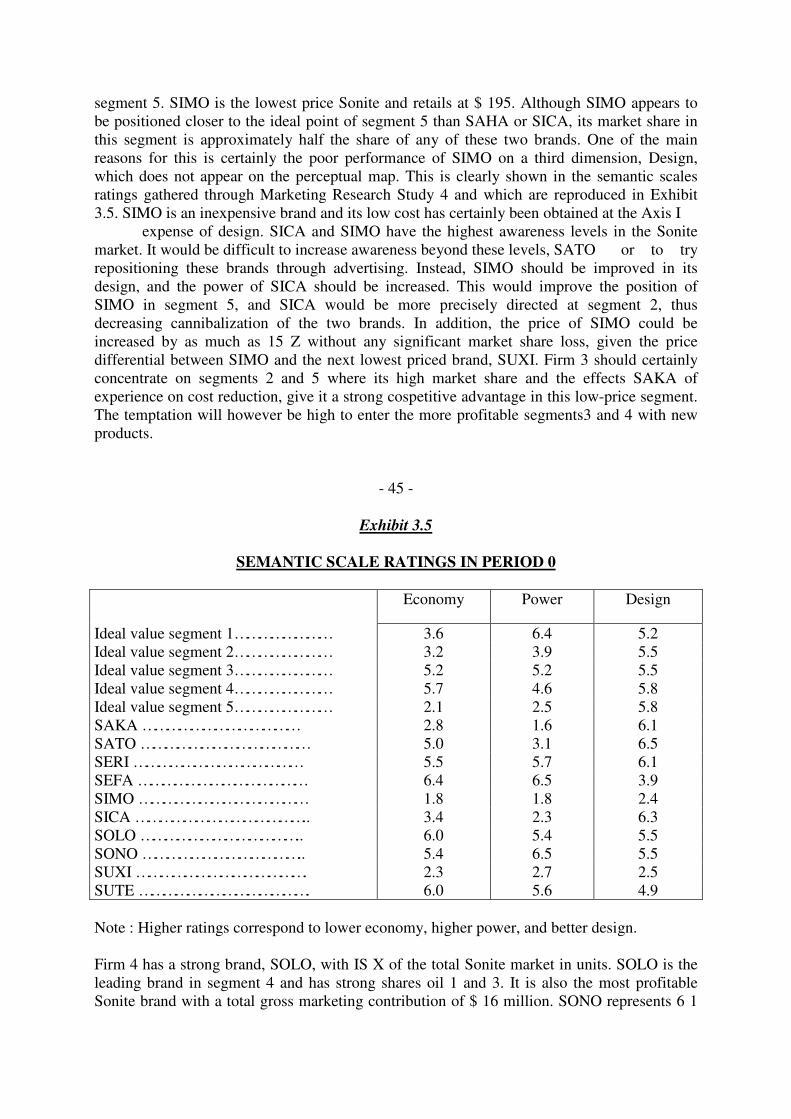
segment 5. SIMO is the lowest price Sonite and retails at $ 195. Although SIMO appears tobe positioned closer to the ideal point of segment 5 than SAHA or SICA, its market share inthis segment is approximately half the share of any of these two brands. One of the mainreasons for this is certainly the poor performance of SIMO on a third dimension, Design,which does not appear on the perceptual map. This is clearly shown in the semantic scalesratings gathered through Marketing Research Study 4 and which are reproduced in Exhibit3.5. SIMO is an inexpensive brand and its low cost has certainly been obtained at the Axis I
expense of design. SICA and SIMO have the highest awareness levels in the Sonitemarket. It would be difficult to increase awareness beyond these levels, SATO or to tryrepositioning these brands through advertising. Instead, SIMO should be improved in itsdesign, and the power of SICA should be increased. This would improve the position ofSIMO in segment 5, and SICA would be more precisely directed at segment 2, thusdecreasing cannibalization of the two brands. In addition, the price of SIMO could beincreased by as much as 15 Z without any significant market share loss, given the pricedifferential between SIMO and the next lowest priced brand, SUXI. Firm 3 should certainlyconcentrate on segments 2 and 5 where its high market share and the effects SAKA ofexperience on cost reduction, give it a strong cospetitive advantage in this low-price segment.The temptation will however be high to enter the more profitable segments3 and 4 with newproducts.
- 45 -
Exhibit 3.5
SEMANTIC SCALE RATINGS IN PERIOD 0
Economy Power Design
Ideal value segment 1…………………… 3.6 6.4 5.2Ideal value segment 2…………………… 3.2 3.9 5.5Ideal value segment 3…………………… 5.2 5.2 5.5Ideal value segment 4…………………… 5.7 4.6 5.8Ideal value segment 5…………………… 2.1 2.5 5.8SAKA ………………………………… 2.8 1.6 6.1SATO …………………………………… 5.0 3.1 6.5SERI …………………………………… 5.5 5.7 6.1SEFA …………………………………… 6.4 6.5 3.9SIMO …………………………………… 1.8 1.8 2.4SICA …………………………………….. 3.4 2.3 6.3SOLO ………………………………….. 6.0 5.4 5.5SONO ………………………………….. 5.4 6.5 5.5SUXI ……………………………………. 2.3 2.7 2.5SUTE ……………………………………. 6.0 5.6 4.9
Note : Higher ratings correspond to lower economy, higher power, and better design.
Firm 4 has a strong brand, SOLO, with IS X of the total Sonite market in units. SOLO is theleading brand in segment 4 and has strong shares oil 1 and 3. It is also the most profitableSonite brand with a total gross marketing contribution of $ 16 million. SONO represents 6 1
of the total Sonite market in units and is among the leading brands in segment 2. It has,however, the smallest unit contribution of all brands (16 X of selling price) and a relativelylow awareness (37 X). It barely breaks even overall and is clearly a problem brand. Onealternative would be to increase its price and milk it, in which case SONO will be in asituation very similar to Firm 2 SEFA. Another alternative would be to decrease its costthrough R & D, position it closer to segment I, and get a better profitability through salesvolume and experience effects. Yet another alternative would be to keep the SONO brandname to launch a new product with lower power, and geared at segment 3. This could becombined with a repositioning of SOLO more towards segment 4 to decrease cannibalizationeffects. Overall, the situation of Firm 4 looks very good in terms of market share andprofitability. It has however a problematic brand, and will have to face strong competition asnew brands will certainly be introduced in the. highly profitable segments 3 and 4.
The two brands commercialized by Firm 5 are highly differentiated and serve differentsegments. SUTE is a direct competitor of SERI and SOLO, and it has significant marketshares in segments I, 3 and 4. It represents 14 % of the Sonite market in units and generate $11 million in contribution. SUXI seems to be very well positioned on the perceptual map withrespect to the ideal points of segments 2 and 5. Its sales in these segments are however lessthan one fourth those of the leading brands. Its global market share based on units SOLO is 4% and it barely breaks even in terms of gross marketing contribution. The semantic scalesratings in Exhibit 3.5 indicate that SUXI, like SIMO, has a design problem and consumersapparently prefer to compromise in this case on economy and power by purchasing brandssuch as SAKA and SICA. In addition, SUXI has the lowest awareness level (33 X) of alllonite brands. It may, however, acquire a strong position in segments 2 and 5 with adequateimprovement in its design and marketing support. Firm 5 will need to cover several 'fronts with its two brands which aim at substantially different segments, and this may requireconsiderable resources. In particular, its sales force which is the smallest in the industry willhave to be increased.
- 47 -
CONCLUSIONS ON THE STARTING SITUATION
Each firm has different strengths and weaknesses in Period 0 of the simulation interms of product characteristics, brand awareness and positioning, market shares, distributioncoverage and profitability. This starting situation is, however, globally equitable for all fivefirms in terms of difficulties and opportunities, and no firm has had a systematic competitiveadvantage in previous administrations of Markestrated. In particular, each firm has a strongbrand and a more problematic one.
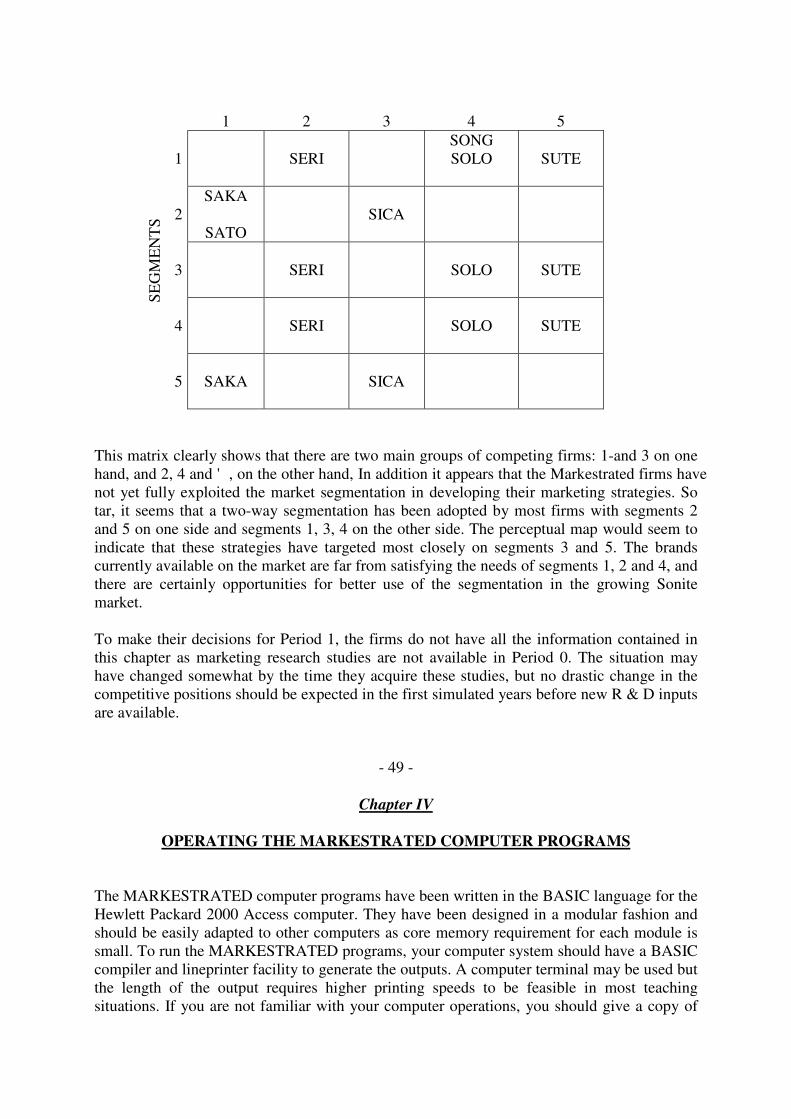
If one considers only the main Sonite brands, the firm/product/market situation in Period 0may be summarized on the following matrix
1 2 3 4 5
1 SERISONGSOLO SUTE
2SAKA
SATOSICA
3 SERI SOLO SUTE
4 SERI SOLO SUTE
SEG
ME
NT
S
5 SAKA SICA
This matrix clearly shows that there are two main groups of competing firms: 1-and 3 on onehand, and 2, 4 and ', on the other hand, In addition it appears that the Markestrated firms havenot yet fully exploited the market segmentation in developing their marketing strategies. Sotar, it seems that a two-way segmentation has been adopted by most firms with segments 2and 5 on one side and segments 1, 3, 4 on the other side. The perceptual map would seem toindicate that these strategies have targeted most closely on segments 3 and 5. The brandscurrently available on the market are far from satisfying the needs of segments 1, 2 and 4, andthere are certainly opportunities for better use of the segmentation in the growing Sonitemarket.
To make their decisions for Period 1, the firms do not have all the information contained inthis chapter as marketing research studies are not available in Period 0. The situation mayhave changed somewhat by the time they acquire these studies, but no drastic change in thecompetitive positions should be expected in the first simulated years before new R & D inputsare available.
- 49 -
Chapter IV
OPERATING THE MARKESTRATED COMPUTER PROGRAMS
The MARKESTRATED computer programs have been written in the BASIC language for theHewlett Packard 2000 Access computer. They have been designed in a modular fashion andshould be easily adapted to other computers as core memory requirement for each module issmall. To run the MARKESTRATED programs, your computer system should have a BASICcompiler and lineprinter facility to generate the outputs. A computer terminal may be used butthe length of the output requires higher printing speeds to be feasible in most teachingsituations. If you are not familiar with your computer operations, you should give a copy of

Appendix IV, "Instructions for the implementation of the MARKESTRATED computerprograms" to your computer staff and ask them to load the programs on your system. In orderto accomodate more than 40 students in the MARKESTRATED exercise, several industriesrunning in parallel must be created. In this case, the simplest and safest approach is to usedifferent computer account numbers for each industry, each account containing a copy of theMARKESTRATED system. For instance, the computer account numbers MOOT, M002 andM003 could be used for industries 1, 2 and 3, respectively.
In designing the MARKESTRATED system, a particular effort has been made to facilitate thework of the instructor. The game administrator does not need to have any computerknowledge, except knowing how to run standard programs. Although the MARKESTRATEDsystem consists of 54 programs and files, the linkages are automatically performed and thegame administrator needs to know and use only 4 programs to run the simulation:
START to initialize the data files before period 0;INPUT to enter decisions for each period;LISINP to list the decisions entered and make any corrections if necessary;MKGSTR to perform the simulation and generate the company reports, the
marketing research studies purchased by the firms, and a complete setof outputs for the instructor.
- 50 -
In addition, the instructor may call on six other programs to facilitate his administration of thegame, although'their use is not necessary to run the simulation:
OUTPUT generates additional copies of the company reports for the last periodrun, the marketing research studies purchasbd by .he firms, and thecomplete set of outputs for the game administrator;
ADMOUT generates for the last period run additional copies of the complete set ofoutputs for the game administrator;
PRESEN presents an analysis of selected simulation results over the entiresimulated horizon, both in tabular and graphiccal form;
INTEST allows the game administrator to use pre-recorded test decisions over10 periods to familiarize himSEFA with the game;
RESET resets all files to the previous period situation in case an input error hasbeen noticed after the start of the simulation for the current period.
The following sections will describe the operations of these programs. All programsare operated interactively in time-sharing from a computer terminal and the longer outputs aregenerated on a lineprinter. The examples given as illustrations have been obtained on aHewlett Packard 2000 Access system. In these examples, items typed by the game adminis-trator on the computer terminal have been underlined. The part of the text which is notunderlined has been generated automatically by the computer programs.

EXHIBIT 4.1
INFORMATION GENERATED BY THE PRESEN PROGRAM
Tables1. Total industry sales2. Market share of Sonite brands (based on units)3. Company market shares in Sonite market (based on units)4. Company market shares in Sonite market (based on retail sales)5. Market share of Vodite brands (based on units)6. Company market shares in Vodite market (based on retail sales)7. Global company market shares in Sonite and Vodite markets (based on retail sales)8. Company net marketing contributions9. Brand awareness for Sonite brands10. Advertising expenses for Sonite brands 11. Company sales force sizes.

- 63 -
Chapter V
THE STRUCTURE OF THE MARKESTRATED SIMULATION MODEL
This chapter describes the structure of the MARKESTRATED simulation model in a non-technical way. Relationships are presented in a graphical fashion to provide an easyvisualization of the processes modelled. The mathematical expressions of these relationshipsare given in Appendix V for the .interested reader.
The overall structure of the MARKESTRATED simulation model is presented in Exhibit 5.1and each of its elements will be described in detail. This description is based on the standardversion of MARKESTRATED, i.e. the one corresponding to the parameter values set in theMARKESTRATED package. These parameter values provide, in our opinion, the mostefficient pedagogical environment.
l. CORRECTIONS IN INPUT DECISIONS
The MARKESTRATED programs first check that the input decisions are consistent withindustry practices as defined in the student's manual, with corporate guidelines such as themarketing budget, or environmental constraints such as price controls. if any inconsistency isfound, corrective action is automatically taken, and a message is issued to the correspondingfirm. 'rile possible massages are shown and described below.
YOU DID NOT RESPECT YOUR BUDGET CONSTRAINT YOUR BUDGET WAS REDUCED ON – ADVERTISING
- R & D- MARKETING RESEARCH- SALES FORCE
If the marketing expenditures of a firm are more than 10% above the allowed marketingbudget (as specified in the company report of the previous period, or as modified by theinstructor), these expenditures are cut in the order indicated above, until the budget constraintis satisfied.. The 10% leeway has been included to decrease the importance of artificial ac-curracy in the specification of the marketing expenditures.
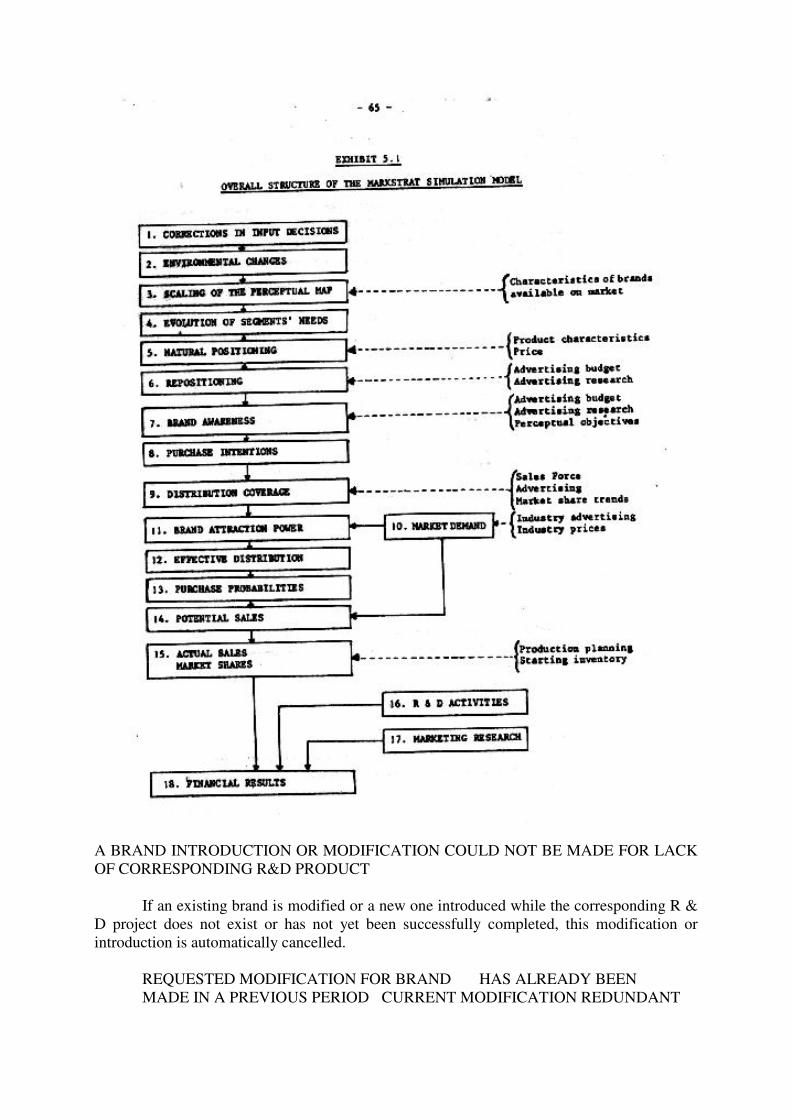
A BRAND INTRODUCTION OR MODIFICATION COULD NOT BE MADE FOR LACKOF CORRESPONDING R&D PRODUCT
If an existing brand is modified or a new one introduced while the corresponding R &D project does not exist or has not yet been successfully completed, this modification orintroduction is automatically cancelled.
REQUESTED MODIFICATION FOR BRAND HAS ALREADY BEENMADE IN A PREVIOUS PERIOD CURRENT MODIFICATION REDUNDANT
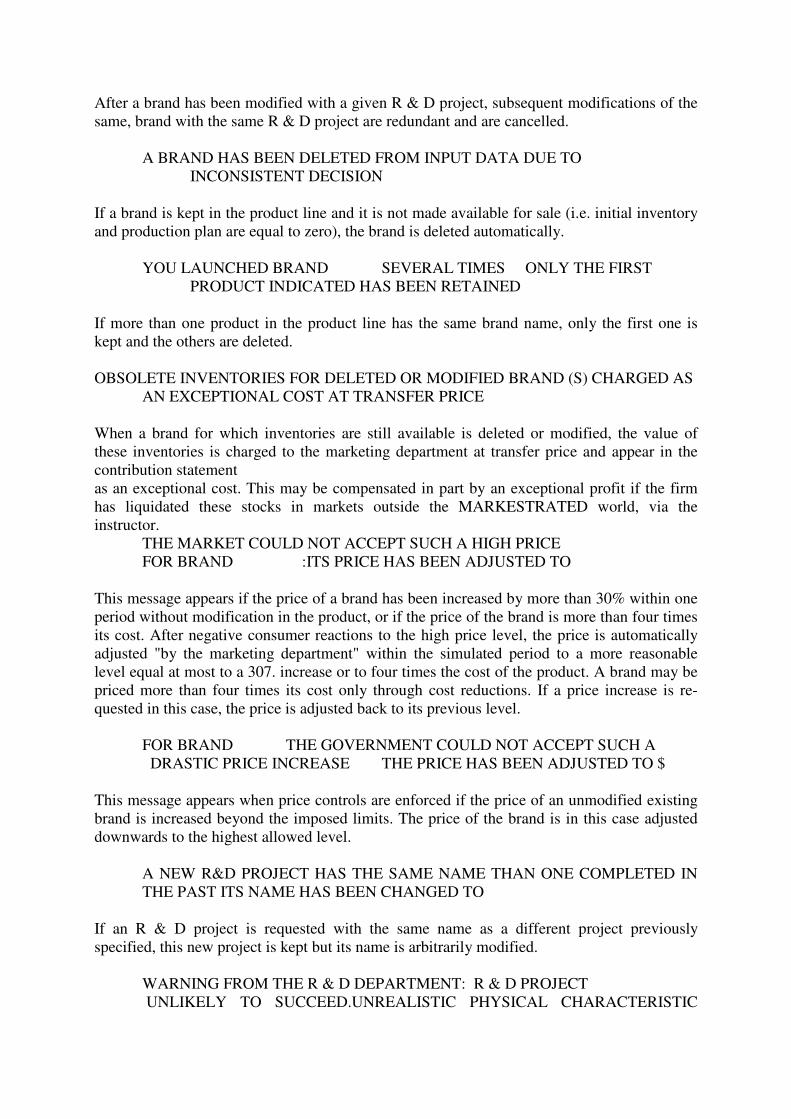
After a brand has been modified with a given R & D project, subsequent modifications of thesame, brand with the same R & D project are redundant and are cancelled.
A BRAND HAS BEEN DELETED FROM INPUT DATA DUE TOINCONSISTENT DECISION
If a brand is kept in the product line and it is not made available for sale (i.e. initial inventoryand production plan are equal to zero), the brand is deleted automatically.
YOU LAUNCHED BRAND SEVERAL TIMES ONLY THE FIRSTPRODUCT INDICATED HAS BEEN RETAINED
If more than one product in the product line has the same brand name, only the first one iskept and the others are deleted.
OBSOLETE INVENTORIES FOR DELETED OR MODIFIED BRAND (S) CHARGED ASAN EXCEPTIONAL COST AT TRANSFER PRICE
When a brand for which inventories are still available is deleted or modified, the value ofthese inventories is charged to the marketing department at transfer price and appear in thecontribution statementas an exceptional cost. This may be compensated in part by an exceptional profit if the firmhas liquidated these stocks in markets outside the MARKESTRATED world, via theinstructor.
THE MARKET COULD NOT ACCEPT SUCH A HIGH PRICEFOR BRAND :ITS PRICE HAS BEEN ADJUSTED TO
This message appears if the price of a brand has been increased by more than 30% within oneperiod without modification in the product, or if the price of the brand is more than four timesits cost. After negative consumer reactions to the high price level, the price is automaticallyadjusted "by the marketing department" within the simulated period to a more reasonablelevel equal at most to a 307. increase or to four times the cost of the product. A brand may bepriced more than four times its cost only through cost reductions. If a price increase is re-quested in this case, the price is adjusted back to its previous level.
FOR BRAND THE GOVERNMENT COULD NOT ACCEPT SUCH A DRASTIC PRICE INCREASE THE PRICE HAS BEEN ADJUSTED TO $
This message appears when price controls are enforced if the price of an unmodified existingbrand is increased beyond the imposed limits. The price of the brand is in this case adjusteddownwards to the highest allowed level.
A NEW R&D PROJECT HAS THE SAME NAME THAN ONE COMPLETED INTHE PAST ITS NAME HAS BEEN CHANGED TO
If an R & D project is requested with the same name as a different project previouslyspecified, this new project is kept but its name is arbitrarily modified.
WARNING FROM THE R & D DEPARTMENT: R & D PROJECTUNLIKELY TO SUCCEED.UNREALISTIC PHYSICAL CHARACTERISTIC
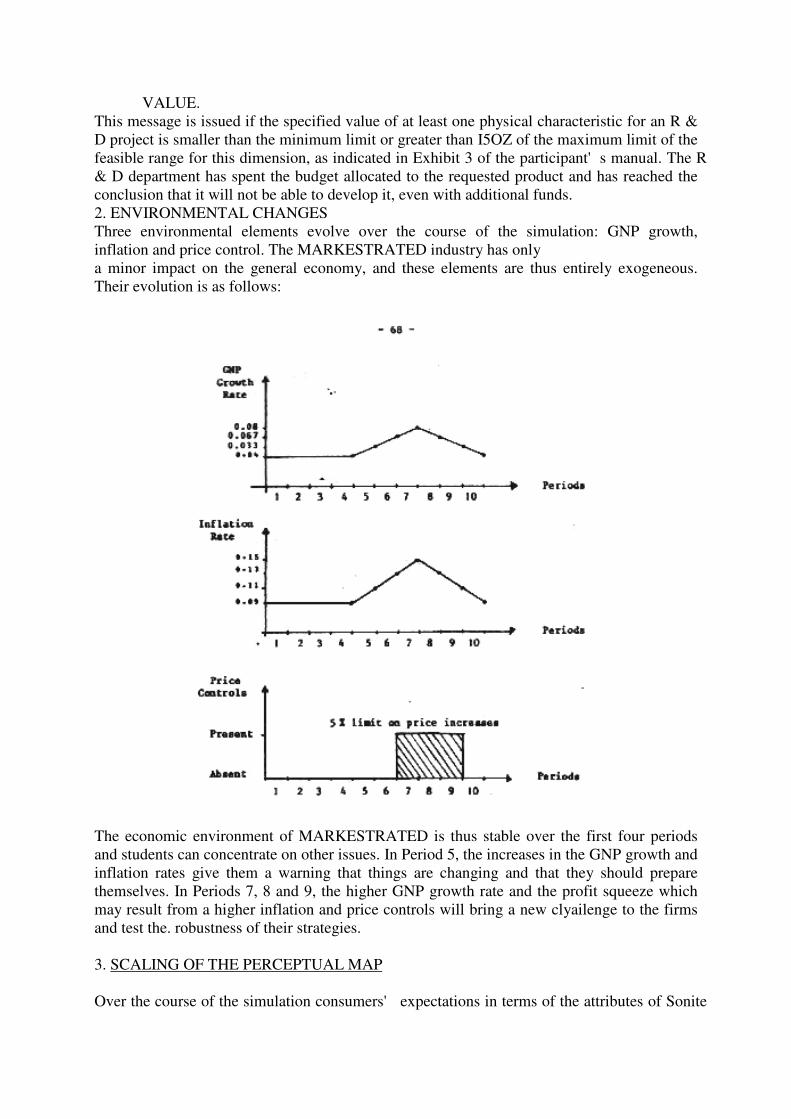
VALUE.This message is issued if the specified value of at least one physical characteristic for an R &D project is smaller than the minimum limit or greater than I5OZ of the maximum limit of thefeasible range for this dimension, as indicated in Exhibit 3 of the participant's manual. The R& D department has spent the budget allocated to the requested product and has reached theconclusion that it will not be able to develop it, even with additional funds.2. ENVIRONMENTAL CHANGESThree environmental elements evolve over the course of the simulation: GNP growth,inflation and price control. The MARKESTRATED industry has onlya minor impact on the general economy, and these elements are thus entirely exogeneous.Their evolution is as follows:
The economic environment of MARKESTRATED is thus stable over the first four periodsand students can concentrate on other issues. In Period 5, the increases in the GNP growth andinflation rates give them a warning that things are changing and that they should preparethemselves. In Periods 7, 8 and 9, the higher GNP growth rate and the profit squeeze whichmay result from a higher inflation and price controls will bring a new clyailenge to the firmsand test the. robustness of their strategies.
3. SCALING OF THE PERCEPTUAL MAP
Over the course of the simulation consumers' expectations in terms of the attributes of Sonite
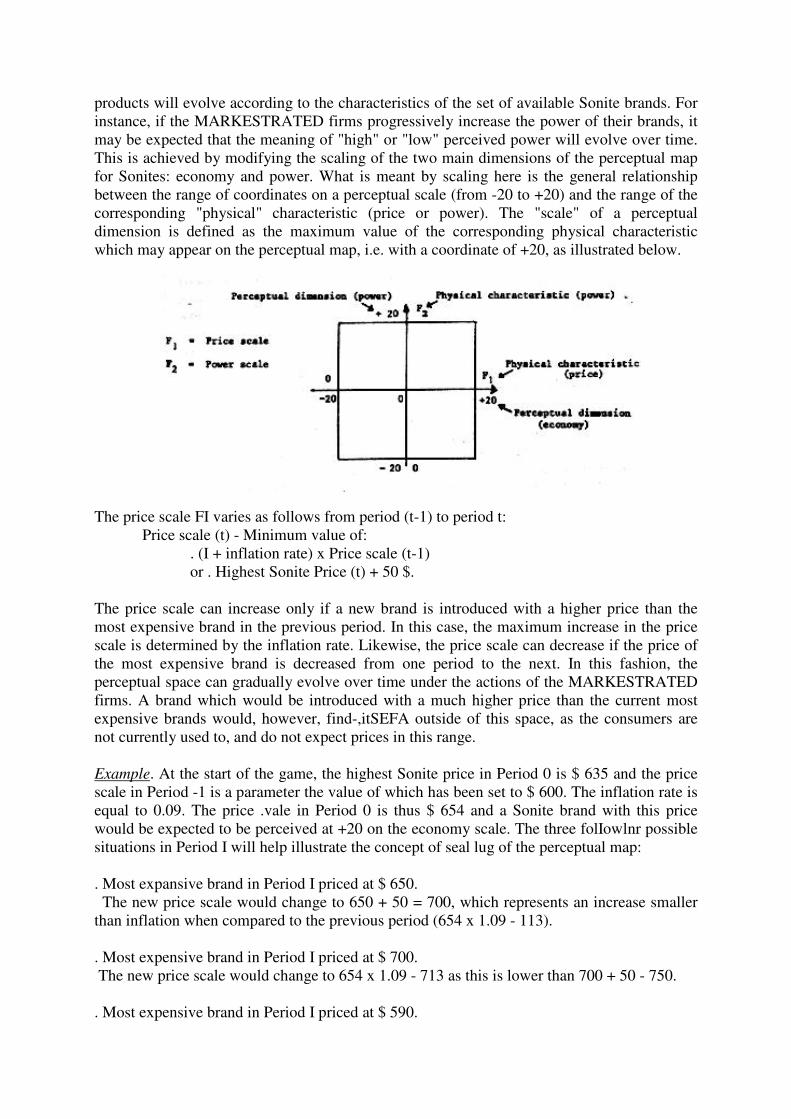
products will evolve according to the characteristics of the set of available Sonite brands. Forinstance, if the MARKESTRATED firms progressively increase the power of their brands, itmay be expected that the meaning of "high" or "low" perceived power will evolve over time.This is achieved by modifying the scaling of the two main dimensions of the perceptual mapfor Sonites: economy and power. What is meant by scaling here is the general relationshipbetween the range of coordinates on a perceptual scale (from -20 to +20) and the range of thecorresponding "physical" characteristic (price or power). The "scale" of a perceptualdimension is defined as the maximum value of the corresponding physical characteristicwhich may appear on the perceptual map, i.e. with a coordinate of +20, as illustrated below.
The price scale FI varies as follows from period (t-1) to period t:Price scale (t) - Minimum value of:
. (I + inflation rate) x Price scale (t-1)or . Highest Sonite Price (t) + 50 $.
The price scale can increase only if a new brand is introduced with a higher price than themost expensive brand in the previous period. In this case, the maximum increase in the pricescale is determined by the inflation rate. Likewise, the price scale can decrease if the price ofthe most expensive brand is decreased from one period to the next. In this fashion, theperceptual space can gradually evolve over time under the actions of the MARKESTRATEDfirms. A brand which would be introduced with a much higher price than the current mostexpensive brands would, however, find-,itSEFA outside of this space, as the consumers arenot currently used to, and do not expect prices in this range.
Example. At the start of the game, the highest Sonite price in Period 0 is $ 635 and the pricescale in Period -1 is a parameter the value of which has been set to $ 600. The inflation rate isequal to 0.09. The price .vale in Period 0 is thus $ 654 and a Sonite brand with this pricewould be expected to be perceived at +20 on the economy scale. The three folIowlnr possiblesituations in Period I will help illustrate the concept of seal lug of the perceptual map:
. Most expansive brand in Period I priced at $ 650. The new price scale would change to 650 + 50 = 700, which represents an increase smallerthan inflation when compared to the previous period (654 x 1.09 - 113).
. Most expensive brand in Period I priced at $ 700. The new price scale would change to 654 x 1.09 - 713 as this is lower than 700 + 50 - 750.
. Most expensive brand in Period I priced at $ 590.

The new price scale would change to 590 + 50 = 640.In these three cases, a "high" perceived price (corresponding to +20 on the economy
perceptual dimension) is respectively $ 700, $ 713 and $ 640. and this represents a changecompared to the previous period.
The power dimension is treated in a way similar to the price dimension, and the powerscale F2 varies as follows:
Power scale (t) = Minimum value of:. (1 + "power inflation rate" x Power scale (t-1);or. Highest Sonite power (t) + 10 w.
The "power inflation rate" represents the maximum proportional increase in the power scaleover one year and is set equal to 0.06.
For the Vodites, the scales for the major perceptual dimensions (maximum frequency andweight) remain constant and equal to the maximum limit of their feasible range as indicated inExhibit 3 of the student's manual (20,000 Hz and 100 g respectively). This reflects twodifferent phenomena in two different markets.
4. EVOLUTION OF SEGMENTS' NEEDS
In both the Sonite and Vodite markets, the "true" model of brand preferences and similaritiesis represented as a three-dimensional space, with the same dimensions as those reported in thesemantic scales marketing research studies. In the Sonite perceptual map study,, only the firsttwo dimensions are reported and positions of the segments' ideal points and of the brands aregenerated from the "true" model with some minor random errors.
The evolution of segments' needs is represented by changes in the positions of the segments'ideal points on the three-dimensional space. These changes follow a linear trajectory fromPeriod I to Period 10, although this does not appear clearly in the comparison of successiveperceptual maps because of the random errors. The coordinates of the ideal points for the fivesegments in the Sonite market in Periods I and 10 are the following (on -20 to +20 scales):
AXIS 1(Economy)
AXIS 2(Power)
AXIS 3(Design)SEGMENT
Period 1 Period 10 Period 1 Period 10 Period 1 Period 10
Segment 1 -2 7 15.4 12.7 8 8Segment 2 -6 10.5 0.4 11.2 10.4 12.2Segment 3 9 19 8.4 14.7 9.6 7.8Segment 4 10 6.5 3.4 -3.8 12.4 9.8Segment 5 -13 -13 -9.2 -1.1 12.4 9.8
On the perceptual map reported in Marketing Research Study 5 which includesonly the two main dimensions Economy and Power, the trajectory of the ideal pointsappears as follows:

This evolution in the positions of the ideal points may be interpreted as changes in theunderlying segments' needs, irrespective of the actions taken by the firms in the Sonitemarket. The coordinates of the ideal points for a given period will be the same in differentadministrations of the game. However, the meaning of the coordinates in terms of physicalcharacteristics values will change depending on the scales of the dimensions and consequentlyon the features of the brands offered on the market, as described in the previous section. Inthis sense, both the changes in the underlying segments' needs and the actions of the firms inthe market are reflected on the evolution of the ideal points.
In the Vodite market, no difference is observed in the needs and behavior of consumers in thefive segments isolated in the Sonite market. The differences which are reported in themarketing research studies in the Vodite market are only due to random errors. The aggregateideal point in the Vodite market also follows a linear trajectory in the three dimensionalperceptual space, and its coordinates in Periods i and 10 are the following (on -20 to 20scales):
AXIS I(Maximum Frequency)
AXIS 2(Weight)
AXIS 3(Economy)
Period I Period 10 Period 1 Period 10 Period 1 Period 10Aggregate idealpoint coordinatesin Vodite market
-2 +11.5 -2 -1 -7 -16
Finally, it is interesting to note that in the Sonita market, various brands may expariencapositive or negative price elasticities depending on their positioning with respect to thedifferent segments. In the Vodite market, however, most brands should experience negativeprice elasticities as the ideal point corresponds to a low price level.
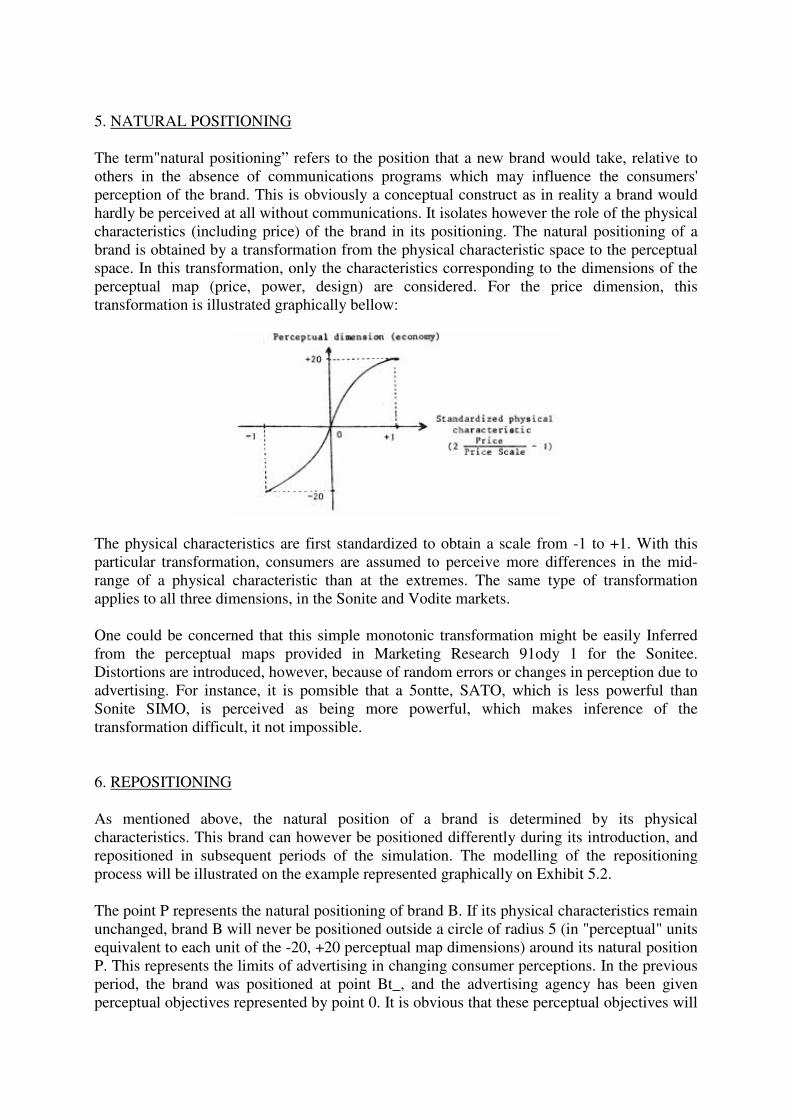
5. NATURAL POSITIONING
The term"natural positioning” refers to the position that a new brand would take, relative toothers in the absence of communications programs which may influence the consumers'perception of the brand. This is obviously a conceptual construct as in reality a brand wouldhardly be perceived at all without communications. It isolates however the role of the physicalcharacteristics (including price) of the brand in its positioning. The natural positioning of abrand is obtained by a transformation from the physical characteristic space to the perceptualspace. In this transformation, only the characteristics corresponding to the dimensions of theperceptual map (price, power, design) are considered. For the price dimension, thistransformation is illustrated graphically bellow:
The physical characteristics are first standardized to obtain a scale from -1 to +1. With thisparticular transformation, consumers are assumed to perceive more differences in the mid-range of a physical characteristic than at the extremes. The same type of transformationapplies to all three dimensions, in the Sonite and Vodite markets.
One could be concerned that this simple monotonic transformation might be easily Inferredfrom the perceptual maps provided in Marketing Research 91ody 1 for the Sonitee.Distortions are introduced, however, because of random errors or changes in perception due toadvertising. For instance, it is pomsible that a 5ontte, SATO, which is less powerful thanSonite SIMO, is perceived as being more powerful, which makes inference of thetransformation difficult, it not impossible.
6. REPOSITIONING
As mentioned above, the natural position of a brand is determined by its physicalcharacteristics. This brand can however be positioned differently during its introduction, andrepositioned in subsequent periods of the simulation. The modelling of the repositioningprocess will be illustrated on the example represented graphically on Exhibit 5.2.
The point P represents the natural positioning of brand B. If its physical characteristics remainunchanged, brand B will never be positioned outside a circle of radius 5 (in "perceptual" unitsequivalent to each unit of the -20, +20 perceptual map dimensions) around its natural positionP. This represents the limits of advertising in changing consumer perceptions. In the previousperiod, the brand was positioned at point Bt_, and the advertising agency has been givenperceptual objectives represented by point 0. It is obvious that these perceptual objectives will

not be completely reached, as point 0 lies outside the circle. The problem is to know wherebrand B will be positioned at the end of the current period, i.e. where point Bt will be located.
The first step which the model takes is to determine the direction in which brand B will berepositioned, and this direction may be different from the one desired if insufficient effortshave been made in advertis-
Bt-1 = Positioning of brand B at period t-1P = Natural positioning of brand BO = Perceptual objective in period tv = Maximum angle of deviation from objective given advertising research
expenditures, in time t∝ = Angle of deviation from objective, randomly generated within ±vr = Maximum possible distance from original positioning (5 perceptual" units)M = Farthest repositioning possible given the direction n of repositioningBt = Repositioning of brand B at period t on the Bt-1, M line.
The distance of translation Bt-1, Bt depends on awareness of B and mediaexpenditures.
EXHIBIT 5.2
BRAND REPOSITIONING
ing research. The maximum angle of deviation v from the intended dire, tion varies with theadvertising research budget as follows:
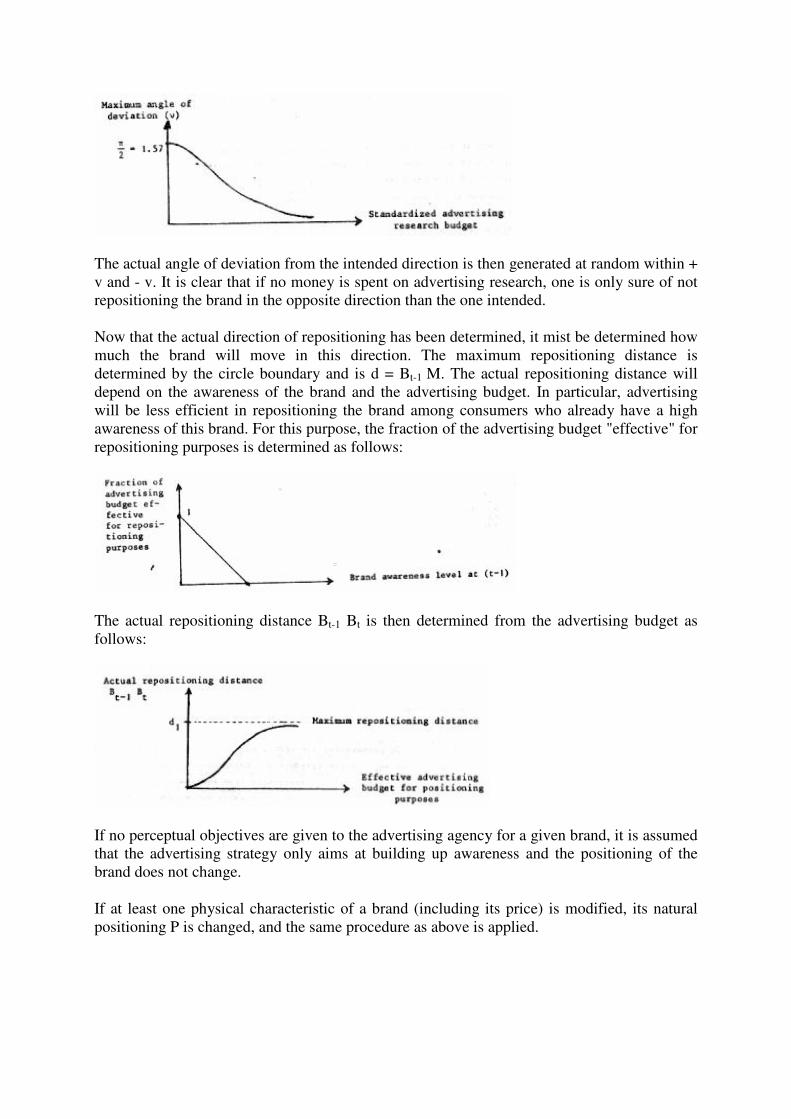
The actual angle of deviation from the intended direction is then generated at random within +v and - v. It is clear that if no money is spent on advertising research, one is only sure of notrepositioning the brand in the opposite direction than the one intended.
Now that the actual direction of repositioning has been determined, it mist be determined howmuch the brand will move in this direction. The maximum repositioning distance isdetermined by the circle boundary and is d = Bt-1 M. The actual repositioning distance willdepend on the awareness of the brand and the advertising budget. In particular, advertisingwill be less efficient in repositioning the brand among consumers who already have a highawareness of this brand. For this purpose, the fraction of the advertising budget "effective" forrepositioning purposes is determined as follows:
The actual repositioning distance Bt-1 Bt is then determined from the advertising budget asfollows:
If no perceptual objectives are given to the advertising agency for a given brand, it is assumedthat the advertising strategy only aims at building up awareness and the positioning of thebrand does not change.
If at least one physical characteristic of a brand (including its price) is modified, its naturalpositioning P is changed, and the same procedure as above is applied.
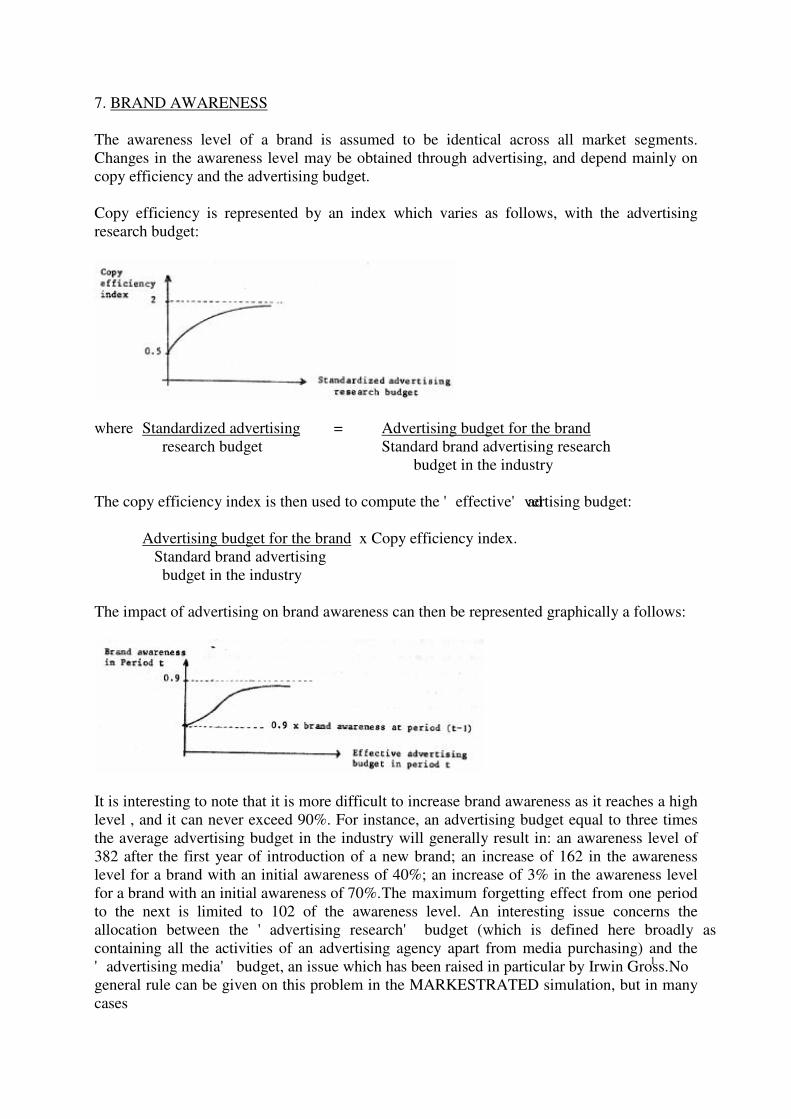
7. BRAND AWARENESS
The awareness level of a brand is assumed to be identical across all market segments.Changes in the awareness level may be obtained through advertising, and depend mainly oncopy efficiency and the advertising budget.
Copy efficiency is represented by an index which varies as follows, with the advertisingresearch budget:
where Standardized advertising = Advertising budget for the brand research budget Standard brand advertising research
budget in the industry
The copy efficiency index is then used to compute the 'effective' advertising budget:
Advertising budget for the brand x Copy efficiency index. Standard brand advertising budget in the industry
The impact of advertising on brand awareness can then be represented graphically a follows:
It is interesting to note that it is more difficult to increase brand awareness as it reaches a highlevel , and it can never exceed 90%. For instance, an advertising budget equal to three timesthe average advertising budget in the industry will generally result in: an awareness level of382 after the first year of introduction of a new brand; an increase of 162 in the awarenesslevel for a brand with an initial awareness of 40%; an increase of 3% in the awareness levelfor a brand with an initial awareness of 70%.The maximum forgetting effect from one periodto the next is limited to 102 of the awareness level. An interesting issue concerns theallocation between the 'advertising research' budget (which is defined here broadly ascontaining all the activities of an advertising agency apart from media purchasing) and the'advertising media' budget, an issue which has been raised in particular by Irwin Gross.1 Nogeneral rule can be given on this problem in the MARKESTRATED simulation, but in manycases
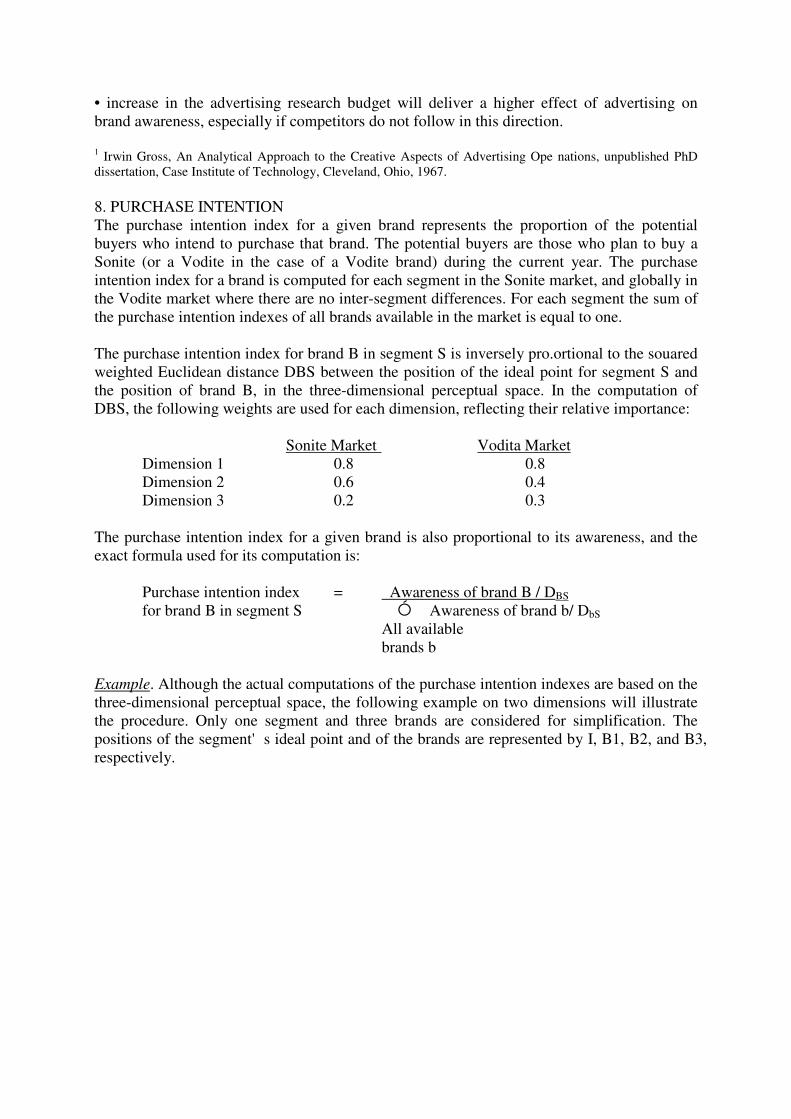
• increase in the advertising research budget will deliver a higher effect of advertising onbrand awareness, especially if competitors do not follow in this direction.
1 Irwin Gross, An Analytical Approach to the Creative Aspects of Advertising Ope nations, unpublished PhDdissertation, Case Institute of Technology, Cleveland, Ohio, 1967.
8. PURCHASE INTENTIONThe purchase intention index for a given brand represents the proportion of the potentialbuyers who intend to purchase that brand. The potential buyers are those who plan to buy aSonite (or a Vodite in the case of a Vodite brand) during the current year. The purchaseintention index for a brand is computed for each segment in the Sonite market, and globally inthe Vodite market where there are no inter-segment differences. For each segment the sum ofthe purchase intention indexes of all brands available in the market is equal to one.
The purchase intention index for brand B in segment S is inversely pro.ortional to the souaredweighted Euclidean distance DBS between the position of the ideal point for segment S andthe position of brand B, in the three-dimensional perceptual space. In the computation ofDBS, the following weights are used for each dimension, reflecting their relative importance:
Sonite Market Vodita MarketDimension 1 0.8 0.8Dimension 2 0.6 0.4Dimension 3 0.2 0.3
The purchase intention index for a given brand is also proportional to its awareness, and theexact formula used for its computation is:
Purchase intention index = Awareness of brand B / DBS
for brand B in segment S Ó Awareness of brand b/ DbS
All availablebrands b
Example. Although the actual computations of the purchase intention indexes are based on thethree-dimensional perceptual space, the following example on two dimensions will illustratethe procedure. Only one segment and three brands are considered for simplification. Thepositions of the segment's ideal point and of the brands are represented by I, B1, B2, and B3,respectively.
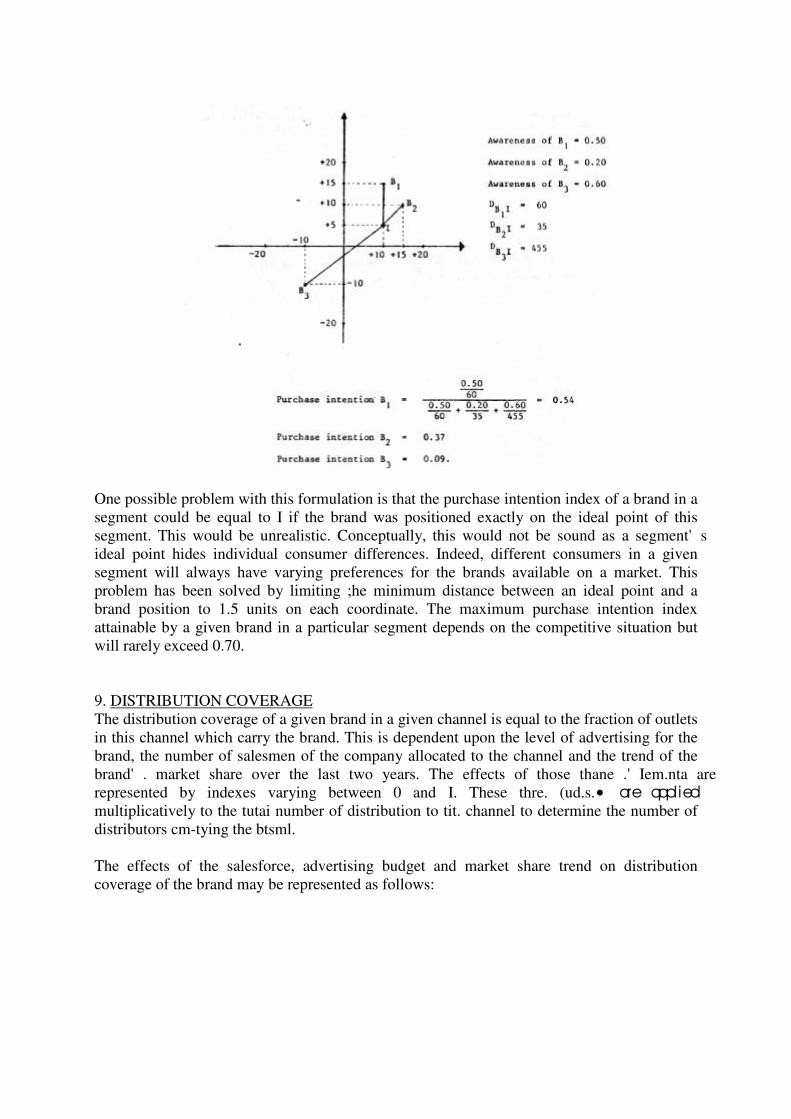
One possible problem with this formulation is that the purchase intention index of a brand in asegment could be equal to I if the brand was positioned exactly on the ideal point of thissegment. This would be unrealistic. Conceptually, this would not be sound as a segment'sideal point hides individual consumer differences. Indeed, different consumers in a givensegment will always have varying preferences for the brands available on a market. Thisproblem has been solved by limiting ;he minimum distance between an ideal point and abrand position to 1.5 units on each coordinate. The maximum purchase intention indexattainable by a given brand in a particular segment depends on the competitive situation butwill rarely exceed 0.70.
9. DISTRIBUTION COVERAGEThe distribution coverage of a given brand in a given channel is equal to the fraction of outletsin this channel which carry the brand. This is dependent upon the level of advertising for thebrand, the number of salesmen of the company allocated to the channel and the trend of thebrand'. market share over the last two years. The effects of those thane .'Iem.nta arerepresented by indexes varying between 0 and I. These thre. (ud.s.• are appliedmultiplicatively to the tutai number of distribution to tit. channel to determine the number ofdistributors cm-tying the btsml.
The effects of the salesforce, advertising budget and market share trend on distributioncoverage of the brand may be represented as follows:
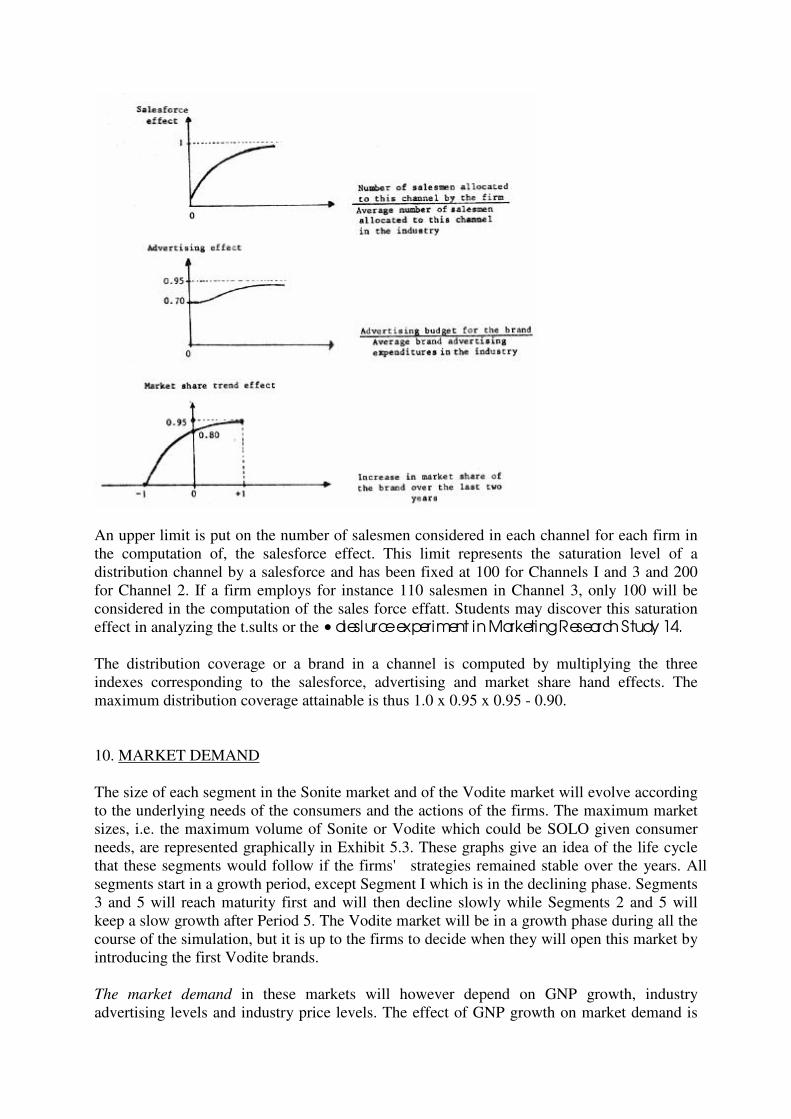
An upper limit is put on the number of salesmen considered in each channel for each firm inthe computation of, the salesforce effect. This limit represents the saturation level of adistribution channel by a salesforce and has been fixed at 100 for Channels I and 3 and 200for Channel 2. If a firm employs for instance 110 salesmen in Channel 3, only 100 will beconsidered in the computation of the sales force effatt. Students may discover this saturationeffect in analyzing the t.sults or the • aleslurce experiment in Marketing Research Study 14.
The distribution coverage or a brand in a channel is computed by multiplying the threeindexes corresponding to the salesforce, advertising and market share hand effects. Themaximum distribution coverage attainable is thus 1.0 x 0.95 x 0.95 - 0.90.
10. MARKET DEMAND
The size of each segment in the Sonite market and of the Vodite market will evolve accordingto the underlying needs of the consumers and the actions of the firms. The maximum marketsizes, i.e. the maximum volume of Sonite or Vodite which could be SOLO given consumerneeds, are represented graphically in Exhibit 5.3. These graphs give an idea of the life cyclethat these segments would follow if the firms' strategies remained stable over the years. Allsegments start in a growth period, except Segment I which is in the declining phase. Segments3 and 5 will reach maturity first and will then decline slowly while Segments 2 and 5 willkeep a slow growth after Period 5. The Vodite market will be in a growth phase during all thecourse of the simulation, but it is up to the firms to decide when they will open this market byintroducing the first Vodite brands.
The market demand in these markets will however depend on GNP growth, industryadvertising levels and industry price levels. The effect of GNP growth on market demand is
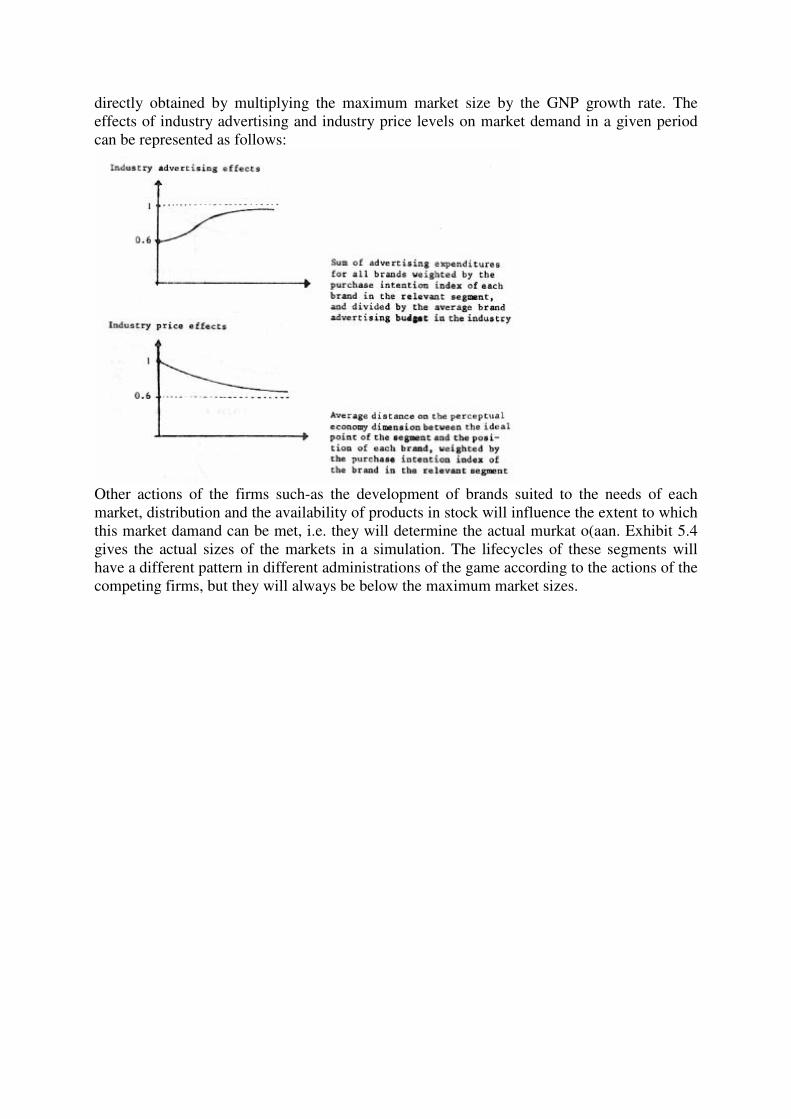
directly obtained by multiplying the maximum market size by the GNP growth rate. Theeffects of industry advertising and industry price levels on market demand in a given periodcan be represented as follows:
Other actions of the firms such-as the development of brands suited to the needs of eachmarket, distribution and the availability of products in stock will influence the extent to whichthis market damand can be met, i.e. they will determine the actual murkat o(aan. Exhibit 5.4gives the actual sizes of the markets in a simulation. The lifecycles of these segments willhave a different pattern in different administrations of the game according to the actions of thecompeting firms, but they will always be below the maximum market sizes.

EXHIBIT 5.3
MAXIMUM MARKET SIZES
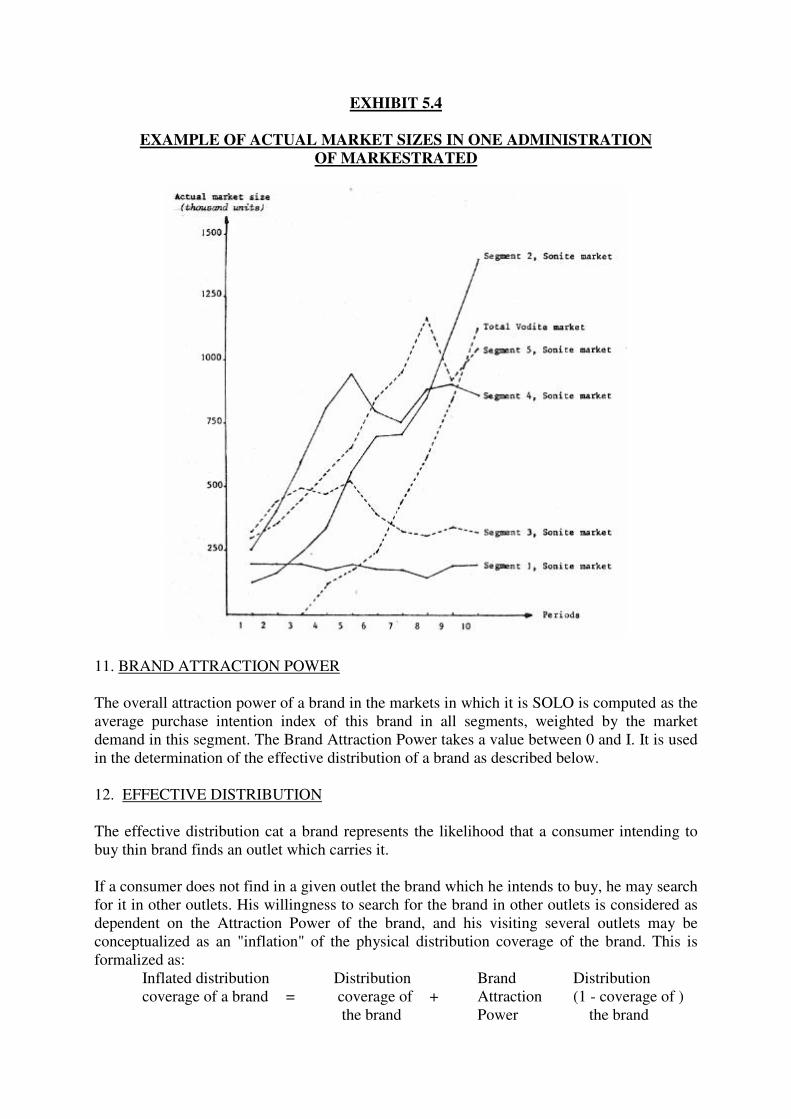
EXHIBIT 5.4
EXAMPLE OF ACTUAL MARKET SIZES IN ONE ADMINISTRATIONOF MARKESTRATED
11. BRAND ATTRACTION POWER
The overall attraction power of a brand in the markets in which it is SOLO is computed as theaverage purchase intention index of this brand in all segments, weighted by the marketdemand in this segment. The Brand Attraction Power takes a value between 0 and I. It is usedin the determination of the effective distribution of a brand as described below.
12. EFFECTIVE DISTRIBUTION
The effective distribution cat a brand represents the likelihood that a consumer intending tobuy thin brand finds an outlet which carries it.
If a consumer does not find in a given outlet the brand which he intends to buy, he may searchfor it in other outlets. His willingness to search for the brand in other outlets is considered asdependent on the Attraction Power of the brand, and his visiting several outlets may beconceptualized as an "inflation" of the physical distribution coverage of the brand. This isformalized as:
Inflated distribution Distribution Brand Distributioncoverage of a brand = coverage of + Attraction (1 - coverage of )
the brand Power the brand
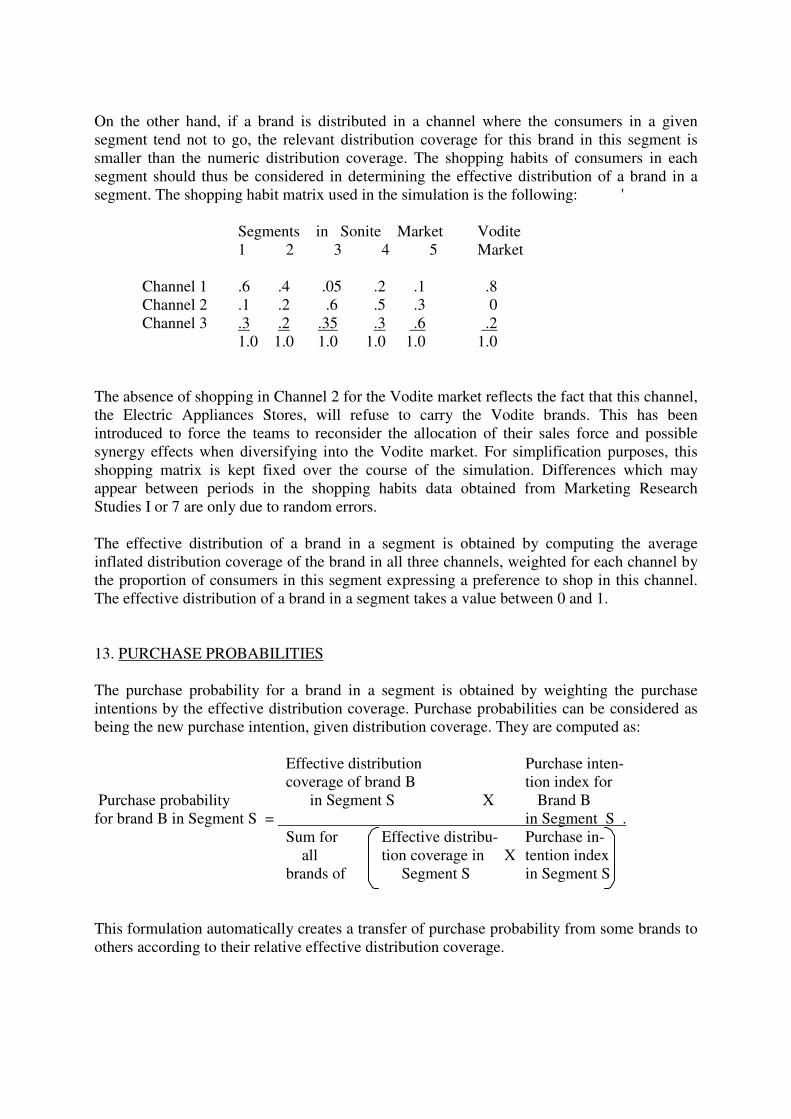
On the other hand, if a brand is distributed in a channel where the consumers in a givensegment tend not to go, the relevant distribution coverage for this brand in this segment issmaller than the numeric distribution coverage. The shopping habits of consumers in eachsegment should thus be considered in determining the effective distribution of a brand in asegment. The shopping habit matrix used in the simulation is the following: '
Segments in Sonite Market Vodite1 2 3 4 5 Market
Channel 1 .6 .4 .05 .2 .1 .8Channel 2 .1 .2 .6 .5 .3 0Channel 3 .3 .2 .35 .3 .6 .2
1.0 1.0 1.0 1.0 1.0 1.0
The absence of shopping in Channel 2 for the Vodite market reflects the fact that this channel,the Electric Appliances Stores, will refuse to carry the Vodite brands. This has beenintroduced to force the teams to reconsider the allocation of their sales force and possiblesynergy effects when diversifying into the Vodite market. For simplification purposes, thisshopping matrix is kept fixed over the course of the simulation. Differences which mayappear between periods in the shopping habits data obtained from Marketing ResearchStudies I or 7 are only due to random errors.
The effective distribution of a brand in a segment is obtained by computing the averageinflated distribution coverage of the brand in all three channels, weighted for each channel bythe proportion of consumers in this segment expressing a preference to shop in this channel.The effective distribution of a brand in a segment takes a value between 0 and 1.
13. PURCHASE PROBABILITIES
The purchase probability for a brand in a segment is obtained by weighting the purchaseintentions by the effective distribution coverage. Purchase probabilities can be considered asbeing the new purchase intention, given distribution coverage. They are computed as:
Effective distribution Purchase inten-coverage of brand B tion index for
Purchase probability in Segment S X Brand Bfor brand B in Segment S = in Segment S .
Sum for Effective distribu- Purchase in- all tion coverage in X tention indexbrands of Segment S in Segment S
This formulation automatically creates a transfer of purchase probability from some brands toothers according to their relative effective distribution coverage.
14. POTENTIAL SALES
Potential sales of a brand represent the expected salon Invvl o1 1111.1 brand if adequatesupplies are available for all brands ,it 1ha ulalpal. The potential sales of a given brand in agiven segment i• equal to lba total demand in the segment multiplied by the purchaseprubability of the brand in the segment. Total potential sales of a given brand are equal to thesum of the potential sales of the brand in each augment.
15. ACTUAL SALES AND MARKET SHARES
Actual sales may differ from potential sales because of inadequate supply of some brands onthe market. They may be lower than potential sales for a given brand if this brand has beenout of stock. They may be higher than potential sales for a given brand if this brand hasbenefited from the unavailability of competing brands.
In computing actual sales, the production level can be adjusted within a ±20% limit to reflectadaptation of the production planning during the simulated year. If potential sales are higherthan forecasted sales (i.e. the production planning level plus the inventory at the end of theprevious period), production planning may be adjusted up to 20% to satisfy the higherdemand. _If despite these production adjustments some brands incur lost sales, 50% of theselost sales are shifted to other brands, proportional to their market shares, and up to theirmaximum production capacity. If potential sales are lower than forecasted sales, theproduction planning level is adjusted downwards within the –20% limit to decrease excess in-ventory.
Market share is then computed directly as the ratio of brand sales divided by,market sales inthe market of reference.
16. R & D ACTIVITIES
When a project is submitted to the R & D department, its characteristics are compared withthose of the existing products of thee firm. If the first five characteristics of the new projectare identical to those of an existing brand or to those of a previously completed project, thenew R & D project is clearly aimed at improving the cost of an available product. The presentcost of this product is either its transfer price if it is commercialized and has therefore alreadybenefited from manufacturing learning effects, or the sixth characteristic of the R & D projectwhich has led to its development if it is not yet produced. The "normal" budget which wouldinsure the successful completion of the now R 6 0 project is computed as $10,000 for eachreduction of $1.00 in the production cost and adjusted far inflation. For example, a reductionof $50 In the cost of a product would normally require an R & D budget equal to $500,000 inPeriod 0 and $650,000 in Period 3, taking into account the 0.09 average inflation rate.
If the requested R & D project differs on at least one of the first five characteristics of thefirm's existing products, this indicates that it requires the development of a new product, notmerely a reduction in the cost of an existing product. In this case, no reference production costis available for the desired product. A "standard" production cost is computed as a linearfunction of the first five characteristics. For instance, an increase of one unit (Watt) in thefifth physical characteristic (Power) is expected to increase production cost by $1.5/unit. The
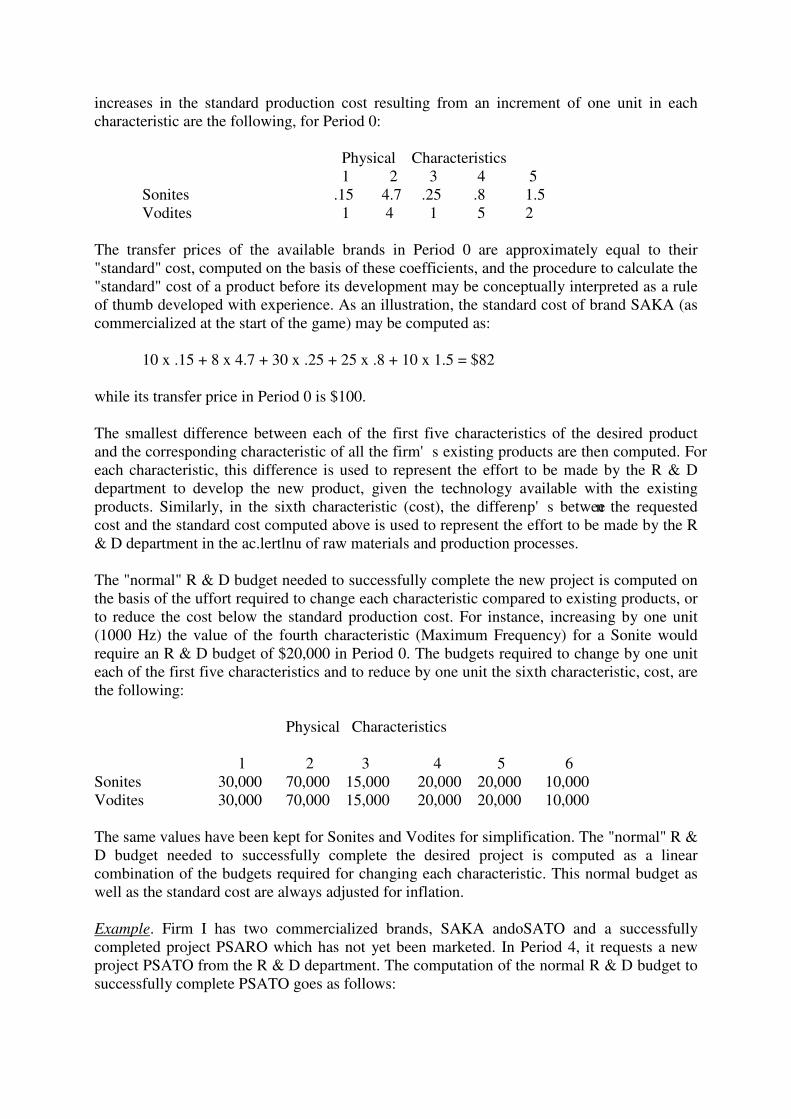
increases in the standard production cost resulting from an increment of one unit in eachcharacteristic are the following, for Period 0:
Physical Characteristics 1 2 3 4 5
Sonites .15 4.7 .25 .8 1.5Vodites 1 4 1 5 2
The transfer prices of the available brands in Period 0 are approximately equal to their"standard" cost, computed on the basis of these coefficients, and the procedure to calculate the"standard" cost of a product before its development may be conceptually interpreted as a ruleof thumb developed with experience. As an illustration, the standard cost of brand SAKA (ascommercialized at the start of the game) may be computed as:
10 x .15 + 8 x 4.7 + 30 x .25 + 25 x .8 + 10 x 1.5 = $82
while its transfer price in Period 0 is $100.
The smallest difference between each of the first five characteristics of the desired productand the corresponding characteristic of all the firm's existing products are then computed. Foreach characteristic, this difference is used to represent the effort to be made by the R & Ddepartment to develop the new product, given the technology available with the existingproducts. Similarly, in the sixth characteristic (cost), the differenp's between the requestedcost and the standard cost computed above is used to represent the effort to be made by the R& D department in the ac.lertlnu of raw materials and production processes.
The "normal" R & D budget needed to successfully complete the new project is computed onthe basis of the uffort required to change each characteristic compared to existing products, orto reduce the cost below the standard production cost. For instance, increasing by one unit(1000 Hz) the value of the fourth characteristic (Maximum Frequency) for a Sonite wouldrequire an R & D budget of $20,000 in Period 0. The budgets required to change by one uniteach of the first five characteristics and to reduce by one unit the sixth characteristic, cost, arethe following:
Physical Characteristics
1 2 3 4 5 6Sonites 30,000 70,000 15,000 20,000 20,000 10,000Vodites 30,000 70,000 15,000 20,000 20,000 10,000
The same values have been kept for Sonites and Vodites for simplification. The "normal" R &D budget needed to successfully complete the desired project is computed as a linearcombination of the budgets required for changing each characteristic. This normal budget aswell as the standard cost are always adjusted for inflation.
Example. Firm I has two commercialized brands, SAKA andoSATO and a successfullycompleted project PSARO which has not yet been marketed. In Period 4, it requests a newproject PSATO from the R & D department. The computation of the normal R & D budget tosuccessfully complete PSATO goes as follows:
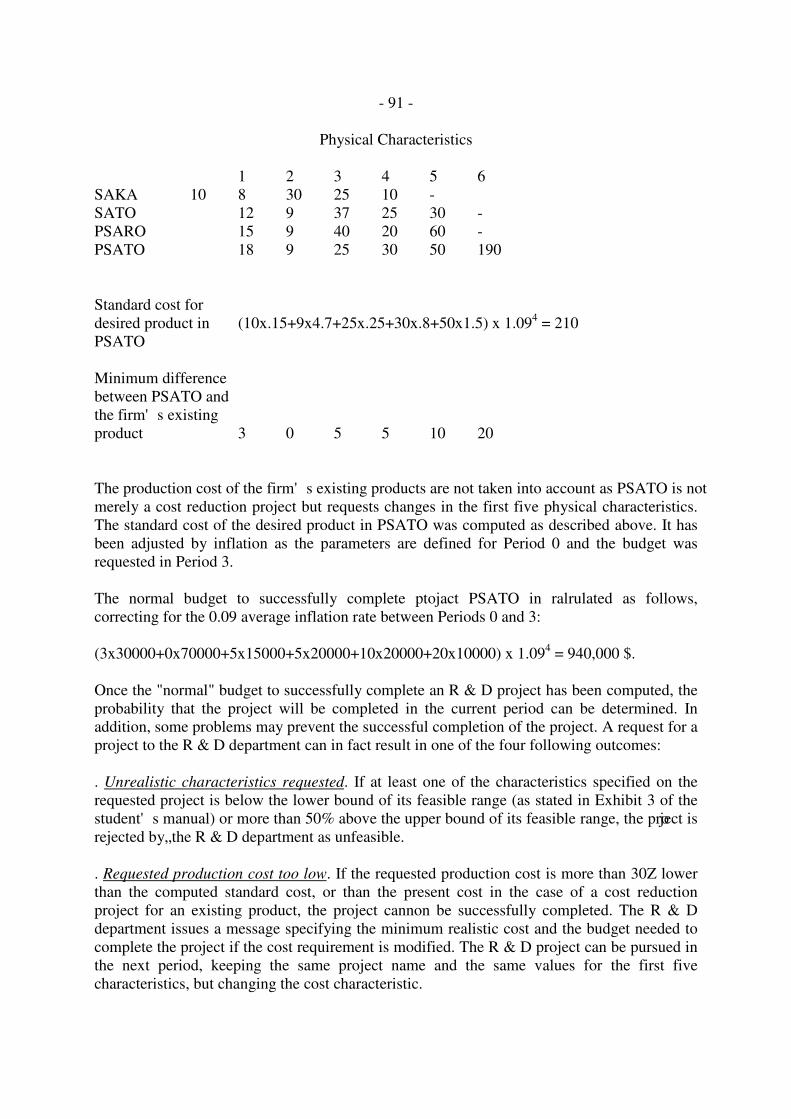
- 91 -
Physical Characteristics
1 2 3 4 5 6SAKA 10 8 30 25 10 -SATO 12 9 37 25 30 -PSARO 15 9 40 20 60 -PSATO 18 9 25 30 50 190
Standard cost fordesired product in (10x.15+9x4.7+25x.25+30x.8+50x1.5) x 1.094 = 210PSATO
Minimum differencebetween PSATO andthe firm's existingproduct 3 0 5 5 10 20
The production cost of the firm's existing products are not taken into account as PSATO is notmerely a cost reduction project but requests changes in the first five physical characteristics.The standard cost of the desired product in PSATO was computed as described above. It hasbeen adjusted by inflation as the parameters are defined for Period 0 and the budget wasrequested in Period 3.
The normal budget to successfully complete ptojact PSATO in ralrulated as follows,correcting for the 0.09 average inflation rate between Periods 0 and 3:
(3x30000+0x70000+5x15000+5x20000+10x20000+20x10000) x 1.094 = 940,000 $.
Once the "normal" budget to successfully complete an R & D project has been computed, theprobability that the project will be completed in the current period can be determined. Inaddition, some problems may prevent the successful completion of the project. A request for aproject to the R & D department can in fact result in one of the four following outcomes:
. Unrealistic characteristics requested. If at least one of the characteristics specified on therequested project is below the lower bound of its feasible range (as stated in Exhibit 3 of thestudent's manual) or more than 50% above the upper bound of its feasible range, the project isrejected by„the R & D department as unfeasible.
. Requested production cost too low. If the requested production cost is more than 30Z lowerthan the computed standard cost, or than the present cost in the case of a cost reductionproject for an existing product, the project cannon be successfully completed. The R & Ddepartment issues a message specifying the minimum realistic cost and the budget needed tocomplete the project if the cost requirement is modified. The R & D project can be pursued inthe next period, keeping the same project name and the same values for the first fivecharacteristics, but changing the cost characteristic.
. Allocated budget greater than normal budget for the project. If the cumulative budgetallocated to the project equals. or exceeds the "normal" budget as computed above, the projectwill be successfully completed.
. Allocated budget smaller than normal budget for the project. In this case, the probability thatthe project be successfully completed in the current period is equal to the ratio of thecumulative budget allocated to the project, to the "normal" budget as computed above. Thus,a project with the expenditures of 701 of "normal" budget has a 10Z chance of succeeding inthe given period. if the project is not successfully complated in the current period, the K 6 0department will issue a message specifying Lhe additional budget required, equal to thedifference between the "normal" budget and the cumulative expenditures to date on thisproject, adjusted for the estimated inflation in the next period. Pursuing the project with theadditional budget requested by the R & D department will ensure its successful completion inthe next period, provided that the cost characteristic be adjusted for inflation.
17. MARKETING RESEARCH
The information for the marketing research studies is directly extracted from the "true" modelin the simulation, with minor random variations. Only the three following studies may needsome further clarifications.
. Semantic Scales (Studies 4 and 10). These studies are generated from the three dimensionalperceptual map specified in the simulation model. The values on each semantic scale (from Ito 7) are obtained from the corresponding perceptual dimension (with values between -20 to+20) through a straight linear transformation. A procedure is used to eliminate extreme valueson the semantic scales, so that the minimum and maximum observed values are practicallylimited to 1.5 and 6.5 respectively.
. Market Forecast (Studies 6 and 11). These forecasts are obtained by applying the growthrate of the maximum market size to the current sales level in each market, as defined in Step10. These forecasts consequently assume no changes in the marketing practices of thecompeting firms in the next period, with appropriate adjustments for inflation andmaintenance of relative competition.
. Sales Force and Advertising Experiments (Studies 14 and 15). The results of theseexperiments are obtained by running the appropriate parts of the simulation model with,respectively, five additional salesmen in each channel and an increase of 10% in theadvertising budget for each brand. In addition, the results of the sales force experiment aresystematically inflated by 20% to reflect a bias which may be generated by the specialattention given to the regional test market.
18. FINANCIAL RESULTS
The computation of the financial results is straightforward from the sales level for each brand.The following points may however need some clarification.
. Productivity Gains. Production learning effects for a brand are represented by exponentiallydecreasing transfer prices in function of cumulative production. The coefficient of the
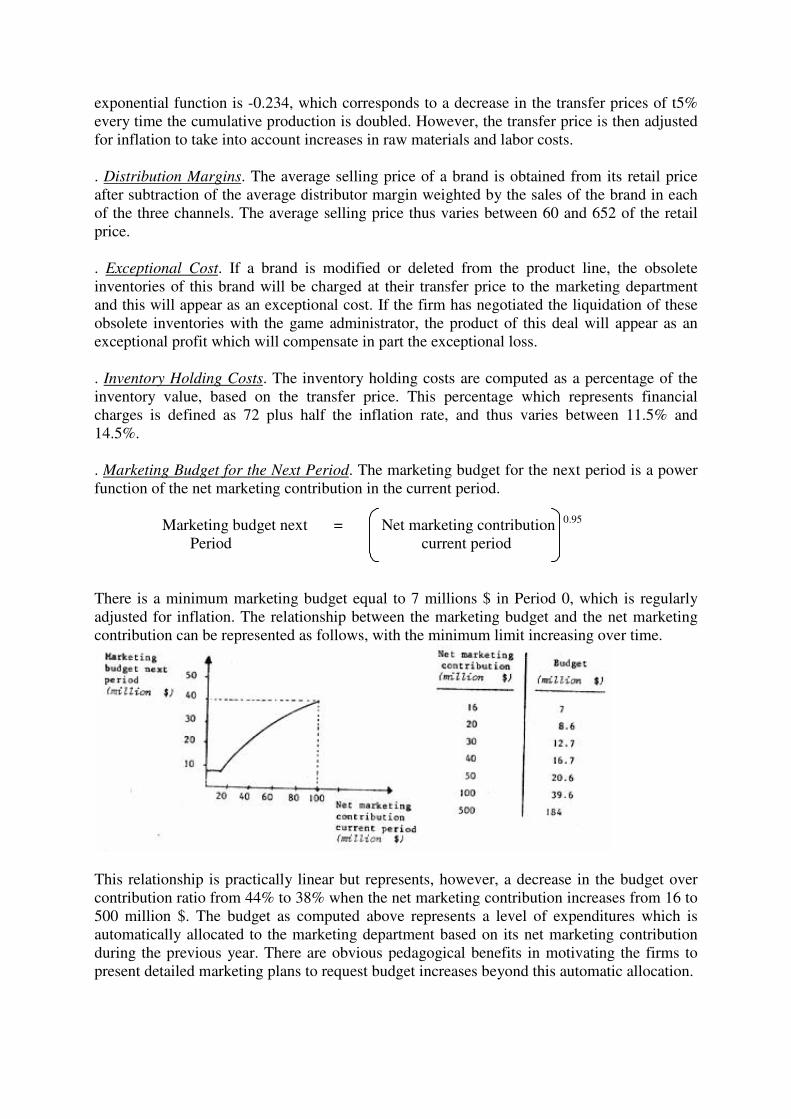
exponential function is -0.234, which corresponds to a decrease in the transfer prices of t5%every time the cumulative production is doubled. However, the transfer price is then adjustedfor inflation to take into account increases in raw materials and labor costs.
. Distribution Margins. The average selling price of a brand is obtained from its retail priceafter subtraction of the average distributor margin weighted by the sales of the brand in eachof the three channels. The average selling price thus varies between 60 and 652 of the retailprice.
. Exceptional Cost. If a brand is modified or deleted from the product line, the obsoleteinventories of this brand will be charged at their transfer price to the marketing departmentand this will appear as an exceptional cost. If the firm has negotiated the liquidation of theseobsolete inventories with the game administrator, the product of this deal will appear as anexceptional profit which will compensate in part the exceptional loss.
. Inventory Holding Costs. The inventory holding costs are computed as a percentage of theinventory value, based on the transfer price. This percentage which represents financialcharges is defined as 72 plus half the inflation rate, and thus varies between 11.5% and14.5%.
. Marketing Budget for the Next Period. The marketing budget for the next period is a powerfunction of the net marketing contribution in the current period.
Marketing budget next = Net marketing contribution 0.95
Period current period
There is a minimum marketing budget equal to 7 millions $ in Period 0, which is regularlyadjusted for inflation. The relationship between the marketing budget and the net marketingcontribution can be represented as follows, with the minimum limit increasing over time.
This relationship is practically linear but represents, however, a decrease in the budget overcontribution ratio from 44% to 38% when the net marketing contribution increases from 16 to500 million $. The budget as computed above represents a level of expenditures which isautomatically allocated to the marketing department based on its net marketing contributionduring the previous year. There are obvious pedagogical benefits in motivating the firms topresent detailed marketing plans to request budget increases beyond this automatic allocation.
CONCLUSIONS
The structure of the model has been described in the present chapter in a non-technicalfashion. The reader should now have a reasonable understanding of the various interactionsmodelled in the simulation. In particular, it is easy to comprehend the behavior ofsubelements of the model from the graphical representation of the main relationships. Thiswill be especially useful to the instructor for anticipating the evolution of the simulation andfor presenting selected parts of the model to the students in the final debriefing session.
More importantly, it should appear from the above description and from experience inadministering the game, that the MARKS'I'RAT simulation has the following attractivecharacteristics.
1. It is reasonably complete for teaching marketing strategy concepts.The completeness of MARKESTRATED compared to other games is illustrated by itsinclusion of segmentation and positioning concepts, the capability to modify existing brandsor introduce new ones, the marketing - R E D interface, the consideration of advertisingresearch and perceptual objectives in addition to the inevitable advertising budget, as well asthe availability of an extensive set of 15 marketing research studies.
2. It has an intricate structure. In MARKESTRATED there is no direct aggregate responsefunction between an element of the marketing mix and the final outcome, sales or marketshare. Instead, an element of the marketing mix generally has several effects at various levelsand often in a non-obvius fashion. For instance, advertising will have an impact onawareness, perception, preferences, purchase intentions, distribution, and primary demand.Similarly, price will have an effect through its perception, modifying the perception of thebrand, preferences and purchase intentions, as well as primary demand. Students soon realizethat they cannot try to "beat the game" by determining the nature of an aggregate responsefunction between sales and an element of the marketing mix. Instead, they have to think aboutthe many interactions which may exist in the market place, and to investigate the variousconsequences which may result from their actions.
3. It is realistic. Its behavior in the many situations which may prevail in the course of severaladministrations of the game is consistent with the behavior of real markets.
4. It is robust. The simulation model behaves appropriately when extreme or irrealistic actionsare taken by the firms. This has been achieved in two ways. Firstly, by controlling andcorrecting some of these actions, such as drastic price changes. In this case, the feedbackmessage sent to the firm is a good learning tool. Secondly, by using curvilinear responsefunctions (e.g. S-shaped), by decreasing the importance of extreme actions (for instance withthe use of the squared Euclidean distances in the perceptual map) or by setting safeguards(such as the minimum distance between the positions of an ideal point and a brand on theperceptual map, or the maximum number of effective salesmen in each distribution channel).In this way as well, the students cannot "beat the game" by trying out extreme values in theirdecisions.
5. It is flexible. Apart from the economic environmental factors (GNP growth rate, inflation,price controls), no element of the simulation will take pre-determined values in the course ofthe game. The market situation will evolve in different ways in various administrations of thegame according to the actions taken by the competing firms. In this sense, the
MARKESTRATED markets are modelled by the firms as they progress through the simulatedtime horizon.
6. It is simple. Although the structure of the model is relatively complex, several choices havebeen made so that each firm has a limited set of decisions to make (which are condensed on asingle sheet) for better pedagogical effectiveness. In addition, and as described in the previouschapter, the use of the programs by the instructor when running the simulation has been madeas simple as possible, and assume no previous computer knowledge.
It is hoped that the description of the model's structure will have provided enoughinformation to the reader so that he may concentrate more on the pedagogical aspects of thesimulation than on its technical aspects. It will in particular be easier for the instructor, andpedagogically more effective, if he follows the behavior of the simulation by rising hisknowledge of other marketing situations, than if he tries to analyze the implications of anaction from the model's structure.
- 98 -Appendix I
TYPICAL SCHEDULES
This appendix contain some typical schedules for administering MARKESTRATED
. in a trimester course over six weeks
. in a trimester course concentrated on four days
. in a 3-day SERInar
Reading assignments are not indicated as they can be selected from the .bibliographies given in Chapter II.
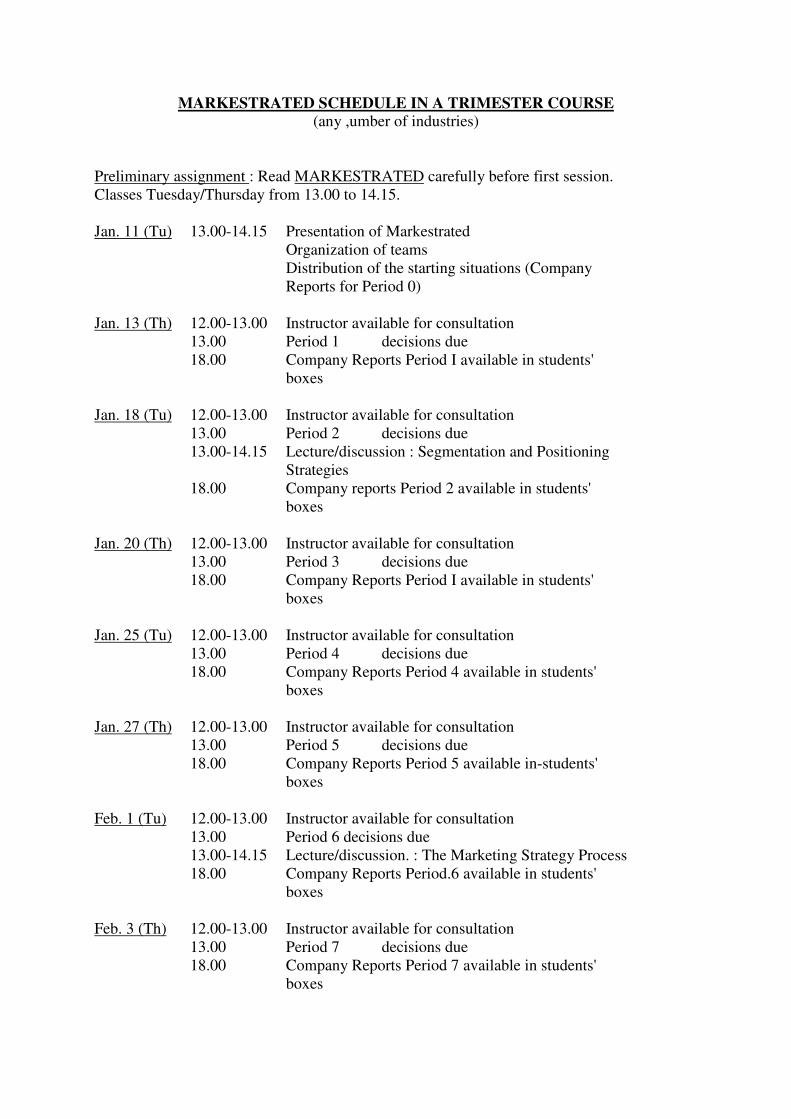
MARKESTRATED SCHEDULE IN A TRIMESTER COURSE(any ,umber of industries)
Preliminary assignment : Read MARKESTRATED carefully before first session.Classes Tuesday/Thursday from 13.00 to 14.15.
Jan. 11 (Tu) 13.00-14.15 Presentation of MarkestratedOrganization of teamsDistribution of the starting situations (CompanyReports for Period 0)
Jan. 13 (Th) 12.00-13.00 Instructor available for consultation13.00 Period 1 decisions due18.00 Company Reports Period I available in students'
boxes
Jan. 18 (Tu) 12.00-13.00 Instructor available for consultation13.00 Period 2 decisions due13.00-14.15 Lecture/discussion : Segmentation and Positioning
Strategies18.00 Company reports Period 2 available in students'
boxes
Jan. 20 (Th) 12.00-13.00 Instructor available for consultation13.00 Period 3 decisions due18.00 Company Reports Period I available in students'
boxes
Jan. 25 (Tu) 12.00-13.00 Instructor available for consultation13.00 Period 4 decisions due18.00 Company Reports Period 4 available in students'
boxes
Jan. 27 (Th) 12.00-13.00 Instructor available for consultation13.00 Period 5 decisions due18.00 Company Reports Period 5 available in-students'
boxes
Feb. 1 (Tu) 12.00-13.00 Instructor available for consultation13.00 Period 6 decisions due13.00-14.15 Lecture/discussion. : The Marketing Strategy Process18.00 Company Reports Period.6 available in students'
boxes
Feb. 3 (Th) 12.00-13.00 Instructor available for consultation13.00 Period 7 decisions due18.00 Company Reports Period 7 available in students'
boxes
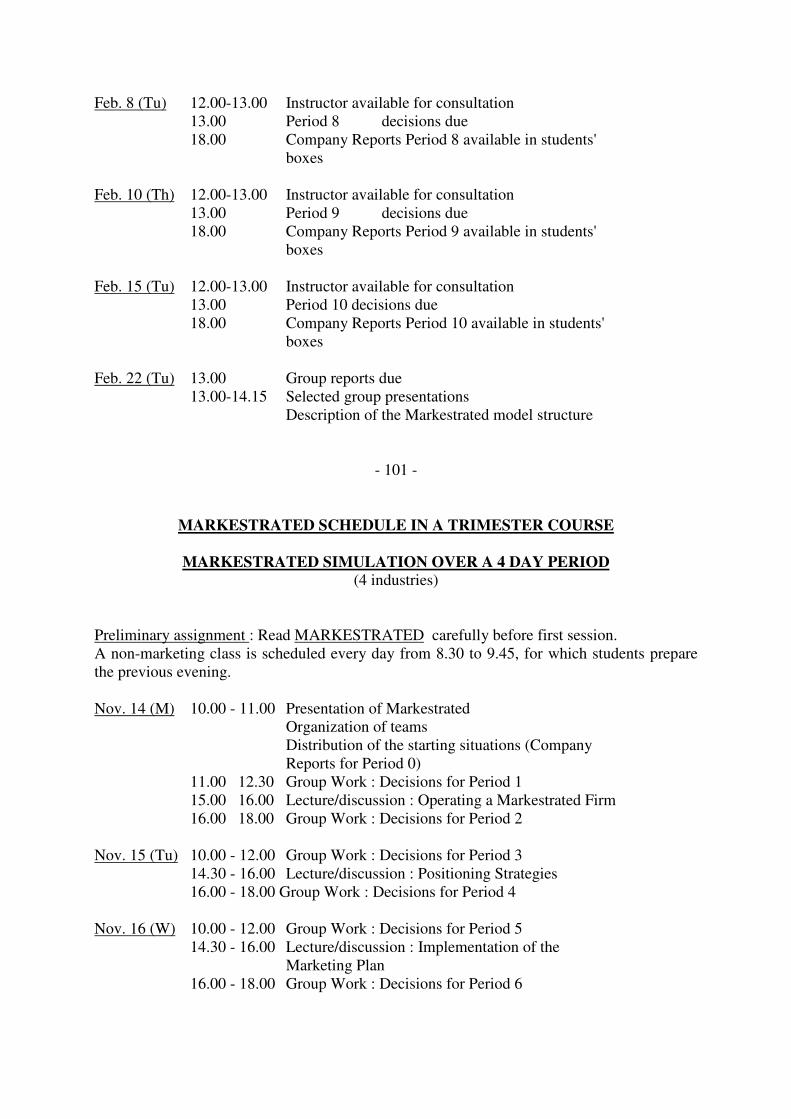
Feb. 8 (Tu) 12.00-13.00 Instructor available for consultation13.00 Period 8 decisions due18.00 Company Reports Period 8 available in students'
boxes
Feb. 10 (Th) 12.00-13.00 Instructor available for consultation13.00 Period 9 decisions due18.00 Company Reports Period 9 available in students'
boxes
Feb. 15 (Tu) 12.00-13.00 Instructor available for consultation13.00 Period 10 decisions due18.00 Company Reports Period 10 available in students'
boxes
Feb. 22 (Tu) 13.00 Group reports due13.00-14.15 Selected group presentations
Description of the Markestrated model structure
- 101 -
MARKESTRATED SCHEDULE IN A TRIMESTER COURSE
MARKESTRATED SIMULATION OVER A 4 DAY PERIOD(4 industries)
Preliminary assignment : Read MARKESTRATED carefully before first session.A non-marketing class is scheduled every day from 8.30 to 9.45, for which students preparethe previous evening.
Nov. 14 (M) 10.00 - 11.00 Presentation of MarkestratedOrganization of teamsDistribution of the starting situations (CompanyReports for Period 0)
11.00 12.30 Group Work : Decisions for Period 115.00 16.00 Lecture/discussion : Operating a Markestrated Firm16.00 18.00 Group Work : Decisions for Period 2
Nov. 15 (Tu) 10.00 - 12.00 Group Work : Decisions for Period 314.30 - 16.00 Lecture/discussion : Positioning Strategies16.00 - 18.00 Group Work : Decisions for Period 4
Nov. 16 (W) 10.00 - 12.00 Group Work : Decisions for Period 514.30 - 16.00 Lecture/discussion : Implementation of the
Marketing Plan16.00 - 18.00 Group Work : Decisions for Period 6

Nov. 17 (Th) 10.00 - 12.00 Group Wor1I : Decisions for Period 716.00 - 18.00 Group Work : Decisions for Period 8
Nov. 18 (F) 12.00 Company Reports Period 8 available in students' boxes
Nov. 28 (M) 8.30 Group reports due8.30 - 9.45 Selected group presentations
Description of the Markestrated model S'tructure
MARKESTRATED SCHEDULE FOR A 3-DAY SERINAR
(one industry)
Preliminary assignment : Read MARKESTRATED carefully before first session.
December 15 (W) 8.30-10.00 Classroom :Presentation of Markestrated.Organization of teamsDistribution of the starting situation(Company Reports for Period 0)
10.15-12.0 Group Work : Team decisions for Period 113.30-15.30 Group Work : Team decisions for Period 215.30-16.45 Lecture/discussion : Segmentation and
Positioning Strategies17.00-19.0 Group Work : Team decisions for Period 3
December 16 (Th) 8.30-10.00 . Group Work : Team decisions for Period 410.15-11.30 . Lecture/discussion : The Marketing Strategy
Process11.30-13.00 . Group Work Team decisions for Period 514.00-15.30 . Group Work Team decisions for Period 615.30-17.00 . Group Work Review of the Marketing Plan17.00-19.00 . Group Work : Team decisions for Period 7
December 17 (F) 8.30-10.00 Group Work Team decisions for Period 810.15-11.30 Group Work : Analysis of the performance of the team
over the last 8 simulated years.11.30-13.00 Group Work Team decisions for Period 914.00-16.00 Group Work : Preparation of the group presentation16.15-18.00 Final classroom session
Presentation of general resultsGroup presentationsDescription of the Markestrated model structure

APPENDIX V
MATHEMATICAL FORMULATION OF THE MARKESTRATED MODEL
This appendix contains the main mathematical relations embodied in the MARKESTRATEDmodel. It is not necessary for the administration of the simulation, and the samem informationis contained in a non-technical form in Chapter V of this manual. The more mathematicallyinclined reader will find here a concise summary of the model structure.
The mathematical formulation uses three kinds of variables noted by D for decision variable,P for parameter and V for intermediate variable. A decision variable is defined as a variablefor which the value is given by the players in the decision form. The values of the parametersare set in the data files. Intermediate variables are used for computing purposes. In order toreduce notation complexity, the time subscript of intermediate variables is not indicated whenno confusion can arise (current period t is then assumed.)
STEP 1 - CORRECTION OF INPUT DECISIONS
STEP 2 - ENVIRONMENTAL CHANGES
STEP 3 - SCALING OF THE PERCEPTUAL MAP
STEP 4 - EVOLUTION OF SEGMENTS' NEEDS
4.a Xmi(t) = Xmi(t-1) + 0.1 (xmi(9) - Xmi (-1))
where Xmi(t) = Coordinate on axis i of segment m ideal point at period t (V)
Xmi(9) = Coordinate on axis i of segment m ideal point at period 9 (P)
Xmi(-1) = Coordinate on axis i of segment m ideal point aL period -1 (P)
STEP 5 - NATURAL POSITIONING