marine scotland science report 05/12 movements of ... scotland science report 05/12. movements of...
TRANSCRIPT

Marine Scotland Science Report 05/12
Movements of Returning Atlantic Salmon Through
Tongland Fish Pass
J D Armstrong, R M Armstrong, J L Graham, S J Middlemas,
J C H Ribbens, P Rycroft and D C Stewart

@ Crown copyright 2012
Marine Scotland Science Report 05/12
Movements of Returning Atlantic Salmon Through Tongland Fish Pass
J D Armstrong, R M Armstrong, J L Graham, S J Middlemas, J C H Ribbens, P Rycroft and D C Stewart
Published by Marine Scotland – Science

Marine Scotland is the directorate of the Scottish Government responsible for the integrated management of Scotland’s seas. Marine Scotland Science (formerly Fisheries Research Services) provides expert scientific and technical advice on marine and fisheries issues. Marine Scotland Science Report is a series of reports that publish results of research and monitoring carried out by Marine Scotland Science. These reports are not subject to formal external peer-review. Marine Scotland – Science Freshwater Laboratory Faskally Pitlochry PH16 5LB Copies of this report are available from the Marine Scotland website at www.scotland.gov.uk/marinescotland

Movements of Returning Atlantic Salmon through Tongland Fish Pass
J D. Armstrong1, R M. Armstrong2, J L. Graham2, S J. Middlemas1, J. C. H. Ribbens2,
P Rycroft3 and D C. Stewart1
1 Marine Scotland Science Freshwater Laboratory, Faskally, Pitlochry, Perthshire
PH16 5LB 2 Galloway Fisheries Trust, Fisheries House, Station Industrial Estate, Newton
Stewart, Wigtownshire DG8 6ND 3 Wyre Micro Design Ltd., Shore View House, 100 Pilling Lane, Preesall, Poulton-le-
Fylde, Lancashire FY6 0HG
Executive Summary Movements of salmon were recorded using a passive integrated transponder (PIT) tag and detector system as they migrated through Tongland fish pass. Salmon were captured in 2007 and 2008 in a box trap about 900m below the entrance to the fish pass. A total of 11 of 29 fish tagged were recorded to have found the pass. Overall rate of passage decreased as time of year advanced. Most fish traversed to the upper chambers of the pass within a day. There was variation in time taken to traverse the sections of the pass, primarily due to delay at the exit sections. Some of the increased delay in upper sections may have been due to higher likelihood of impending nightfall by the time fish had traversed the pass. However, several of the few fish detected leaving the pass were delayed over one or more days. The cause of low detection in the exits is unclear. Introduction Background Widespread construction of fish passes, or fishways, was initiated during development of the hydro-electric industry in Scotland with the aim of allowing free passage of salmon, Salmo salar L. and sea trout, Salmo trutta L., whilst also harnessing the capacity to generate electricity over prolonged time periods by damming rivers. Rather little information was available regarding the behaviour of fish when many of these passes were constructed in the 1930s-1950s and so a series of assumptions was necessary in developing designs. Inevitably, there has subsequently been concern and debate about the efficiency of passes and the scope for making modifications. However, it is only in the last few decades, that it has been possible to apply electronic technologies to monitor directly the passage of fish through passes and so identify with some certainty how tuning of design might be
1

achieved. Tongland fish pass has been one of the most ancient, complex and intriguing of the hydro-electricity fish pass designs and the subject of prolonged consideration by management groups. The Tongland dam spans the Kirkcudbright River Dee within 1km of the head of tide and produces an impoundment which supplies water to one of five power stations on the Galloway hydro-electric scheme in south-west Scotland. Tongland dam and power station were completed in 1937. The dam forms a storage reservoir which feeds water to the power station via an aqueduct of approximately 1km in length; a spillway allows water over the dam into the main river during high flows. Compensation flow into the by-passed section of the River Dee is provided via a needle valve in the dam wall. This flow enters the river through fish-proof screens and a short section of canal where it combines with discharge of water from Tongland fish pass (Fig. 1).
Figure 1: Map of the Tongland fish pass showing the arrangement of pools and locations of PIT detectors (A1-A13). The upper four pools are also fitted with diagonal wooden cross-walls (not shown).
DAM
Weirs & Pools
Cross-wall
Washed-out weir
1
2
3
4
5
6
7
8
9
10
1112
13
14
15
1617
1819
2021
22
23
24
25
26
27
28
29
30
31
32
3334
38
39
40
Resting Pool 4
A1
A2
A3
A4A5
A6
A7
A8
A9
A10
A11
A12
A13
Resting Pool 1
Resting Pool 2
Resting Pool 3 X
x
x
x
x
x
x
x
x
xx
x
x
Section 1
Section 3
Section 4
Section 5
Section 6
Section 7
Section 8
Section 9
Section 2
To river
Flow from pass
Flow from needle valvethrough fish-proof grid
2
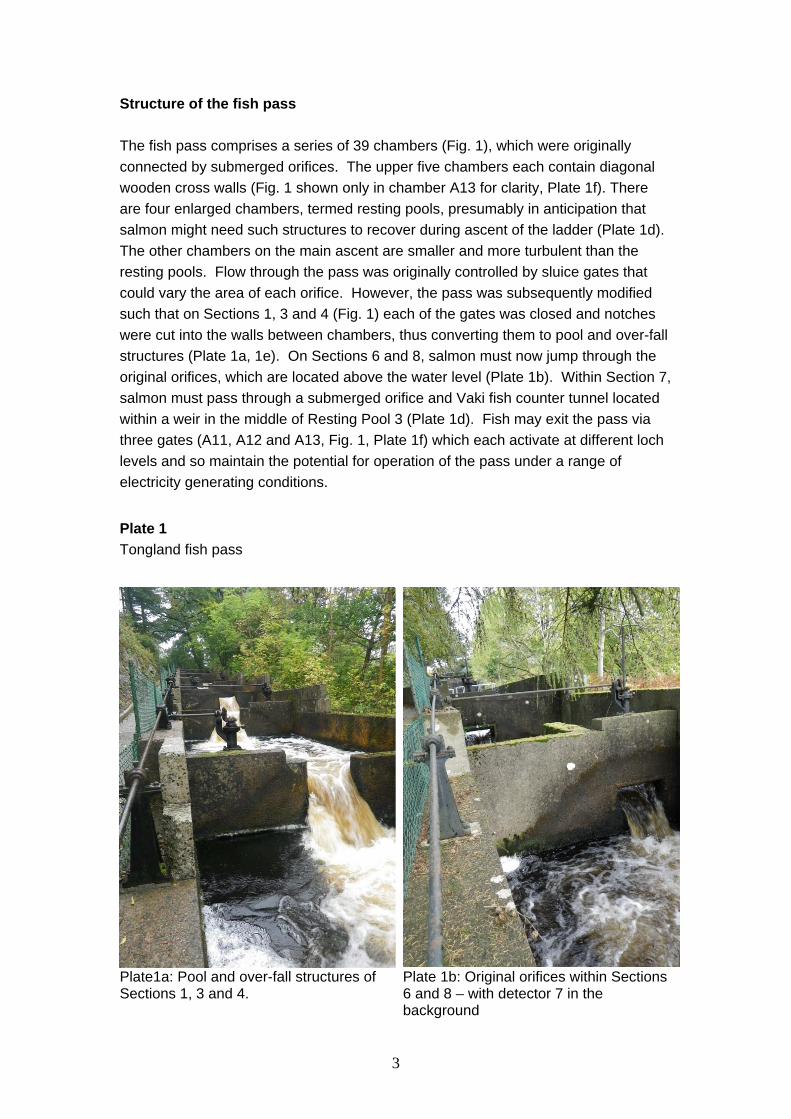
Structure of the fish pass The fish pass comprises a series of 39 chambers (Fig. 1), which were originally connected by submerged orifices. The upper five chambers each contain diagonal wooden cross walls (Fig. 1 shown only in chamber A13 for clarity, Plate 1f). There are four enlarged chambers, termed resting pools, presumably in anticipation that salmon might need such structures to recover during ascent of the ladder (Plate 1d). The other chambers on the main ascent are smaller and more turbulent than the resting pools. Flow through the pass was originally controlled by sluice gates that could vary the area of each orifice. However, the pass was subsequently modified such that on Sections 1, 3 and 4 (Fig. 1) each of the gates was closed and notches were cut into the walls between chambers, thus converting them to pool and over-fall structures (Plate 1a, 1e). On Sections 6 and 8, salmon must now jump through the original orifices, which are located above the water level (Plate 1b). Within Section 7, salmon must pass through a submerged orifice and Vaki fish counter tunnel located within a weir in the middle of Resting Pool 3 (Plate 1d). Fish may exit the pass via three gates (A11, A12 and A13, Fig. 1, Plate 1f) which each activate at different loch levels and so maintain the potential for operation of the pass under a range of electricity generating conditions.
Plate 1 Tongland fish pass
Plate1a: Pool and over-fall structures of Sections 1, 3 and 4.
Plate 1b: Original orifices within Sections 6 and 8 – with detector 7 in the background
3

Plate 1 ctd. Tongland fish pass
Plate 1c: Section 4 with PIT detector 5 positioned above the resistivity fish counter flume (removed by the 2008 tagging period)
Plate 1d: Resting pool 3 showing central weir with submerged orifice and Vaki fish counter with PIT detector 8 in the background
Plate 1e: Section 9 with PIT detector 10 in foreground
Plate 1f: Section 10 showing diagonal wooden cross walls – all three exits in the dam wall are located within this section
Rationale and Study Aims Debate has ensued over many decades as to the efficiency of Tongland fish pass. In recent years it has been proposed to reduce flows through the pass to facilitate fish passage on an assumption that fish may be impeded by high water velocities or turbulence. However, assessment of the value of such measures requires a baseline impression of movements of fish through the pass. Indeed, any reduction in water flow may seriously impair passage of some sections, for example through the exposed orifices of Sections 6 and 8.
4

This study has deployed a system of passive integrated transponder (PIT) tag detectors throughout the pass to record the rate of passage of fish. The initial aim was to capture migrating salmon well below the pass so that they could approach and enter naturally having recovered from capture and tagging. However, due to low numbers of tagged fish entering the pass in the first year of the study, a second group of fish was captured and tagged in the lower chamber of the pass in that year. The aims were as follow:
1. Deploy a system of PIT detectors in Tongland Fish Pass; 2. deploy a box trap in the River Dee adjacent to Tongland power station; 3. capture and tag salmon during 2007 and 2008; 4. assess the proportion of tagged fish that approach the pass; 5. determine patterns of fish passage through the pass; 6. identify and make recommendations for addressing areas of particular
concern. Methods Fish capture and tagging Investigations into movements of salmon through the Tongland fish pass were conducted during 2007 and 2008. A box trap (3m x 2.5m x 2.2m high) was constructed and installed adjacent to Tongland power station, approximately 0.9km below the fish pass entrance. The trap comprised a box of metal bars with an in-scale that directed fish in and then obstructed their exit to some degree (Plate 2a). Captured fish were removed by hand-net. The trap was sited in a tidal section of the river and could be by-passed by fish migrating upstream at high water levels. It was therefore expected not to have seriously impeded the run of salmon and to have captured only an unknown proportion of the total population. The trap was fished at low tide, once daily during July, August and November 2007 and July 2008 except during high river levels caused by the dam spilling. Captured fish were anaesthetised, measured and each tagged with a passive integrated transponder (PIT tag) (42-47mm length, 14-15mm width) inserted into the stomach (Plate 2b). The tags were modelled on dimensions of gastric acoustic tags, which are used routinely to track returning salmon and generally remain lodged in the gut (e.g. Stewart et al., 2009). Each tag contained a standard miniature PIT (23mm length 2007, 32mm length 2008). In addition to trap-caught fish, a group of salmon was captured on 12 November and 23 November 2007 within the fish pass. This was achieved by positioning a temporary screen at weir 1 (Fig. 1) to retain the fish within the lower pool from which they were removed by electrofishing. The fish were tagged by the procedure outlined above. Details of tagged fish are provided in Table 1.
5

Plate 2 Trap site and fish capture
Plate 2a: The fish trap adjacent to Tongland Power Station
Plate 2b: A trapped salmon being measured prior to tagging
Fish pass The fish pass was fitted with a series of detectors (Wyre Micro Design Ltd) that recorded passage of any fish tagged with a PIT tag. Detectors were placed at interfaces of sections of the pass that differed markedly in character (Fig. 1). Detector A5 was at the top of a fish counter flume that was active in 2007 but removed prior to observations in 2008. The detectors were connected to a computer that logged the date, time and tag number of each passing fish. Each of the three exits from the pass was fitted with a specially designed detector to maximise range in these regions of extensive metal work, which reduces detection range. Despite this custom engineering, it was acknowledged that there was a degree of uncertainty as to the efficiency of detection, which could not easily be quantified. In total, 10 salmon caught in the box trap were tagged in July and August 2007, 4 in November 2007 and 15 in July 2008. A further group of 15 salmon was captured within the pass in 2007 by electro-fishing (Table 1). This group was displaced downstream and released into the main river channel c. 50 m below the fish pass entrance.
6

Table 1: Details of each fish tagged Date tagged
Capture site Tag code Length (mm)
Sex Detected in fish ladder
25/07/07 Trap 06CAAEF0 745 - - 25/07/07 Trap 06CAAEEB 755 - - 25/07/07 Trap 06CAAEFE 706 M - 27/07/07 Trap 06CAAEE4 765 F 29/07/07 27/07/07 Trap 06CAAEEF 806 M 27/10/07 31/07/07 Trap 06CAAEE8 780 M - 24/08/07 Trap 06CAAEE9 810 M - 27/08/07 Trap 06CAAEFF 750 - - 27/08/07 Trap 06CAAEB1 700 - - 29/08/07 Trap 06CAAEF1 760 M - 5/11/07 Trap 91B51F0 760 M 18/11/07 7/11/07 Trap 91B51F8 865 F - 12/11/07 Fish ladder 91B520C 585 F - 12/11/07 Fish ladder 91B51F9 575 F - 12/11/07 Fish ladder 91B5212 645 F - 15/11/07 Trap 91B51EF 720 M - 23/11/07 Fish ladder 91B5200 770 M 30/11/07 23/11/07 Fish ladder 91B5208 625 F - 23/11/07 Fish ladder 91B51EC 750 M - 23/11/07 Fish ladder 91B5210 680 M 23/11/07 23/11/07 Fish ladder 91B51F7 700 M 05/12/07 23/11/07 Fish ladder 91B5214 670 F - 23/11/07 Fish ladder 91B5209 650 F - 23/11/07 Fish ladder 91B5206 625 M - 23/11/07 Fish ladder 91B520A 785 M - 23/11/07 Fish ladder 91B5203 670 M 26/11/07 23/11/07 Fish ladder 91B5215 590 M - 23/11/07 Fish ladder 91B51E6 575 F 29/11/07 28/11/07 Trap 91B51E7 725 M 30/11/07 07/07/08 Trap 91B51E8 810 M - 10/07/08 Trap 91B51ED 720 M 14/10/08 10/07/08 Trap 91B51FF 790 F - 13/07/08 Trap 91B5204 740 M 11/08/08 13/07/08 Trap 91B520F 800 F 09/10/08 14/07/08 Trap 91B51F2 810 - 01/10/08 15/07/08 Trap 91B5201 845 F - 15/07/08 Trap 91B51E9 810 - 12/10/08 17/07/08 Trap 91B5205 840 M - 18/07/08 Trap 91B5217 810 F - 22/07/08 Trap 91B51EA 770 M - 23/07/08 Trap 91B51EE 870 M - 23/07/08 Trap 91B51FC 810 M 31/07/08 25/07/08 Trap 91B5211 890 M 14/11/08 31/07/08 Trap 91B520B 710 F -
7
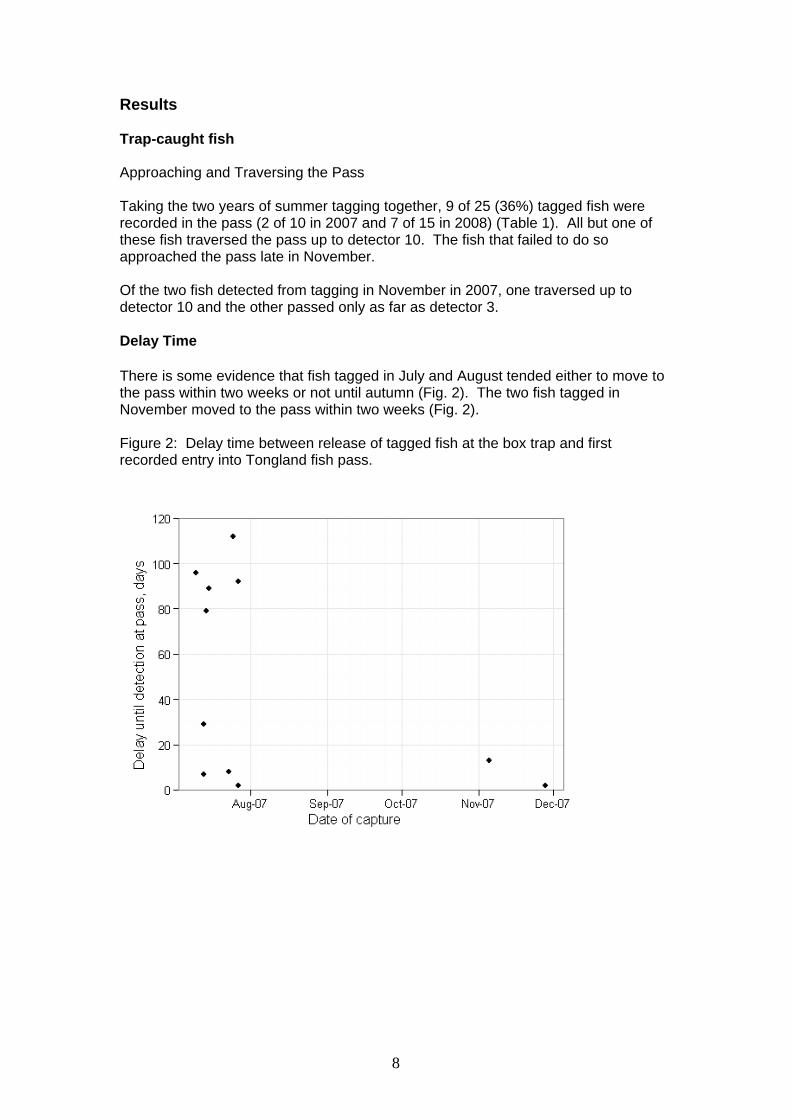
Results Trap-caught fish Approaching and Traversing the Pass Taking the two years of summer tagging together, 9 of 25 (36%) tagged fish were recorded in the pass (2 of 10 in 2007 and 7 of 15 in 2008) (Table 1). All but one of these fish traversed the pass up to detector 10. The fish that failed to do so approached the pass late in November. Of the two fish detected from tagging in November in 2007, one traversed up to detector 10 and the other passed only as far as detector 3. Delay Time There is some evidence that fish tagged in July and August tended either to move to the pass within two weeks or not until autumn (Fig. 2). The two fish tagged in November moved to the pass within two weeks (Fig. 2). Figure 2: Delay time between release of tagged fish at the box trap and first recorded entry into Tongland fish pass.
8

Figure 3: Tracks of fish moving through Tongland fish pass. For clarity of presentation, data for one fish are truncated since it remained between detectors 10 and 12 in excess of 6 days.
Leaving the Pass at the Top End Of the ten fish that reached detector 10, only four were detected leaving the pass, three via detector 12 and one via detector 11. Passage Time A summary of the passage of each fish through the pass is provided in Figure 3. These data were analysed to test for variation in the times taken to traverse the different sections and also the effect of time of year (Figs. 4 and 5). A mixed model was used with fish as a random factor and day of entry and pool as fixed effects. Likelihood ratio tests examined the significance of day of entry to the pass and section on passage rate. Both these factors were significant: section, LR = 25.32, df = 8, p = 0.001; day of entry, LR = 4.08, df = 1, p = 0.044. Inspection of the data reveals generally rapid passage of fish through the pass, with relatively longer periods of time in the longer sections (1 and 3) and in the section 7 resting pool. However, the main variation is due to very long time periods before leaving the pass (section 10). Fish caught in the pass Of the 15 salmon captured in the pass in 2007, five were subsequently recorded by the PIT detectors. Of these fish, four were recorded on detector 1 only and the other fish passed right through to detector 11.
9

Figure 4: Variation in the time taken by salmon to traverse sections of the Tongland fish pass in relation to section of the pass (see Fig. 2). Boxes indicate median and quartiles, whiskers indicate 95% limits and points indicate outliers. A single large outlier that spent more than 6 days in the upper pass before recorded exit was removed prior to analysis.
Figure 5: Variation in the time taken by salmon to traverse sections of the Tongland fish pass in relation to day of year they first commenced ascent of pass. Boxes indicate median and quartiles, whiskers indicate 95% limits and points indicate outliers. A single large outlier that spent over 6 days in the upper pass before recorded exit was removed prior to analysis.
10

Discussion The trapping and tracking systems enabled collection of information regarding passage of salmon through the Tongland fish pass. It was evident that most fish traversed the pass to the top chambers within a day and that the rate of passage decreased as the year progressed. Slower passage in autumn than summer may reflect low temperature, which may affect swimming capacity and appeared to prevent passage of salmon through Pitlochry fish pass in spring (Gowans et al., 1999). It is also possible that approaching spawning time in autumn, muscle performance is reduced due to conversion of muscle to gonad. Passage through the fish pass was during daylight hours only. This behaviour is similar to that observed in salmon ascending Pitlochry fish pass, which is a pool and orifice structure (Gowans et al., 1999). The fish at Tongland moved to the top of the pass within a day and it can therefore be concluded that most sections of the pass did not cause major delay in migration. Time taken to pass was broadly related to size of section. However, there were more prolonged delays in the upper pass near the series of final chambers housing the exit gates. Of the four fish recorded leaving via the upper gates, two arrived late in the day and were likely to have been delayed by nightfall before continuing out of the pass the following morning. A further one fish passed through detectors 10 and 11 within the same morning. The fourth fish spent more than six days in the upper chambers before leaving the pass. A further fish was recorded on detector 10 over four days, but was not recorded leaving the pass. Therefore, it appears that some of the delay at the top of the pass can be attributed to the fact that it is more likely that fish arriving there will do so later in the day than is the case in the lower pass. However, there is some evidence of substantial delays that are not attributable only to cessation of migration at night. It is not possible to ascertain whether or not fish that were not detected left the pass because there is some ambiguity associated with the upper exit gates being a particularly hostile environment in which to operate the PIT detectors. Nevertheless, it is quite possible that at least some of the salmon succumbed to mammalian predators in the upper chambers of the pass. There was little evidence of salmon dropping back down the pass (Fig. 3), although one salmon tagged on 28 November 2007 spent at least five days from 02 December at detector 10 before eventually heading downstream of detector 9 on 10 December and exiting the ladder on that day. Such activity highlighted a blockage in the middle exit gate of the dam wall. This was removed in early December 2007. Application of radio or acoustic tags would resolve this uncertainty regarding exit and provide more information on the time that it takes for fish to traverse the upper pass. Only 36% of the fish captured in the box trap subsequently approached the pass. This low value may indicate that the fish had difficulty locating the entrance of the fish pass or perished in the lower reaches between the trap and pass entrance, possibly due to predation or poaching. It was evident that many of the surviving fish
11

experienced a delay of several months before migrating through the pass, probably in response to the approaching spawning season. However, there are other plausible explanations for the low proportion of tagged fish arriving at the pass. It is known that salmon may enter several rivers on their homeward migration, presumably searching for odour cues to verify their home river. Furthermore, some fish probably over-summer in non-home rivers, subsequently returning home near spawning time (Stewart et al., 2009). Therefore, it is possible that some of the tagged fish were not destined to home to the reaches of the Dee above the fish pass. This issue could be resolved using active tracking with acoustic or radio transmitters to observe whether the fish returned to sea, resided in the lower river during summer, searched for the fish pass entrance or were killed. The numbers of salmon captured in the box trap was lower than had been hoped and therefore a supplementary group of fish was captured in the pass during late autumn in 2007. This group of fish was almost certainly aiming to move up the River Dee to spawn and yet most failed to return to the pass after having been tagged and displaced downstream. Therefore, many of these fish may have suffered from the capture and tagging procedure, died or could not easily locate the fish pass entrance. They would have had only a relatively short time to do so before spawning was imminent and may therefore have spawned in the lower river below the pass. In any case, use of this method to supplement numbers of fish captured in the box trap was shown to be of little value. This study has resolved that salmon pass readily through most of Tongland fish pass during mid summer, but their passage may be impaired by comparison late in the year. There was no evidence that the fish were compromised by having to jump through narrow slots above water level in sections 6 and 8. It has identified that there is uncertainty as to how readily the fish exit the pass. There is also uncertainty as to how effectively salmon locate the entrance to the fish pass. There is no evidence that a reduced water flow through the pass would aid passage, but it might influence the abilities of fish to find and exit the pass. Future Work We make the following recommendations for the next stages of work: 1. Review options for testing the PIT detectors on the outlets to the pass. 2. Deploy cameras in and around the fish trap to determine how its efficiency
might be improved. 3. Weld known gaps around the trap to increase its efficiency. 4. Explore other options for catching salmon, for example by netting lower river
pools.
12

5. Conduct preliminary trials to evaluate the performance of radio and acoustic transmitters in the region of the dam and develop operating procedures and outline costings for the techniques.
References Gowans, A.R.D., Armstrong, J.D. and Priede, I.G. 1999. Movements of adult Atlantic salmon in relation to a hydroelectric dam and fish ladder. Journal of Fish Biology, 54, 713-126. Stewart, D.C., Middlemas, S.J., Mackay, S. and Armstrong, J.D. 2009. Over-summering behaviour of Atlantic salmon Salmo salar returning to rivers in the Cromarty Firth, north–east Scotland. Journal of Fish Biology, 74, 1347-1352.
13

@ Crown Copyright 2012 Marine Scotland – Science Freshwater Laboratory Faskally Pitlochry PH16 5LB Copies of this report are available from the Marine Scotland website at www.scotland.gov.uk/marinescotland