march 31, 2013 - türk ekonomi bankası€¦ · 2011 2012 1q 2012 2q 2012 3q 2012 4q 2013 1q...
TRANSCRIPT
TEB March 31, 2013
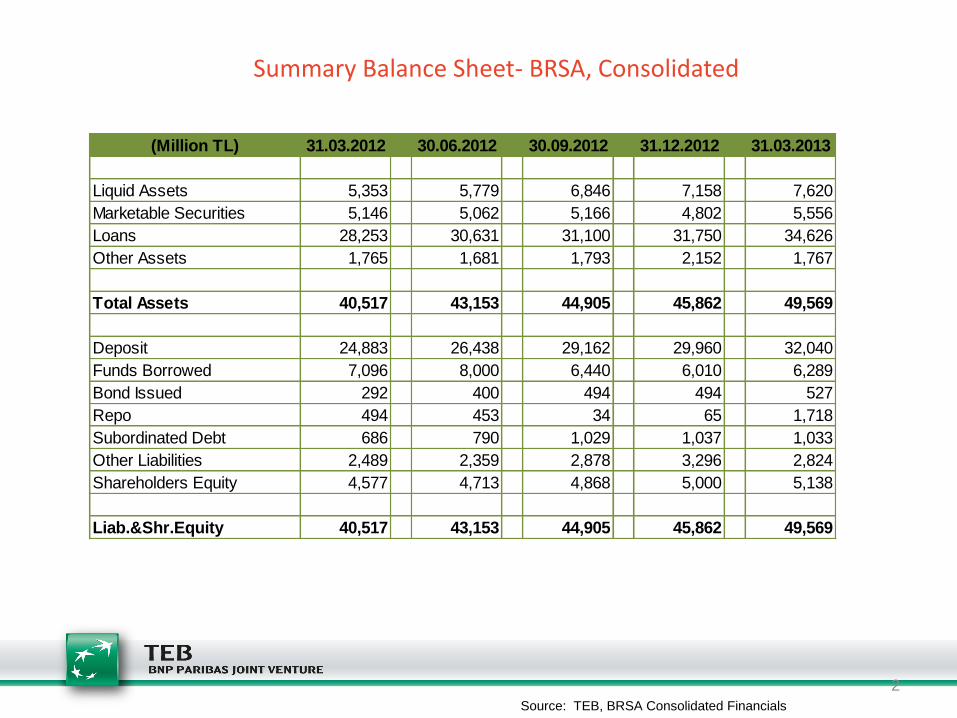
Summary Balance Sheet- BRSA, Consolidated
2
Source: TEB, BRSA Consolidated Financials
(Million TL) 31.03.2012 30.06.2012 30.09.2012 31.12.2012 31.03.2013
Liquid Assets 5,353 5,779 6,846 7,158 7,620
Marketable Securities 5,146 5,062 5,166 4,802 5,556
Loans 28,253 30,631 31,100 31,750 34,626
Other Assets 1,765 1,681 1,793 2,152 1,767
Total Assets 40,517 43,153 44,905 45,862 49,569
Deposit 24,883 26,438 29,162 29,960 32,040
Funds Borrowed 7,096 8,000 6,440 6,010 6,289
Bond Issued 292 400 494 494 527
Repo 494 453 34 65 1,718
Subordinated Debt 686 790 1,029 1,037 1,033
Other Liabilities 2,489 2,359 2,878 3,296 2,824
Shareholders Equity 4,577 4,713 4,868 5,000 5,138
Liab.&Shr.Equity 40,517 43,153 44,905 45,862 49,569

Summary Income Statement –BRSA, Consolidated
3
Source: TEB, BRSA Consolidated Financials
(Million TL) 31.03.12 31.03.13 % change
Net Interest Income 434.3 529.0 21.8%
Gains/Loss From Derivatives and FX position -29.6 10.4
Securities Trading Gain/ Loss 0.7 46.1
Net Fee&Commissions 126.7 163.8 29.2%
Other Income 16.9 15.7
Net Banking Income 547.6 764.9 39.7%
Loan Provision Expense -37.1 -107.8 190.5%
Net Operating Income 510.5 657.1 28.7%
Other Operating Expense -363.7 -415.9 14.4%
Tax Provisions -36.0 -59.5 65.1%
Net Profit 110.7 181.7 64.1%

Balance Sheet Growth
Asset Composition Liability Composition
Strong start to year with 8 % balance sheet growth, commitment to core banking intact
Source: TEB, BRSA Consolidated Financials
4
40.517
43.15244.905
45.86249.569
0%
7%4% 2% 8%
31.03.12 30.06.12 30.09.12 31.12.12 31.03.13
Total Assets Variance
61% 61%65% 65% 65%
21% 22%18% 17%
19%
6% 5% 6% 7% 6%
11% 11% 11% 11%10%
31.03.12 30.06.12 30.09.12 31.12.12 31.03.13
Deposit Funds Borrowed Other Liabilities Shareholders Equity
5
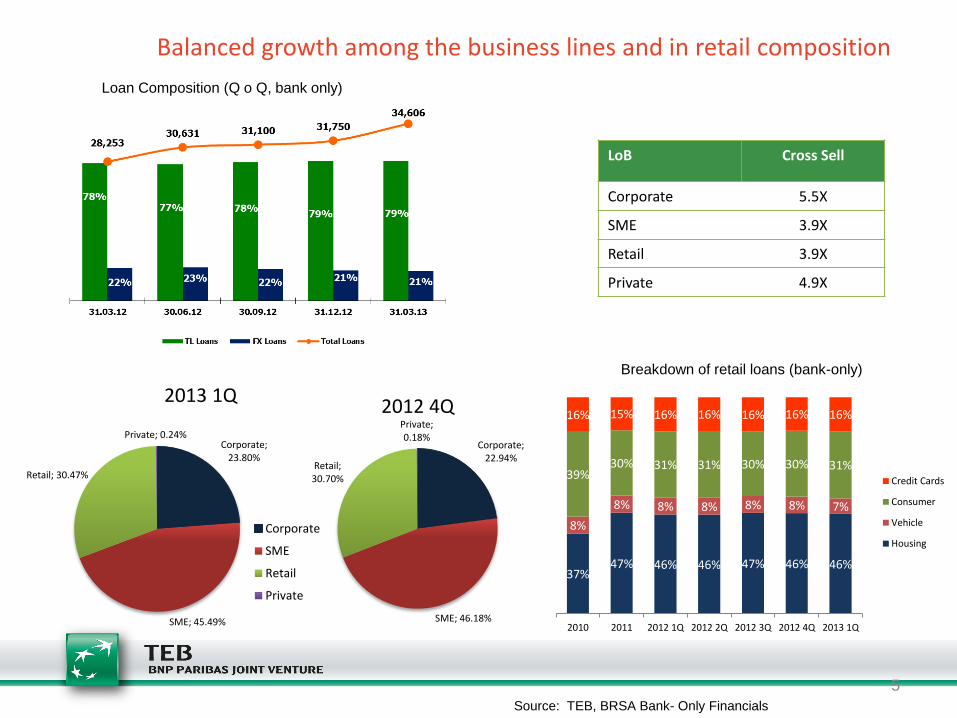
Balanced growth among the business lines and in retail composition
Loan Composition (Q o Q, bank only)
Source: TEB, BRSA Bank- Only Financials
Breakdown of retail loans (bank-only)
LoB Cross Sell
Corporate 5.5X
SME 3.9X
Retail 3.9X
Private 4.9X
Corporate; 22.94%
SME; 46.18%
Retail; 30.70%
Private; 0.18%
2012 4Q
Corporate; 23.80%
SME; 45.49%
Retail; 30.47%
Private; 0.24%
2013 1Q
Corporate
SME
Retail
Private
37% 47% 46% 46% 47% 46% 46%
8%
8% 8% 8% 8% 8% 7%
39% 30% 31% 31% 30% 30% 31%
16% 15% 16% 16% 16% 16% 16%
2010 2011 2012 1Q 2012 2Q 2012 3Q 2012 4Q 2013 1Q
Credit Cards
Consumer
Vehicle
Housing

6
Good asset quality maintained despite increasing share of retail
Source: TEB, BRSA Bank-Only Financials
Non-Performing Loans as a % of Total Loans
Coverage: 59%
1.10% 0.90%
1.75%
2.25%
4.66%
3.00% 2.80% 2.80%
2.28% 2.54%
2.14% 2.24%
4.90%
3.70% 3.60%
3.50%
5.18%
3.58%
2.70% 2.72% 2.63% 2.68%
2.84% 2.94%
TEB
Sector Average
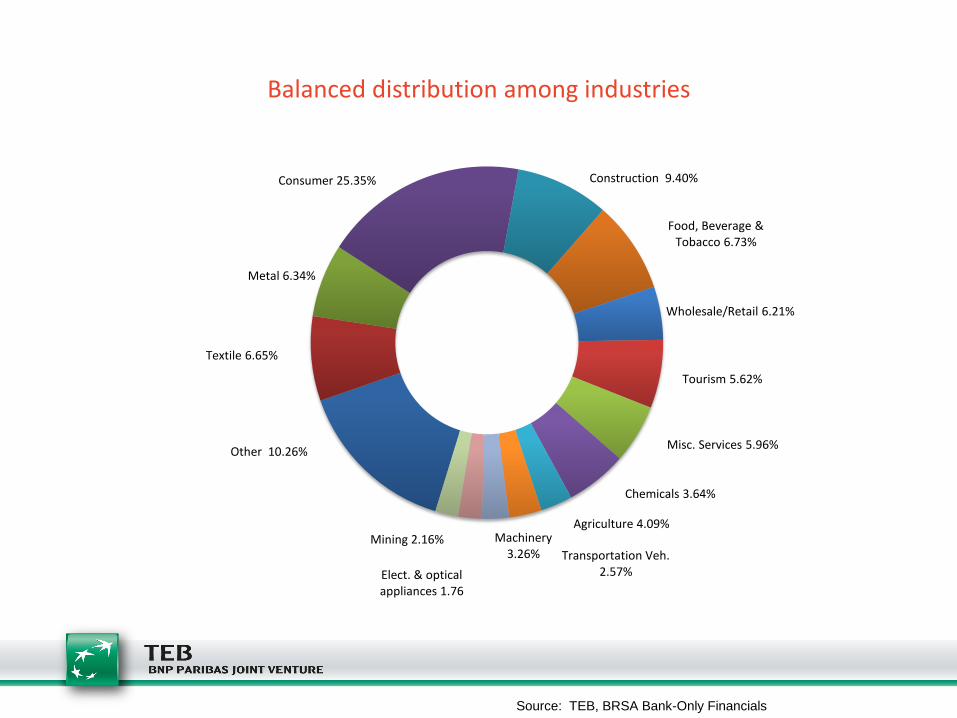
Balanced distribution among industries
Source: TEB, BRSA Bank-Only Financials
Other 10.26%
Textile 6.65%
Metal 6.34%
Consumer 25.35% Construction 9.40%
Food, Beverage & Tobacco 6.73%
Wholesale/Retail 6.21%
Tourism 5.62%
Chemicals 3.64%
Misc. Services 5.96%
Transportation Veh. 2.57%
Agriculture 4.09% Machinery
3.26% Mining 2.16%
Elect. & optical appliances 1.76
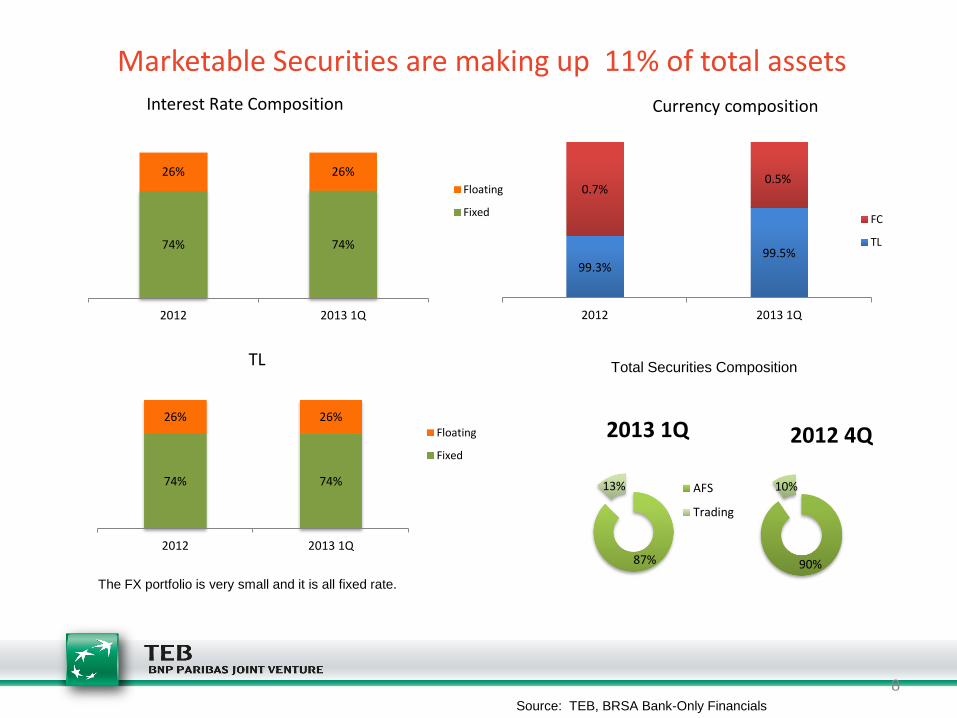
Marketable Securities are making up 11% of total assets
Source: TEB, BRSA Bank-Only Financials
8
90%
10%
2012 4Q
Total Securities Composition
The FX portfolio is very small and it is all fixed rate.
Currency composition
74% 74%
26% 26%
2012 2013 1Q
Interest Rate Composition
Floating
Fixed
74% 74%
26% 26%
2012 2013 1Q
TL
Floating
Fixed
99.3% 99.5%
0.7% 0.5%
2012 2013 1Q
FC
TL
87%
13%
2013 1Q
AFS
Trading
9
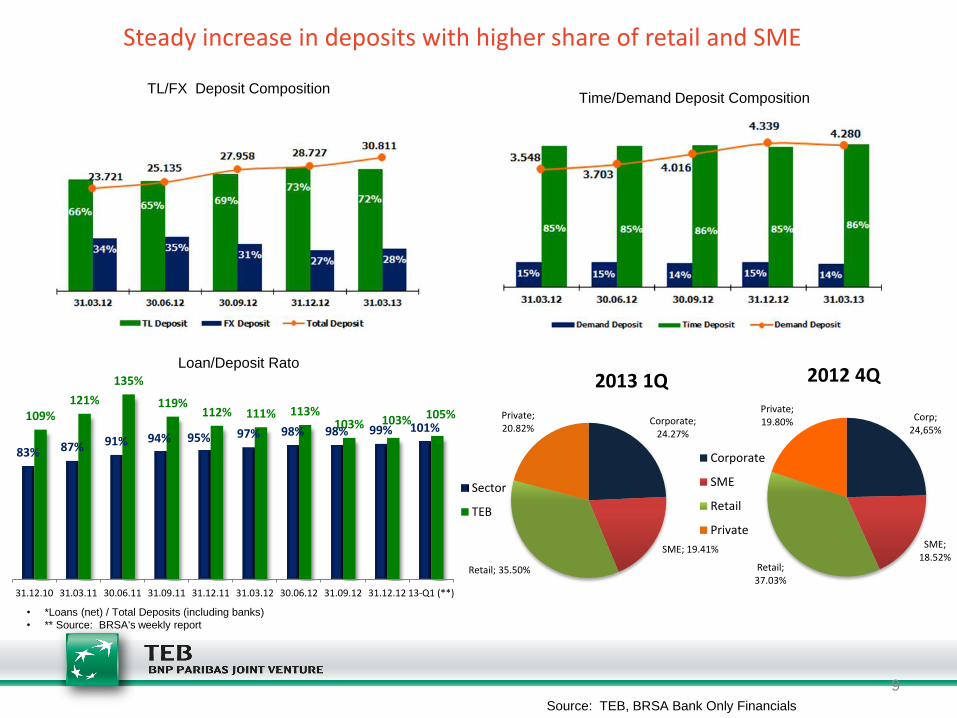
Steady increase in deposits with higher share of retail and SME
Time/Demand Deposit Composition
Source: TEB, BRSA Bank Only Financials
TL/FX Deposit Composition
Corp; 24,65%
SME; 18.52%
Retail; 37.03%
Private; 19.80%
2012 4Q Loan/Deposit Rato
Corporate; 24.27%
SME; 19.41%
Retail; 35.50%
Private; 20.82%
2013 1Q
Corporate
SME
Retail
Private
• *Loans (net) / Total Deposits (including banks)
• ** Source: BRSA's weekly report
83% 87% 91% 94% 95% 97% 98% 98% 99% 101% 109%
121%
135%
119% 112% 111% 113%
103% 103% 105%
31.12.10 31.03.11 30.06.11 31.09.11 31.12.11 31.03.12 30.06.12 31.09.12 31.12.12 13-Q1 (**)
Sector
TEB
10
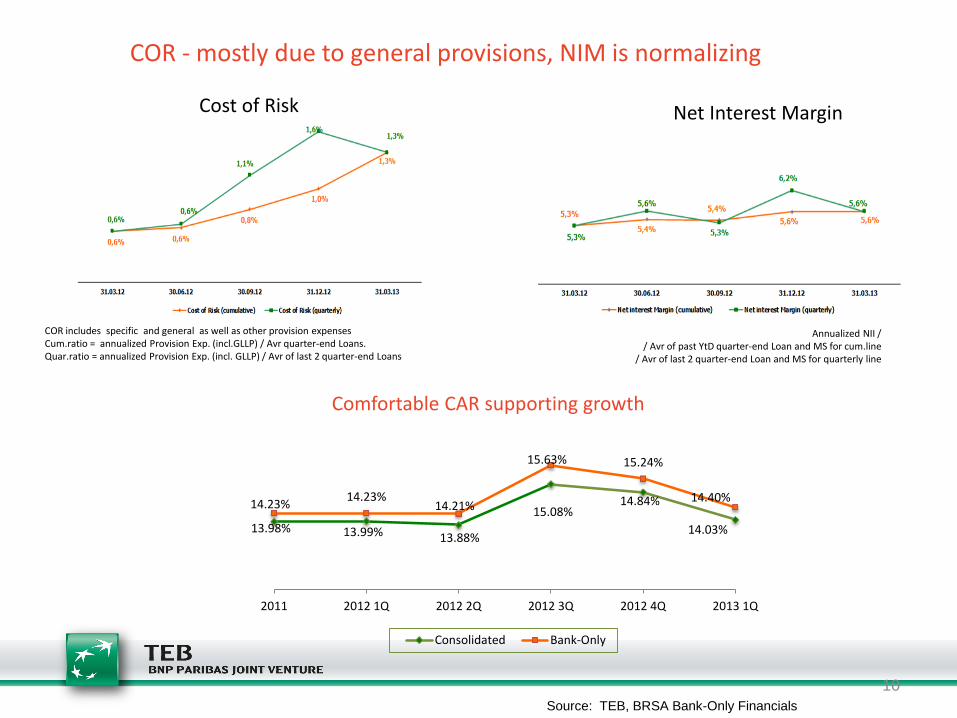
COR - mostly due to general provisions, NIM is normalizing
Source: TEB, BRSA Bank-Only Financials
Annualized NII / / Avr of past YtD quarter-end Loan and MS for cum.line
/ Avr of last 2 quarter-end Loan and MS for quarterly line
Comfortable CAR supporting growth
Net Interest Margin Cost of Risk
13.98% 13.99% 13.88%
15.08% 14.84%
14.03%
14.23% 14.23%
14.21%
15.63% 15.24%
14.40%
2011 2012 1Q 2012 2Q 2012 3Q 2012 4Q 2013 1Q
Consolidated Bank-Only
COR includes specific and general as well as other provision expenses Cum.ratio = annualized Provision Exp. (incl.GLLP) / Avr quarter-end Loans. Quar.ratio = annualized Provision Exp. (incl. GLLP) / Avr of last 2 quarter-end Loans
11
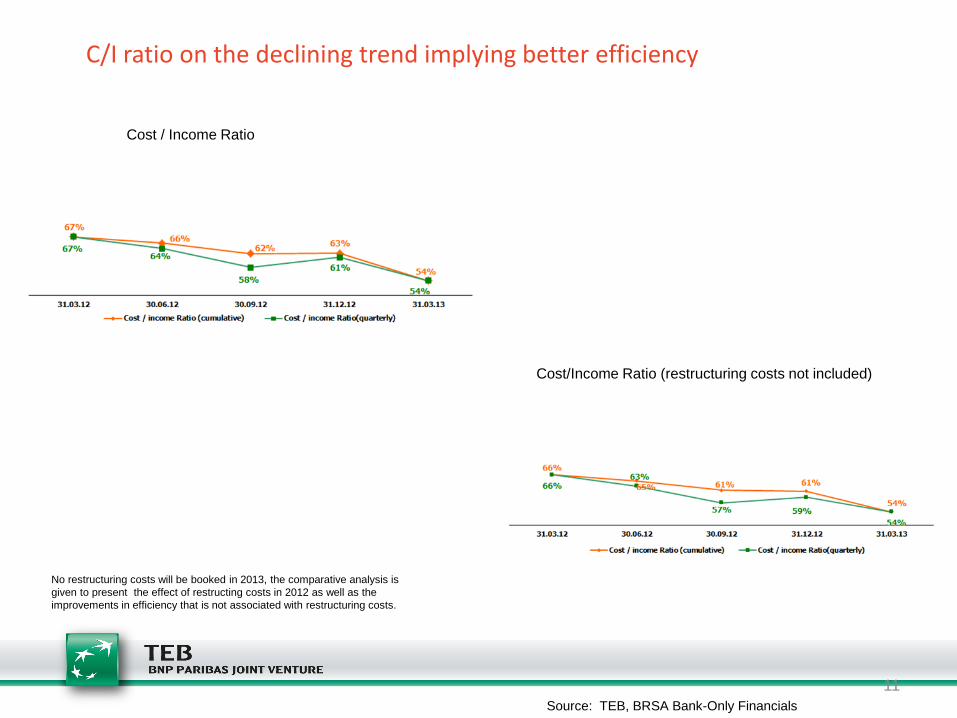
C/I ratio on the declining trend implying better efficiency
Cost / Income Ratio
Cost/Income Ratio (restructuring costs not included)
Source: TEB, BRSA Bank-Only Financials
No restructuring costs will be booked in 2013, the comparative analysis is
given to present the effect of restructing costs in 2012 as well as the
improvements in efficiency that is not associated with restructuring costs.
12
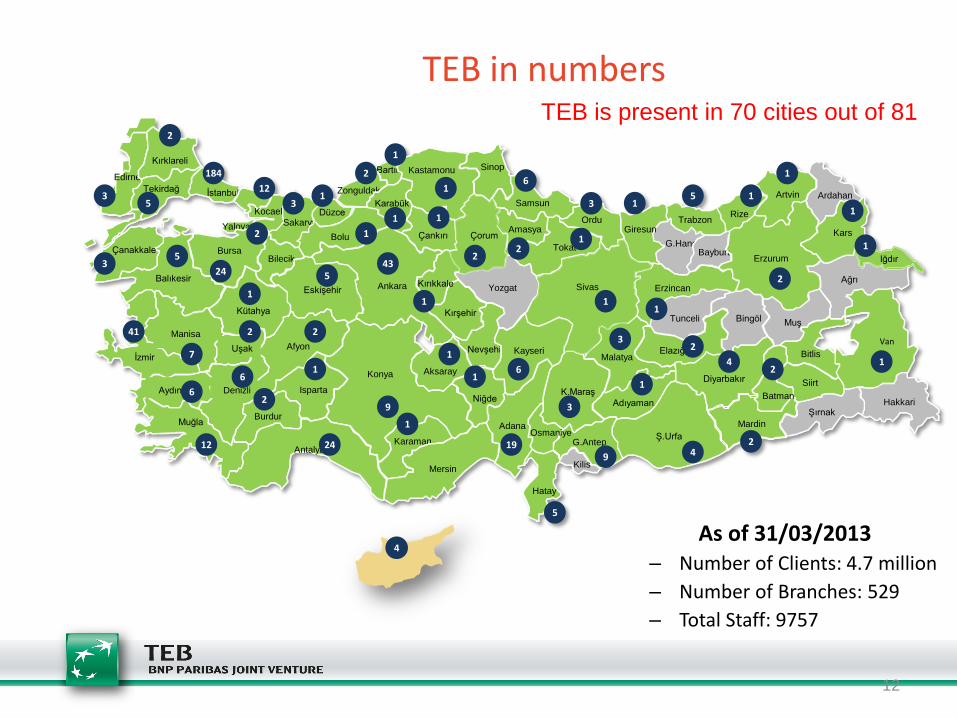
TEB in numbers
As of 31/03/2013 – Number of Clients: 4.7 million
– Number of Branches: 529
– Total Staff: 9757
TEB is present in 70 cities out of 81
Van
Konya
Nevşehir
Kırşehir
Sinop Bartın
Çankırı
Bilecik
Tokat
Bitlis
Hakkari Şırnak
Siirt
Karaman
Balıkesir
Afyon
Uş ak
Aydın
İzmir
Edirne
Kırklareli
İstanbul Tekirdağ
Çanakkale
Kocaeli
Yalova
Zonguldak
Kastamonu
Samsun
Ankara Kırıkkale
Aksaray
Isparta
Burdur
Antalya
Mersin
Niğde
Yozgat
Amasya Ordu
Adana
Hatay
G.Antep
K.Maraş
Malatya
Adıyaman
G.Hane
Muğla
Düzce
Osmaniye
Kilis
Sakarya
Bayburt
Denizli Aydın
Uşak
Manisa
Bingöl Tunceli
Van
Muş
Ş.Urfa
Elazığ
Diyarbakır
Mardin
Batman
Erzincan
Giresun Trabzon
Rize
Eskişehir
Bursa
Kütahya
Bolu
Sivas
Çorum
Kayseri
Karabük Ardahan
Ağrı
Iğdır
Artvin
Kars
Erzurum
184
19
1
2
1
2
43
24
1
6
5
2
1
2
24 3
2
6
4
1 3
2
1
2 5
9
1
5
1
41
3
1 1
1
6
1
2
12
9
1
3
7
2 12
1
3 1
6
1
4
5 5
2
1
2
2
3
1
1
1
1
1
4

13
Ratings of TEB
FITCH Rating Outlook
Short Term LC F2
Long Term LC BBB + Stable
Short Term FC F3
Long Term FC BBB Stable
Individual bbb-
National AAA (tur) Stable
Support 2
MOODY'S Rating Outlook
Banking Financial Strength Rating D+ Negative
Long Term FC Bank Deposits Ba2/NP Stable
Long Term LC Bank Deposits Baa3/P-3 Stable
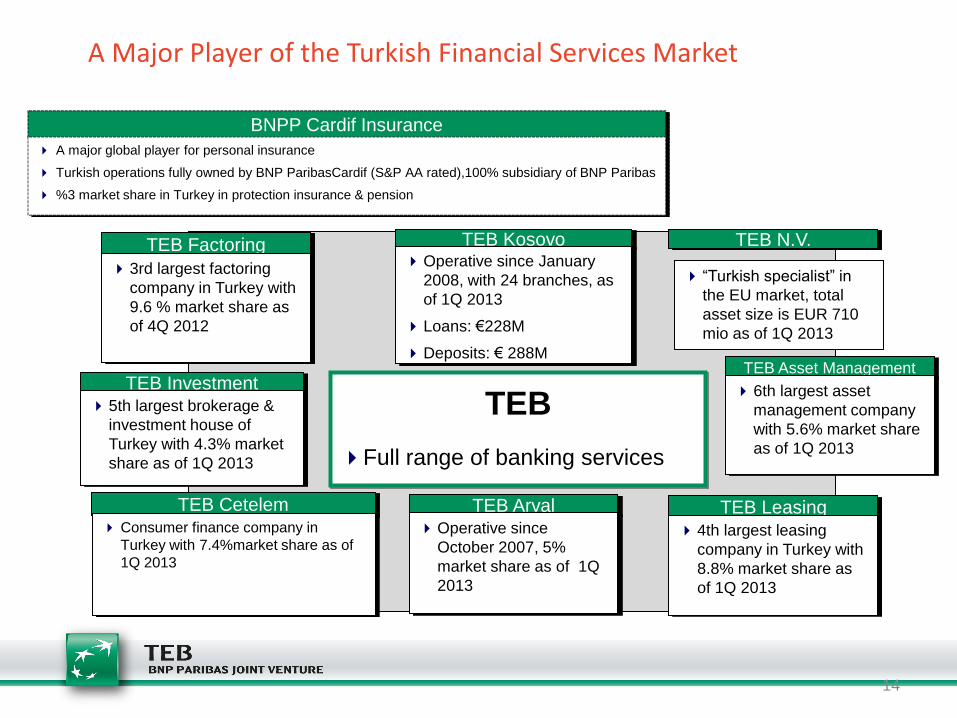
A Major Player of the Turkish Financial Services Market
TEB Investment 5th largest brokerage &
investment house of
Turkey with 4.3% market
share as of 1Q 2013
TEB Asset Management
6th largest asset
management company
with 5.6% market share
as of 1Q 2013
TEB Leasing
4th largest leasing
company in Turkey with
8.8% market share as
of 1Q 2013
TEB Factoring
3rd largest factoring
company in Turkey with
9.6 % market share as
of 4Q 2012
TEB Cetelem Consumer finance company in
Turkey with 7.4%market share as of
1Q 2013
TEB Kosovo Operative since January
2008, with 24 branches, as
of 1Q 2013
Loans: €228M
Deposits: € 288M
TEB Arval Operative since
October 2007, 5%
market share as of 1Q
2013
TEB
Full range of banking services
TEB N.V.
“Turkish specialist” in
the EU market, total
asset size is EUR 710
mio as of 1Q 2013
14
BNPP Cardif Insurance
A major global player for personal insurance
Turkish operations fully owned by BNP ParibasCardif (S&P AA rated),100% subsidiary of BNP Paribas
%3 market share in Turkey in protection insurance & pension
Disclaimer
The information and opinions obtained in this document have been compiled or arrived at by TEB from sources believed to be reliable, but no representation or warranty is made as to their accuracy, completeness or correctness. All opinions and estimates contained in this document constitute TEB’s judgement as of the date of this document and are subject to change without notice. This document is published for the assistance of the recipients, but is not to be relied upon as authoritative or taken in subtitution for the exercise of judgement by any recipient. TEB does not accept any liability for any direct or consequential loss arising from any use of this document or its contents. This document is strictly confidential and may not be reproduced, distributed or published for any purpose.
15