march 2018 - home | pacific environment
TRANSCRIPT

PRACTICAL GUIDE TO
SOLID WASTE MANAGEMENT IN PACIFIC ISLAND COUNTRIES
AND TERRITORIES
March 2018

SPREP Library Cataloguing-in-Publication Data Practical guide to Solid Waste Management in Pacific Island Countries and Territories. Apia, Samoa : SPREP, 2018. 141 p. 29 cm. ISBN: 978-982-04-0765-7 (print) 978-982-04-0766-4 (ecopy) 1. Waste management – Guidelines – Oceania. 2. Waste Minimization – Guidelines. 3. Waste disposal in the Ground – Handbooks, manuals etc. 4. Source reduction (Waste management) – Teaching aids and devices. I. Pacific Regional Environment Programme (SPREP). II. Japanese – Promotion of Regional Initiative on Solid Waste Management (JPRISM). III. Japan International Cooperation Agency (JICA). IV. Title 363.7285

i | P a g e
Foreword
The past 20 years has seen an array of initiatives being implemented in solid waste management
in the Pacific islands region, leading to significant improvements in waste services and
infrastructure. Through the assistance from our development partners in the region such as the
Japan International Cooperation Agency (JICA), European Union (EU), French Development
Agency/Agence Francaise de Developpement (AFD), Department of Foreign Affairs and Trade
(DFAT), Ministry of Foreign Affairs and Trade (MFAT), Asian Development Bank (ADB), United
States Agency for International Development (USAID) and others, these initiatives have been
sustained and technical cooperation enhanced through capacity building, regional exchange
programmes and twinning arrangements (South-to-South Cooperation).
This foundation has enabled countries to build strong pillars in the waste sector. This guidebook
provides a good mix of materials to strengthen these pillars. It shows the direct involvement of
our counterparts in the Pacific island countries and territories in making things happen in the
waste sector, resulting in remarkable progress through genuine collaboration.
While considerable progress has been made, the challenges to enable a pollution-free Pacific still
remain. What is critical to sustaining waste management in the Pacific region is the ability of
countries to continue the current initiatives. In the current 10-year Pacific Regional Waste and
Pollution Management Strategy, or Cleaner Pacific 2025, the direction is to promote sustainable
systems even if priorities change in donor-driven investments. The knowledge shared in this
guidebook will allow countries and territories to confidently take a pathway towards a cleaner
Pacific.
The Secretariat of the Pacific Regional Environment Programme (SPREP) advocates the
principles of 3R + Return, in addition to the promotion of sustainable waste material flow systems
that will reduce the impacts of waste and pollution in the environment. SPREP’s Strategic Plan
2017-2026 aspires for the Pacific people to benefit from improved waste management and
pollution control. This guidebook contains successful case studies which support these
aspirations as well as acting as a model in developing future programmes in the waste and
pollution sector.
The vision for a cleaner Pacific is starting to take shape and with the strong partnerships created
and strengthened between countries, donors (development partners), private sector, regional
organisations, academia, civil society and other stakeholders, the limiting conditions in the Pacific
to address waste issues can be easily overcome.
With clear direction and workable initiatives, the roadmap to a cleaner Pacific is within our grasp.
Kosi Latu
Director General, Secretariat of the Pacific Regional Environment Programme
ii | P a g e
Recommendation
As agreed upon at Rio+20, the world community will make every effort to achieve sustainable
development goals. The central pillar of that effort is the conversion of our society into a
recycling-oriented society. That conversion in Small Island Developing States (SIDS) is extremely
challenging because of their small size and remoteness from the international recycling market.
In close collaboration with SPREP, Japan has been helping Pacific island countries (PICs) and
territories to tackle solid waste problems since the second Pacific Islands Leaders Meeting
(PALM 2) with Japan. In 2011-2016, through the Japan Technical Project on the Promotion of
Regional Initiatives on Solid Waste Management in the Pacific Island Countries (J-PRISM) Phase
I, Japan collaborated with 11 Pacific island countries to promote 3R, as well as to identify,
develop and share good practices.
This Practical Guide is the compilation of good practices identified and developed by experts in
the region through J-PRISM Phase I. This covers all solid waste management (SWM) issues
from the technical ones, such as waste generation survey and landfill improvement, to the
managerial ones, such as contract management and user pays system. These good practices
have high applicability to other Pacific islands, although modification and adaptation are always
necessary.
We have just started J-PRISM Phase II in order to continue and develop further our efforts to
achieve sustainable development goals. The use of this Practical Guide is strongly
recommended for people who are responsible for solid waste management in Pacific island
countries and territories. Through the active use of this guide and the feedback of results to the J-
PRISM Phase II Project Office, this guide will be revised and improved. Let us work together to
materialise a Cleaner Pacific.
Kunitoshi Sakurai, Dr. Eng.
Professor Emeritus, Okinawa University
Chairman of JICA’s Advisory Committee for J-PRISM Phase II

iii | P a g e
Acknowledgement
This guidebook is a product of collaboration and the very first book written by the officers of
various Pacific island countries who have been engaged in solid waste management. The
readers will find useful case studies as well as Annexes based on practical experiences within the
region. The editors would like to acknowledge and thank the hard work of a number of
contributors to this guidebook:
Mr. Amos Mathias, former officer with Port Vila Municipal Council, Vanuatu Mr. Calvin Ikesiil, Manager, SWM Office, Bureau of Public Works, MPIIC, Palau Mr. Charles Lohn, Environmental Specialist, Environment Protection Agency, Pohnpei, Federated
States of Micronesia Ms. Christina Fillmed, Executive Director, Environment Protection Agency, Yap, Federated States
of Micronesia Ms. Feauini Veikoso Laumanu, Officer, MEIDECC, Tonga Mr. James Ricky, Waste Management Division, NCDC, Papua New Guinea Mr. Joshua Sam, Manager, Waste Management Division, NCDC, Papua New Guinea Mr. Manase Pongi, Health Inspector, Ministry of Health, Tonga Ms. Vivianne Morofa, Officer, Waste Management Division, NCDC, Papua New Guinea Ms. Nafiza Ali, Health Inspector, Nadi Town Council, Fiji Mr. Newal Naidu, Health Inspector, Labasa Town Council, Fiji Mr. Roger Tary, former officer with Port Vila Municipal Council, Vanuatu Mr. Rouhit Singh, Manager, Lautoka City Council, Fiji Mr. Selby Etibek, Manager, SWM Office, Koror State Government, Palau Mr. Shalend Singh, Senior Health Inspector, Lautoka City Council, Fiji Ms. Wendy Beti, Officer, MECCDM, Solomon Islands This book contains a number of photos and materials provided by officers, experts and
individuals involved with projects. SPREP/JICA would like to express its appreciation to all the
institutions and individuals who have shared their valuable experience in this book.
This book may contain some information from other sources our contributors did not
acknowledge. Most of our contributors to this first edition of the Practical Guide to Solid Waste
Management in Pacific Island Countries and Territories are field officers and staff, and therefore
may lack awareness and knowledge of copyright. The Editors would like to apologise for any
inconveniences caused and are willing to make any corrections and proper acknowledgement of
those affected in the 2nd Edition of this Book.
Editors: Faafetai Sagapolutele, Chief Editor, Assistant Chief Advisor, J-PRISM
Ma Bella Guinto, SWM Advisor, SPREP
Mahmoud Riad, JICA Expert, J-PRISM
Shiro Amano, JICA Advisor, J-PRISM
Dolly Autufuga, Project Assistant, J-PRISM
iv | P a g e
TABLE OF CONTENTS
CHAPTER 1: INTRODUCTION ....................................................................................... 1
1.0 INTRODUCTION ................................................................................................... 1 1.1 BACKGROUND .................................................................................................... 1 1.2 PACIFIC FEATURES ............................................................................................ 1 1.3 SOLID WASTE MANAGEMENT IN PACIFIC ISLANDS ........................................ 2
CHAPTER 2: BASIC SURVEYS & USE OF INFORMATION FOR
WASTE MANAGEMENT PLANNING ............................................................................. 3
2.0 BASIC WASTE SURVEYS & WASTE MANAGEMENT PLANNING ..................... 4 2.1 KEY WASTE SURVEYS FOR ASSESSING WASTE ............................................. 4 MANAGEMENT CONDITIONS .............................................................................. 4
2.1.1 Waste Flow .................................................................................................................. 4
2.1.2 Waste Generation and Composition Survey ................................................................. 9
2.1.3 Time and Motion Study .............................................................................................. 11
2.1.4 Public Opinion Survey ................................................................................................ 13
2.2 SOLID WASTE MANAGEMENT PLANNING ...................................................... 15
2.2.1 Uses of Extracted Basic Waste Data and Information for Planning Purposes ............. 16
2.2.2 Development of Solid Waste Management Plan......................................................... 17
CHAPTER 3: STRATEGIC MEASURESTO IMPROVE SOLID
WASTE MANAGEMENT IN PACIFIC ISLAND COUNTRIES ........................................ 20
3. 1 COLLECTION AND TRANSPORT OF WASTE .................................................. 21
3.1.1 Extending Public Collection to Rural Areas and Remote Islands ................................ 21
3.1.2 Community Driven Collection Service ........................................................................ 21
3.2 WASTE LANDFILL MANAGEMENT & IMPROVEMENTS ................................ 23
3.2.1 Key Landfill Management Aspects ............................................................................. 23
3.2.2 Waste Disposal Site Cheap Improvement Works ....................................................... 26
3.2.3 Planning & Designing of Major Improvement Rehabilitation Works ............................ 27
3.2.4 Harmonisation with Waste Pickers ............................................................................. 35
3.2.5 Waste Landfill Data Management .............................................................................. 35
3.3 WASTE MANAGEMENT PLANTS AND EQUIPMENT ........................................ 36
3.3.1 Types of Waste Plants and Equipment ....................................................................... 36
3.3.2 Selection of Plants and Equipment ............................................................................. 37
3.3.3 Operation and Maintenance of Plants and Equipment ................................................ 38
3.4 CONTRACT MANAGEMENT .............................................................................. 41
3.4.1 Collection Services Contract Management ................................................................. 42
3.4.2 Waste Landfill Services Contract Management .......................................................... 43

v | P a g e
3.5 OCCUPATIONAL SAFETY AND HEALTH (OSH) ............................................... 44 3.6 EDUCATION AND AWARENESS ....................................................................... 46
3.6.1 Clean School Programme .......................................................................................... 46
3.6.2 Public and Community Awareness ............................................................................. 47
CHAPTER 4: IMPLEMENTATION OF 3RS PLUS RETURN ......................................... 49
4.0 THE 3RS PLUS RETURN .................................................................................... 50 4.1 RETURN TO EARTH OF GREEN WASTE .......................................................... 50
4.1.1 Green Waste Chipping and Mulching ......................................................................... 51
4.1.2 Home Composting ..................................................................................................... 53
4.1.3 Centralised Composting ............................................................................................. 54
4.2 RETURN OF RECYCLALE WASTES ................................................................. 56
4.2.1 Collection, Packing and Shipping of Recyclable Wastes ............................................ 56
4.2.2 Public-Private Partnership in implementing Recycling ................................................ 59
CHAPTER 5: WASTE FINANCING MECHANISMS FOR
SUSTAINABLE MANAGEMENT OF WASTE IN PICS ................................................. 61
5.0 FINANCING MECHANISMS FOR SUSTAINABLE WASTE MANAGEMENT IN PICS ........................................................................................... 62 5.1 ADVANCE DEPOSIT SYSTEMS (ADS) FOR IMPORTED GOODS AND PRODUCTS .............................................................................................................. 62
5.1.1 Container Deposit Legislation (CDL) .......................................................................... 62
5.1.2 Green Fee (Palau case) ............................................................................................. 66
5.2 USER PAY SYSTEM ........................................................................................... 68
5.2.1 Prepaid Rubbish Bags ............................................................................................... 68
5.2.2 Tipping Fees .............................................................................................................. 71
CHAPTER 6: EMERGING ISSUES ............................................................................... 73
6.0 EMERGING ISSUES ............................................................................................... 74
6.1 RESILIENCE TO CLIMATE CHANGE ................................................................. 74
6.1.1 Post Disaster Waste Management ............................................................................. 74
6.1.2 Adaptation Measures ................................................................................................. 77
REFERENCES..................................................................................................................82
LIST OF ANNEXES ...................................................................................................... 83

vi | P a g e
LIST OF TABLES Table 1: Baseline Surveys required to formulate a Waste Flow .................................................... 5
Table 2: Summary of the At Source Waste Generation & Composition Survey Approach .......... 10
Table 3: Summary of the Disposal Site Assessment Approach .................................................. 11
Table 4: Key Information of a TMS ............................................................................................. 12
Table 5: Basic Operations for Disposal Sites Management ........................................................ 23
Table 6: Key Information to Investigate during large and full rehabilitation works ....................... 28
Table 7: Key Measures for Determining the Final Rehabilitation Plan ........................................ 29
Table 8: Key Management Plants and Equipment in PICs ......................................................... 38
Table 9: Key Aspects to Check before Ordering or Buying Equipment ....................................... 38
Table 10: Key Aspects for Plants and Equipment Maintenance ................................................. 40
Table 11: Showing Comparative Data from PICs in terms of Green Waste ................................ 51
Table 12: Usual Global Rates of Scrap Metals ........................................................................... 56
Table 13: Cost Estimate for a Container (20ft) of Aluminum Cans.............................................. 58
Table 14: Costing Estimate for a Container of Steel Cans .......................................................... 58
Table 15: Public-Private Partnership Approaches in PICs .......................................................... 60
Table 16: Key Areas of a Feasibility Study for a CDL ................................................................. 64
Table 17: Key Players for Palau's CDL ...................................................................................... 65
Table 18: Example of a Tipping Fee System based on Sizes or Capacities of Vehicles ............. 72
Table 19: Example of Tipping Fee Rates at Lautoka, Fiji ........................................................... 72

vii | P a g e
LIST OF FIGURES
Figure 1: Illustration of the Waste Flow Situation in Pacific Islands with unknown paths and
destinations of some generated waste between their points of generation and final disposal ....... 5
Figure 2: Basic Waste Flow.......................................................................................................... 9
Figure 3: General Solid Waste Management Planning Process ................................................. 16
Figure 4: Detailed Baruni Plan for Construction.......................................................................... 30
Figure 5: Cross Section of the Laid Leachate Pipe ..................................................................... 30
Figure 6: Common Contract Management Process in PICs ....................................................... 42
Figure 7: Palau CDL System Chart ............................................................................................ 63
Figure 8: Flow of Green Fee ($) ................................................................................................. 66
Figure 9: Scenario for Improvement of Fees Collection form a Prepaid Bag Initiative ................ 71

1 | P a g e
CHAPTER 1
INTRODUCTION
Contributor
Mr Shiro Amano

1 | P a g e
1.0 INTRODUCTION ______________________________________________________________________________________
1.1 BACKGROUND This Guidebook is primarily targeted at practitioners of solid waste management in Pacific island
countries and territories. Many parts of this book are also applicable, either directly or with
modifications, to other small island developing states where similar problems associated with
solid waste are common.
In Labasa, Fiji in 2015, J-PRISM conducted training of trainers involving officers with specific
technical skills. In 2016, those officers were assembled in Okinawa, Japan to discuss and
prepare their contribution to a draft of the Pacific Regional Solid Waste Management Guidebook
based on their own good practices and experience. This Guidebook is mostly written by officers
from Pacific island countries.
1.2 PACIFIC FEATURES More than seven thousands islands are spread over the Pacific Ocean, which is almost a sixth of
the surface of the globe. The islands are generally classified into three sub-regions, namely
Micronesia (north), Melanesia (south-west) and Polynesia (south-east) from the viewpoint of
ethnic, linguistic and cultural differences. With the exception of Papua New Guinea and Fiji, most
countries in the Pacific are relatively very small in terms of landmass and population compared to
countries in Asia and Africa.
A number of Pacific islands are tourist destinations with the expectation of clear blue sky, white
sandy beaches, coconut trees and the island hospitality. The traditional subsistence lifestyle with
local food and supplies had no significant impact on the island environment or public health. Over
time, however, as the changes in the quality and amount of waste become significant, poor waste
management has been recognised as a major threat to sustainable development in Pacific island
countries. Poorly managed waste has the potential to cause negative impacts on national
development activities including tourism and trade, food supplies, public health and the island
environment.
In most Pacific islands, there are some common features that are quite different from those of
industrialised countries. Such features include, but are not limited to, the following:
- Geographical isolation (surrounded by vast ocean and poor access)
- Smallness (small and limited land space)
- Remoteness (far from the international markets)
- Dependency (heavy reliance on imported goods and foreign aid)
As stated earlier, islands are surrounded and separated by a vast ocean and the access between
islands is very poor and limited. Therefore, mobility is a critical problem in the region. Most Pacific
island countries are relatively small in terms of available land space and population size. Both
geographical isolation and remoteness significantly pose negative impacts on transportation and
its cost because islands are located far from the international markets.
In addition, because of the change in lifestyle, people rely on imported goods and products. Many
countries are still heavily dependent on foreign aid for economic development.
2 | P a g e
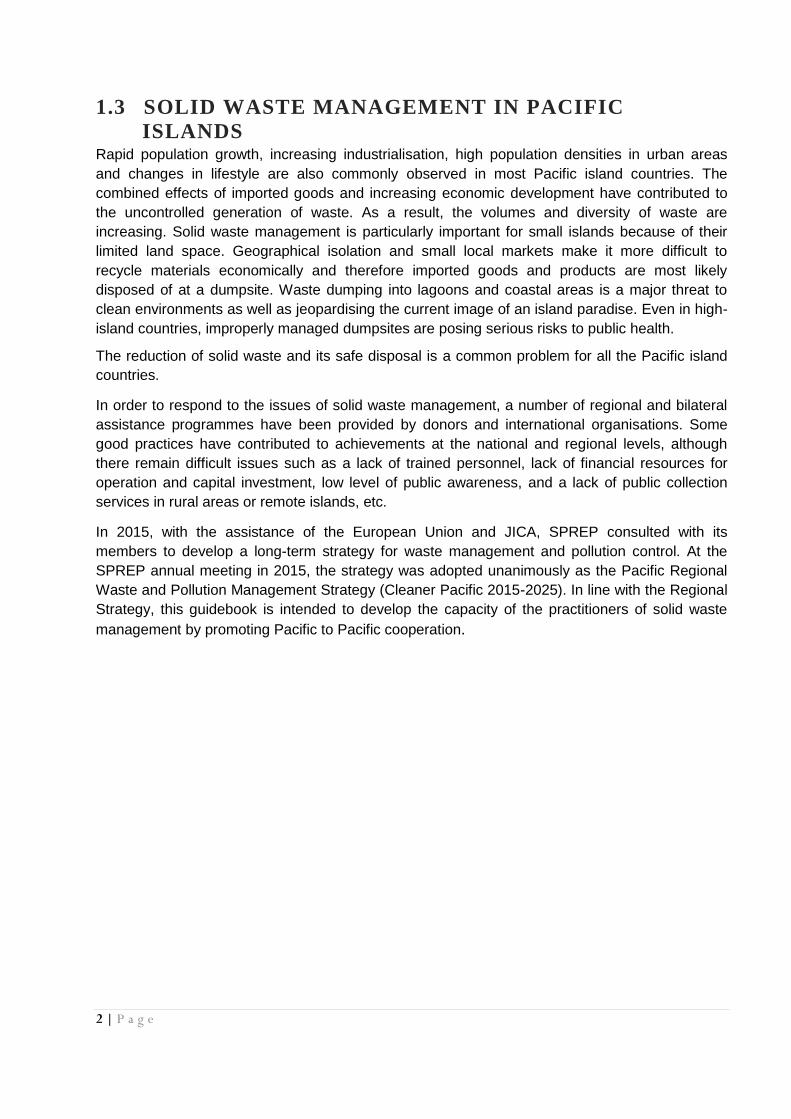
1.3 SOLID WASTE MANAGEMENT IN PACIFIC
ISLANDS Rapid population growth, increasing industrialisation, high population densities in urban areas
and changes in lifestyle are also commonly observed in most Pacific island countries. The
combined effects of imported goods and increasing economic development have contributed to
the uncontrolled generation of waste. As a result, the volumes and diversity of waste are
increasing. Solid waste management is particularly important for small islands because of their
limited land space. Geographical isolation and small local markets make it more difficult to
recycle materials economically and therefore imported goods and products are most likely
disposed of at a dumpsite. Waste dumping into lagoons and coastal areas is a major threat to
clean environments as well as jeopardising the current image of an island paradise. Even in high-
island countries, improperly managed dumpsites are posing serious risks to public health.
The reduction of solid waste and its safe disposal is a common problem for all the Pacific island
countries.
In order to respond to the issues of solid waste management, a number of regional and bilateral
assistance programmes have been provided by donors and international organisations. Some
good practices have contributed to achievements at the national and regional levels, although
there remain difficult issues such as a lack of trained personnel, lack of financial resources for
operation and capital investment, low level of public awareness, and a lack of public collection
services in rural areas or remote islands, etc.
In 2015, with the assistance of the European Union and JICA, SPREP consulted with its
members to develop a long-term strategy for waste management and pollution control. At the
SPREP annual meeting in 2015, the strategy was adopted unanimously as the Pacific Regional
Waste and Pollution Management Strategy (Cleaner Pacific 2015-2025). In line with the Regional
Strategy, this guidebook is intended to develop the capacity of the practitioners of solid waste
management by promoting Pacific to Pacific cooperation.

3 | P a g e
CHAPTER 2 BASIC SURVEYS & USE OF INFORMATION
FOR WASTE MANAGEMENT PLANNING
Contributors
Waste Flow by Shalend Singh, Fiji
Waste Characterisation by Wendi Beti, Solomon Islands
Time and Motion Study by Vivianne Morofa, Papua New Guinea
Public Opinion Survey by Rouhit Singh, Fiji
Solid Waste Management Planning by Shalend Singh, Fiji

4 | P a g e
2.0 BASIC WASTE SURVEYS & WASTE
MANAGEMENT PLANNING _____________________________________________________________________________
The implementation of waste surveys for extracting baseline data and information is the key to
successful waste management planning. When developing waste facilities, programmes, plans,
policies and laws, getting the baseline information and data to begin with is a necessity. Failure to
recognise the importance of baseline information and data is one of the main causes of poor and
unsuccessful waste management programmes, plans, policies and laws in Pacific island countries
and territories.
The first part (2.1) of this guide discusses the basic waste surveys used for improving or
developing waste management strategies. These waste surveys have been conducted in most of
the Pacific island countries under several donor-funded waste management projects, including
the Japan Technical Project on the Promotion of Regional Initiatives on Solid Waste Management
in the Pacific Island Countries (JPRISM). The experiences and lessons learnt from these surveys
have been analysed, summarised and presented in a simple way for waste practitioners. While
there are several methodologies to extract waste data and information, the following surveys are
commonly used in the region to collect waste related information and data for decision-making
purposes.
Waste Flow
Waste Generation & Composition Survey
Time and Motion Study
Public Opinion Survey The second part (2.2) discusses the general waste management planning process with more
emphasis on the use of baseline information from the waste surveys as the basis of decision-
making. It also provides an overview of the development of Waste Management Policy and
Strategy.
2.1 KEY WASTE SURVEYS FOR ASSESSING WASTE
MANAGEMENT CONDITIONS
2.1.1 Waste Flow1
A Waste Flow (stream) is a snapshot of how the waste flows from the generation sources to the
final disposal sites, through a formal and informal municipal solid waste management system.
Understanding the amounts of the generated waste from all sources (domestic and commercial)
and their paths and destinations is crucial for the sustainable management of municipal solid
waste. The Pacific islands, like many other developing countries, poorly understand the sources
and amounts of their generated municipal solid waste including their final destinations. For this
reason, there are always unknown types and quantities of waste diverted to waste minimisation
initiatives (recycling, composting, reuse, etc.), or burnt and illegally disposed of in backyards and
informal disposal sites.
1 Base Information produced by Shalend Singh of Lautoka City Council, Fiji – Waste Flow in Lautoka, Fiji, 2015

5 | P a g e
Figure 1: Illustration of the Waste Flow Situation in Pacific Islands with unknown paths and
destinations of some generated waste between their points of generation and final disposal
a) How to Develop a Waste Flow of an Area (Municipality or Country)
Understanding the actual flow of waste requires a number of waste surveys such as Waste
Generation and Composition Survey, Recycling Survey (to find out how much is recovered and
collected for recycling), Final Disposal Survey (to determine how much is actually reaching the
final disposal sites), Time and Motion Survey (to estimate the collected wastes) and Public
Opinion Survey (to determine the amounts being disposed illegally or burnt). The next section
discusses some of these surveys.
Table 1: Baseline Surveys required to formulate a Waste Flow
Survey Objectives
1. Waste Generation &
Composition Survey
(WGCS)
Obtain data on waste generation rate (by generation source per
day) and physical composition per generation source to develop a
waste flow (stream).
2. Final Disposal Amount
Survey (FDAS)
Confirm the number of incoming collection vehicles to the disposal
site, loading weight of each vehicle, etc.
3. Time & Motion Survey Understand the manner of discharge and collection and recognise
problems with the waste collection system, e.g. illegal disposal,
collection crew behavior, occupational safety and health, etc.
4. Public Opinion Survey
(POS)
Grasping customary practices, recycling practices, on site recycling,
improper disposal and self-disposal at generation sources in a
community.
5. Compost Demand &
Market Survey
Confirmation of the demand and market capacity of compost. Also
estimate amount of organic waste composted.
6. Recycling Survey The flow of recyclables from collection to exportation, grasping the
scale of the recycling industry, etc.
Waste
generation
Final
Disposal ?

6 | P a g e
Steps to Follow to Make a Waste Flow Step 1: Estimate the Total Municipal Solid Waste generation by assessing the generated
quantities at all identified sources – domestic (households), commercial (shops, restaurants,
offices, hotels, market, etc.), public (parks, streets, etc.), schools, etc.
Domestic waste from households & waste from businesses and offices as main waste sources
Step 2: Measure the final disposal amount to identify the final end of the waste flow.
Incoming Truckloads are weighed before disposing of waste at the disposal sites
Step 3: To investigate and Estimate the Quantity of illegal or inappropriate waste disposal
(Burning, Littering, backyard disposal, etc.)
Waste disposed of inappropriately in line with national laws
Step 4: To Investigate and Estimate the Quantity of Waste being self-disposed (e.g. burying
kitchen waste or burning garden waste in the backyard where burning is allowed in an area
without waste collection services, backyard accumulations. The amount of self-disposal can be
estimated based on the data obtained by POS, etc.)
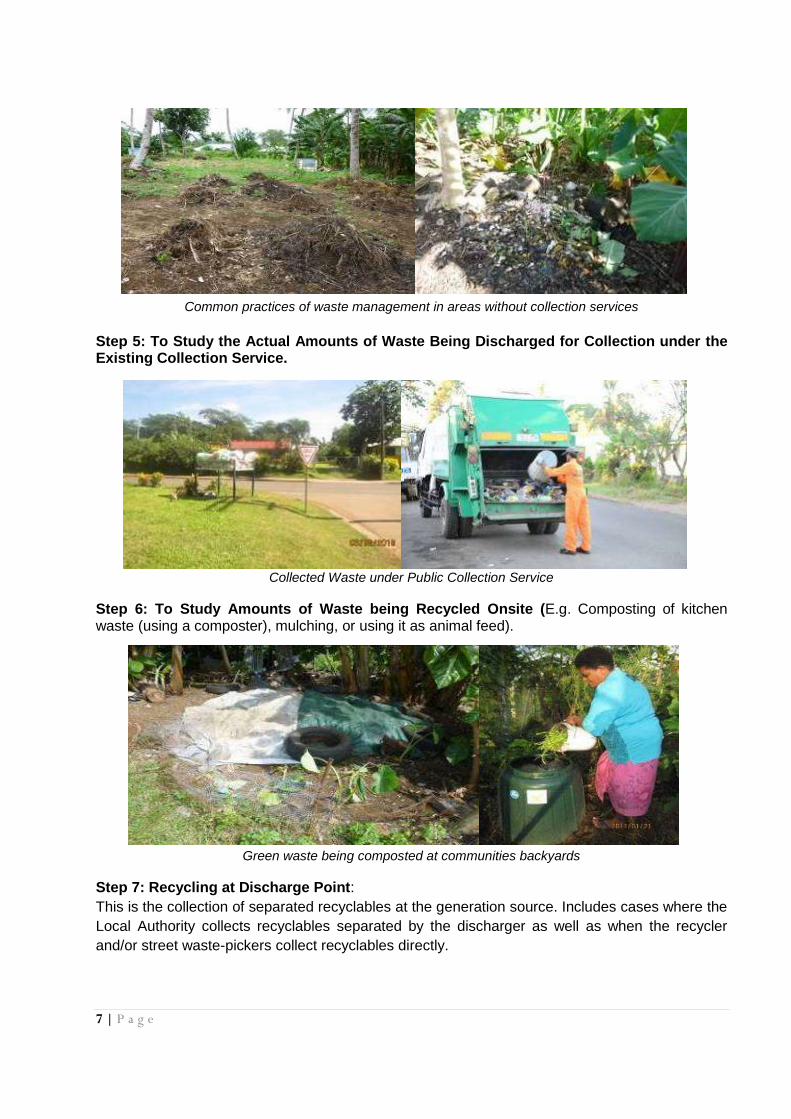
7 | P a g e
Common practices of waste management in areas without collection services
Step 5: To Study the Actual Amounts of Waste Being Discharged for Collection under the Existing Collection Service.
Collected Waste under Public Collection Service
Step 6: To Study Amounts of Waste being Recycled Onsite (E.g. Composting of kitchen waste (using a composter), mulching, or using it as animal feed).
Green waste being composted at communities backyards
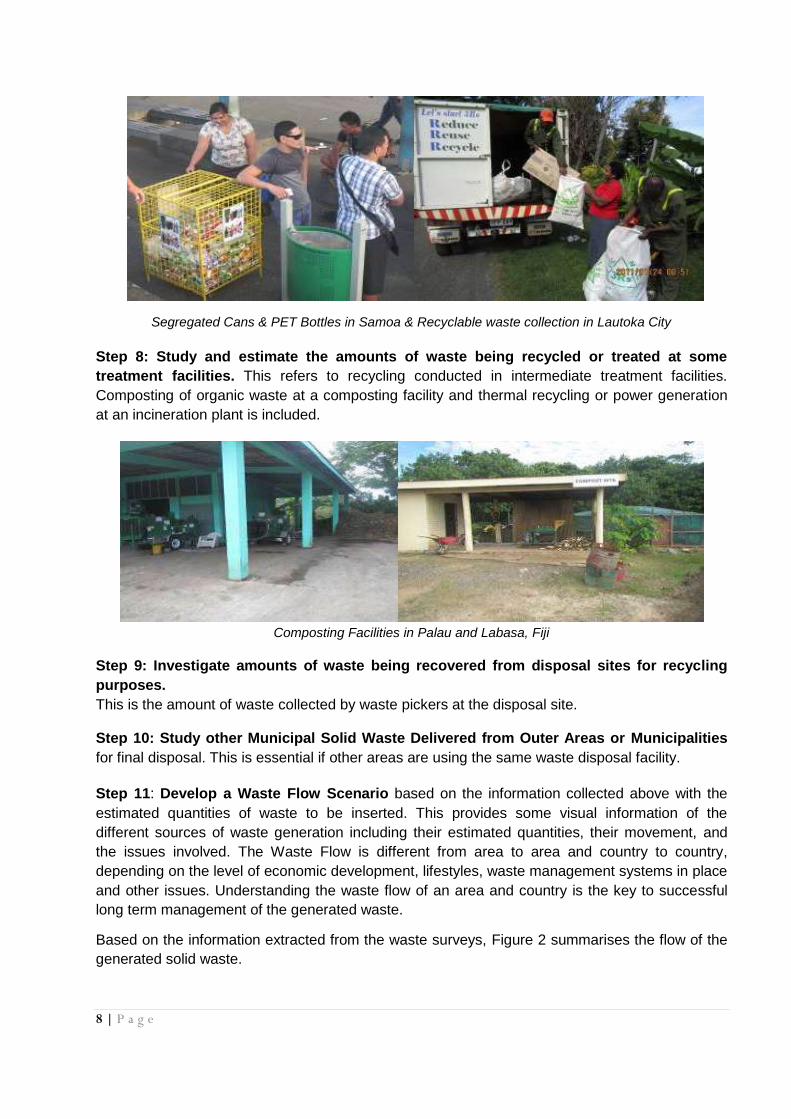
Step 7: Recycling at Discharge Point:
This is the collection of separated recyclables at the generation source. Includes cases where the
Local Authority collects recyclables separated by the discharger as well as when the recycler
and/or street waste-pickers collect recyclables directly.
8 | P a g e
Segregated Cans & PET Bottles in Samoa & Recyclable waste collection in Lautoka City
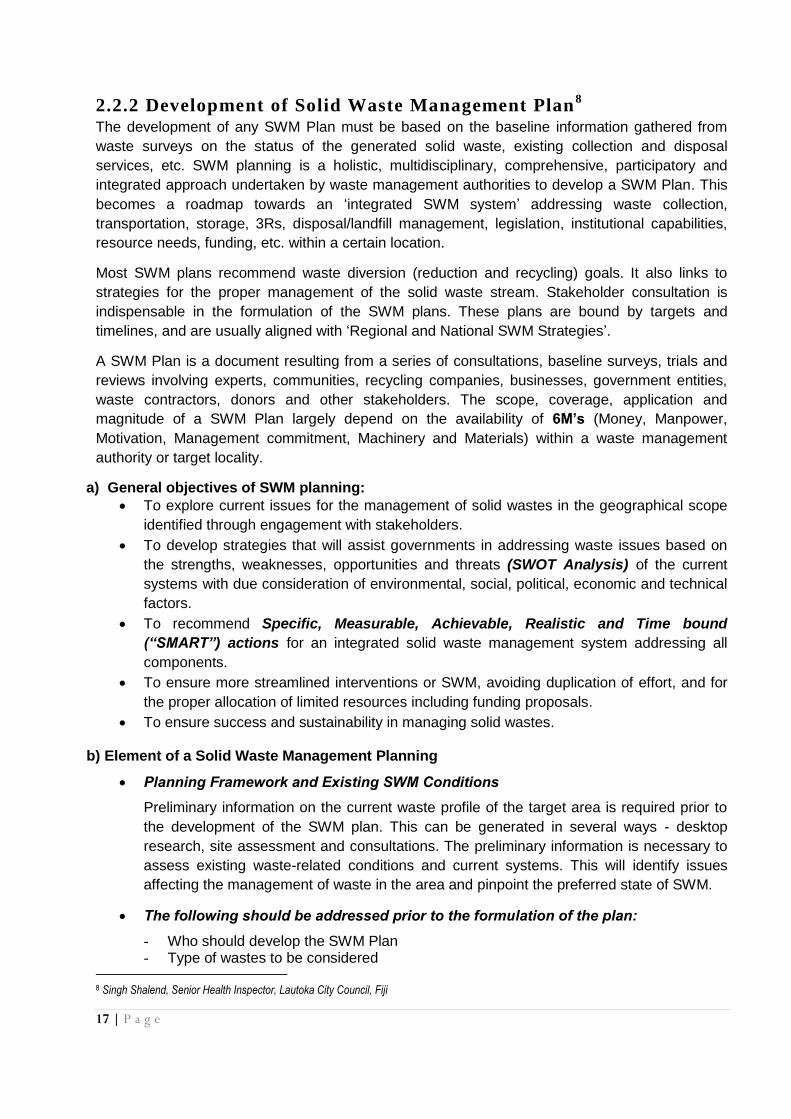
Step 8: Study and estimate the amounts of waste being recycled or treated at some
treatment facilities. This refers to recycling conducted in intermediate treatment facilities.
Composting of organic waste at a composting facility and thermal recycling or power generation
at an incineration plant is included.
Composting Facilities in Palau and Labasa, Fiji
Step 9: Investigate amounts of waste being recovered from disposal sites for recycling
purposes.
This is the amount of waste collected by waste pickers at the disposal site. Step 10: Study other Municipal Solid Waste Delivered from Outer Areas or Municipalities
for final disposal. This is essential if other areas are using the same waste disposal facility.
Step 11: Develop a Waste Flow Scenario based on the information collected above with the
estimated quantities of waste to be inserted. This provides some visual information of the
different sources of waste generation including their estimated quantities, their movement, and
the issues involved. The Waste Flow is different from area to area and country to country,
depending on the level of economic development, lifestyles, waste management systems in place
and other issues. Understanding the waste flow of an area and country is the key to successful
long term management of the generated waste.
Based on the information extracted from the waste surveys, Figure 2 summarises the flow of the
generated solid waste.

9 | P a g e
Figure 2: Basic Waste Flow
2.1.2 Waste Generation and Composition Survey
This survey assesses the nature of the generated solid waste in an area – community, village,
town, municipality, business or organisation. Most of the surveys targeted the generating
sources, where samples of wastes are collected from a sampled population (households and
businesses including institutions) on a daily basis for a period of seven consecutive days for
assessment. This is the At Source Assessment Approach, which most waste officials in the
Pacific Islands are aware of (Refer Annex 1 on the detailed procedures based on the experiences
in Honiara, Solomon Islands)2.
The other assessment type is known as the Disposal Site Assessment Approach, which is hardly
implemented due to the absence of a weighbridge. Both approaches have advantages and
disadvantages and can produce the same information for waste management planning purposes
and are briefly discussed here.
a) At Source Assessment Approach3
This is the common approach where a number of households are selected from an area of
interest for assessment. The waste from the selected households are collected for a period of
eight consecutive days, but the first day collected waste is ignored as it may contain waste of
more than one day. The key information and data for this study is summarised in Table 2 below:
2 Beti, W., Waste Generation and Composition Survey in Honiara, Solomon Islands, 2015 3 Sagapolutele Faafetai, Assistant Chief Advisor, J-PRISM II
1. MSW Generation
5. On-site Recycling
3. Self-disposal
2. Improper Disposal
4. Discharge
7. Recycling at Discharge Point
6. Collection
12. Waste of Other Local Governments
13. Other Wastes than MSW
10. Final Disposal
8. Intermediate Treatment
11. Recycling at Disposal Site
9. Recycling at Treatment Facility
Basic Waste Stream
0. Waste Reduction by Policy, etc.
3R Methods
On-site MSWM Off-site MSWM

10 | P a g e
Table 2: Summary of the At Source Waste Generation & Composition Survey Approach
Information Extracted
Use for Calculation of Baseline Data
1. No. of People in the surveyed households
This is collected through a structured questionnaire. Households are expected to provide information including the number of people in all the surveyed households.
Calculation of the Overall Waste Generation Rate
= Total Waste (Kg) in 7 days 7 days = Daily Amount (kg) = Daily Amount (kg) Total No. of People in the Surveyed Households = kg per person per day
2. Total weight of the collected waste from the surveyed households during the seven consecutive days period
The weight (kg) of the collected rubbish bags during the seven consecutive days of the survey are measured and recorded for calculation of the total weight of the collected waste during the survey.
3. Waste Density Estimation
From the collected rubbish bags from the surveyed households, 5-10 bags are randomly selected for the assessment of both the waste densities and waste composition. These bags are weighed and recorded. The contents of all the weighed bags are then emptied into a container of known volume. The total number of full containers is recorded for waste densities calculation.
Calculation of the Waste Density = Total Waste (Kg) from the 5-10 bags Total number of full bins from the 5-10 bags = Kg per m3 N.B. If possible depending on the number of the available survey team members, all the collected survey bags (10-30) can be assessed for the waste density estimation especially in rural areas or remote islands with one income level.
4. Waste Composition Estimation
The contents of the samples used during the waste density estimation (i.e. 5-10 bags) are used to assess the waste composition. After the density estimation, the contents of the waste are emptied on a tarpaulin for the investigation of the waste makeup. The waste items are separated according to different key waste items – organic, plastics, papers, metals, glasses, textiles and others. After segregating the waste, each separated category is weighed and recorded.
Calculation of the Waste Composition (percentage) = Each Waste Type Weight (kg) x 100% Total weight of all the Waste Categories = Each Waste Category % = Plastics % etc.
b) Disposal Site Assessment Approach4
The Disposal Site as another option of investigating waste generation and composition can be
used if there is a weighbridge at the disposal site. Table 3 provides general information on this
approach.
4 Sagapolutele Faafetai, Assistant Chief Advisor, J-PRISM II

11 | P a g e
Table 3: Summary of the Disposal Site Assessment Approach
Information Extracted How
The use of this method to estimate generation rate is possible if there is a weighbridge. Without a weighbridge, the weight of a truckload of waste cannot be measured to determine the amounts of the collected waste from a targeted area of interest for assessment. If there is a weighbridge, the weights of all the truckloads collected from the targeted area within a week are measured and recorded. The next important information is to obtain the population of the targeted area from the most recent population census. This is used to calculate the generation per person.
Calculation of the Overall Waste Generation Rate = Total No of Loads X Weight of the Truckloads Assuming that the number of loads collected from Zone A in one week during the two different services schedule in a week is 4 = 4 Truckloads x 8 tons = 32 tons = Weekly Waste Amounts Therefore Daily Waste: = 32 tons 7 days = 4.57 tons daily generation. of the Targeted Area Let assume that the population of the targeted area is 30,000 = 4,570 kg daily generation 30,000 people in the area = 0.15 kg per person per day
1. Density (kg per m3) and Waste Composition
The Density Calculation and waste composition can be determined by taking a sample from the disposed waste loads. The loads of waste collected from the targeted area are mixed up thoroughly using a loader or excavator before taking a sample for assessment, e.g. 100kg -500kg. The collected waste during the different collection services are assessed differently when the waste is disposed of at the landfill. Calculation of Waste Composition is conducted using the same sample used for the waste density estimation.
Calculation of the Waste Density = Known amount (kg) of the sample taken from the mixed truckload for assessment. E.g. 300 kg. = 300 No. of Full Containers x Container Size (L) Assuming that there were 30 full containers from the 300kg sample = 300kg 15 full containers x 60 L (example of container size) = 300kg 900L = 0.333 kg per L = 333 kg per m3
Calculation of the Waste Composition (percentage) = Weights of different types of waste from the
assessed 100kg sample of the mixed waste truckload. = Each Waste Type (kg) x 100% 100kg of the total sample
2.1.3 Time and Motion Study5
This survey methodology assesses the efficiency of collection services by assessing the time
taken to implement key operations, e.g. loading waste on the truck, unloading at the disposal
5 Base Information produced by Vivianne Morofa of National Capital District Commission, Port Moresby, Papua New Guinea

12 | P a g e
site, traveling from the last pickup point to the disposal site, etc. Thus the time factor is the main
unit used in this assessment. In addition, observations are made on the following, which are
important when making final decisions on improvements.
Trucks (type, size, conditions, etc.)
Waste receptacles used (bins, rubbish bags, shelves, drums, etc.)
Collection coverage
Collection crew behavior
Collection costs
Estimates of the collected waste
The following Table 4 summarises the main aspects of a Time and Motion Study. The main
purpose is to extract the highlighted information for identifying issues that affect collection
services and determine measures to improve the situation.
Table 4: Key Information of a TMS
Targeted Data and Information Reasons Objectives
Average time to:
- Collect an area
- Load waste from pickup points
- Dispose of waste at a disposal facility
- Stop for a break (smoke, coffee, toilet,
etc.).
- Other non-service purposes.
Investigating the Time Taken for implementing a collection service in an
area.
Areas where time taken for the
service can be improved.
Reducing the break time;
collecting downhill rather than
uphill; standardisation of rubbish
receptacles; collection during
low traffic time, etc.
Types of Waste Storage at Pickup
Points.
- Wheelie bin
- Trash bag
- Open drum
- Shelf or platform
Investigating the status of waste
storage at pickup points.
Issues that affect the time of
the service. Waste scattered on
the ground takes time to collect;
high platforms; open rubbish
bins with rain water in it; people
just bringing their waste when
the truck comes, etc.
Collaboration of the Crew.
- Driver and collection workers
collaborate and communicate well in
carrying out their tasks.
- Collection crew do their job well.
Investigating the Collection Crew
Performance and Behaviour.
Concerns and issues with the
Collection Crew. Does the crew
perform any other task not
relating to the service. Does the
crew play while performing their
job, etc.
If the trucks are operating well during
the collection service and easy for the
collection crew to work with. The
truck is not presenting problems to the
crew. E.g. Loading section is high, truck
cannot access many roads, truck
ejection mechanism is not working
properly and crew has to manually
discharge the waste at the disposal site,
etc.
Investigating the Collection Trucks.
Suitability and Performance during the
collection service.
Areas for improvement of the
collection truck. E.g. Having a
truck with a rear mechanical
loading end for easier loading, A
smaller truck can access smaller
roads than a big truck. Regular
servicing of the truck to ensure
good working condition.

13 | P a g e
Targeted Data and Information Reasons Objectives
Households in the area are covered.
Number of stops and pickup points
recorded must be close to the number of
households in the collection area.
Investigating the actual coverage of the service.
Reasons for some households
not being covered: E.g.
Remote from the main road.
Many households sharing one
pickup point, etc.
Collected Waste Estimates.
The number of trucks loads collected
from sources and disposed of at the
designated disposal sites.
Investigating the actual amounts of the collected waste from households or businesses. The difference between the amounts generated at source (studied under the Waste Audit) and collected amount (studied under TMS) is the estimated uncollected amount of waste.
Estimates of both collected
and uncollected wastes from
known sources covered under a
collection service programme.
Can use to monitor the
success of a service including
some waste minimisation
initiatives.
Provides some ideas on other
unknown factors, which may
lead to unaccounted amounts
of waste – E.g. burning, etc.,
(which can be identified from a
Public Opinion Survey).
The Procedures for implementing a Time and Motion Study are discussed in the Annex Section
based on the experiences of a similar study conducted in Port Moresby, Papua New Guinea (see
Annex Section).
2.1.4 Public Opinion Survey6
This method of survey assesses the responses of people to a particular issue e.g. opinion on a
proposed new waste initiative – CDL, prepaid bags and proposed increase to the monthly
property rates, etc. Depending on the areas being investigated, a properly designed survey can
collect information to complement the outcome of other waste surveys. The feedback is vital in
guiding the management of a facility or service to ensure the users are satisfied. It is important for
members of the public to be properly consulted before a new initiative is introduced.
6 Base Information produced by Rouhit Singh of Lautoka City Council, Fiji
A Public Opinion Survey (POS) can be very short or long depending on the information
needed and the intended use of the information. It can consist of a number of open-ended
and closed-ended questions. Open-ended questions require the respondent to freely
provide their own answers, while closed-ended questions have provided answers for
the respondents to select. A POS can be implemented in different ways – personal face
to face, through telephone or mobile phone calls, street intercept, online or a combination
of the above. The way a POS is designed and implemented depends on the nature of the
service and targeted respondents, available supporting resources to implement the POS
and the level of accuracy needed.

14 | P a g e
a) How to Design and Plan a POS for Waste Management Planning Purposes.
A POS must be designed according to the purpose of the information needed. If assessing the
opinions of users of a particular waste management service or facility, then a Simple POS format
can be used. If assessing public opinion on a proposed service improvement, service fee, plan or
design, then the POS format can be mixed, complicated and take more time to fill.
Steps To Follow When Planning for POS for Waste Management
1. Select samples from a targeted area in a statistically reliable manner so that the opinions
of the targeted respondents are clearly reflected.
If the purpose is to assess the status of a delivered waste service or facility, then
households from a serviced community area must be randomly selected.
A questionnaire to guide the collection of information must be properly designed,
reviewed, trialed and modified before using.
2. Decide the information required. Structured closed-ended questions provide answers for
the respondents to select for easier analysis.
3. Define the target respondents, e.g. specific people or the general public, etc.
4. Choose the method(s) of reaching your target respondents - telephone, internet, mail,
face to face, etc.
5. Decide on question content (open-ended, closed-ended or a combination).
6. Develop the question wording (Must be simple and based on the level of the targeted
respondents).
7. Put questions into a meaningful and logical order and format.
8. Check the length of the questionnaire so that the respondents do not lose interest easily.
9. Pre-test the questionnaire to test the timing to fill it and give it to a number of people to
check if they can understand the questions asked.
10. Develop the final survey form.
b) Methodologies of POS Delivery:
Visit and meet face to face the targeted respondents.
Telephone or mobile phone by calling selected respondents.
Online by inviting respondents to fill in a survey questionnaire.
Street intercept by asking respondents met on the street.
Combination of the above.
The selection of methodology depends on the level of technical and accuracy of information
needed. For monitoring and evaluation of collection service services, a simple and short format is
recommended as shown in Box 1.

15 | P a g e
This simple POS is important to assess the status of collection services. In most of the Pacific
Islands, this is hardly implemented and thus has resulted in few improvements. This is particularly
important when there is a lack of monitoring to regularly check the progress of these services. If
possible, a POS can be conducted before the re-tendering of bids for contracts to be
implemented by private contractors. If the service is delivered by a government agency, then this
POS can provide some information to guide the organisation in making improvements.
A POS can also be designed to collect additional information during a Waste Generation and
Composition Survey. Such a POS, if properly designed, can gather useful background
information on the nature of the generated waste from households, such as the number of people
in a household, daily diet, income level, etc. It can also be used to gather some related
information on the waste collection and disposal services in an area (refer Annex 3, for a similar
POS used during a Waste Generation and Composition in Tuvalu, 2017).
2.2 SOLID WASTE MANAGEMENT PLANNING
This section looks at how the information gathered from different surveys as outlined in Section 2.1
is used in the planning of waste management. It also discusses the process involved in the
preparation and development of a waste management plan, policy and strategy.
Solid waste management planning (SWM) is a holistic, multidisciplinary, comprehensive,
participatory and integrated approach undertaken by waste management authorities to develop a
SWM Plan. This becomes a roadmap towards an ‘integrated SWM system’ addressing waste
collection, transportation, storage, 3Rs, landfill management, legislation, institutional capabilities,
resource needs, funding, etc., within a certain location and area
This section focuses on the key stages involved in the solid waste management planning process
based on the experiences in the Pacific region. The process may differ from place to place, but the
key planning aspects are the same.
BOX 1: EXAMPLE OF A SHORT SIMPLE POS
To improve our waste collection services, we appreciate very much your time to fill in this survey.
1. What do you think of our following services Please Tick your choice
a). Rubbish Truck Condition Poor ….. Average…...Good…..
b). Collection Timing Poor ….. Average…...Good…..
d). Collection Crew Behaviour Poor …..Average ……Good…..
e). Not applicable – no service in my area (Go to 5)
2. How many times a week your rubbish is collected ………….
3. Is there any collection for bulky waste in your area ……If Yes how many times a year…………
4. If the collection service in (1) is not satisfactory, we appreciate your suggestions on how to improve
it:
a). Rubbish Truck condition.……………..………………..….……………………………………...
b). Collection Frequency………………………………………………………………………............
c). Collection Timing…………………………………………………………………………………..
d). Collection Crew Performance…………………………………………………………..…………
5. How do you dispose of your waste …………………………………………………………………...
THANK YOU FOR YOUR TIME, CITY COUNCIL

16 | P a g e
Figure 3: General Solid Waste Management Planning Process
This process is the basis of any waste management planning and must be followed to develop a
plan based on facts and not on assumptions. Many countries in the region with poor waste
management systems do not have proper plans of short and long term strategic measures to
make improvements. These improvements can only come when issues are properly studied and
identified through surveys and assessments.
2.2.1 Uses of Extracted Basic Waste Data and Information for
Planning Purposes7
Extracted baseline information and findings set the basis of proposed strategic measures and
actions. These improve from the current situation to a set benchmark or continue with some
existing practices. This provides the main part of a Waste Management Plan / Strategy / Policy as
the next step of the solid waste management planning process.
Planning and designing of waste management facilities like wheelie plastic bins, special rubbish
bags and rubbish trucks are common tasks of waste managers. In order to accurately plan
these facilities before the implementation of a collection service or construction of a new waste
disposal facility, the waste generation rates, waste densities and waste composition must be
known. These three waste generation parameters provide the main basis of planning and
designing waste management facilities. Waste generation and composition studies should be
carried out before planning and designing your waste management facilities. Examples on how
to calculate and determine sizes and types of facilities are discussed in Annex VII.
7 Sagapolutele Faafetai, Assistant Chief Advisor, J-PRISM II
Waste Survey / Assessment / Research As discussed in the above sections
Analysis of Gathered Information
Recommendations of Measures and
Actions to take
BECOMES THE STRATEGIC MEASURES TO
IMPROVE FROM THE CURRENT SITUATION
Key Findings on Baseline Information
BECOMES THE CURRENT STATUS OF
THE PLAN, WHERE GOALS AND
OBJECTIVES OF THE PLAN ARE BASED
17 | P a g e
2.2.2 Development of Solid Waste Management Plan8
The development of any SWM Plan must be based on the baseline information gathered from
waste surveys on the status of the generated solid waste, existing collection and disposal
services, etc. SWM planning is a holistic, multidisciplinary, comprehensive, participatory and
integrated approach undertaken by waste management authorities to develop a SWM Plan. This
becomes a roadmap towards an ‘integrated SWM system’ addressing waste collection,
transportation, storage, 3Rs, disposal/landfill management, legislation, institutional capabilities,
resource needs, funding, etc. within a certain location.
Most SWM plans recommend waste diversion (reduction and recycling) goals. It also links to
strategies for the proper management of the solid waste stream. Stakeholder consultation is
indispensable in the formulation of the SWM plans. These plans are bound by targets and
timelines, and are usually aligned with ‘Regional and National SWM Strategies’.
A SWM Plan is a document resulting from a series of consultations, baseline surveys, trials and
reviews involving experts, communities, recycling companies, businesses, government entities,
waste contractors, donors and other stakeholders. The scope, coverage, application and
magnitude of a SWM Plan largely depend on the availability of 6M’s (Money, Manpower,
Motivation, Management commitment, Machinery and Materials) within a waste management
authority or target locality.
a) General objectives of SWM planning:
To explore current issues for the management of solid wastes in the geographical scope
identified through engagement with stakeholders.
To develop strategies that will assist governments in addressing waste issues based on
the strengths, weaknesses, opportunities and threats (SWOT Analysis) of the current
systems with due consideration of environmental, social, political, economic and technical
factors.
To recommend Specific, Measurable, Achievable, Realistic and Time bound
(“SMART”) actions for an integrated solid waste management system addressing all
components.
To ensure more streamlined interventions or SWM, avoiding duplication of effort, and for
the proper allocation of limited resources including funding proposals.
To ensure success and sustainability in managing solid wastes.
b) Element of a Solid Waste Management Planning
Planning Framework and Existing SWM Conditions
Preliminary information on the current waste profile of the target area is required prior to
the development of the SWM plan. This can be generated in several ways - desktop
research, site assessment and consultations. The preliminary information is necessary to
assess existing waste-related conditions and current systems. This will identify issues
affecting the management of waste in the area and pinpoint the preferred state of SWM.
The following should be addressed prior to the formulation of the plan:
- Who should develop the SWM Plan - Type of wastes to be considered
8 Singh Shalend, Senior Health Inspector, Lautoka City Council, Fiji

18 | P a g e
- Stakeholders involved – including waste generators - Profile of target area, i.e. demography, socio-economic condition, vulnerabilities, etc.
- Existing policies on SWM
Formulation of the Plan
The following outline of the SWM Plan is suggested (based on the experience in Lautoka
Town Council).
1) Background: This section describes the objective of the plan and profile of the target
area.
2) Vision and Mission Statements: The vision statement defines the optimal future state or
what the target area wants to achieve over time. It is intended to provide guidance and
inspiration on what should be achieved over a time period. The statement has to be concise
and inspirational for stakeholders or key implementing players to easily remember at a given
time. The mission statement establishes the purpose of the organisation responsible for
facilitating the achievement of the vision.
3) Scope and Key Targets: This section defines what the plan covers and the quantitative
and qualitative targets to achieve the vision (can be long-term or short-term), e.g. increase
in collection rate, increase in recycling rate, decrease in final disposal or increase in waste
diversion, etc.
4) Strategic Goals and Actions: The longer-term goals will ensure that the established
vision is achieved. The strategic actions provide options to the governing authority to
improve SWM in the area. Appropriate strategies are established as overarching measures
to improve delivery of waste services. The strategic goals and actions are based on
financial, technical, environmental, political and social considerations.
Examples of strategic goals are:
-SWM interventions follow best practice approaches,
-Institutional capability to implement SWM activities is strengthened.
Examples of strategic actions are:
-The local authority shall implement 3R + return programmes to divert more wastes away
from the landfill,
-The local authority shall create, amend and endorse laws, regulations and policies to
ensure orderly delivery of waste services.
5) Implementation Plan
This section lists down more specific activities linked to the strategic goals and actions.
The Implementation Plan defines the work programme of specific interventions designed to
guide implementing agencies on what to do to achieve the set strategic goal. The plan
should cover all aspects of SWM from discharge, collection, transport, treatment, and
disposal. The plan should include assignment of responsibilities, timings, estimated budget
and key performance indicators. It is also recommended to prioritise the activities to
address ant resource limitations.
19 | P a g e
Gathering baseline survey to further assess the current waste situation using the
following approaches:
- Waste generation and composition survey - Waste composition and waste
generation data: generation amount and rate per day.
- Final disposal amount survey, public opinion survey, community survey, compost
market and demand survey, recycling activity survey, time and motion survey etc.
Some of the important information which can be gathered from detailed surveys
include:
- Specific gravity and moisture content of waste.
- Amount of waste discharged and collected.
- Resources available for delivery of waste services, e.g. trucks, equipment, facility.
- Collection efficiency, unit cost, coverage, quality of service through time and
motion study.
- Recycling initiatives including recyclable items, market, recycling rate, etc.
- Landfill condition, i.e. current state, estimated lifespan, final disposal amount,
operation level, status of waste pickers, tipping fee, equipment, staff, monitoring
mechanism, etc.
- Waste material flow.
- Management and institutional arrangements for SWM, i.e. existing legislations and
policies, budget allocation, organisational structure, public-private partnerships,
existing contracts, etc.
Key Areas for Implementation - Identify issues affecting the waste sector through site assessments and
stakeholder consultations (focused group meetings and workshops). Issues can
range from general observations such as rubbish on the street to inadequate
disposal space and challenges faced by the implementing agencies such as lack
of awareness, insufficient resources, etc.
- Conduct SWOT analysis of current SWM issues to identify which issues need to
be addressed and prioritised.
- Define vision and mission statements that will guide the implementing agencies in
the delivery of waste services.
- Establish strategic goals and actions to support interventions.
- Identify specific activities to address the issues.
- Complete the implementation plan through assignment of responsibilities,
timelines and funding estimates. Key performance indicators should be developed
to evaluate outcomes.
- Validate the vision, mission, strategic goals and actions and implementation plan
through various levels of stakeholder consultations.
- Endorse the SWM Plan for adoption to ensure political and institutional support for
its implementation.
- Report the outcomes of the plan annually to ensure targets are followed.

20 | P a g e
CHAPTER 3 STRATEGIC MEASURES TO IMPROVE SOLID
WASTE MANAGEMENT IN PACIFIC ISLAND
COUNTRIES
Contributors
Community Based Collection by Feauini Veikoso Laumanu
Key Landfill Management Aspects by Amos Mathias
Waste Disposal Sites Partially / Cheap Improvement by Charles Lohn
Waste Landfill Planning and Design by James Ricky
Environmental Protection and Monitoring by Manase Pongi
Harmonisation with Waste Pickers by Joshua Sam
Weighbridge Operation and Data Management by Shalend Singh
Contract Management by Joshua Sam
Plant and Equipment by Amos Mathias
Occupational Safety and Health by Rouhit Singh
Clean School Programme by Nafiza Ali
Public and Community Awareness by Feauini Veikoso Laumanu

21 | P a g e
3.0 STRATEGIC MEASURES TO IMPROVE SOLID
WASTE MANAGEMENT _________________________________________________________________________________
3. 1 COLLECTION AND TRANSPORT OF WASTE The collection and transportation of waste is the most expensive part of solid waste management in
Pacific island countries. Many remote islands and communities have no access to this service
because of their isolation from the main islands and urban areas. In the absence of this service, the
application of initiatives in other countries may be helpful, as discussed below.
3.1.1 Extending Public Collection to Rural Areas and Remote
Islands9
Most of the municipal solid waste collection services in Pacific island countries are supported by
governments, but only cover the urban areas. Due to the high costs involved, decisions need to be
made if the service is extended to rural areas and remote islands.
In Samoa, government policy changed to collect only from the households under its collection
services – this gave the government the resources to extend its collection to rural areas, including
three outer islands, from 2005. As a result of the policy change, the government funding previously
used to collect waste from businesses, institutions and organisations, has been diverted to cover
households in rural areas, including the outer islands.
Basis and Justification of the Government Policy Change:
Businesses, government organisations and institutions can financially support themselves. Most businesses and government organisations have their own office vehicles, which can be used to collect and transport their waste at the designated disposal site.
Businesses and government organisations generate more waste from their daily operations and therefore should not be collected free of charge under the government’s free collection services.
Most households in the outer islands and remote areas do not have vehicles and therefore should be the focus of any government-funded free collection service.
Overall, everyone is covered under the service at the household level regardless of where people work.
It is the commercial activities, which generate most of the waste that are charged when the waste is disposed of at the central disposal site, through a tipping fee.
Most of the Municipal Solid Waste comes from households and therefore must be the main focus of any free government collection service.
3.1.2 Community Driven Collection Service10
Based on the experience from a number of communities in Vava’u, Tonga, collection services can
be introduced in remote areas through community driven initiatives where there is no plan for a
government service.
9 Sagapolutele Faafetai, Assistant Chief Advisor, J-PRISM II
10 Laumanu Feauini Veikoso, Officer, MEIDECC, Tonga
22 | P a g e
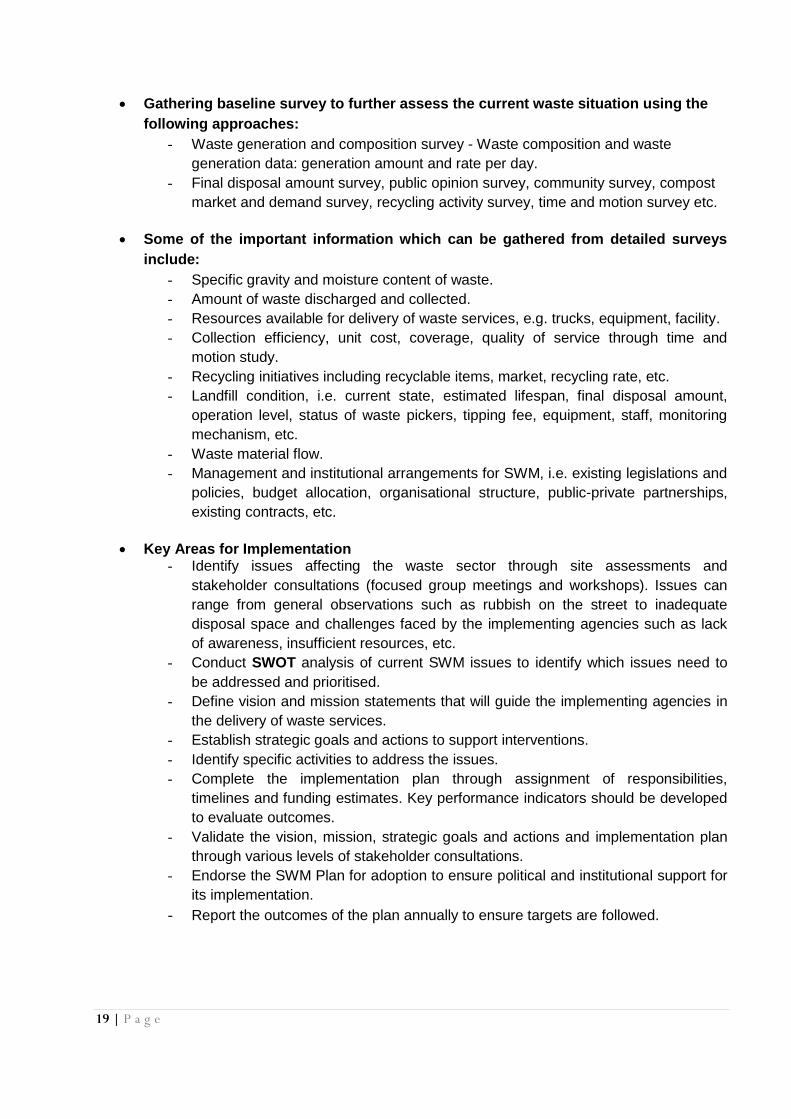
Introduction of the Community Based Collection Service
The idea of community-based collection services has been promoted lately in isolated islands and
communities by a number of development partners, with the purpose of introducing appropriate
waste management practices in the absence of any government-funded service. This concept has
been practiced by some communities in Vava’u, Tonga and the lessons learnt are useful for other
Pacific island countries.
Community meeting to discuss and plan their collection system
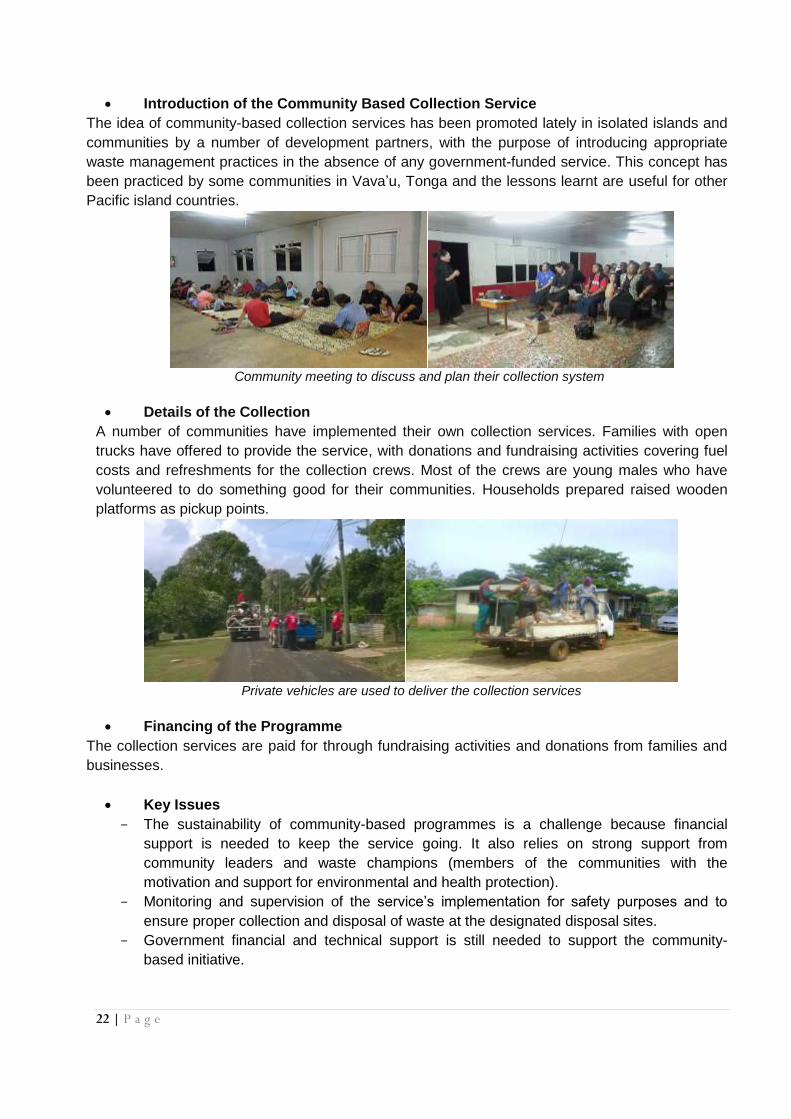
Details of the Collection
A number of communities have implemented their own collection services. Families with open
trucks have offered to provide the service, with donations and fundraising activities covering fuel
costs and refreshments for the collection crews. Most of the crews are young males who have
volunteered to do something good for their communities. Households prepared raised wooden
platforms as pickup points.
Private vehicles are used to deliver the collection services
Financing of the Programme
The collection services are paid for through fundraising activities and donations from families and
businesses.
Key Issues
- The sustainability of community-based programmes is a challenge because financial
support is needed to keep the service going. It also relies on strong support from
community leaders and waste champions (members of the communities with the
motivation and support for environmental and health protection).
- Monitoring and supervision of the service’s implementation for safety purposes and to
ensure proper collection and disposal of waste at the designated disposal sites.
- Government financial and technical support is still needed to support the community-
based initiative.
23 | P a g e
Lessons Learnt:
- It takes time to change the attitudes of people to accept waste management as part of
their daily responsibility for keeping them healthy and safe from the negative impacts of
waste.
- Any collection service that wholly relies on private vehicles and donations from the
communities is not sustainable. If owners of the vehicles withdraw their support, then the
service can stop at any time. This is a concern when vehicles are overused with a lack of
financial support to the owners for the maintenance of their vehicles.
- The government can use the opportunity to introduce a charged collection service to the
communities. These communities may find it easier to accept a monthly waste collection
fee because of the experience with their own initiatives.
3.2 WASTE LANDFILL MANAGEMENT &
IMPROVEMENTS
Improving the management and physical upgrading of existing waste disposal sites are key
measures needed for the improvement of waste management in Pacific island countries. This
section discusses the main strategic measures for waste disposal sites.
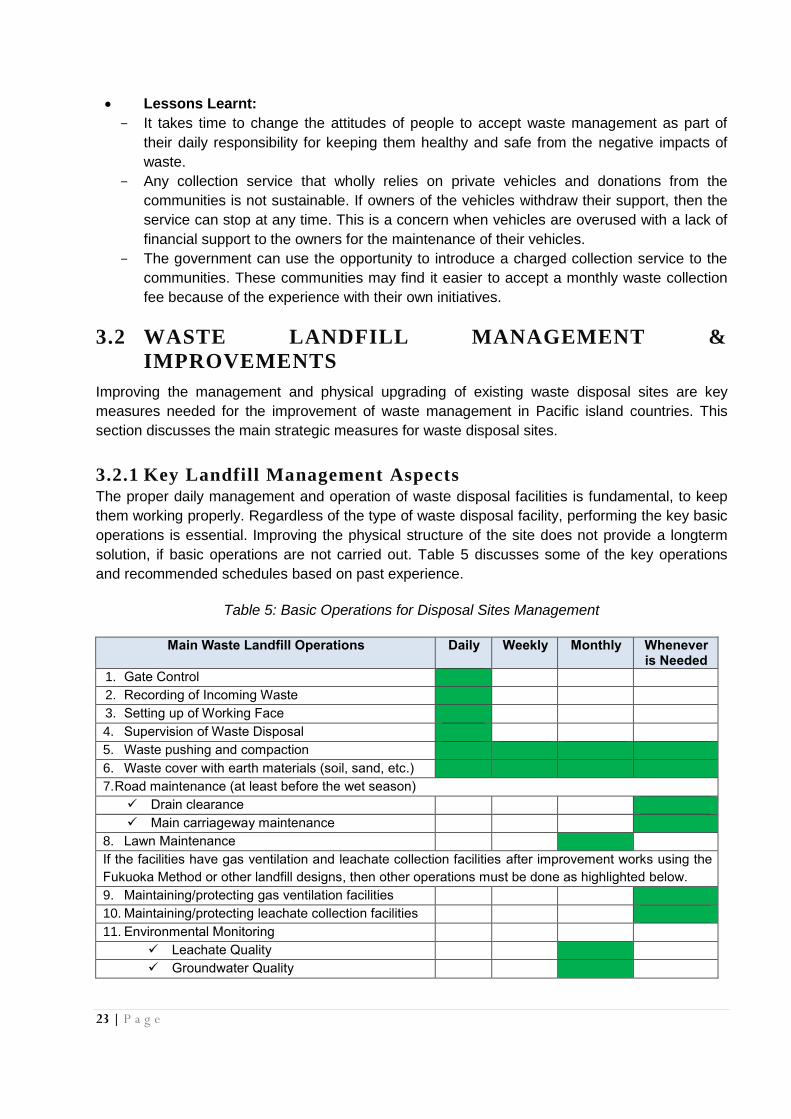
3.2.1 Key Landfill Management Aspects The proper daily management and operation of waste disposal facilities is fundamental, to keep
them working properly. Regardless of the type of waste disposal facility, performing the key basic
operations is essential. Improving the physical structure of the site does not provide a longterm
solution, if basic operations are not carried out. Table 5 discusses some of the key operations
and recommended schedules based on past experience.
Table 5: Basic Operations for Disposal Sites Management
Main Waste Landfill Operations Daily Weekly Monthly Whenever is Needed
1. Gate Control
2. Recording of Incoming Waste
3. Setting up of Working Face
4. Supervision of Waste Disposal
5. Waste pushing and compaction
6. Waste cover with earth materials (soil, sand, etc.)
7. Road maintenance (at least before the wet season)
Drain clearance
Main carriageway maintenance
8. Lawn Maintenance
If the facilities have gas ventilation and leachate collection facilities after improvement works using the
Fukuoka Method or other landfill designs, then other operations must be done as highlighted below.
9. Maintaining/protecting gas ventilation facilities
10. Maintaining/protecting leachate collection facilities
11. Environmental Monitoring
Leachate Quality
Groundwater Quality
24 | P a g e
Operations from Rows 1 to 8 and 11 are essential for all disposal sites, regardless of type and
size. Rows 9 and 10 are additional operations for rehabilitated sites with gas ventilation and
leachate collection facilities.
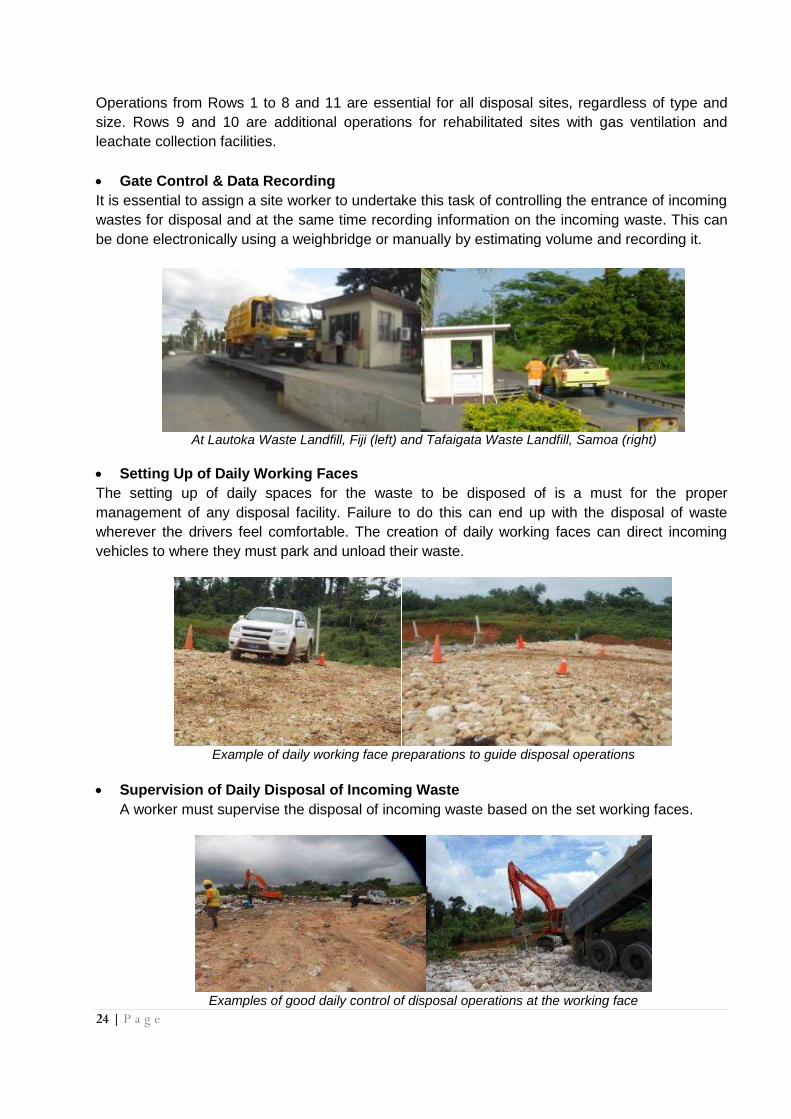
Gate Control & Data Recording
It is essential to assign a site worker to undertake this task of controlling the entrance of incoming
wastes for disposal and at the same time recording information on the incoming waste. This can
be done electronically using a weighbridge or manually by estimating volume and recording it.
At Lautoka Waste Landfill, Fiji (left) and Tafaigata Waste Landfill, Samoa (right)
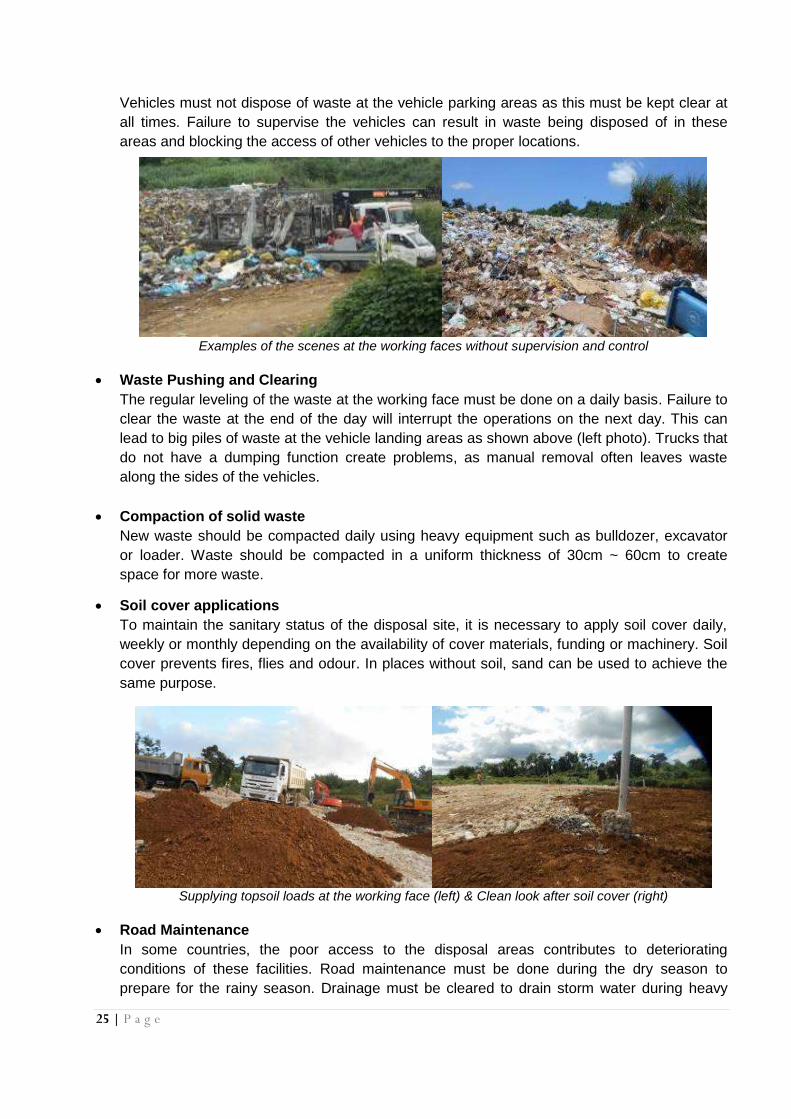
Setting Up of Daily Working Faces
The setting up of daily spaces for the waste to be disposed of is a must for the proper
management of any disposal facility. Failure to do this can end up with the disposal of waste
wherever the drivers feel comfortable. The creation of daily working faces can direct incoming
vehicles to where they must park and unload their waste.
Example of daily working face preparations to guide disposal operations
Supervision of Daily Disposal of Incoming Waste
A worker must supervise the disposal of incoming waste based on the set working faces.
Examples of good daily control of disposal operations at the working face
25 | P a g e
Vehicles must not dispose of waste at the vehicle parking areas as this must be kept clear at
all times. Failure to supervise the vehicles can result in waste being disposed of in these
areas and blocking the access of other vehicles to the proper locations.
Examples of the scenes at the working faces without supervision and control
Waste Pushing and Clearing
The regular leveling of the waste at the working face must be done on a daily basis. Failure to
clear the waste at the end of the day will interrupt the operations on the next day. This can
lead to big piles of waste at the vehicle landing areas as shown above (left photo). Trucks that
do not have a dumping function create problems, as manual removal often leaves waste
along the sides of the vehicles.
Compaction of solid waste
New waste should be compacted daily using heavy equipment such as bulldozer, excavator
or loader. Waste should be compacted in a uniform thickness of 30cm ~ 60cm to create
space for more waste.
Soil cover applications
To maintain the sanitary status of the disposal site, it is necessary to apply soil cover daily,
weekly or monthly depending on the availability of cover materials, funding or machinery. Soil
cover prevents fires, flies and odour. In places without soil, sand can be used to achieve the
same purpose.
Supplying topsoil loads at the working face (left) & Clean look after soil cover (right)
Road Maintenance
In some countries, the poor access to the disposal areas contributes to deteriorating
conditions of these facilities. Road maintenance must be done during the dry season to
prepare for the rainy season. Drainage must be cleared to drain storm water during heavy

26 | P a g e
rain. The access road to the disposal area (main tipping face) from the main entrance gate
should be maintained regularly to allow proper discharge of waste.
At the Labasa Dumpsite before (left) & road conditions after improvement works (right)
3.2.2 Waste Disposal Site Cheap Improvement Works
Improvement of disposal sites is expensive and relies on funds being available. A large-scale
rehabilitation project may only be possible with donor funding. It is important to make good use of
resources to improve waste disposal sites. This section shows some examples of small and
cheaper improvement works conducted in a number of Pacific island countries.
Kalaka Disposal Site Rehabilitation – Vavau, Tonga
After improvement works
PVC Leachate Collection Pipes & Leachate Collection Pond at Kalaka Waste Landfill
Before - Open dump with fire, bad odour and flies
3m embankment along the perimeter to contain the waste, preventing waste flowing to the sea
Installed leachate collection and treatment facilities to protect the nearby sea and mangrove ecosystems from pollution

27 | P a g e
Pohnpei Disposal Site Rehabilitation – Federal States of Micronesia
Improvement at the Pohnpei, FSM Disposal Site using PVC pipes and empty drums
Similar work has been done in Fiji (Sigatoka and Labasa), Solomon Islands (Gizo and Honiara),
FSM (Chuuk) and others. More examples of simple and cheaper improvement works are
discussed later in the Leachate Treatment section. The key lessons are:
Use of cheap construction materials in the country to reduce the cost, e.g. PVC pipes for leachate collection are cheaper than concrete and HDPE pipes.
Use of clay soil as lining materials, if available, is cheaper than the concrete and geomembrane materials.
Reuse where possible the decomposed waste as construction material, rather than buying material.
Use local resources such as coconut husks, volcanic stones, coral, sand, etc. as treatment materials.
Use the available surrounding environment if possible to suppport the natural backup treatment for the leachate, e.g. mangrove stands, swamps, etc.
Use the existing land slope to avoid the use of electricity for the leachate treatment process.
Advantages of Using Available Cheap Materials
Easier to find for ongoing replacement and maintenance compared to imported materials. - Coconut husks, corals, sand, etc. - PVC pipes, etc.
Cheaper and affordable. Can be easily fixed and replaced when damaged. Concrete and expensive materials are
harder to replace when damaged. If funds are available especially through donors and special projects, better construction materials
can be purchased particularly for the following facilities:
Perforated leachate collection pipes (concrete or HDPE, etc.). Lining materials for the waste cells and leachate collection pond base (geomembrane
material, concrete and high clay soil contents, etc.).
Leachate treatment (concrete or HDPE lined ponds; use of electric pumps, etc.).
3.2.3 Planning & Designing of Major Improvement Rehabilitation
Works Major improvement works are possible when funding is available, accompanied by proper
assessments, planning and designing. When planning full rehabilitation work, there are important
aspects to be considered, with the Baruni rehabilitation project in Port Moresby, Papua New
Guinea used as an example.
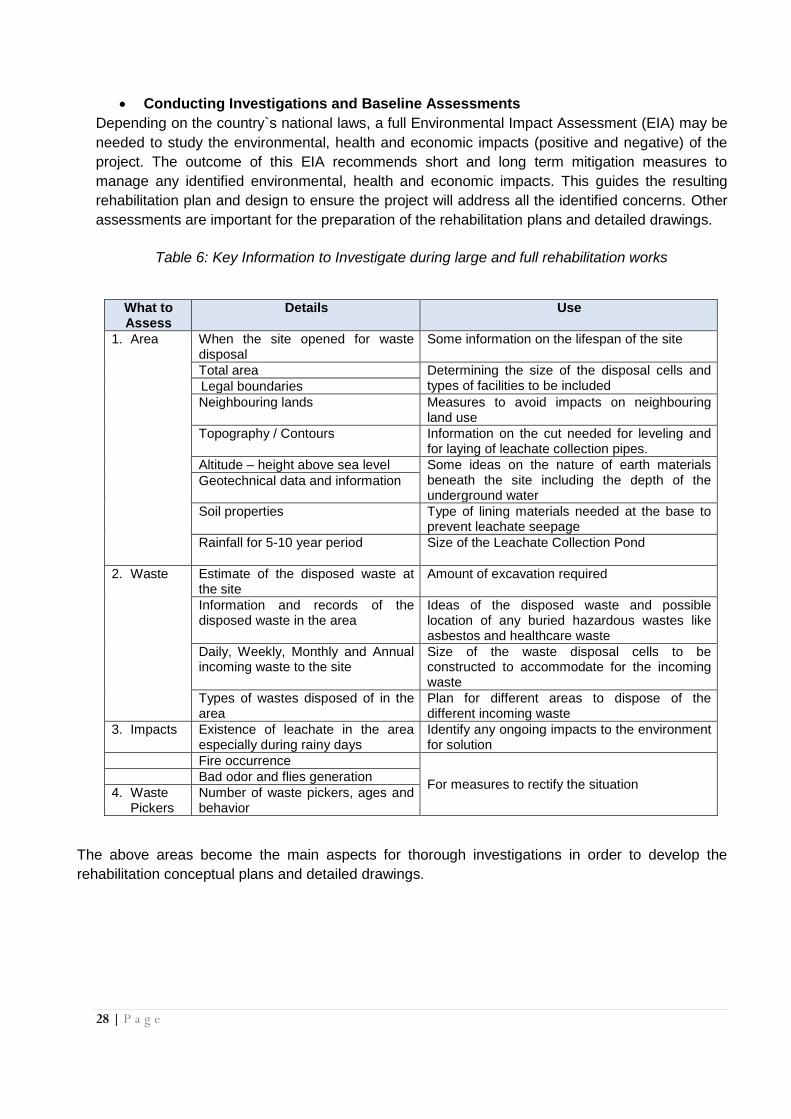
28 | P a g e
Conducting Investigations and Baseline Assessments
Depending on the country`s national laws, a full Environmental Impact Assessment (EIA) may be
needed to study the environmental, health and economic impacts (positive and negative) of the
project. The outcome of this EIA recommends short and long term mitigation measures to
manage any identified environmental, health and economic impacts. This guides the resulting
rehabilitation plan and design to ensure the project will address all the identified concerns. Other
assessments are important for the preparation of the rehabilitation plans and detailed drawings.
Table 6: Key Information to Investigate during large and full rehabilitation works
The above areas become the main aspects for thorough investigations in order to develop the
rehabilitation conceptual plans and detailed drawings.
What to Assess
Details Use
1. Area l
When the site opened for waste disposal
Some information on the lifespan of the site
Total area Determining the size of the disposal cells and types of facilities to be included Legal boundaries
Neighbouring lands Measures to avoid impacts on neighbouring land use
Topography / Contours Information on the cut needed for leveling and for laying of leachate collection pipes.
Altitude – height above sea level Some ideas on the nature of earth materials beneath the site including the depth of the underground water
Geotechnical data and information
Soil properties Type of lining materials needed at the base to prevent leachate seepage
Rainfall for 5-10 year period Size of the Leachate Collection Pond
2. Waste Estimate of the disposed waste at the site
Amount of excavation required
Information and records of the disposed waste in the area
Ideas of the disposed waste and possible location of any buried hazardous wastes like asbestos and healthcare waste
Daily, Weekly, Monthly and Annual incoming waste to the site
Size of the waste disposal cells to be constructed to accommodate for the incoming waste
Types of wastes disposed of in the area
Plan for different areas to dispose of the different incoming waste
3. Impacts Existence of leachate in the area especially during rainy days
Identify any ongoing impacts to the environment for solution
Fire occurrence
For measures to rectify the situation Bad odor and flies generation
4. Waste Pickers
Number of waste pickers, ages and behavior

29 | P a g e
Baruni dumpsite before rehabilitation
After investigating the site and different aspects as highlighted in Table 6, decisions are made on
the measures to take. This determines the final rehabilitation plan of the site to ensure the
improvement works fully address all the key problems.
Identifying the Key Strategic Measures for Improvement
The outcome of a full EIA and other studies provide the basis for the development of the Project
Conceptual Plans, before the final drawings are produced. For the Baruni project, some changes
were made before the final project plans and drawings. Table 7 provides an idea of the reasons
for some proposed facilities to be included in the project.
Table 7: Key Measures for Determining the Final Rehabilitation Plan
Example of Key
Issues/Problems
Proposed Measure to solve
the problem
Expected Effect
1. Lack of control of the incoming waste including vehicles and people
Construct a main gate and office with security attendants
Regulating the flow of incoming vehicles
2. Fire Regular Soil Cover
Reduce fire when waste is covered with soil
3. Bad odour and flies Reduce bad odour and flies when waste is covered with soil
4. Waste disposal went beyond the legal boundaries
Construct a surrounding embankment to clearly identify the waste disposal area and avoid waste going beyond the boundaries.
Containment of waste within the waste disposal site
5. Uncontrolled waste picking operations affecting waste disposal operations
Regulation measures to guide waste picking operations.
Cooperation from the waste pickers, improving the waste landfill daily operations
6. Inaccessible road during rainy days
Construct an all-weather road Accessible roads all year
7. Poor waste disposal practices within the site
Hire a full time contractor to conduct daily maintenance
Improved daily maintenance operations
8. Leachate generated and settled within the site
Install leachate collection and treatment facilities
Control of the leachate avoiding impacts to the environment

30 | P a g e
Development of a Conceptual Plan and Detailed Drawings
Following a number of assessments to gather baseline information and data, the following types
of plans are developed identifying key measures to address the present disposal site problems.
Figure 4: Detailed Baruni Plan for Construction
Based on the Conceptual Plan of the Proposed Rehabilitation Works, detailed drawings are then
prepared on the entrance gate office, main access road, waste disposal cells, leachate collection
and treatment facilities. Figure 5 shows a detailed drawing of a waste landfill cross section with
install leachate collection and air ventilation facilities.
Figure 5: Cross Section of the Laid Leachate Pipe
In recent years, a number of dumpsites in the Pacific islands have been transformed from open
dumpsites to waste landfills using the Fukuoka Method or the semi-aerobic system. The Baruni
rehabilitation works used the Fukuoka method and the collection of leachate and input of oxygen
into the same collection pipes makes this approach unique. The process promotes aerobic
conditions within the disposed wastes and thus reduces methane generation, a toxic gas to the
ozone layer. The generation of leachate, a dark liquid (brown arrow) and carbon dioxide (yellow
arrow), results from the presence of microbes (red coloured zone) reacting with oxygen (flows in
from the lower end of the leachate pipe). The flow of air occurs as a result of temperature
differences, which creates a vacuum that draws oxygen in to the pipe. The microbial activity with
organic waste in the vicinity of the pipes generates a high temperature, which causes the heated

31 | P a g e
gas to flow out through the venting pipe. This process creates a consistent flow of air into the
waste layer through the perforated pipes and the air spaces between the rocks. Therefore, the
leachate flows into the leachate pond through the pipes while the gas (carbon dioxide) escapes
through the venting pipe. The change in colour shows the process involved in breaking down
organic waste by microbes in the presence of oxygen, producing carbon dioxide and water. This
is the basis of the Fukuoka Method or semi-aerobic system.
Completed Waste Landfill at Baruni, PNG (left) & Labasa, Fiji (right)
The other components of the Fukuoka Waste Landfill System are explained in the next section.
These systems ensure a complete performance in line with its aerobic engineering structure.
3.2.3 Environmental Protection & Monitoring
When waste landfills are improved, they should be designed to protect the environment and allow
for regular monitoring to check the effectiveness of the systems. Regular environmental
monitoring is an important part of waste landfill management, especially for new and rehabilitated
landfills. The following are key features of environmental protection for waste landfills including
operations.
a) Installation of a Lining System at the Landfill Base
Several waste landfills in Pacific island countries have lining materials at the base to prevent the
leachate from leaking in to the ground. The emphasis is to protect the groundwater from
contamination. The use of clay lining is cheaper than other materials.
b) Leachate Management System
When a lining system is put in place, the leachate has to be discharged from the disposal area as
quickly as possible and safely managed before its release to the environment.
Leachate Collection and Treatment Facilities
The management of the leachate requires the installation of pipes to collect the leachate and
remove it quickly from the waste landfill. The leachate in the pipes has to be channeled into a
collection pond for storage and treatment as shown below. The system has the following
features:
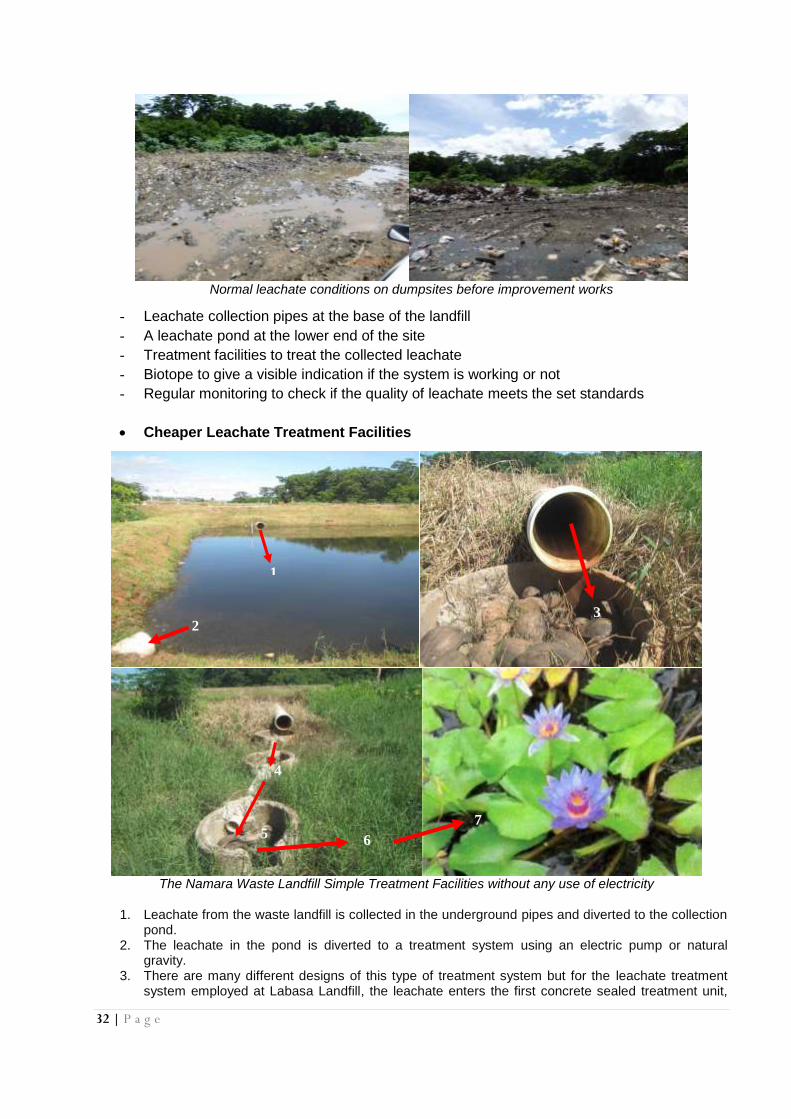
32 | P a g e
Normal leachate conditions on dumpsites before improvement works
- Leachate collection pipes at the base of the landfill
- A leachate pond at the lower end of the site
- Treatment facilities to treat the collected leachate
- Biotope to give a visible indication if the system is working or not
- Regular monitoring to check if the quality of leachate meets the set standards
Cheaper Leachate Treatment Facilities
The Namara Waste Landfill Simple Treatment Facilities without any use of electricity
1. Leachate from the waste landfill is collected in the underground pipes and diverted to the collection
pond. 2. The leachate in the pond is diverted to a treatment system using an electric pump or natural
gravity. 3. There are many different designs of this type of treatment system but for the leachate treatment
system employed at Labasa Landfill, the leachate enters the first concrete sealed treatment unit,
1
2 3
4
5 6
7

33 | P a g e
which has coconut husks that absorb the mud and nutrients as the leachate enters and rises to the top of the culvert. The coconut husks must be replaced regularly to ensure the effectiveness of the treatment system.
4. The leachate flows from the first treatment unit to the second concrete sealed unit (filled with coral as a limestone source) during the neutralisation of acidic conditions.
5. The treated leachate from the 1st and 2
nd units moves to the 3
rd unit with volcanic stones, which
provides a hub for some bacteria. 6. The treated leachate moves to the open wetland system containing grassland with a thick bank of
soil, which provides further absorption of nutrients and heavy metals.11
7. The last section of the treatment system is a biotope, where the quality of the leachate is tested through the use of biological means like lily plants and fish. If the lily plants or fishes die, it may be due to the polluted quality of the leachate.
This example uses simple, local materials to treat the leachate. The use of a natural gradient
avoids the use of electricity which can be costly to run especially with pump operation and
maintenance.
The leachate treatment at the Vaiaata Waste Landfill, Samoa
Leachate Monitoring
Leachate treatment facilities are the measures put in place in most developed waste landfills to
protect the environment from pollution. However, regular monitoring is necessary to ensure that
these measures actually work for appropriate improvements. Changes can be made to improve
the leachate quality such as replacing of treatment materials like coconut husks, sand, volcanic
stones, coral, etc. It is important to carry out monthly leachate monitoring.
11 N. F. Y. Tam * and Y. S. Wong
When the leachate level in the collection pond
rises, the leachate moves to the first step of the
treatment process Leachate from the landfill collected at the
leachate pond
Leachate concrete block with sacks of coconut
husks providing the first treatment
The leachate after the first treatment goes through the
second treatment -.channel of laid sea corals and volcanic
stones before reaching the natural existing wetland (swamp)

34 | P a g e
Regular monitoring can detect the presence of other wastes that should not be disposed of at the
site, including potential hazardous substances such as lubricant oils mixed with the general solid
waste. The colour and the smell of the leachate can quickly indicate the conditions. Black and
shiny colours with a strong smell of oil suggest the presence of lubricant oil in the waste. A similar
colour with a sewage odour suggests some sewage waste being illegally disposed of at the landfill.
Light green suggests a high content of green waste, and dark brown suggests a high content of
earth material especially during soil cover operations, etc. A rotten egg odour indicates sulphur
oxide as part of the eutrophication process. Knowing the leachate qualities is important to adjust
the management of the landfill by restricting the incoming wastes, including strict control at the
entrance gate to identify any mixed wastes for diversion from the landfill.
Leachate monitoring at Tafaigata Landfill, Samoa (left) & Kalaka Landfill, Tonga (right)
Underground / Surface Water Monitoring
The monitoring of the underground and surface water bodies in and around the waste landfill site
can indicate potential leakage, which have to be investigated for followup measures. The
establishment of groundwater monitoring stations is not possible without drilling equipment. The
equipment commonly used for water supply development can drill holes right down to the
groundwater level for insertion of PVC monitoring pipes. This can be used to regularly collect
water samples for testing. For waste landfills in coastal areas, the monitoring of the nearby
seawater provides a good indication of contamination from waste disposal sites.
c) Generated Gases Management
Gases are generated within the waste landfill from the disposed waste. One of the environmental
protection measures for waste landfill management is the installation of gas ventilation facilities,
which connect with the leachate collection facilities to reduce methane (CH4), which is a more
polluting gas than CO2. The Fukuoka method promotes the input of O2 into the waste landfill to
convert methane gas to CO2 as a less hazardous gas than methane.
Measuring the temperature at one of the gas ventilators at the Labasa Landfill, Fiji

35 | P a g e
Measurement of the discharged gas from the gas ventilation pipes gives an indication of the
conditions of the buried waste. If you put your hand over the gas vent pipe and can feel the flow
of warm air coming out of the pipe, it suggests that the system is working. If the temperature is
not much different from the outer temperature or there is no flow of air, it signals some problems
with the system such as blocked or damaged pipes, which must be repaired.
3.2.4 Harmonisation with Waste Pickers Waste pickers play an important role in the recovery of reusable and recyclable wastes from
disposal sites. This reduces waste and prolongs the use of the sites. Given the significant role of
waste pickers, efforts must be made to coordinate their scavenging operations on a daily basis to
maximise the impact of their operations with the overall goal of reducing waste. Some lessons
learnt in Fiji, Papua New Guinea, Samoa and other countries include:
Coordinating with waste pickers to scavenge more effectively and safely by setting up
daily working faces to prevent accidents,
Setting up a recording system to control the entry and exit of waste pickers on a daily
basis. This is important when accidents such as fire occur, as it allows a full account of
waste pickers in the area for clearance from the site,
Employing waste pickers on a temporary or permanent basis to promote collaboration and
support from the waste pickers communities to ensure the good flow of daily disposal
operations and to secure the safety of the facilities and workers. If waste pickers are not
treated properly, they can become a problem to the waste landfill management (see
Annex VIII on Baruni Waste Landfill Case Study, Papua New Guinea).
3.2.5 Waste Landfill Data Management Keeping accurate information and data on the incoming waste is crucial for the proper management of the facilities. In the Pacific islands there are two systems, as discussed below: a) Electronic System The installation of a Weighbridge and Data Management System provides some control of the incoming waste, and updates information on the incoming waste. This system has been introduced in Lautoka and Naboro in Fiji, and Tafaigata Waste Landfill in Samoa (see Annex VIII). The use of electronic systems makes information easier to analyse and extract for decision-making. It is a good system for quick calculation of the tipping fees for incoming vehicles and making receipts for the clients. However, the disadvantages are the high cost of ongoing maintenance e.g. when the weighbridges break down. In addition, it is costly to regularly calibrate the weighbridge to ensure it is accurate.
Installed electronic system at Lautoka, Fiji

36 | P a g e
b) Manual System The manual system without the use of a weighbridge and computers can be used to manage
incoming waste information and data if properly planned, designed and implemented by staff.
Incoming waste is recorded based on the size or volume of the vehicles. The trucks that collect
waste for government and private services are measured to determine their volume. These trucks
as normal clients of the waste landfill are recorded in a logbook under their license plate numbers
with their estimated sizes (m3). Every time they enter the waste landfill, the gate office checks
their waste loads and record them as Full (F), Half (H), Quarter (Q), Three Quarters (H + Q) and
Empty (E).
These records are used to determine the actual volume of the waste based on the estimates in
the logbook. For other vehicles from households and businesses, measurements are done to
determine their volume and their license plates are recorded for future purposes.
3.3 WASTE MANAGEMENT PLANTS AND EQUIPMENT SWM operations require plant and equipment to provide an effective and efficient service delivery
for waste collection, landfill operations and other activities such as recycling or large scale
composting. Equipment is expensive and requires regular maintenance and skilled operation.
Most SWM projects are donor-funded and may include equipment. Past experience shows that
operations often failed after the projects ended, due to high operating costs, high power or fuel
consumption, expensive spare parts and ongoing maintenance.
3.3.1 Types of Waste Plants and Equipment
Bulldozer (right) and excavator (left) are the main equipment for waste landfill operations
Bulldozers and excavators of 15 – 20 tons, depending on the size of waste landfills, can support
the daily pushing, spreading, compacting and soil cover. The common problem with this heavy
equipment is the cost of maintenance and breakdowns. The technical expertise in Pacific island
countries to repair heavy equipment is often limited, and worsened by the lack of spare parts.
Wheel loaders used at some waste landfills in PICs

37 | P a g e
Wheel loaders can provide temporary backup, but their tyres make them vulnerable to sharp
items from broken metal and glass.
Specialised Trucks for Rubbish Collection
Purpose-built trucks are better for waste collection services. Green and bulky wastes should be
collected separately, because their high density can affect the hydraulic and electronic
compaction systems of the trucks, which are more effective for light waste like paper, plastic,
cans, etc. Their advantage is easier operation compared to open dump trucks. The lower height
for loading (refer right photo above) is better for the workers. Other types of trucks and vehicles
can present problems because of the greater height to load and unload, especially for waste bins
without bags (refer photos below). These vehicles do not have special mechanisms to push the
wastes in and when half filled, the workers have to load from above, which can be an
occupational health issue12. They are also good for containing the waste during transportation
avoiding bad odours, release of leachate and keeping light waste from falling off.
Other types of collection and transportation vehicles used in PICs
These vehicles are appropriate for bulky waste items but the long term health risk to the
collection crew is a problem. The loading height, which is above the waist level of the workers,
can expose them to health problems such as back injuries, etc.
3.3.2 Selection of Plants and Equipment
The operation of plants and equipment for waste management purposes – collection and
transportation, recycling, composting, incineration, waste landfill management, etc., in Pacific
island countries are always problematic because of the following issues:
Lack of qualified and skilled manpower to operate and maintain equipment
High operating cost due to high power and fuel consumption
12 Sagapolutele Faafetai, Tuvalu Waste Surveys Report, 2017

38 | P a g e
Lack of spare parts with remote overseas suppliers Regular breakdowns because of weather conditions especially for the small atoll islands Inappropriate use of equipment Lack of care and control on the use of equipment and plant Poor ongoing maintenance
In light of the highlighted issues, the following must be considered when selecting plant and
equipment for waste management operations.
Table 8: Key Management Plants and Equipment in PICs
Plant or Equipment Size and Type Waste Management Operation
1. Excavator 10-20 tons Waste landfill Construction/ Operation/ Maintenance
2. Bulldozer 10-20 tons Waste landfill Construction/ Operation/ Maintenance
3. Wheel Loader 10-20 tons Waste landfill Construction/ Operation/ Maintenance
5. Special Rubbish Compactor Trucks
2m3 – 8m
3 Rubbish Collection Service
6. Non dump trucks 2m3 – 10m
3 Rubbish Collection Service
Table 9: Key Aspects to Check before Ordering or Buying Equipment
Aspect Why is it Important?
1. Brand and Manufacturer The brand and information about the manufacturer can indicate the quality of equipment. Those manufactured in Japan, Europe and USA or made under the well-known brands such as Caterpillar, Isuzu, Toyota, etc., are good brands.
2. Cost The cost depends on the quality of the plant or equipment. Cheaper equipment from unknown brands and manufacturers are questionable.
3. Availability of Spare parts Check if the spare parts are available in local shops or available for online order and purchase.
4. Operating cost Check how much power input or fuel is needed to operate on an hourly basis.
5. Sustainability to local conditions and intended purposes.
Some equipment is not appropriate for their intended use e.g. buying a wheel loader for landfill maintenance runs the risk of flat tyres.
3.3.3 Operation and Maintenance of Plants and Equipment It is very important to maintain equipment to keep them in good working condition. If they are
operated by inexperienced, unqualified or careless operators, they can break down or be easily
damaged.
Training of operators and certification
In Pacific island countries it is important to train operators as it can prolong the lifespan of plants
and equipment. Where local expertise is lacking, trainers or operators can be brought in to pass
on their skills.
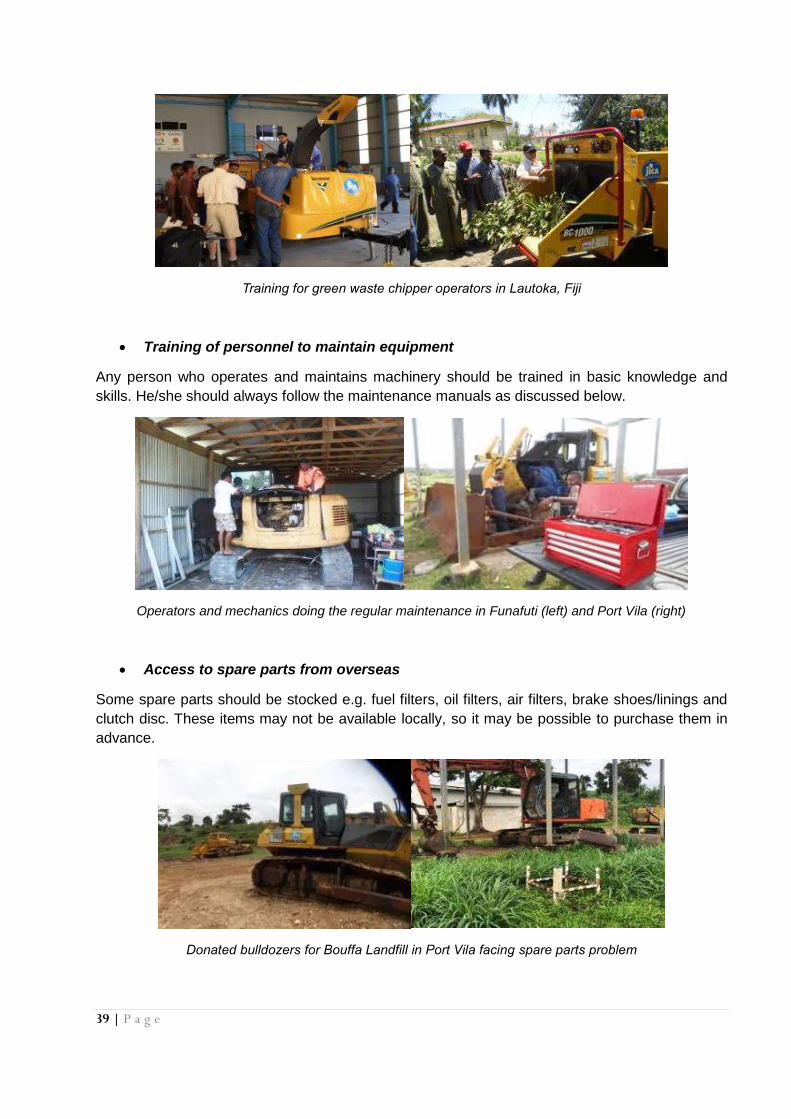
39 | P a g e
Training for green waste chipper operators in Lautoka, Fiji
Training of personnel to maintain equipment
Any person who operates and maintains machinery should be trained in basic knowledge and
skills. He/she should always follow the maintenance manuals as discussed below.
Operators and mechanics doing the regular maintenance in Funafuti (left) and Port Vila (right)
Access to spare parts from overseas
Some spare parts should be stocked e.g. fuel filters, oil filters, air filters, brake shoes/linings and
clutch disc. These items may not be available locally, so it may be possible to purchase them in
advance.
Donated bulldozers for Bouffa Landfill in Port Vila facing spare parts problem

40 | P a g e
Faulty Metals Baler in Samoa (left) and shredders in Funafuti Tuvalu (right) waiting for spare parts
Plant and equipment schedules
The maintenance schedule of plant/equipment is the period when equipment should be
maintained or serviced. Heavy equipment like bulldozers or excavators are serviced at the hourly
rating, whereas collection trucks or ordinary dump trucks are serviced based on mileage. These
important aspects must be considered in order to properly carry out proper maintenance. The
service manuals are the best guide for this work.
Table 10: Key Aspects for Plants and Equipment Maintenance
Schedule Maintenance Key Simple Task Who is Responsible Applicable to
Daily Check oil / fuel and other
liquids
Operator or Driver of the
Plant or Equipment
Vehicles Chainsaw Excavator Bulldozer Grader Other heavy
equipment
Plugs cleaning Operators of the equipment
All the above
equipment
Depending on
Recommended
Operating Hours or
Kilometers
Change and replace some items based on the Operating Manual instructions:
- Oil - Filters - Others
Qualified Mechanics and Technicians
- Employed full time mechanic or
- Given to a Mechanic workshop
All the above
equipment
When needed Replace worn parts
- Tyres - Faulty lights and
parts - Cables - Plugs - Brake pads - Others
Apart from tyres, plugs and lights which can be replaced by trained operators, parts should be replaced by a qualified mechanics or technicians.
All the above
equipment
Others: Electrical Weighing Scales, Incinerators for Healthcare Wastes and other plants and equipment of
a complex nature requires the support of suppliers and manufactures.
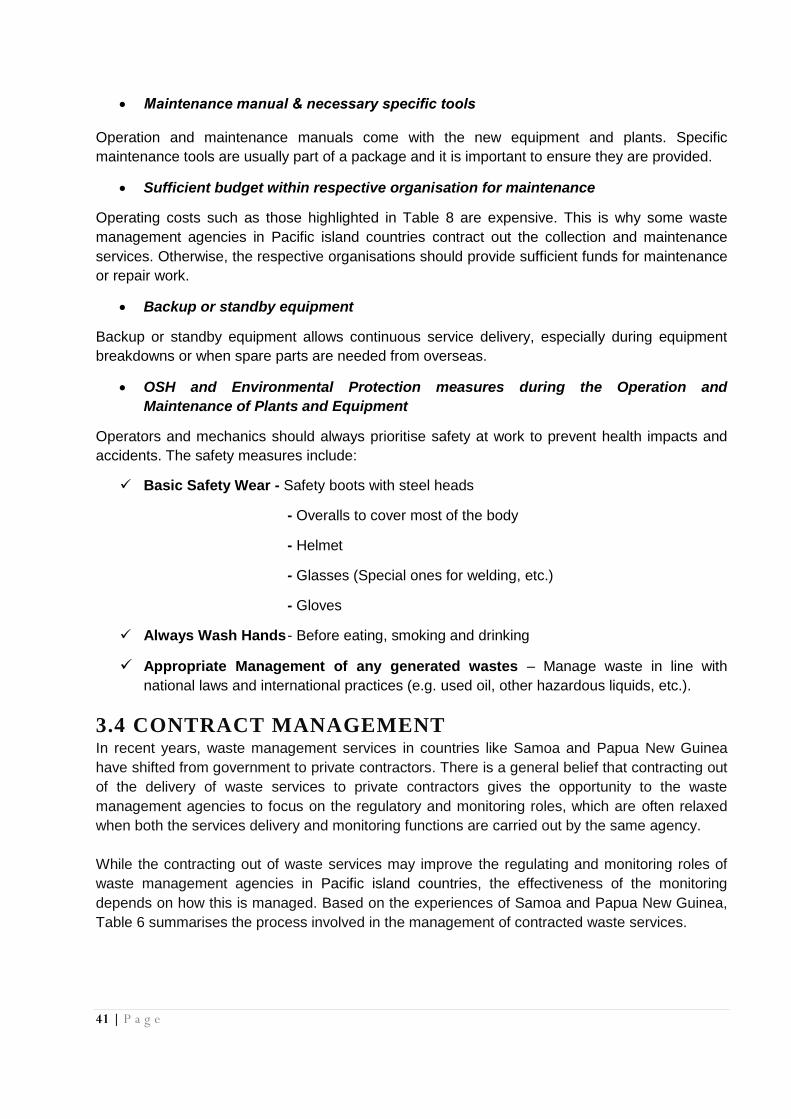
41 | P a g e
Maintenance manual & necessary specific tools
Operation and maintenance manuals come with the new equipment and plants. Specific
maintenance tools are usually part of a package and it is important to ensure they are provided.
Sufficient budget within respective organisation for maintenance
Operating costs such as those highlighted in Table 8 are expensive. This is why some waste
management agencies in Pacific island countries contract out the collection and maintenance
services. Otherwise, the respective organisations should provide sufficient funds for maintenance
or repair work.
Backup or standby equipment
Backup or standby equipment allows continuous service delivery, especially during equipment
breakdowns or when spare parts are needed from overseas.
OSH and Environmental Protection measures during the Operation and
Maintenance of Plants and Equipment
Operators and mechanics should always prioritise safety at work to prevent health impacts and
accidents. The safety measures include:
Basic Safety Wear - Safety boots with steel heads
- Overalls to cover most of the body
- Helmet
- Glasses (Special ones for welding, etc.)
- Gloves
Always Wash Hands - Before eating, smoking and drinking
Appropriate Management of any generated wastes – Manage waste in line with
national laws and international practices (e.g. used oil, other hazardous liquids, etc.).
3.4 CONTRACT MANAGEMENT In recent years, waste management services in countries like Samoa and Papua New Guinea
have shifted from government to private contractors. There is a general belief that contracting out
of the delivery of waste services to private contractors gives the opportunity to the waste
management agencies to focus on the regulatory and monitoring roles, which are often relaxed
when both the services delivery and monitoring functions are carried out by the same agency.
While the contracting out of waste services may improve the regulating and monitoring roles of
waste management agencies in Pacific island countries, the effectiveness of the monitoring
depends on how this is managed. Based on the experiences of Samoa and Papua New Guinea,
Table 6 summarises the process involved in the management of contracted waste services.

42 | P a g e
Figure 6: Common Contract Management Process in PICs
3.4.1 Collection Services Contract Management The management of collection services contracts can be difficult depending on the number of
contractors and collection zones involved. Monitoring and supervision in remote areas is always a
challenge for waste management agencies.
Some monitoring approaches have been used in Pacific island countries to support remote
islands and areas, with Samoa`s experience outlined below.
Collaboration with Key Government Agencies In Samoa, every village has a male and a female representative employed by the Ministry of
Community Development and Internal Affairs. The waste management agency uses these
government representatives in the village to check if the services were provided.
Public Feedback and Complaints The feedback from the public provides good information on the performance of rubbish
collection contractors. Monitoring forms are used to record the information such as:
Tender Process to Select Contractors
Contracts are signed between the successful contractors and the Waste Management Agency as a formal agreement between the two parties.
Successful contractors are selected based on selection criteria (technical & financial). Contractors must have the appropriate collection trucks for collection services or heavy equipment for waste landfill maintenance and other supporting resources.
Contractors deliver the services based on the Terms and Conditions in the Signed Contracts.
Waste Management agencies monitor the provision of waste
services. If there are shortfalls in the services, the contractors are
advised to rectify the situation. Failure of the contractors to
respond can result in termination of their services.
The responses and inputs from the public on the provided services are
recorded and followup visits are conducted by the waste management
agencies to confirm any issues raised by the public. This includes the
use of village’s mayors and shops along the collection routes.
Contractors are paid monthly providing the services were implemented according to the services terms and conditions.
Monitoring Reports are prepared by the
monitoring staff and submitted as
supporting documents when making
monthly payment claims to Treasury.
Monitoring staff are assigned to
regularly monitor and supervise the
delivery of these government services.
A Monitoring Programme is put in place
to guide the monitoring of the services.
These must be supported with
appropriate resources – vehicle, staff,
fuel, etc.
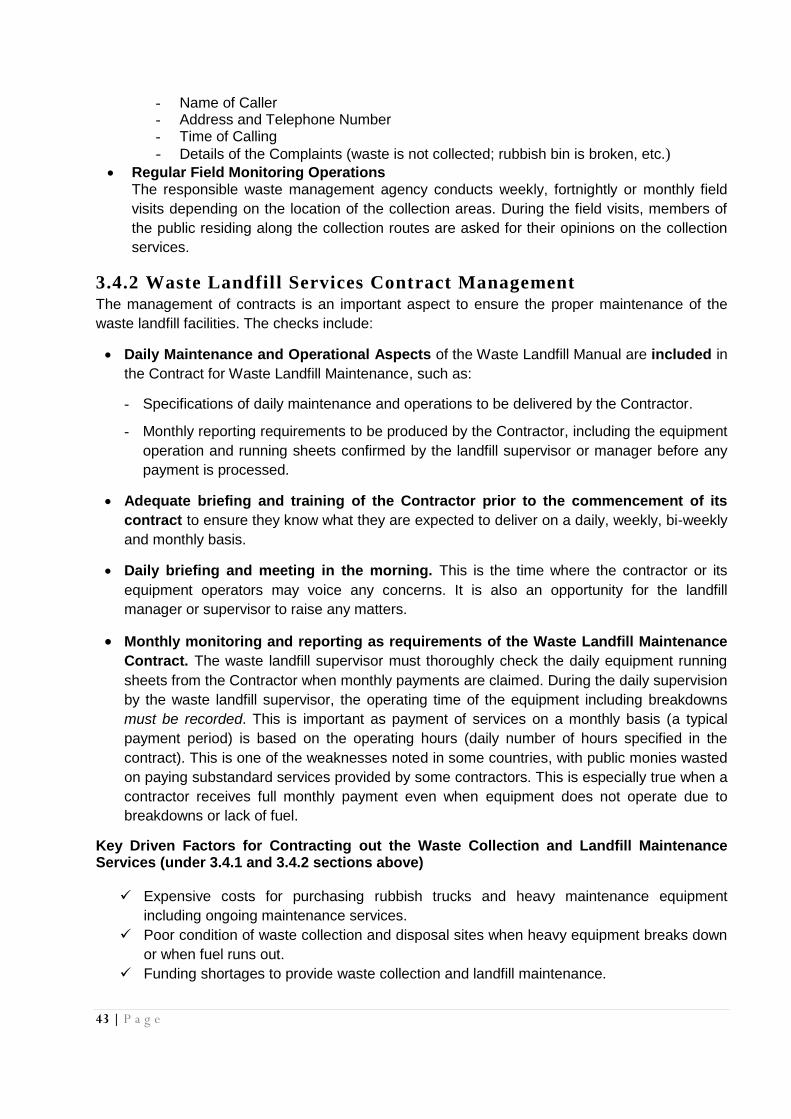
43 | P a g e
- Name of Caller - Address and Telephone Number - Time of Calling
- Details of the Complaints (waste is not collected; rubbish bin is broken, etc.)
Regular Field Monitoring Operations The responsible waste management agency conducts weekly, fortnightly or monthly field
visits depending on the location of the collection areas. During the field visits, members of
the public residing along the collection routes are asked for their opinions on the collection
services.
3.4.2 Waste Landfill Services Contract Management The management of contracts is an important aspect to ensure the proper maintenance of the
waste landfill facilities. The checks include:
Daily Maintenance and Operational Aspects of the Waste Landfill Manual are included in
the Contract for Waste Landfill Maintenance, such as:
- Specifications of daily maintenance and operations to be delivered by the Contractor.
- Monthly reporting requirements to be produced by the Contractor, including the equipment
operation and running sheets confirmed by the landfill supervisor or manager before any
payment is processed.
Adequate briefing and training of the Contractor prior to the commencement of its
contract to ensure they know what they are expected to deliver on a daily, weekly, bi-weekly
and monthly basis.
Daily briefing and meeting in the morning. This is the time where the contractor or its
equipment operators may voice any concerns. It is also an opportunity for the landfill
manager or supervisor to raise any matters.
Monthly monitoring and reporting as requirements of the Waste Landfill Maintenance
Contract. The waste landfill supervisor must thoroughly check the daily equipment running
sheets from the Contractor when monthly payments are claimed. During the daily supervision
by the waste landfill supervisor, the operating time of the equipment including breakdowns
must be recorded. This is important as payment of services on a monthly basis (a typical
payment period) is based on the operating hours (daily number of hours specified in the
contract). This is one of the weaknesses noted in some countries, with public monies wasted
on paying substandard services provided by some contractors. This is especially true when a
contractor receives full monthly payment even when equipment does not operate due to
breakdowns or lack of fuel.
Key Driven Factors for Contracting out the Waste Collection and Landfill Maintenance Services (under 3.4.1 and 3.4.2 sections above)
Expensive costs for purchasing rubbish trucks and heavy maintenance equipment
including ongoing maintenance services.
Poor condition of waste collection and disposal sites when heavy equipment breaks down
or when fuel runs out.
Funding shortages to provide waste collection and landfill maintenance.

44 | P a g e
Public complaints for the poor performance by waste management staff and workers in
the delivery of these waste services.
Key Lessons Learnt
Improvement of services delivered by contractors only if well supervised and managed.
Ongoing pressure from contractors to bribe key staff involved in the management of their
contracts through special treatment, monetary offers and other benefits.
Funds to finance contractual obligations of Town or City Councils and State Governments
always receive priority for annual budget support, thus securing financial support for the
provision of collection and waste landfill services.
Way Forward
Improving the preparation of Contract Documents to ensure all aspects are clearly stated.
Having a Technical Committee within the waste management agency to monitor the
provision of these contracted services on a monthly basis, before endorsement of any
monthly payments, can avoid bribery by contractors of key waste management staff.
The selection of contractors through public tender must not be based on the Lowest Bid
Policy, but on an evaluation of technical and financial capacities including their past
performance. Contractors often cut down bid prices just to win tenders but they
sometimes create improper ways to reduce costs during implementation.
3.5 OCCUPATIONAL SAFETY AND HEALTH (OSH) Workers in the waste management sector are exposed to occupational and health risks on a daily
basis, whether at the landfill, on the road during rubbish collection or in a recycling facility. Due to
the risks involved, the International Labour Organization (ILO) has promoted Occupational Safety
and Health through the development of awareness campaigns and education materials. Some
guiding documents are highlighted below.
a) Work Adjustment for Recycling and Managing Waste (WARM) Training Manual
A WARM manual serves as a tool to promote and improve safety and healthy working conditions
for waste management workers and the community. The manual aims to:
Promote dialogue and cooperation between waste collectors and the community
Cooperation between waste collectors and the community is fundamental in improving the
safety and efficiency of waste collection services in accordance with the national laws and
policies. Both waste collectors and the community can share benefits and achievements.
Learn from local good practices
It is important to learn from local good practices. The concepts and ideas that both waste
collectors and the community will find are concrete, practical and affordable.
Applying Participatory Action Oriented Training (PAOT) approaches to all involved in
Solid Waste Management (SWM)

45 | P a g e
This promotes the active participation of waste collectors, the community and other
stakeholders such as school children and teachers, non-government organisations,
businesses, contractors, waste pickers, recycling workers, etc., to provide safer working
conditions.
b) Occupational Safety and Health Aspects in Waste Management
The WARM manual has sections dealing with the different operations – waste collection and
transportation, recycling and waste landfill management:
Household waste collection and transport
This section includes community cooperation for proper waste segregation and storage,
door-to-door collection, transport and safe waste handling.
Waste Segregation, sorting, and recycling at local treatment facility
This section includes workstation design, and control of physical agents.
Waste Management at the dumpsite
This section includes working conditions, welfare amenities and health promotion.
c) Underlying Principles of WARM Training Manual
Implementing improvements in a step-wise manner
Promote the implementation of OSH improvements in a simple, low-cost, practical and
manageable way. Most improvements cannot be done overnight, especially if they are
expensive. The cheaper ones should be implemented first, with expensive ones later.
Networking waste collectors and community for wider impact
Promote and communicate OSH ideas to the key waste management stakeholders. The
knowledge, skills and experiences have to be replicated continuously through networking to
strengthen cooperation in schools, waste pickers, recycling workers, contractors and the
local authorities. This will assist in building sound, effective and better waste management
systems.
Linking safe and efficient waste collection to overall environmentally sound
management system
Waste collection, separation and recycling is an essential part of building environmentally
sound waste management systems. Most countries are increasing their efforts to promote
the 3Rs (Reduce, Reuse and Recycle). Those involved in dealing with waste can play a
pivotal role to promote a cleaner and healthier environment. They should be recognised for
the contribution they make towards protection and preservation of the fragile environment of
the Pacific.

46 | P a g e
3.6 EDUCATION AND AWARENESS
3.6.1 Clean School Programme With the establishment of 3R activities for waste minimisation, there is a need to educate and
raise awareness among adults and children. Schools have a core role since children can share
these ideas at home and in the community. A Clean School Programme was introduced in Nadi,
Fiji to improve the solid waste management issues and practices in schools. The Clean School
Programme experience had the following objectives:
To give an opportunity for schools to start with proper waste management
To target children in creating awareness on the concept of waste minimisation at
schools, homes and communities.
a) Management Approaches Taken
i. Setting up of a 3R Committee
The first step is to establish a ‘3R committee’ (the name may vary in each school). This will
encourage schools to participate and claim ownership of the waste issues. It is important to:
- Develop and share overall goals. - Have regular meetings. - Have good communication between the committee and the rest of the school. - Involve parents and communities in the activities. - Ensure all committee members take specific tasks.
Schools can elect officers / form action teams to carry out the activities at classroom level.
ii. PDCA Cycle
In order to get from “problem-faced to “problem-solved”, it is important to manage the activities
towards the problem and keep improving it. A PDCA Cycle is a useful checklist of the four stages:
Plan: Find out what the problem is, and plan a solution.
Do: Carry out the activities based on the plan.
Check: Evaluate the result of the activities for solving the problem.
Act: Improve the points which are not successful for achieving the goals.
By using a PDCA Cycle, schools can prepare an Action Plan.
iii. Action Plan
Schools should develop an Action Plan with the following steps:
- Brainstorm the problems about waste issues the school is currently facing. - Discuss and identify the main problems of the school. - Set the goals. - Plan the activities to achieve the goals. The plan should include the content (what), the
process (how), the person or group in charge (who), the time frame (when) and the cost (how much).
- Fill in the Action Plan sheet. The plan should be renewed regularly according to the results and lessons from the activities,
which is part of the PDCA cycle.

47 | P a g e
b) Practical Approaches Taken
The Clean School Programme is implemented in three components, namely:
Component 1: Raising Environment Awareness This highlights examples of what schools can plan and carry out for educational activities, which will help to raise awareness. It focuses on ‘Reduce’ and ‘Reuse’ activities. Component 2: School Composting This focuses on the separation of organic waste at source (classroom level). Schools are
encouraged to prepare separate bins in each classroom for organic waste, and to construct a site
for composting activity. (Boxes can be used for bins and the compost structure can be made
using local resources instead of buying new).
Component 3: Rubbish Separation and Recycling This focuses on the separation of waste, mainly recyclable items, from source (classroom level).
Schools are encouraged to prepare separate bins in the classroom depending on the types of
waste.
3.6.2 Public and Community Awareness An awareness programme is one of the tools to transfer visual and audio messages to the public.
The information provided should be accurate, reliable and timely. The following should be taken
into account:
Target group:
Know your target audience. There are often key people in the
community who can influence the public in a very simple
way. For example, you can target women’s groups, leaders
of the community such as chiefs, church leaders, town
officers, etc.
Methods to use for Public and Community
Awareness:
After consultation with the target group, you will find the most
effective method to use for the particular community. The
information from the target group usually identifies the
methods that will attract the attention of the community.
Examples include a radio programme for youth using the latest hits before and after the
announcements; TV advertisements with key problems that need to be addressed, etc. There are
no good or bad methods of awareness. Their effectiveness depends on targeting the right
audience and using the right tools to address the problems.
Take time to select your methods to attract the attention of the target group.
How to implement Awareness:
During implementation it is important to observe the effectiveness of each method. Media
awareness is one of the most effective methods. TV programmes are good but can be very
expensive. In some Pacific island countries, radio is the most popular medium. Choose the
methods that suit your target audience and your budget.
CONSULTATION W ITH KAMELI W OMEN ’S GROUP

48 | P a g e
Lessons learnt:
- Involve committed, supportive people as key targets and champions such as chiefs,
church leaders, etc.
- Don’t prejudge, always be willing to try different options.
- Understand your community before taking action.
- Avoid making promises that raise expectations.
- Don’t criticise. Compliments and encouragement are the key to community work.
- Be patient.
- Community capacity, known as the coconut wireless, is cheap but needs monitoring
and updates.
- Incentives are needed to motivate and sustain the programme.
- Keep your promises and your commitments.
- Precise information is needed.
- Consider the background of the community, to make your activities more effective and
less time consuming.
- Government support may be possible with policy and funding.
- Enforcement of awareness programme by all stakeholders.
- Awareness to all levels is not easy.
Challenges:
Awareness and action should go together with physical materials to promote positive changes
e.g. the poster of waste segregation could come with a suitable container for households to use.
Introducing awareness programmes to school, such as in school curricula and education
programmes, needs strong commitment from the Ministry of Education and teachers.
Limited funding might affect the selection of the best target or the best awareness programme,
such as radio, TV, newspaper, promotional materials, etc. It might also affect running costs and
sustainability.
Way forward:
- Expansion of programme to TV advertisements, printed materials, newspapers, etc. –
from donor funding or government budget.
- National SWM Plan developed for the Kingdom of Tonga and reflected in the Regional
Strategies 2016 – 2020.
- Community participation in community-based collection system increases to 80%.
- Monitoring data records will be very important for future plans, and in assessing
effectiveness and sustainability.
- By-laws could be considered as part of government support.
- Government could also subsidise the system to help sustain it.
- Community interest is often not stable on its own, and therefore the community waste
collection system should be supported by ministries, NGO’s and churches.
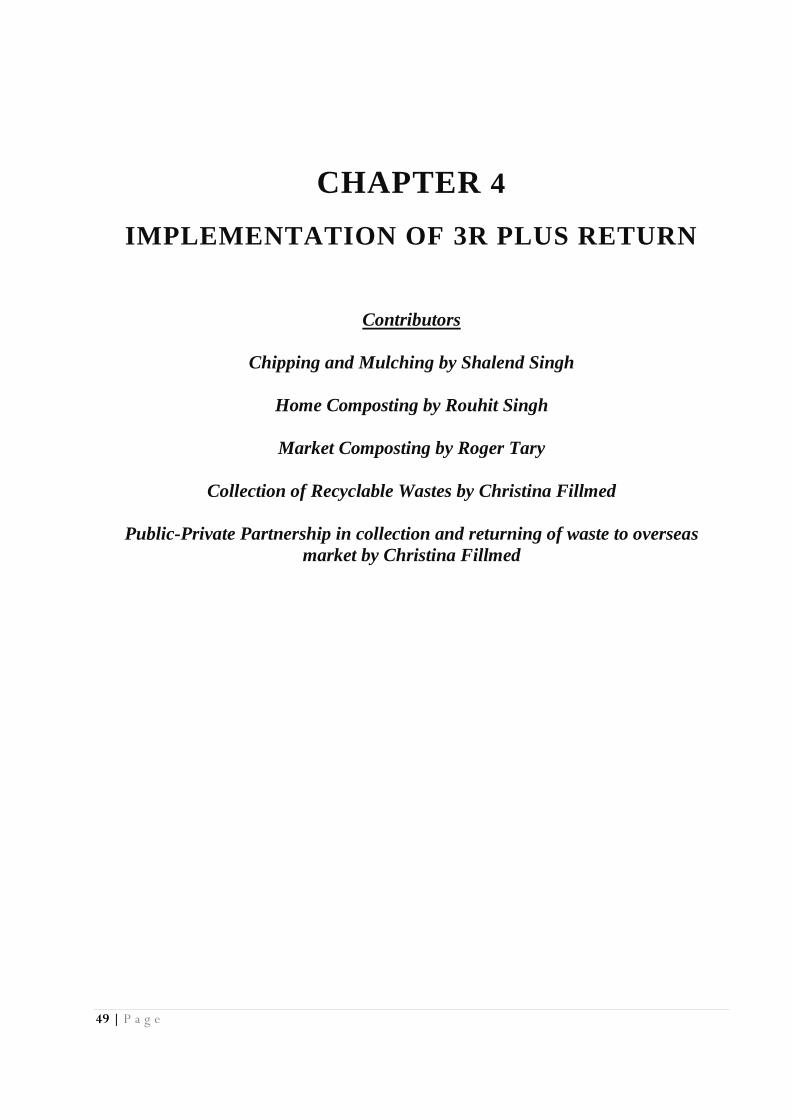
49 | P a g e
CHAPTER 4
IMPLEMENTATION OF 3R PLUS RETURN
Contributors
Chipping and Mulching by Shalend Singh
Home Composting by Rouhit Singh
Market Composting by Roger Tary
Collection of Recyclable Wastes by Christina Fillmed
Public-Private Partnership in collection and returning of waste to overseas
market by Christina Fillmed

50 | P a g e
4.0 THE 3Rs PLUS RETURN _______________________________________________________________________________
In recent years, the use of 3Rs + Return has been promoted regionally and internationally to
recognise the actual conditions in Pacific Island Countries, where recycling of waste is limited and
only applicable to a few waste items due to the absence of appropriate facilities, systems and
processes. In order to avoid one-way traffic of materials, the addition of Return to the usual 3Rs
acronym highlights what is practical for Pacific island countries to recycle, and what can be done
to waste that cannot be recycled or treated on-island.
4.1 RETURN TO EARTH OF GREEN WASTE The conversion of waste to products or other forms in Pacific island countries is mostly applied to
green waste using practical processes such as mulching, chipping, home composting, market
composting, etc.
Green waste is bulky in nature and its low compaction is its unique feature. Hence, transportation
for disposal to distant landfill sites is a challenge for most Local Authorities (LAs) and
communities. Most resort to improper disposal of green waste by burning, littering in public places
or backyard accumulation. Green waste littered in drains and creeks causes blockages and even
flash flooding during heavy rain. Green waste when disposed at landfills occupies more space
and hampers compaction efforts. This increases the collection, transportation and landfilling
costs.
Whilst burning of green waste is a simple and cheap solution to many, it incurs hidden and
indirect costs in terms of adverse impacts to air quality and health. Burning of green waste emits
smoke and fumes which by its odor and appearance is offensive, objectionable and also
prejudicial to the environment, health and safety of people. It can pose a fire hazard to
neighbouring properties and often leads to neighbour disputes. Burning also results in a smoke
nuisance and settlement of fly ash on clothes hanging on clotheslines, terraces and windows.
Young children and people suffering from respiratory diseases such as asthma are particularly
vulnerable. Open burning of waste also results in emission of greenhouse gases which contribute
to global warming and other climate change impacts. The health and environmental impacts of
green waste burning mean it is not the best solution.
Table 11 presents the estimates of green waste generated from some areas in Fiji and Tonga.
It shows the significance of the amounts of the green waste for appropriate management using
the accepted practices, as discussed in the following sections (4.1.1, 4.1.2, 4.1.3 and 4.1.4).
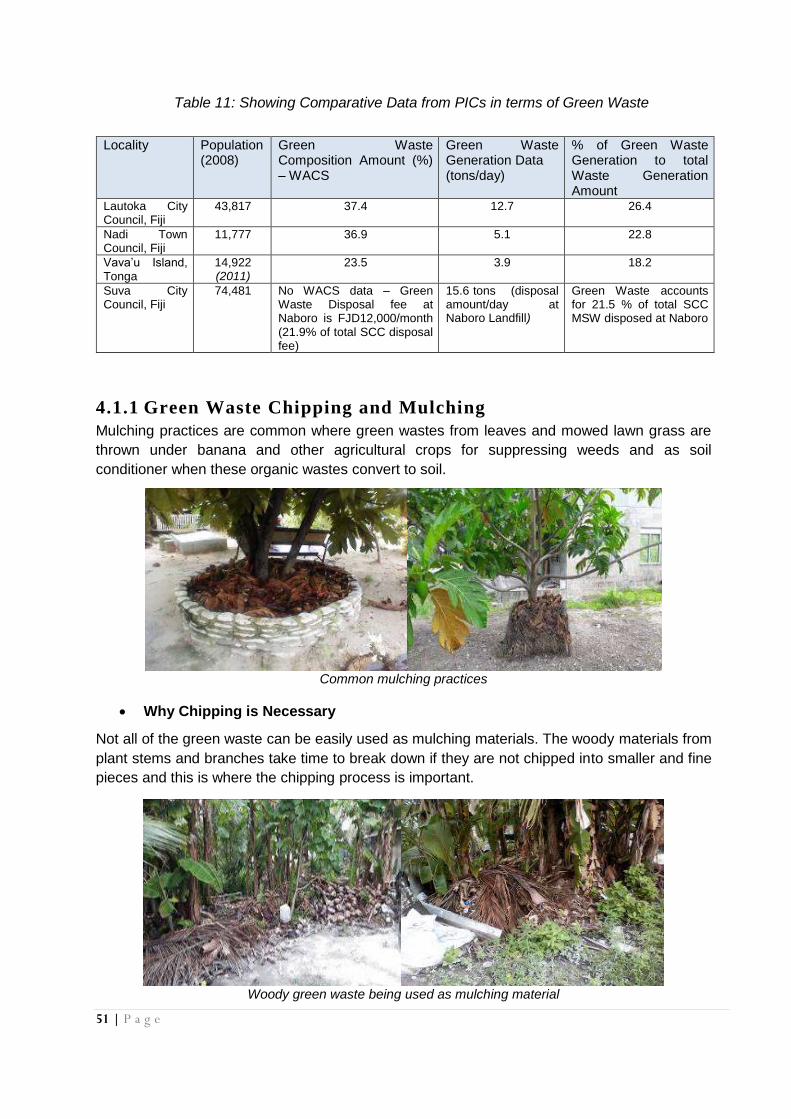
51 | P a g e
Table 11: Showing Comparative Data from PICs in terms of Green Waste
4.1.1 Green Waste Chipping and Mulching
Mulching practices are common where green wastes from leaves and mowed lawn grass are
thrown under banana and other agricultural crops for suppressing weeds and as soil
conditioner when these organic wastes convert to soil.
Common mulching practices
Why Chipping is Necessary
Not all of the green waste can be easily used as mulching materials. The woody materials from
plant stems and branches take time to break down if they are not chipped into smaller and fine
pieces and this is where the chipping process is important.
Woody green waste being used as mulching material
Locality Population (2008)
Green Waste Composition Amount (%) – WACS
Green Waste Generation Data (tons/day)
% of Green Waste Generation to total Waste Generation Amount
Lautoka City Council, Fiji
43,817 37.4 12.7 26.4
Nadi Town Council, Fiji
11,777 36.9 5.1 22.8
Vava’u Island, Tonga
14,922 (2011)
23.5 3.9
18.2
Suva City Council, Fiji
74,481 No WACS data – Green Waste Disposal fee at Naboro is FJD12,000/month (21.9% of total SCC disposal fee)
15.6 tons (disposal amount/day at Naboro Landfill)
Green Waste accounts for 21.5 % of total SCC MSW disposed at Naboro

52 | P a g e
Chipping of green waste is ideal if wood chippers are available, not only for mulching and
composting but also to reduce the size of the piles for easier collection.
Mulching using chipped wastes & Chipper during the Green Waste Collection, Lautoka, Fiji
On-site green waste chipping is particularly valuable during the aftermath of natural calamities
as it significantly reduces the disposal spaces needed for the incoming green waste.
Collected incoming green waste & Chipping operations at Funafuti, Tuvalu
Benefits of wood chipping and mulching include:
- Wood chips can be used for mulching in council flower gardens. This conditions the
soil, slows water evaporation (reducing watering costs), replenishes the nutrients in
the soil once decomposed and beautifies the garden. Wood chip mulch inhibits
weeds.
- Wood chips are ideal for market waste composting as a carbon rich base material
for home composting, and for moisture control. It assists in maintaining the Carbon-
Nitrogen (CN) ratio and yields a better quality of compost.
- Wood chips in large quantities can be used as a boiler fuel (e.g. Fiji Sugar
Corporation).
- Prevents open burning and its adverse impacts to the environment and public
health.
- Prevents littering in creeks/drains, and reduces risk of flash flooding.
- Reduces collection, transportation and disposal of green waste especially during
pruning of trees from road sides/parks and from natural calamities.
- Extends life of landfill sites and reduces risk of fire at landfill sites.
- Prevents accumulation of refuse in backyards and public places.
Wood Chipper Specifications and Procurements
Green waste chipping and mulching requires a wood chipper. The Local Authorities (LA) can
procure a wood chipper either by:

53 | P a g e
Purchasing a new wood chipper
Purchasing a second-hand wood chipper
Hiring a wood chipper
Applying for funding from funding agencies.
A 250 mm capacity wood chipper is preferred as it can chip reasonable sizes of wood trunks, branches and twigs. A truck is required to pull the wood chipper to various sites for onsite chipping. Chain saws and knives are also required for cutting side branches or to reduce the trunk size of green waste for effective chipping.
Green waste material intended for chipping must be clean and free of metals, nails, barbed wire, plastics, rocks etc. Green waste like coconut leaves, palm fronds and even green waste which discharges glue-like matter should not be chipped as it may cause a malfunction.
The suppliers of wood chippers need to train the operators and maintenance crews to ensure the chipper is used properly and to prolong its life span. Wood chippers have high maintenance costs to cover sharpening of chipper blades, servicing, fuel and maintenance. Strict adherence to Occupational Safety and Health requirements is required to avoid any mishaps. Wood chippers are loud, so the location for green waste chipping should be carefully selected.
4.1.2 Home Composting “Composting is the biological decomposition of organic waste such as food or plant materials by
bacteria, fungi, worms and other organisms under controlled aerobic (occurring in the presence of
oxygen) conditions. The end result of composting is an accumulation of partially decayed
organic matter (soil-like product) called humus”13. This is an effective and environment-friendly
method of producing organic fertiliser for use in vegetable and flower gardening, potting etc.
As the name implies, the home composting of green waste must take place at home. Past studies
in Pacific island countries suggest that more than 50% of the household solid waste is green
waste and therefore can be managed at the source if home composting is practiced. This
reduces the amounts of waste to be collected and diverts it from entering the waste disposal
sites.
Using Special Compost Plastic Bins
13 http://livinggreen.ifas.ufl.edu/waste/composting.html

54 | P a g e
Cheaper Approaches – use of a tarpaulin to cover the pile of green waste
The process of making good home compost based on the experiences learnt from Lautoka, Fiji is
discussed in Annex XIII. Several attempts in Pacific island countries to promote home composting
failed in many communities due to time and effort, limited land space, etc. This has led to the
establishment of composting activities away from households (e.g. at the Landfill Site, Agricultural
Projects, etc.), as discussed in the following section.
4.1.3 Centralised Composting (Away from the Generating Sources)
The main composting activities in Pacific island countries apart from home composting are
centralised composting operations at the waste disposal sites and other central locations.
a) Market Composting These composting activities mainly target the green waste from the markets. The market waste is
collected and diverted to the front of a waste disposal site or other central location for treatment.
Market Composting at Labasa (left) & Suva Compost Facilities in Fiji
The same initiative is implemented for market waste in most City and Town Councils in Fiji as
well as Port Vila (Vanuatu) and other Pacific island countries. The market green waste is mostly
soft parts of plants such as leaves, soft stems and peelings from roots and other non-woody
plants. These can be put in piles and covered with tarpaulins or straight into plastic composting
bins. Shredding into fine parts, if a shredder is available, can speed up the composting process.
b) Other Green Waste Composting Processes
Other initiatives with no special focus on the market wastes recover all the green waste, including
woody parts from tree stems and branches for composting. The woody parts are chipped while
the leaves and soft parts including vines and mowed lawns are put in piles and covered with
tarpaulins for quicker composting.
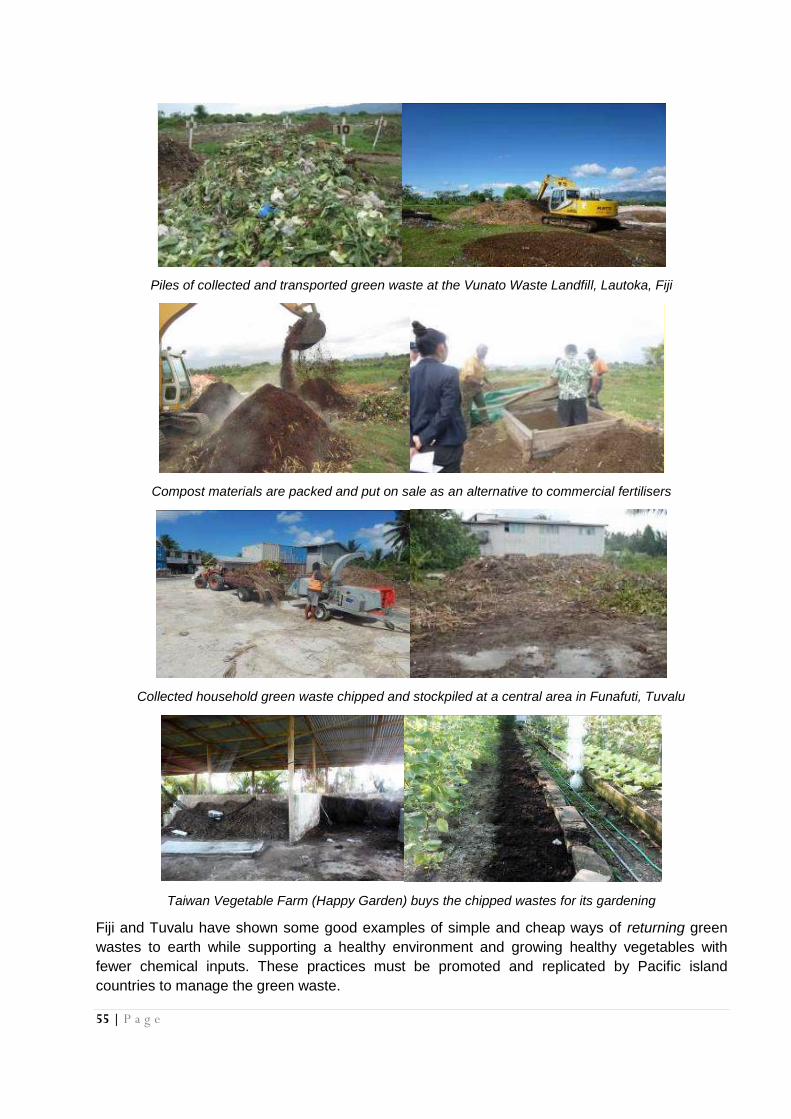
55 | P a g e
Piles of collected and transported green waste at the Vunato Waste Landfill, Lautoka, Fiji
Compost materials are packed and put on sale as an alternative to commercial fertilisers
Collected household green waste chipped and stockpiled at a central area in Funafuti, Tuvalu
Taiwan Vegetable Farm (Happy Garden) buys the chipped wastes for its gardening
Fiji and Tuvalu have shown some good examples of simple and cheap ways of returning green
wastes to earth while supporting a healthy environment and growing healthy vegetables with
fewer chemical inputs. These practices must be promoted and replicated by Pacific island
countries to manage the green waste.
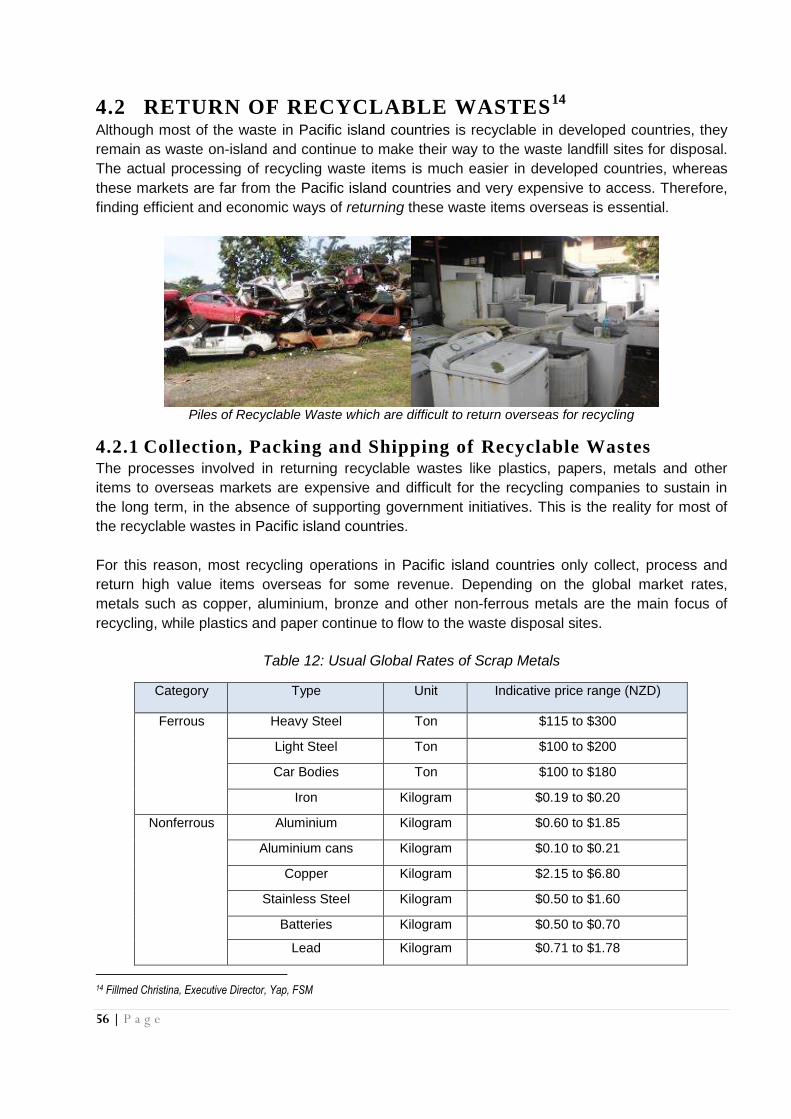
56 | P a g e
4.2 RETURN OF RECYCLABLE WASTES14
Although most of the waste in Pacific island countries is recyclable in developed countries, they
remain as waste on-island and continue to make their way to the waste landfill sites for disposal.
The actual processing of recycling waste items is much easier in developed countries, whereas
these markets are far from the Pacific island countries and very expensive to access. Therefore,
finding efficient and economic ways of returning these waste items overseas is essential.
Piles of Recyclable Waste which are difficult to return overseas for recycling
4.2.1 Collection, Packing and Shipping of Recyclable Wastes The processes involved in returning recyclable wastes like plastics, papers, metals and other
items to overseas markets are expensive and difficult for the recycling companies to sustain in
the long term, in the absence of supporting government initiatives. This is the reality for most of
the recyclable wastes in Pacific island countries.
For this reason, most recycling operations in Pacific island countries only collect, process and
return high value items overseas for some revenue. Depending on the global market rates,
metals such as copper, aluminium, bronze and other non-ferrous metals are the main focus of
recycling, while plastics and paper continue to flow to the waste disposal sites.
Table 12: Usual Global Rates of Scrap Metals
Category Type Unit Indicative price range (NZD)
Ferrous
Heavy Steel Ton $115 to $300
Light Steel Ton $100 to $200
Car Bodies Ton $100 to $180
Iron Kilogram $0.19 to $0.20
Nonferrous
Aluminium Kilogram $0.60 to $1.85
Aluminium cans Kilogram $0.10 to $0.21
Copper Kilogram $2.15 to $6.80
Stainless Steel Kilogram $0.50 to $1.60
Batteries Kilogram $0.50 to $0.70
Lead Kilogram $0.71 to $1.78
14 Fillmed Christina, Executive Director, Yap, FSM
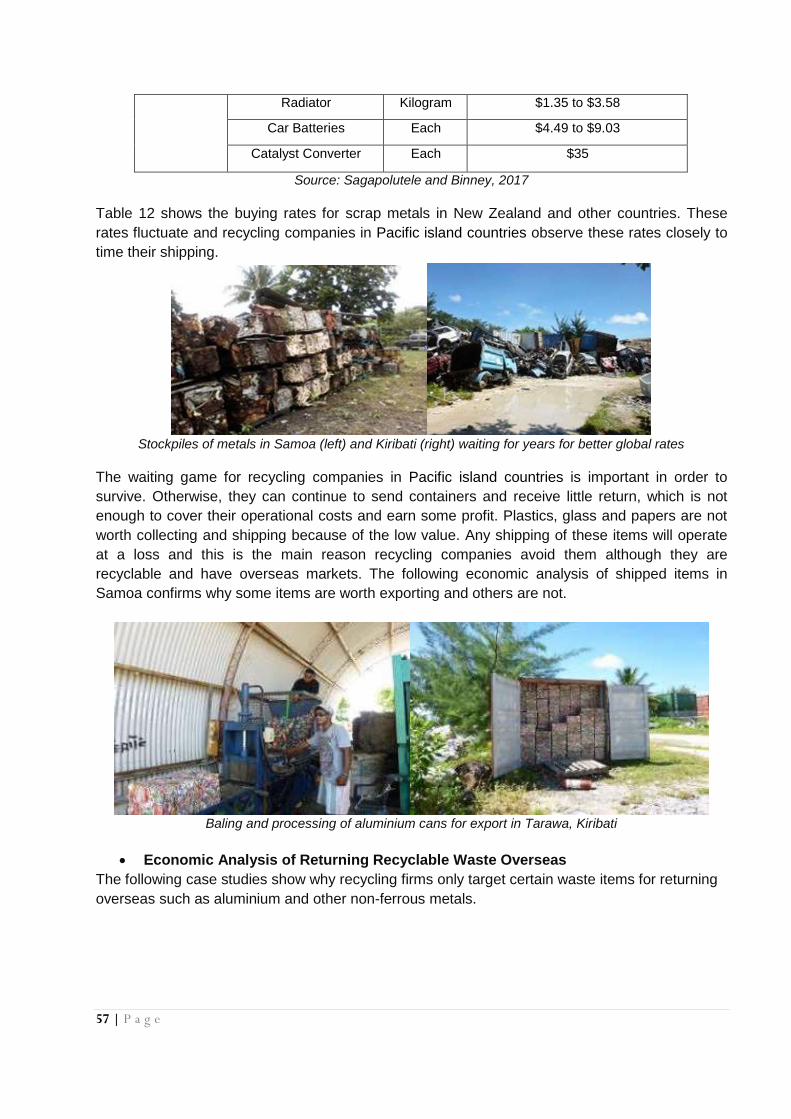
57 | P a g e
Radiator Kilogram $1.35 to $3.58
Car Batteries Each $4.49 to $9.03
Catalyst Converter Each $35
Source: Sagapolutele and Binney, 2017
Table 12 shows the buying rates for scrap metals in New Zealand and other countries. These
rates fluctuate and recycling companies in Pacific island countries observe these rates closely to
time their shipping.
Stockpiles of metals in Samoa (left) and Kiribati (right) waiting for years for better global rates
The waiting game for recycling companies in Pacific island countries is important in order to
survive. Otherwise, they can continue to send containers and receive little return, which is not
enough to cover their operational costs and earn some profit. Plastics, glass and papers are not
worth collecting and shipping because of the low value. Any shipping of these items will operate
at a loss and this is the main reason recycling companies avoid them although they are
recyclable and have overseas markets. The following economic analysis of shipped items in
Samoa confirms why some items are worth exporting and others are not.
Baling and processing of aluminium cans for export in Tarawa, Kiribati
Economic Analysis of Returning Recyclable Waste Overseas
The following case studies show why recycling firms only target certain waste items for returning
overseas such as aluminium and other non-ferrous metals.

58 | P a g e
Table 13: Cost Estimate for a Container (20ft) of Aluminum Cans
Details Unit Cost Total Cost
11,520 kg material cost ST$0.20 per kg ST$2,304
Processing Cost including labour 200hrs @ ST$25.00 ST$5,000
Cartages (delivery to / from) ST$542.80
Freight to NZ US$1,325 ST$3,312.5
Export Documentation ST$338.60
NZ Wharfage NZ$215 ST$387
Total Expense ST$11,884.9
Aluminum Cans Rate15
(NZ market) = NZ$0. 20 per kg
Revenue from Container (20ft) = 11,520kg x ST$0.37/kg = ST$4,262.4
ST$4,262.4
LOSS -ST$7,622.5
Source: Sagapolutele and Binney, 2017
Table 13 shows a loss of ST$7,622.5 for processing and exporting aluminum cans at the current
rate of NZ$0.20 per kilogram (ST$0.37/kg) at one of the recycling companies in New Zealand.
The loss will be reduced to ST$5,318.5 if the aluminum cans are collected by the recycling
companies workers without buying it from the public.
Table 14 also shows a similar loss when collecting and processing ferrous empty cans from
tinned fish, tinned meat and others. The buying rate in overseas markets is very low.
Table 14: Costing Estimate for a Container of Steel Cans
Details Unit Cost Total Cost
12,800 kg material cost ST$0.05 per kg ST$640
Processing Cost including labour 200hrs @ ST$25.00 ST$5,000
Cartages (delivery to / from ST$542.80
Freight to NZ US$1,325 ST$3,312.5
Export Documentation ST$338.60
NZ Wharfage $215NZ ST $387
Total Expense ST $10,220.9
Steel Cans rate (NZ market) = $0. 16 per kg
Revenue from Container (20ft) = 12, 800 kg x $0.16 kg
= NZ$2,048
ST$3,686.40
LOSS -ST$6,534.5
Source: Sagapolutele and Binney, 2017
15 http://www.currentscrapmetalpricesperpound.com/scrap-metal-prices-new-zealand.php

59 | P a g e
Tables 13 and 14 show why recycling companies in Pacific island countries avoid empty cans as
a recyclable material for export. In addition, the processing and returning of paper, plastic and
glass waste has the same problem. This has restricted the operation of recycling companies to
fewer items of better economic value, while the rest of the recyclable items remain as waste.
4.2.2 Public-Private Partnership in implementing Recycling The idea of PPP in recycling has been seen as a way forward to assist recycling operations in
Pacific island countries due to the difficulties as discussed in the earlier sections. The key issues
affecting the return of recyclable wastes in the region are beyond the control of recycling
companies. The contribution of recycling operations in cleaning the environment and making
better use of the limited land resources is crucial. Without these recycling operations in the
region, more land would be needed for waste disposal. Therefore, the partnership between the
governments and recycling firms can help to bridge some gaps and improve the situation with the
return of recyclable wastes overseas.
a) Why there is a need for the government to support these recycling operations:
Waste Management Cost Reduction to Governments The recovery, collection and shipment of wastes overseas by recycling firms reduce the overall
costs to the government for collection and disposal services. The quantities of waste to be
collected by government waste agencies would be more without the recycling operations.
Prolonging the Lifespan of Waste Disposal Sites The average number of shipped containers (20 feet) overseas in Samoa for example is between
50 to 80 per annum. This equates to 1,950 m3 to 3,120 m3 of compacted waste, which would
have filled an equivalent land area of 1,950 m2 to 3,120m2 with a disposed waste level of up to
one metre high. The waste at landfills would be more without the recycling operations.
Cleaning the Environment
Without recycling operations, this waste would have been ended up along the roadsides, coastlines and backyards.
Employment Creation and Income Opportunities
Recycling operations have provided employment opportunities especially for those who did not
have the educational background to get better employment.
In light of the above, governments must collaborate with recycling companies to maximise the
benefits of recycling operations through Public-Private Partnerships that are suitable for island
economies.
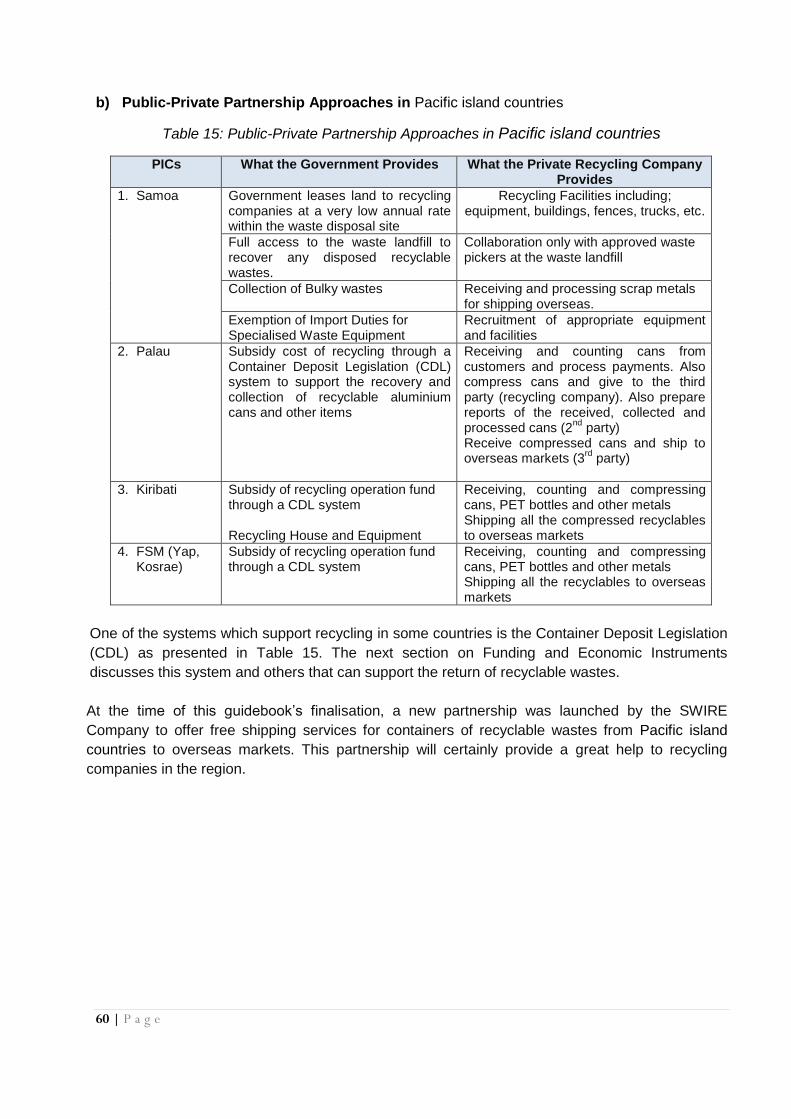
60 | P a g e
b) Public-Private Partnership Approaches in Pacific island countries
Table 15: Public-Private Partnership Approaches in Pacific island countries
PICs What the Government Provides What the Private Recycling Company Provides
1. Samoa Government leases land to recycling companies at a very low annual rate within the waste disposal site
Recycling Facilities including; equipment, buildings, fences, trucks, etc.
Full access to the waste landfill to recover any disposed recyclable wastes.
Collaboration only with approved waste pickers at the waste landfill
Collection of Bulky wastes Receiving and processing scrap metals for shipping overseas.
Exemption of Import Duties for Specialised Waste Equipment
Recruitment of appropriate equipment and facilities
2. Palau Subsidy cost of recycling through a Container Deposit Legislation (CDL) system to support the recovery and collection of recyclable aluminium cans and other items
Receiving and counting cans from customers and process payments. Also compress cans and give to the third party (recycling company). Also prepare reports of the received, collected and processed cans (2
nd party)
Receive compressed cans and ship to overseas markets (3
rd party)
3. Kiribati Subsidy of recycling operation fund through a CDL system Recycling House and Equipment
Receiving, counting and compressing cans, PET bottles and other metals Shipping all the compressed recyclables to overseas markets
4. FSM (Yap, Kosrae)
Subsidy of recycling operation fund through a CDL system
Receiving, counting and compressing cans, PET bottles and other metals Shipping all the recyclables to overseas markets
One of the systems which support recycling in some countries is the Container Deposit Legislation
(CDL) as presented in Table 15. The next section on Funding and Economic Instruments
discusses this system and others that can support the return of recyclable wastes.
At the time of this guidebook’s finalisation, a new partnership was launched by the SWIRE
Company to offer free shipping services for containers of recyclable wastes from Pacific island
countries to overseas markets. This partnership will certainly provide a great help to recycling
companies in the region.

61 | P a g e
CHAPTER 5
WASTE FINANCING MECHANISMS FOR
SUSTAINABLE MANAGEMENT OF WASTE IN
PICS
Contributors:
Container Deposit Levy by Selby Etibeck
Green Fee by Calvin Ikesiil
Prepaid Trash Bags by Roger Tary
Tipping Fee by Newal Naidu

62 | P a g e
5.0 FINANCING MECHANISMS FOR
SUSTAINABLE WASTE MANAGEMENT
IN PICs ______________________________________________________________________________ This chapter discusses some of the approaches and systems that can be used to support the
financing of waste management operations such as collection, recycling and disposal in Pacific
island countries.
5.1 ADVANCE DEPOSIT SYSTEMS (ADS) FOR
IMPORTED GOODS AND PRODUCTS
One of the waste financing approaches practiced in the region is the introduction of a Deposit
Levy on targeted imported goods and products with problematic waste generation once these are
consumed (e.g. tinned fish, canned drinks, etc.). There are different names used throughout the
world but the aims are similar – to promote the collection and shipping of these targeted items to
overseas markets.
5.1.1 Container Deposit Legislation (CDL) A CDL is a legislative tool used as an economic stimulant to encourage people to participate in
recycling by collecting and bringing to an assigned collection point(s) the targeted waste items for
shipping overseas. The main purpose of such law is to promote recycling activities and provide
incentives for citizens to take part in such activities. More importantly, it is an avenue to create
positive behavior towards environmental cleanliness and protection, as well as explore
alternatives to get rid of recycled waste apart from using landfills.
How a CDL System Works? When a CDL special Act or supporting regulation is in place, the list of approved and targeted
goods and products (mainly canned and bottled products and goods like tinned fish, tinned meat,
soft drinks and beer), including their approved levy rates, become the basis of a Customs
Agency`s work. The CDL programme in Kiribati and Palau also include other items, which are not
canned or bottled products (e.g. car batteries, etc.). When the listed items in the CDL programme
enter the country, the Customs Agency adds the approved deposited levy rates (e.g. 10 cents for
canned soft drinks, $5 for car batteries, etc.) on top of the usual import duties for payment by the
importers.
While the usual import duties from the imported goods and products are deposited into the
National Treasury Public Fund, the additional payments under the CDL are deposited into a
Special Fund created under the CDL Act or Regulations. The CDL sets special conditions on the
use of the Special Fund: it cannot be used to fund other government developments and daily
operations apart from the regulated and approved purposes e.g. payment for collecting,
processing and exporting of targeted waste items.

63 | P a g e
Existing Systems in PICs
There are similar CDL systems already in place in Kiribati, Palau and some states in the
Federated States of Micronesia.
Figure 7: Palau CDL System Chart
Planning of a CDL System
A CDL system requires thorough planning. It involves feasibility studies, development of
mechanisms to implement the programme, consultations with agencies and key stakeholders,
and enactment of a law and regulations. The feasibility study includes a survey of imported
goods, waste composition and generation rate. There has to be a full understanding of the above
in order to select target items to be included in the programme. A public opinion survey may also
complement the feasibility study.
Table 16 below highlights some key areas that need to be considered when planning a CDL
initiative. Studying and collecting information on these important aspects provide the basis for
planning of a CDL system, which can suit the conditions and situation of a country. This is very
important to ensure the success of a CDL programme during its implementation status.
There are some existing CDL initiatives that had been driven from the top and without proper
thorough investigations of the key highlighted aspects. During the implementation, the initiatives
faced lots of problems and difficulties.
Ministry of Finance
CustomsNational Treasury
Recycling Fund
Consumer
Beverage Distributers
Koror StateRedemption Center
TAX $0.10
per container
Pay
$0.05 per container
$0.025 per container
incrementsRefund
Center's operation cost
Finance of Koror state
Receipt
Issue Receipt
$0.025 per container
Deposite
Contracter(Recycle dealer)
Sale Proceeds
MPIIC
*Based on market price
Sell
Sell Sell
ShippingOut
$0.10*
per container
Import
* it is depend on shops if $0.10 is tacked on the price.
RECYCLING FUND DEPOSIT
$0.025 per container

64 | P a g e
Table 16: Key Areas of a Feasibility Study for a CDL
Example of Data Why is it needed
Import Data of targeted items
To understand the annual incoming quantities of targeted items. This gives a rough idea of the expected generating revenues from the CDL initiative on an annual basis.
Waste Generation Rate and Composition
Gives an idea of the consumption rate by people of the different targeted items, e.g. from one million imported tinned fish a year, how many of these are consumed by people a year.
Selling Prices of Targeted Items
To find out the selling price of the targeted items. Some shops charge more than others. The bars and hotel prices are higher than retail. This can identify the difference in the selling price of the targeted items of a CDL. This is important information for the setting of the CDL rate. It is important that the CDL rate must be lower than the existing price difference. For a coke can, if Shop A sells for $1, Shop B for $1.20, Bar C sells for $1.50 and Hotel D sells for $2.00, the difference at the retail level is 20 cents. For easier acceptance by people, it is good to set the CDL rate below the retail difference of 20 cents.
Institutional Capacity Assessment of Key Stakeholders
Check if the key agencies for implementing the CDL (Customs, Treasury, Waste Management Agency, Recycling companies, etc., have the resources, systems and facilities. Identify what needs to be put in place.
Public Opinion on the CDL initiative
Check people`s opinions on the proposed CDL and find out if they accept or not. What are their reasons?
Legality of the Proposed CDL
Check if there are appropriate legal provisions under the existing Waste Management or Environment Act for developing supporting regulations relevant to the CDL initiative. Check if setting up a Special Fund under Treasury for the CDL fund is supported by the existing Finance Act.
Capacity of Local Recycling Firms
Check if they have the capacity to support the system in terms of equipment, office procedures, overseas markets, etc.
Others Shipping companies, overseas markets, etc.
After gathering information, a law is then developed if there are no applicable legal provisions in the existing environment or waste management legislations. If there are legal provisions already in place in the current waste management or environment legislations, then the next task is to develop the supporting regulations. This important process is implemented in close collaboration with the Attorney Generals Office, Government Treasury and Customs Agencies to avoid problems in the implementation stage.
Redemption Center and its Operations Having a designated center for the collection of the recovered items from the public is an
important part of the system that must be established first. Options for this must be part of the
CDL Feasibility Study, e.g. using an existing recycling company and its facilities, government
agency facility, combination of private and government, etc.
The decision on who should operate the CDL will depend on the evaluation of their capacities.
The basic requirements of a redemption center(s) is to have the ability to receive and count
designated target items, pretreat/ compress and store received items, and maintain accurate
records of received items. The center(s) should also be able to handle a certain number of target
items based on baseline data collected from the initial feasibility study.

65 | P a g e
The Palau Redemption Center
Contracting out Exporting Duties
It should be the responsibility of the Redemption Center to pack and ship all redeemed containers
to an external market for final treatment. In the case of Palau, the redemption center is
government operated and the exporting duties are contracted out to a private recycler through a
bidding process. This is due to the fact that the private companies have more established
networks in the export business. In addition, local private recyclers should be involved as much
as possible to build up local capacity and further develop local recycling industries.
Monitoring, Evaluating and Improving the Programme
Monitoring is a crucial part of sustaining and improving a programme. In Palau, the maintenance,
updating, and reconciliation of CDL records involve agencies and private contractors. These
include comparing records of imported containers, associated deposit fees, redeemed containers,
disbursed refunds, sold and exported containers, and income from sold containers. Monitoring is
done on a monthly basis. It is also a requirement that reports are generated and financial audits
are undertaken annually. The programme should also be reviewed periodically to ensure its
effectiveness as well as to identify weaknesses for continuous improvements, and potential for
growth.
Key Players of the CDL System (Palau example) A CDL must provide details and information of the key and regulated players of the system and
how it is managed, implemented, reported and monitored. Table 17 is an example from Palau.
Table 17: Key Players for Palau's CDL
Name of Organisation Responsibility
Ministry of Public Infrastructure, Industries and Commerce (MPIIC)
Implementation of the recycling programme Approve and monitor redemption center(s) Export or find ways to export redeemed containers
Ministry of Finance (MOF) Management and maintenance of fund Monitoring of Fund Collection of deposit fee by the Customs Office under MOF
Koror State Government Operation of the Redemption Center

66 | P a g e
Key Lessons Learnt
Increasing quantities of the targeted waste items collected and shipped overseas
for recycling.
No littering problems from the targeted waste items.
Increasing funding available directly to support the collection and recycling of the
targeted items.
Way Forward Expanding the scope of CDL to cover other waste items including End of Life
Vehicles, e-waste, used lubricant oil, etc. Therefore the CDL must be changed to a
broader legislation such as the Advance Recycling Fees (ARF).
The same initiative can be used to effectively recover and collect other problematic
wastes for proper and safer management to prevent negative environmental
consequences – temporary storage, treatment (e.g. neutralisation for acids, etc.),
disposal in the country (e.g. plastic bottles, etc.) or overseas (e.g. used lubricant
oil, etc.).
In light of the above, an appropriate term for a similar CDL would be the Advance
Recycling and Disposal Fee to cover the true nature of the fund.
5.1.2 Green Fee (Palau case)
The Green Fee is similar to a CDL but, instead of imported goods and products, the Green Fee
covers visitors and travelers who enter Palau. This is similar to other levies like visitor tax, tourism
development levy, etc., which aim to promote tourism development.
How the Palau Green Fee System Works
Figure 8: Flow of Green Fee ($)
The Green Fee is a tax for environmental management purposes, which all non-Palauans must
pay together with the Departure Tax when paying for air tickets to Palau. In 2017, the
$100 Environmental Impact Fee was repealed and replaced with a US$100 Palau Visitor's Fee,
which will consist of the US$30 Green Fee, US$20 Departure Tax, and an additional US$50 to
be collected upon implementation on 1 April 2018. Under the current system (refer Figure 8
below), all non-Palauans entering Palau have to pay US$50 (Green Fee and Departure Tax)
together with the airfare ticket to overseas travel agents or the airlines (1 & 2). The US$30 Green
Fee is then paid by the airlines to the Palau National Treasury (3).
This Green Fee (GF) goes to a Protected Areas Network (PAN) Fund to support the management
of Marine Protected Areas (MPAs) and Terrestrial Conservation Areas (TCAs) registered under
Non-Palauan
Travellers
Overseas Travel
Agents
Airlines
Travelling to
Palau
National Treasury
PAN FUND
Same Fund is used to
deposit donations
(international,
regional and
individual)
Marine Protected
Areas (MPAs)
Terrestrial
Conservation Areas
(TCAs)
1 2 3
4
6
5

67 | P a g e
the PAN (4). The same fund is used to deposit donations from international and regional NGOs
including individuals who want to support the protection of Palau`s environment. The PAN Office
manages the disbursement of the fund to support the management of Marine Protected Areas
(MPAs) (5) and Terrestrial Conservation Areas (TCAs) (6) registered under the PAN. The
Financial Report 2016 recorded an annual collected Green Fee, apart from donations, of over
US$2million16.
Purpose of the Green Fee & Link to Waste Management While the Green Fee is to support the management of MPAs and TCAs, the funds can also
contribute to the management of wastes generated at these protected areas. Tourists visiting
parks and reserves generate waste (grey water, sewage, sludge and solid waste) through the use
of toilets, shower or hand washing facilities, rubbish bins and bags. These facilities need to be
regularly emptied, transported and disposed of properly at the official disposal facilities.
Therefore, this Green Fee contributes to the management of waste management to ensure the
cleanliness and healthiness of these areas in the long run.
As highlighted above, these are the underlying reasons of introducing the Green Fee:
The need to sustainably manage the Marine Protected Areas and Terrestrial
Conservation Areas (MPAs and TCAs) under the PAN network.
Lack of funding to upkeep these MPAs and TCAs.
Rising number of tourists and visitors and the need to cover for the services provided
and compensate for the impacts to the environment.
Lack of proper waste disposal facilities at these MPAs and TCAs.
Driving force or motive Strong support from the Government, States, land and resources owners.
High support from international organisations and individuals who have strong
interests in Palau`s environment and natural biodiversity.
Concern for the Palau`s environment and natural biodiversity (terrestrial and marine).
Promoting the User Pays & Polluter Pays Principles – for tourists and visitors to pay
for the services provided by Palau`s natural environment and resources and the
potential impacts they cause to the environment through the generated wastes, etc.
Shortage of Government Funds to support on-going maintenance at the facilities.
Keys for success: Political and community support.
Participation from the land and resource owners.
Transparency and accountability.
Proper systems and processes in place to manage the uses of the funds.
Operation of this fund outside of the government’s usual systems and control.
Good organisational structure to manage the use of the funds in line with its
objectives.
No political influence.
16 http://www.palaupanfund.org/pdf/annual-reports/2016-PAN-Annual-Report.pdf
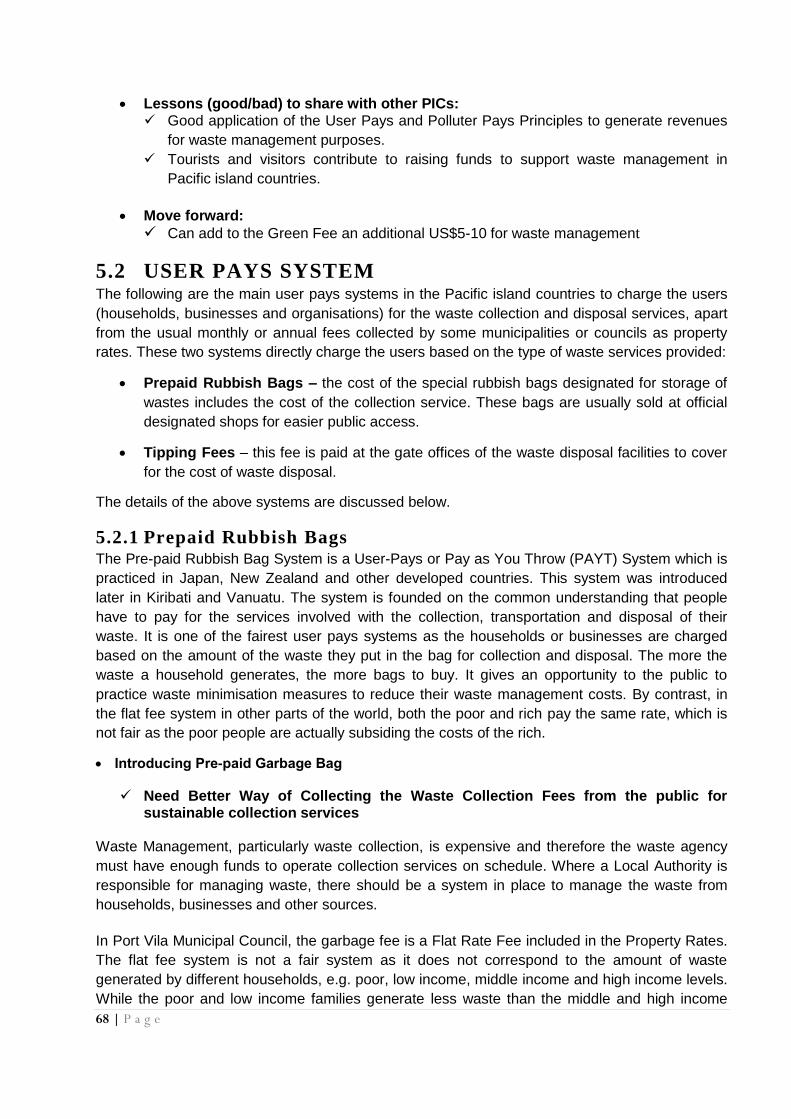
68 | P a g e
Lessons (good/bad) to share with other PICs: Good application of the User Pays and Polluter Pays Principles to generate revenues
for waste management purposes.
Tourists and visitors contribute to raising funds to support waste management in
Pacific island countries.
Move forward:
Can add to the Green Fee an additional US$5-10 for waste management
5.2 USER PAYS SYSTEM The following are the main user pays systems in the Pacific island countries to charge the users
(households, businesses and organisations) for the waste collection and disposal services, apart
from the usual monthly or annual fees collected by some municipalities or councils as property
rates. These two systems directly charge the users based on the type of waste services provided:
Prepaid Rubbish Bags – the cost of the special rubbish bags designated for storage of
wastes includes the cost of the collection service. These bags are usually sold at official
designated shops for easier public access.
Tipping Fees – this fee is paid at the gate offices of the waste disposal facilities to cover
for the cost of waste disposal.
The details of the above systems are discussed below.
5.2.1 Prepaid Rubbish Bags The Pre-paid Rubbish Bag System is a User-Pays or Pay as You Throw (PAYT) System which is
practiced in Japan, New Zealand and other developed countries. This system was introduced
later in Kiribati and Vanuatu. The system is founded on the common understanding that people
have to pay for the services involved with the collection, transportation and disposal of their
waste. It is one of the fairest user pays systems as the households or businesses are charged
based on the amount of the waste they put in the bag for collection and disposal. The more the
waste a household generates, the more bags to buy. It gives an opportunity to the public to
practice waste minimisation measures to reduce their waste management costs. By contrast, in
the flat fee system in other parts of the world, both the poor and rich pay the same rate, which is
not fair as the poor people are actually subsiding the costs of the rich.
Introducing Pre-paid Garbage Bag
Need Better Way of Collecting the Waste Collection Fees from the public for sustainable collection services
Waste Management, particularly waste collection, is expensive and therefore the waste agency
must have enough funds to operate collection services on schedule. Where a Local Authority is
responsible for managing waste, there should be a system in place to manage the waste from
households, businesses and other sources.
In Port Vila Municipal Council, the garbage fee is a Flat Rate Fee included in the Property Rates.
The flat fee system is not a fair system as it does not correspond to the amount of waste
generated by different households, e.g. poor, low income, middle income and high income levels.
While the poor and low income families generate less waste than the middle and high income

69 | P a g e
families, they are forced to pay the same fee under the flat rate system. This is too high for the
poor and low income families and thus the collection and recovery rates of these fees is always a
problem. When local rate payers cannot settle their dues, arrears can accumulate for years. This
makes it difficult for the agency or council to continue the collection services to meet demand.
A Standardised Storage System for Waste to Improve Collection Efficiency
Waste generators use different materials to discharge their waste. The use of plastic bags in
different sizes, bags of rice and flour, cardboard, local palm baskets, plastic rubbish bins, steel
drums, boxes, containers, stands, etc., is common. There is no regulation in place to control
waste storage and disposal at the source. Therefore, enforcing the use of the rubbish bag
improves efficiency, as it is easier for the collection workers to pick up the rubbish bags and load
them on the collection vehicles. In most cases, it is hard for the workers to collect and unload full
rubbish bins with waste being disposed directly in it without packing in plastic bags. The
enforcement of having rubbish bags solves this problem and improves the packing of waste at
the source before the bags are placed in the rubbish bins for collection. This is also the situation
with platforms and shelves with waste being not properly packed. It is time consuming for the
workers to collect loose waste items if they are not properly packed. The use of rubbish bags can
improve the efficiency of collection services.
The council should have a financial base for its SWM and a separate account for this money,
(collection fee, landfill tipping fees and other SWM fees).
The use of a Pre-paid Garbage Bag System often leads people to find out more. They want to
know why the council introduced the system, how much they are going to pay for the bag, or what
benefits they are going to receive, etc.
People also want to know how much money they have to pay for managing their waste. This
might help them to start reducing the rubbish they put inside the bag, hence reducing the amount
of waste ending up at the landfill.
Other impacts include the use of standard types of bag, which will improve cleanliness and efficiency at each collection point, making it easier for collectors. To get the system working successfully and to build confidence among the users, it is very important to conduct consultations and raise awareness. This should explain how the system works, how it benefits everyone, and how the charges are fair. In future, the SWM can introduce waste segregation at source and promote recycling. From experience, the following must be considered for such an initiative to be implemented:
- Price of the bag must be affordable to the public - The bag must be easily accessed throughout the country, e.g. shops and supermarkets - The bag must be strong and not overloaded beyond its carrying capacity.
Others
- Date and time of the collection service are printed on the bags - Contact information of the responsible agency, .g. Telephone numbers
- Carrying capacity of the bag is printed on the bag

70 | P a g e
Prepaid Rubbish Bags in Luganville, Vanuatu (left) and Kiribati (right)
How to set up a Prepaid System
After identifying all aspects during a Feasibility Study, the following can be used to start the
programme:
Issue a Public Tender for the Supply of the Prepaid Bags
- The documents must have all the information on the specifications of the prepaid bags –
size, type, details to be printed on the bags, how the waste collection fee must be paid to
the waste agency, schedule of the payment of the collection fees to the waste agency,
availability of the bags, etc.
- As part of the Tender, the interested bidders must indicate clearly the following which will
form the basis of the decision making
- Its tendered cost or selling price for the proposed prepaid bags if more than one size. This is going to be the price the members of the public will pay:
- Retailer price per bag, a bag of 10 rubbish bags and a box of 100 rubbish bags.
- Wholesale prices
E.g. $1 for one bag, $7 for 10 bags and $50 for a box of 100 Bags
- Its tendered commission or profit to take away from the selling price, e.g. $0.50.
- The tendered commission for the waste collection fee to be given to the government agency from the selling price, e.g. $0.50
These are the main selection criteria for deciding a supplier for the rubbish bags.
Lessons Learnt
- The selected supplier must have the capacity to supply an estimated amount of rubbish
bags for one year to prevent shortage.

71 | P a g e
- The waste agency must regularly confirm the available stocks to prevent any shortage.
- Suppliers might falsify documents to report wrong information in order to increase profit
from the system, e.g. a supplier might pay the waste agency an amount lower than the
actual sale of rubbish bags, fabricating receipts to back this up.
Way Forward
- Set up a Special Account at the National Treasury for the Prepaid Bags waste collection
fee to be deposited when the bags enter through Customs. For example, if $0.50 is the
agreed waste fee taken out from every rubbish bag as discussed above, then this amount
can be paid in advance and made available to the waste agency.
- The quantity of imported rubbish bags can be determined by measuring the weight of 100
imported bags and divide by 100 bags to find the weight of a single bag.
- Therefore any imported tons of rubbish bags can be divided by 100 bags in order to
determine the number of individual bags for estimating the advance deposit for the waste
collection fee. The following flow chart gives an example.
-
Supplier has to pay
At Customs the agreed
Commission for the Waste
Agency for the collection fees
Figure 9: Scenario for Improvement of Fees Collection form a Prepaid Bag Initiative
5.2.2 Tipping Fees
A Tipping fee is paid at the entrance or gate office of a waste disposal facility. The tipping fee is
based on the weight or volume of the disposed waste. Table 9 shows examples of tipping fees
without a weighing scale, based on the types of waste and size of the vehicles. Table 10 is based
on the tipping fee system at the Vunato Waste Landfill, Lautoka, Fiji, which uses the weight
measurement unit.
5 tons of the approved
rubbish bags enter the
country
CUSTOMS OFFICE 50,000 rubbish bags x $0.50
= $25,000
WASTE MANAGEMENT AGENCY Use the rubbish bags revenue to cover
operational costs for the collection services
If 100 bags are equal to 10kg then
5,000kg divide by 10kg = 500 lots of
100bags.
Therefore No. of Bags
= 500 x 100
= 50,000 rubbish bags
The deposited revenues are
transferred to an account
managed and administered by
the Waste Management
Agency

72 | P a g e
Table 18: Example of a Tipping Fee System based on Sizes or Capacities of Vehicles
Table 19: Example of Tipping Fee Rates at Lautoka, Fiji
A tipping fee system using the weighbridge is highly recommended as it gives more accurate
information of the actual amount of waste. Whatever system is used to charge the incoming
wastes, the most important thing is to have a tipping fee system that recovers some of the costs
incurred in the provision of waste landfill maintenance operations.
No. Category of Waste Tipping Fee (ST$)
1 General Solid Waste
Small Truck (less than 2 tons) 10
Medium Truck (4 – 6 tons) 20
Large Truck (10 ton truck). 30
2 Construction Waste
Small Truck (less than 2 tons) 20
Medium Truck (4 – 6 tons) 40
Large Truck (10 ton truck). 60
3 Expired Goods
Small Truck (less than 2 tons) 30
Medium Truck (4 – 6 tons) 60
Large Truck (10 ton truck). 90
No. Category of Waste Tipping Fee per Ton (FJ$)
Tipping Fee per Ton for Outside City Area (FJ$)
1 Household waste (collected by council contractors/private contractors)
23.00
32.00
2 Household waste - General
(individual resident and direct
haulage)
11.00
14.00
3 Market waste 11.00 12.00
4 Hotel waste 26.00 32.00
5 Other business waste/factory
waste general/Others
31.00 40.00
6 Green waste/Park waste/
drain/Street sweeping waste
11.00 14.00
7 Hospital ash 21.00 23.00
8 Condemned food 26.00 34.00
9 Special waste 46.00 57.00
10 Construction waste 26.00 34.00
11 Motor body/Shell 46.00 57.00
12 Weighbridge fees 21.00 23.00

73 | P a g e
CHAPTER 6
EMERGING ISSUES
Contributors
Resilience to Climate Change by Ma Bella Guinto
Post Disaster Waste Management by Roger Tary and Newal Naidu

74 | P a g e
6.0 EMERGING ISSUES ______________________________________________________________________________________
6.1 RESILIENCE TO CLIMATE CHANGE
6.1.1 Post Disaster Waste Management Disaster waste is a category of mixed waste experienced at one time, usually when a natural
disaster occurs such as a cyclone, flooding, tsunami or earthquake. These disasters can create
large volumes of waste or debris such as building rubble, soil and sediments, green waste,
personal property, ash and other waste. This can place additional burdens on a community
already struggling to cope with existing SWM.
Tsunami disaster waste in Samoa, 2009
Small Island Developing States are vulnerable to natural disasters such as cyclones, flooding,
tsunami or earthquakes. Pacific island countries face big challenges as there are no guidelines in
place to manage disaster waste and debris. Disasters generate huge quantities and a complex
mix of waste, which often overwhelm the local capacity to handle them. Disaster waste is an
important waste stream that should be taken into account in a post-disaster waste strategy.
Waste is often a low priority in Pacific island countries; therefore each country must develop a
strategic plan to manage disaster waste.
A disaster waste management plan can help to identify options for collecting, recycling and
disposing of disaster debris. Such a plan can also save valuable time and resources if it is
needed.
The benefits of putting a recovery plan in place before a disaster occurs include:
- Reducing time needed to identify options to manage disaster debris.
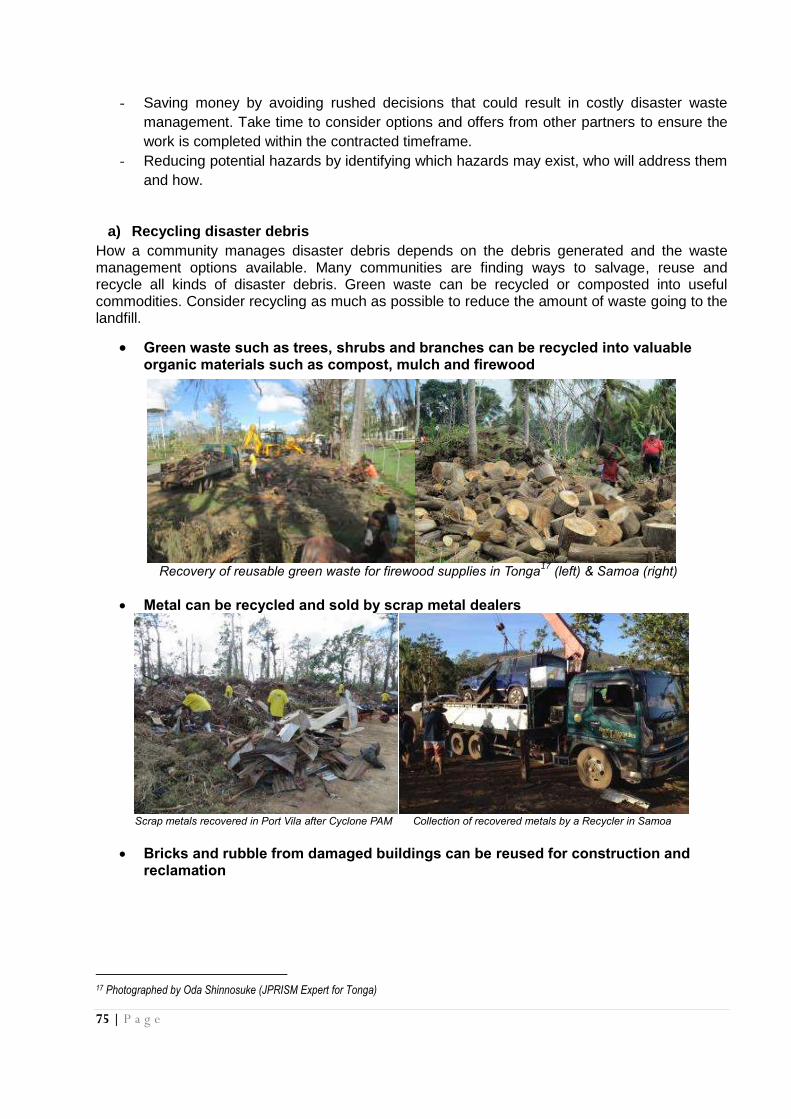
75 | P a g e
- Saving money by avoiding rushed decisions that could result in costly disaster waste
management. Take time to consider options and offers from other partners to ensure the
work is completed within the contracted timeframe.
- Reducing potential hazards by identifying which hazards may exist, who will address them
and how.
a) Recycling disaster debris
How a community manages disaster debris depends on the debris generated and the waste management options available. Many communities are finding ways to salvage, reuse and recycle all kinds of disaster debris. Green waste can be recycled or composted into useful commodities. Consider recycling as much as possible to reduce the amount of waste going to the landfill.
Green waste such as trees, shrubs and branches can be recycled into valuable organic materials such as compost, mulch and firewood
Recovery of reusable green waste for firewood supplies in Tonga
17 (left) & Samoa (right)
Metal can be recycled and sold by scrap metal dealers
Scrap metals recovered in Port Vila after Cyclone PAM Collection of recovered metals by a Recycler in Samoa
Bricks and rubble from damaged buildings can be reused for construction and reclamation
17 Photographed by Oda Shinnosuke (JPRISM Expert for Tonga)

76 | P a g e
Reused rubble at Bouffa Waste Landfill Affected area in Samoa after Tsunami, 2009
Some materials like timber and iron roofing can be reused by the communities
Recovered building materials for reuse in Samoa after the Tsunami in 2009
b) Benefits of recycling disaster debris include:
Recovering large amount of waste material for reuse.
Reducing the large volume of material in our landfill.
Saving money by avoiding disposal costs through re-sale of waste materials.
c) Temporary Disposal Site for Disaster Waste It is very important to identify a temporary disposal site for disaster debris. Disasters generate a
huge amount of complex waste and it is important to identify an area close to the vicinity of the
city or community, to speed the cleanup.
The temporary disposal site will provide a place to separate useful material for recycling
companies. Fallen trees can be re-used for firewood or timber for building.

77 | P a g e
A temporary Disposal Site (stockpile area) after flooding in Ba, Fiji, 2012
After flooding in Ba in 2012, disaster waste was disposed of in a temporary disposal site. A team
separated recyclable waste for recycling companies, and reusable waste for nearby communities.
After a disaster cleanup, the temporary disposal site should be returned to its original state.
6.1.2 Adaptation Measures The increasing frequency of cyclones and flooding has greatly affected waste disposal facilities in
many low lying Pacific island countries, due to the limited capacity to deal with the problem.
The Namara Waste Disposal Site in Labasa, Fiji is located in a mangrove area which is frequently
flooded, blocking access by rubbish trucks. There are many similar sites in Pacific island
countries with the same problem, as they are located in low lying areas such as mangroves and
swamps. It is hard to relocate due to the environmental damage already done, as well as the lack
of land for a new site.
Location of Namara Waste Landfill on a Mangrove area next to a River
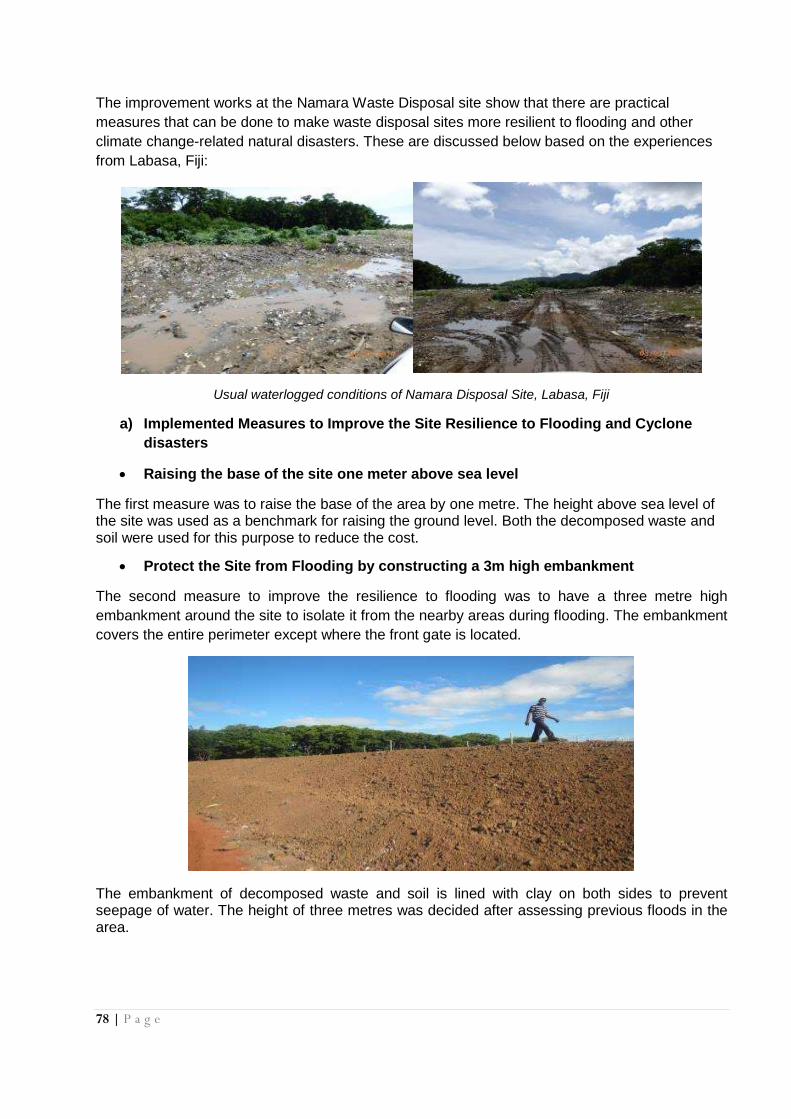
78 | P a g e
The improvement works at the Namara Waste Disposal site show that there are practical
measures that can be done to make waste disposal sites more resilient to flooding and other
climate change-related natural disasters. These are discussed below based on the experiences
from Labasa, Fiji:
Usual waterlogged conditions of Namara Disposal Site, Labasa, Fiji
a) Implemented Measures to Improve the Site Resilience to Flooding and Cyclone
disasters
Raising the base of the site one meter above sea level
The first measure was to raise the base of the area by one metre. The height above sea level of the site was used as a benchmark for raising the ground level. Both the decomposed waste and soil were used for this purpose to reduce the cost.
Protect the Site from Flooding by constructing a 3m high embankment
The second measure to improve the resilience to flooding was to have a three metre high
embankment around the site to isolate it from the nearby areas during flooding. The embankment
covers the entire perimeter except where the front gate is located.
The embankment of decomposed waste and soil is lined with clay on both sides to prevent seepage of water. The height of three metres was decided after assessing previous floods in the area.

79 | P a g e
Planting of the embankment with weeds to prevent erosion during heavy rains and
flooding
Planting of the lawn by waste pickers who offered their help for this initiative
Promoting the growth of weeds on the formed embankment is useful in stabilising the
embankment and protecting it from erosion during heavy rains. For this particular purpose, it is
important to select a weed species that can successfully grow fast to cover the entire
embankment.
Location of the access road on top of the surrounding embankment to ensure the
safety of incoming vehicles during flooding events
The new road located on top of the embankment
The location of the access road on top of the embankment allows the undisturbed flow of vehicles
and waste into the area for disposal even during heavy rains and flooding. The combined height
of the raised landfill base (1m) and the embankment (3m) places the new road four metres above
sea level. This protects the access road from regular flooding events during the rainy seasons,

80 | P a g e
Construction of a special Disaster Waste Cell for use as a temporary disposal area
during natural disasters. This ensures the readiness of the site in case it is needed
This special cell is for the temporary disposal of disaster waste to allow for segregation of
reusable and recyclable waste before the disposal of the remaining wastes to the final disposal
site.
Construction of the Gate Office to withstand a Category 4 Cyclone
New Gate Office constructed to withstand Cyclone at Category 4
Cyclones of Category 4 have affected Fiji in the past. The design of the gate office building to
withstand a Category 4 cyclone ensures the office functions during natural disasters.

81 | P a g e
Recent appearance of Namara Waste Landfill
These types of strategic measures are important for adaptation of waste disposal facilities to a
changing climate, and other Pacific island countries can adapt these measures to suit their
needs.

82 | P a g e
REFERENCES
Department of Environment & JICA. (2011). Waste Minimization and Recycling Promotion
Project: 3R Promotion Manual. Nadi, Fiji: Health Department, Nadi Town Council.
JICA & SPREP. (2009). Simple Manual for Operation and Maintenance at Sanitary Landfill. Apia,
Samoa: SPREP & JICA.
Kawakami., T., & That Khai., T. (2010). WARM: Work Adjustment for Recycling and Managing
Waste. Thailand: International Labour Organization.
Professor Matsufuji, Y., Dr. Hirano., F. (2004). A Road to Sanitary Landfill (Vol. 1). Japan:
Fukuoka City Environment Foundation.
SPREP & JICA. (2010). A Practical Guide to Landfill Management in Pacific Island Countries and
Territorities (2nd ed.). Apia, Samoa: SPREP & JICA.
That Khai., T., Jugault., V., Christensen., I., & Kawakami., T. (2006-2015). Work Adjustment for
Recycling and Managing Waste programme (WARM II): for informal economy workers
and the promotion of greener jobs. Bangkok, Thailand: ILO Regional office for Asia and
the Pacific.
World Health Organization. (1996). Guides for Municipal Solid Waste Management in Pacific
Island Countries. Malaysia: World Health Organization; Western Pacific Regional
Environmental Health Centre.

83 | P a g e
LIST OF ANNEXES
ANNEX I: Waste Generation and Composition Survey by Wendy Beti
ANNEX II: Time and Motion Study Procedures by Vivianne Morofa
ANNEX III: Public Opinion Survey by Faafetai Sagapolutele
ANNEX IV: Development of Solid Waste Management Plan by Shalend Singh
ANNEX V: Planning and Designing of Basic Waste Facilities by Faafetai Sagapolutele
ANNEX VI: Contract Management by Joshua Sam
ANNEX VII: Harmonisation of Waste Pickers by Joshua Sam
ANNEX VIII: Weighbridge Data Management by Shalend Singh
ANNEX IX: Tipping Fees by Newal Naidu
ANNEX X: Mulching and Chipping by Shalend Singh
ANNEX XI: Promoting Home Composting by Rouhit Singh
ANNEX XII: How to Make Home Composting by Lautoka City Council
ANNEX XIII: Market Composting Project by Roger Tary
ANNEX XIV: Recyclable Wastes Economic Case Study by Faafetai Sagapolutele

84 | P a g e
ANNEX I: WASTE GENERATION & COMPOSITION SURVEY
PROCEDURES Case Study – Honiara, Solomon Islands
Produced by Wendy Beti (Edited by Faafetai Sagapolutele)
1. Select a target area for the survey implementation.
2. Randomly select a number of households within the target area (for domestic waste) or businesses (for commercial waste). Refer to WHO Waste Guide (1996) for further readings.
3. The total sampling population size will be within the range of 80 to 100 or more. For a peri-urban or rural setting, there are no income level areas as most income level groups are residing within a particular location or area, thus a sampling size of 20 to 25 per area is relevant to provide a good representation of the total population.
4. Design a simple questionnaire for the survey and use it to gather other information from the selected households or businesses.
5. Visit the selected household and discuss the purpose of the survey. Advise all selected households to keep their waste at home for the survey team to pick up during the period of the survey. Failing to do this can affect the survey if some household wastes are picked up by the existing collection service in the survey area. Also inform them not to put waste from previous days, including waste already disposed of in backyards, but only new waste generated within 24 hours from the scheduled first survey collection. Strongly encourage use of the survey bags to put their new waste in, and place them at the front of their houses before going to work if no one stays home.
Photo 1: Visit to households to discuss the survey and ask for support and participation
6. Give eight trash bags to all the selected households for the survey. Label the bags to distinguish different households (e.g. H1 corresponds to Household No.1, etc.) to avoid mixing during later assessments and analysis. Giving all the trash bags during the first visit is recommended if requested by the households especially for working families. Otherwise, give one bag each to all the selected survey households during the first visit, with the other seven to be given when collecting the bags.
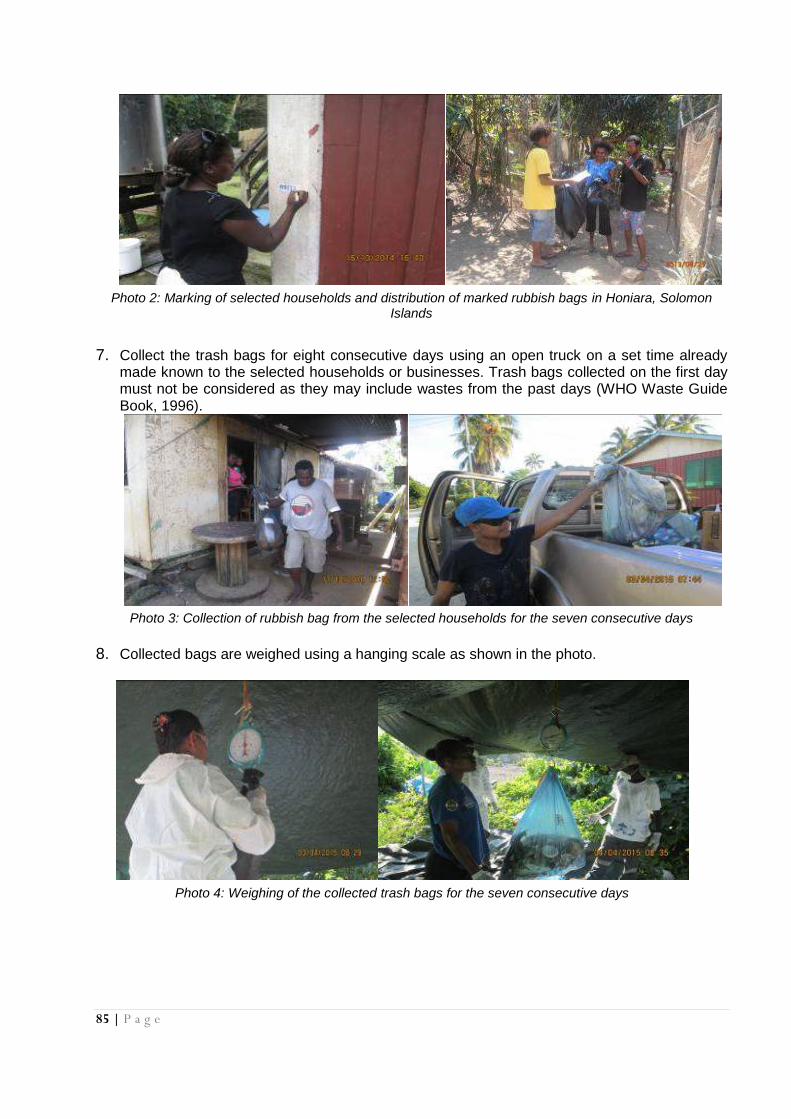
85 | P a g e
Photo 2: Marking of selected households and distribution of marked rubbish bags in Honiara, Solomon Islands
7. Collect the trash bags for eight consecutive days using an open truck on a set time already made known to the selected households or businesses. Trash bags collected on the first day must not be considered as they may include wastes from the past days (WHO Waste Guide Book, 1996).
Photo 3: Collection of rubbish bag from the selected households for the seven consecutive days
8. Collected bags are weighed using a hanging scale as shown in the photo.
Photo 4: Weighing of the collected trash bags for the seven consecutive days

86 | P a g e
Table 1: Example of a Simple Daily Recording Sheet for Waste Audit Survey
HOUSEHOLDS WASTE RECORDING SHEET
STARTING DATE:
LAST DATE:
Household
No.
No. of
People
1st
(kg)
2nd
(kg)
3rd
(kg)
4th
(kg)
5th
(kg)
6th
(kg)
7th
(kg)
Weekly
Individual
Waste
(WIW)
1 9 16 12 11.5 9.7 8.5 10 13 80.7
2 7 11 9.8 10 7.5 10.5 11 9 68.8
3 8 9 8 6 7 7 9 10 56
4 7 7 8 7 6 7 6 9 50
5 6 8 8 9 6 7 7 8 53
37 51 45.8 43.5 36.2 40 43 49 308.5
(TW)
N.B: This is just an example for illustration purposes.
9. To calculate the Average Daily Waste (ADW) = Total Waste (TW) 7 Days = 3085 kg 7 = 44 kg
10. To calculate the Daily Waste per Person
= Average Daily Waste No. of People in the Surveyed Households = 44 kg 37 people = 1.1 kg per person per day Waste Generation Rate = 1.1 kg per person per day
a) WASTE DENSITY ASSESSMENT
Simple Steps to Do (following the assessment of Daily Waste Generation) 1. After weighing the collected bags for determining waste generation, empty the contents of the
bags in a container (60L, 80L, 100L or 120L plastic bucket). There are many plastic containers available in different sizes which can be used as long as the size is known. Using more containers of the same size would speed up this assessment. Continue emptying the bags into the containers until all the collected bags are completed.

87 | P a g e
Photo 5: Measuring the density of the waste by transferring all the collected waste into a bin
When emptying the waste into the bin, waste has to be pushed down firmly to avoid space created until it is filled up. The number of full bins is recorded on a daily basis during the seven days period (as required for the DGR calculation) and WD calculation is then calculated as: Waste Volume (m3) = Number of Full Bins on Day1 (NFBD1) + NFBD2 ….NFBD7 = Number of Full Bins (Day 1- Day 7) x Size of the Bin used Example:
= 9 bins + 7 bins + 10 bins + 6 bins + 7 bins + 10 bins + 8 bins = 57 bins x 120 Litres = 6,840 Litres
= 6.84m3 (1m3 = 1,000 Litres) Waste Weight (Kg) Refer to the recorded weight measurements from Day1 to Day7 to obtain the Total Weight of the Waste (TW) Then, DENSITY = Total Weight (kg) Total Volume (L) Note: An alternative option is to randomly select bags for this exercise. For this particular option, the weight of the randomly selected bags must be used. The total weight of selected bags is divided by the total number of full bins filled by these selected bags. This is highly recommended for a large survey, which may take time to go through the entire collected waste (refer further readings – WHO Waste Guide, 1996).
b) WASTE COMPOSITION PROCEDURES
1. Spread a tarpaulin (4m x 4m) flat on level ground to be used for this assessment exercise.
Photo 6: Tarpaulin being placed on level ground for easier assessment of the waste
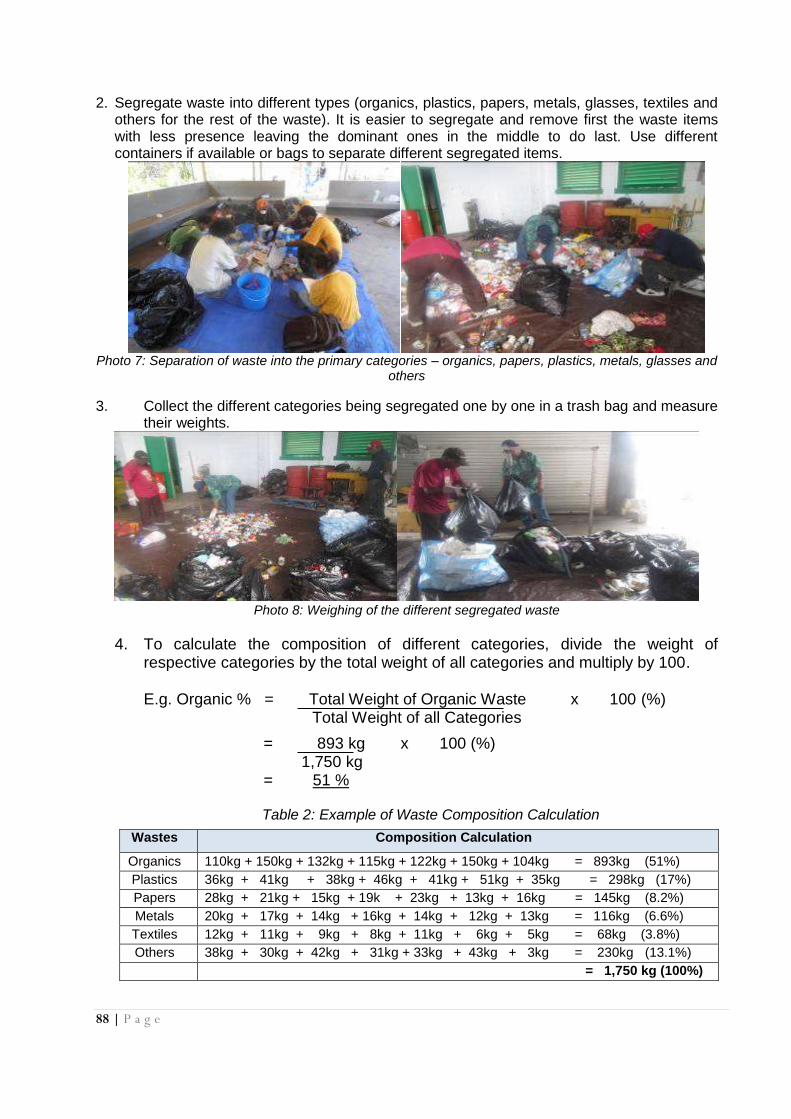
88 | P a g e
2. Segregate waste into different types (organics, plastics, papers, metals, glasses, textiles and others for the rest of the waste). It is easier to segregate and remove first the waste items with less presence leaving the dominant ones in the middle to do last. Use different containers if available or bags to separate different segregated items.
Photo 7: Separation of waste into the primary categories – organics, papers, plastics, metals, glasses and
others
3. Collect the different categories being segregated one by one in a trash bag and measure their weights.
Photo 8: Weighing of the different segregated waste
4. To calculate the composition of different categories, divide the weight of respective categories by the total weight of all categories and multiply by 100.
E.g. Organic % = Total Weight of Organic Waste x 100 (%) Total Weight of all Categories
= 893 kg x 100 (%) 1,750 kg = 51 %
Table 2: Example of Waste Composition Calculation
Wastes Composition Calculation
Organics 110kg + 150kg + 132kg + 115kg + 122kg + 150kg + 104kg = 893kg (51%)
Plastics 36kg + 41kg + 38kg + 46kg + 41kg + 51kg + 35kg = 298kg (17%)
Papers 28kg + 21kg + 15kg + 19k + 23kg + 13kg + 16kg = 145kg (8.2%)
Metals 20kg + 17kg + 14kg + 16kg + 14kg + 12kg + 13kg = 116kg (6.6%)
Textiles 12kg + 11kg + 9kg + 8kg + 11kg + 6kg + 5kg = 68kg (3.8%)
Others 38kg + 30kg + 42kg + 31kg + 33kg + 43kg + 3kg = 230kg (13.1%)
= 1,750 kg (100%)

89 | P a g e
KEY TIPS WHEN PLANNING AND IMPLEMENTING A WASTE AUDIT:
a) Survey Questionnaire Develop a questionnaire to provide the following information to understand the nature of the generated and collected waste during the seven-day assessment. If well designed, it can gather additional information for general waste management planning purposes. The questionnaire must be in the local language, be simple to fill and must ask for the following information:
Name of the household (owner/occupier of a house)
Contact Telephone / Email (Important for follow up queries if needed)
Number of people living in the house including the period of the assessment
Waste Weekly estimate (estimate number of full rubbish bags or bins put out for collection or disposal)
Weekly Diet: e.g. taro, banana, rice, fresh fish, chicken, etc.
Number of Employed Members of the family
Type of House (Fully furnished European house/Traditional house/Open house, etc.
Collection Service Frequency if available
How to dispose of the generated waste (if no collection services / poor collection)
b) Clear Definition of Waste It is important to inform households of the purpose of the survey - to assess what they generate and put out for collection and disposal and must not include what they normally use for other purposes like daily animal feed, reuse, mulching or composting. This is important in making accurate estimates of the generated waste requiring proper management. c) Avoid using the survey as a means for cleaning up From past experience, some households use the survey to clean up their houses and backyards.
d) Categories for Waste Composition It is highly recommended to use the basic primary composition – organics, plastics, papers, metals, glasses, textiles and others during waste composition assessment for comparison of generated data with other communities, areas and countries. The secondary composition where the above categories are further broken down to separate categories (e.g. Plastics – PET bottles, PE bottles, shopping bags, papers, etc.) depends on the purpose of the survey, e.g. identification of potential items for recycling and waste minimisation initiatives, etc.
e) Division of Sampling Area in line with Income level The division of sampling area is in line with the income level of residential areas into three categories, namely; Low Income Areas, Medium Income Areas and High Income Areas. In order to identify such areas, consult with Local Municipal Authorities and obtain a map of the sampling areas. The division of sampling areas is not relevant for most peri-urban areas in some particular countries but can be for other countries.
(f) Timing of Survey This survey must be conducted every 1-3 years (WHO, 1996). It is highly recommended for this survey to be carried out before the renewal of any contracted waste collection and disposal services. The information and data collected are vital in determining and finalising details for incorporating any improvements to the new collection and disposal services.
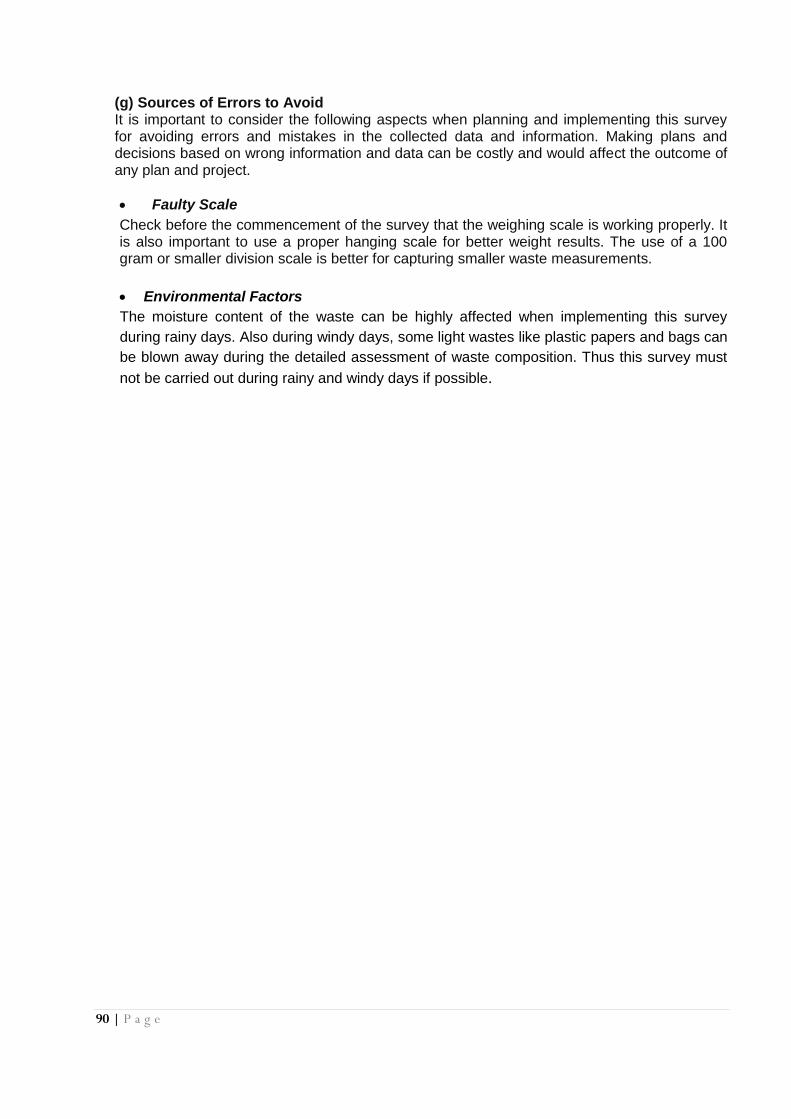
90 | P a g e
(g) Sources of Errors to Avoid It is important to consider the following aspects when planning and implementing this survey for avoiding errors and mistakes in the collected data and information. Making plans and decisions based on wrong information and data can be costly and would affect the outcome of any plan and project.
Faulty Scale
Check before the commencement of the survey that the weighing scale is working properly. It is also important to use a proper hanging scale for better weight results. The use of a 100 gram or smaller division scale is better for capturing smaller waste measurements.
Environmental Factors
The moisture content of the waste can be highly affected when implementing this survey
during rainy days. Also during windy days, some light wastes like plastic papers and bags can
be blown away during the detailed assessment of waste composition. Thus this survey must
not be carried out during rainy and windy days if possible.

91 | P a g e
ANNEX II: TIME AND MOTION STUDY PROCEDURES Case Study – Port Moresby, Papua New Guinea
By Vivianne Morofa (Edited by Faafetai Sagapolutele)
1. Use a separate vehicle to follow a rubbish truck during a scheduled collection day. It
may take one or more truckloads to complete an area. It is important for this study to observe every move involved right from the departure of the truck from its garage to the time the truck is garaged again. Four staff are recommended for effectively implementing this study in performing the following tasks:
- One to observe and mark the route taken by the collection service on a map. - One to record the time taken to carry out the collection service beginning from the time
the truck leaves its garaging compound until it garages again at the end of service. - One to record the types and number of waste receptacles at pickup points. - One to observe the behavior of the collection crew during the service and make notes.
Photo 1: Survey Crew in a separate vehicle with one in the rubbish truck cabin to mark the collection route
2. The survey team must have a map to mark the actual route taken during the service.
Photo 2: Maps of Port Moresby with a Detailed Collection Map of the Collection Routes
Identify the location of the start and finish points of the service (trucks garage site) and the waste disposal site before the survey. Performing a trial run to understand and know well the collection route before the survey is important. This task is recommended for someone who understands how to read maps and is familiar with the road network.
3. The survey team must record the time taken for all the actions involved during the
collection service using a simple Time Sheet. Key actions to note are – stop and departure times of the truck when collecting waste from the pickup points, unloading of the truckloads at
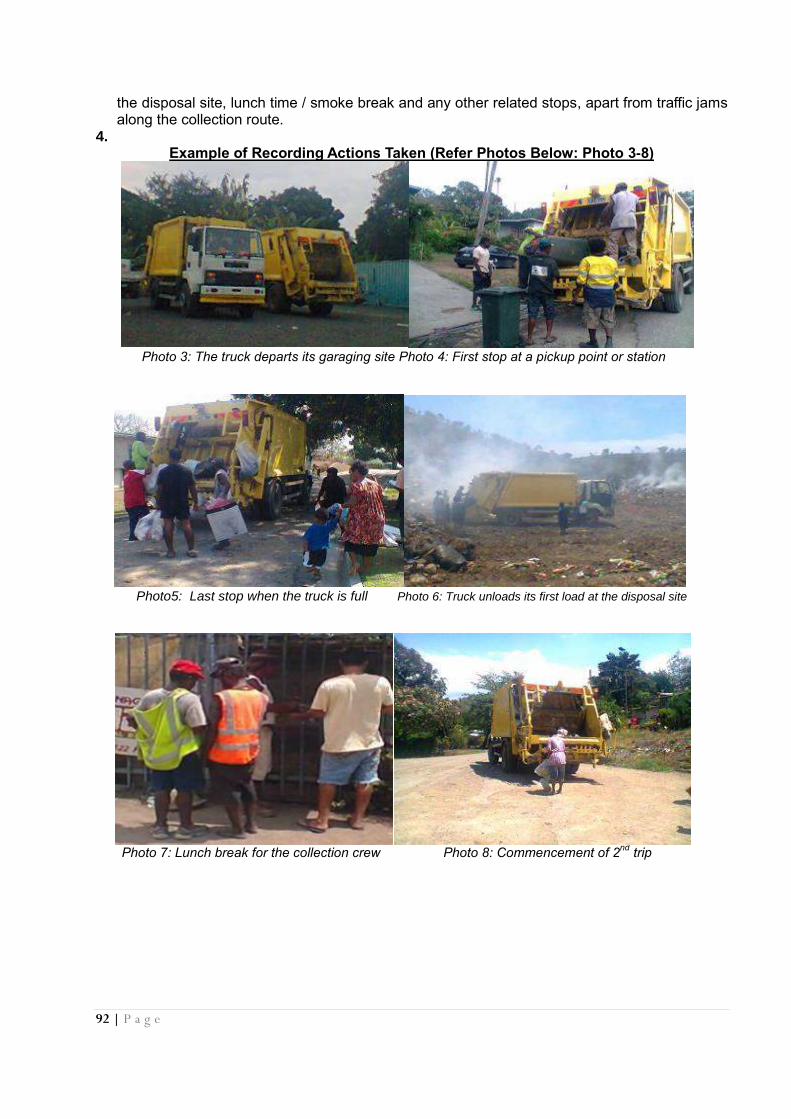
92 | P a g e
the disposal site, lunch time / smoke break and any other related stops, apart from traffic jams along the collection route.
4. Example of Recording Actions Taken (Refer Photos Below: Photo 3-8)
Photo 3: The truck departs its garaging site Photo 4: First stop at a pickup point or station
Photo5: Last stop when the truck is full Photo 6: Truck unloads its first load at the disposal site
Photo 7: Lunch break for the collection crew Photo 8: Commencement of 2
nd trip
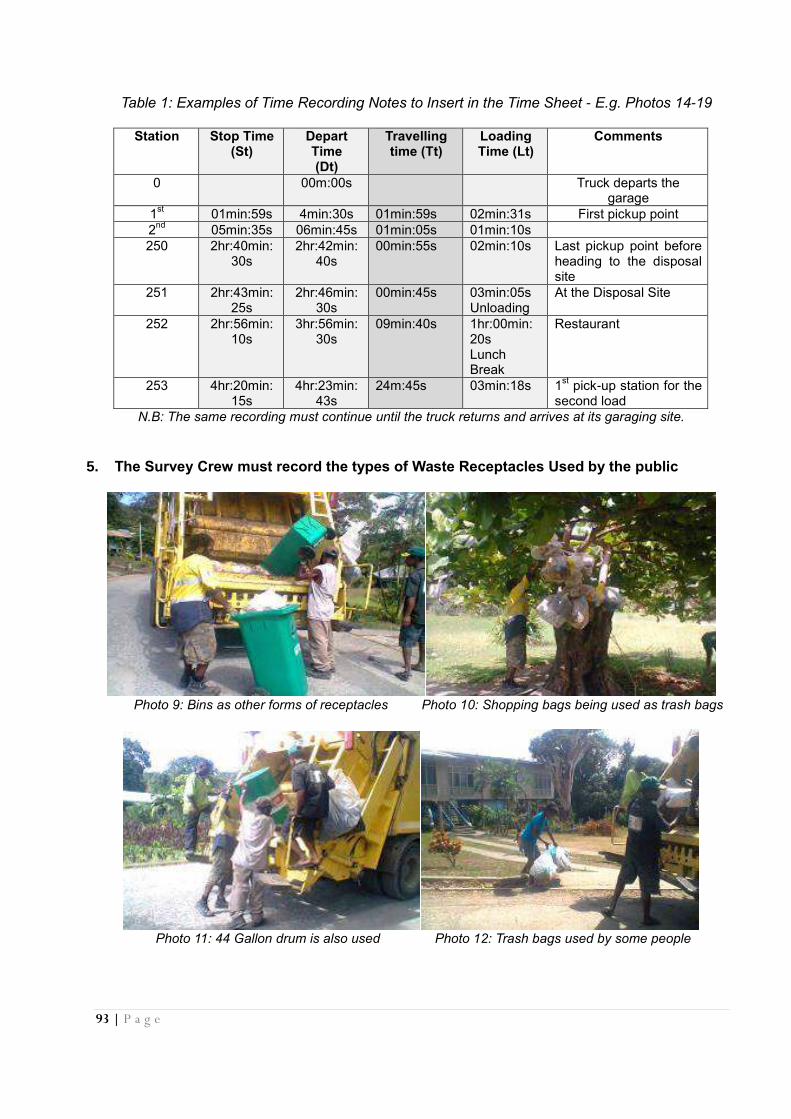
93 | P a g e
Table 1: Examples of Time Recording Notes to Insert in the Time Sheet - E.g. Photos 14-19
Station Stop Time (St)
Depart Time (Dt)
Travelling time (Tt)
Loading Time (Lt)
Comments
0 00m:00s Truck departs the garage
1st 01min:59s 4min:30s 01min:59s 02min:31s First pickup point
2nd
05min:35s 06min:45s 01min:05s 01min:10s
250 2hr:40min: 30s
2hr:42min: 40s
00min:55s 02min:10s Last pickup point before heading to the disposal site
251 2hr:43min: 25s
2hr:46min: 30s
00min:45s 03min:05s Unloading
At the Disposal Site
252 2hr:56min: 10s
3hr:56min: 30s
09min:40s 1hr:00min: 20s Lunch Break
Restaurant
253 4hr:20min: 15s
4hr:23min: 43s
24m:45s 03min:18s 1st pick-up station for the
second load
N.B: The same recording must continue until the truck returns and arrives at its garaging site.
5. The Survey Crew must record the types of Waste Receptacles Used by the public
Photo 9: Bins as other forms of receptacles Photo 10: Shopping bags being used as trash bags
Photo 11: 44 Gallon drum is also used Photo 12: Trash bags used by some people
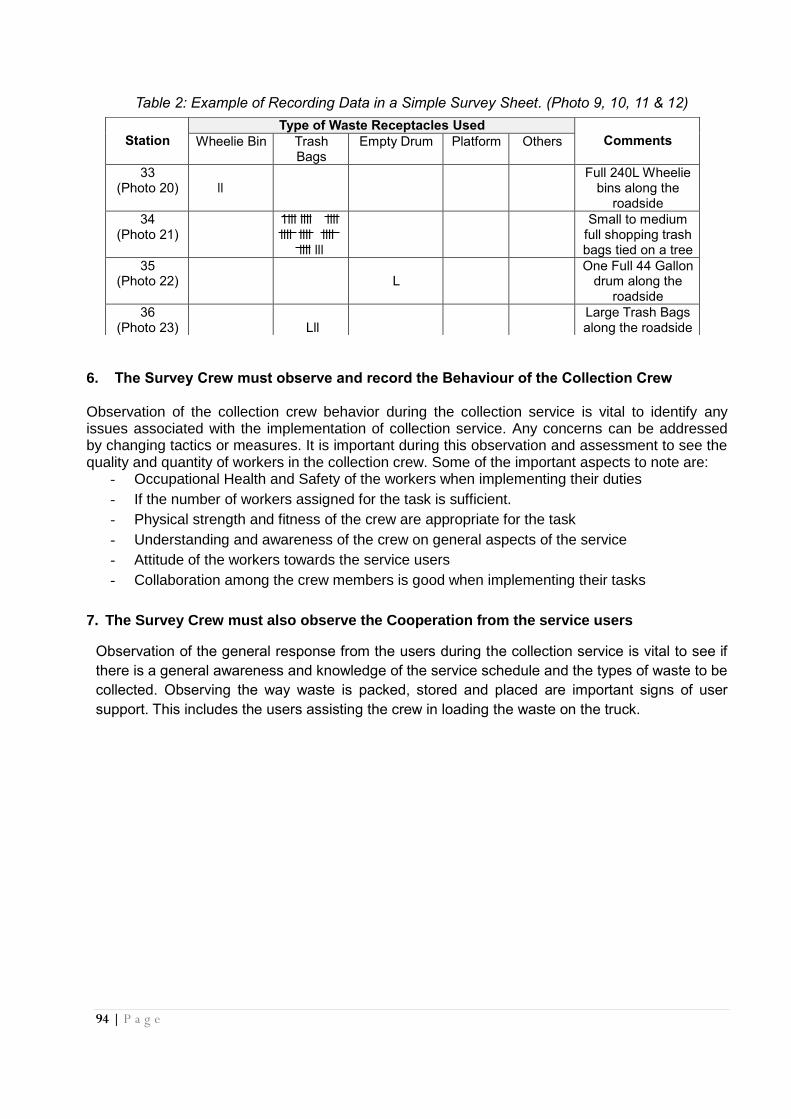
94 | P a g e
Table 2: Example of Recording Data in a Simple Survey Sheet. (Photo 9, 10, 11 & 12)
6. The Survey Crew must observe and record the Behaviour of the Collection Crew
Observation of the collection crew behavior during the collection service is vital to identify any issues associated with the implementation of collection service. Any concerns can be addressed by changing tactics or measures. It is important during this observation and assessment to see the quality and quantity of workers in the collection crew. Some of the important aspects to note are:
- Occupational Health and Safety of the workers when implementing their duties
- If the number of workers assigned for the task is sufficient.
- Physical strength and fitness of the crew are appropriate for the task
- Understanding and awareness of the crew on general aspects of the service
- Attitude of the workers towards the service users
- Collaboration among the crew members is good when implementing their tasks
7. The Survey Crew must also observe the Cooperation from the service users
Observation of the general response from the users during the collection service is vital to see if
there is a general awareness and knowledge of the service schedule and the types of waste to be
collected. Observing the way waste is packed, stored and placed are important signs of user
support. This includes the users assisting the crew in loading the waste on the truck.
Station
Type of Waste Receptacles Used Comments Wheelie Bin Trash
Bags Empty Drum Platform Others
33 (Photo 20)
ll
Full 240L Wheelie bins along the
roadside
34 (Photo 21)
1lll llll llll llll llll llll
llll lll
Small to medium full shopping trash bags tied on a tree
35 (Photo 22)
L
One Full 44 Gallon drum along the
roadside
36 (Photo 23)
Lll
Large Trash Bags along the roadside
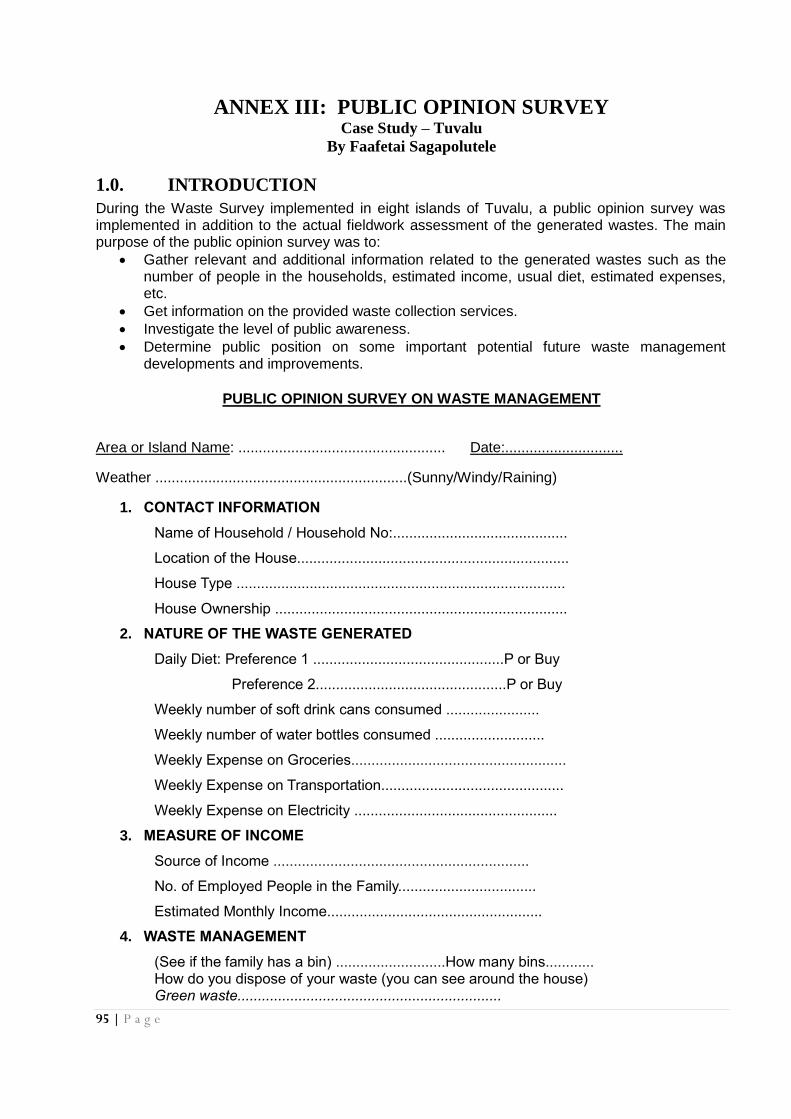
95 | P a g e
ANNEX III: PUBLIC OPINION SURVEY Case Study – Tuvalu
By Faafetai Sagapolutele
1.0. INTRODUCTION
During the Waste Survey implemented in eight islands of Tuvalu, a public opinion survey was implemented in addition to the actual fieldwork assessment of the generated wastes. The main purpose of the public opinion survey was to:
Gather relevant and additional information related to the generated wastes such as the number of people in the households, estimated income, usual diet, estimated expenses, etc.
Get information on the provided waste collection services.
Investigate the level of public awareness.
Determine public position on some important potential future waste management developments and improvements.
PUBLIC OPINION SURVEY ON WASTE MANAGEMENT
Area or Island Name: ................................................... Date:.............................
Weather ..............................................................(Sunny/Windy/Raining)
1. CONTACT INFORMATION
Name of Household / Household No:...........................................
Location of the House...................................................................
House Type .................................................................................
House Ownership ........................................................................
2. NATURE OF THE WASTE GENERATED
Daily Diet: Preference 1 ...............................................P or Buy
Preference 2...............................................P or Buy
Weekly number of soft drink cans consumed .......................
Weekly number of water bottles consumed ...........................
Weekly Expense on Groceries.....................................................
Weekly Expense on Transportation.............................................
Weekly Expense on Electricity ..................................................
3. MEASURE OF INCOME
Source of Income ...............................................................
No. of Employed People in the Family..................................
Estimated Monthly Income.....................................................
4. WASTE MANAGEMENT
(See if the family has a bin) ...........................How many bins............ How do you dispose of your waste (you can see around the house) Green waste.................................................................
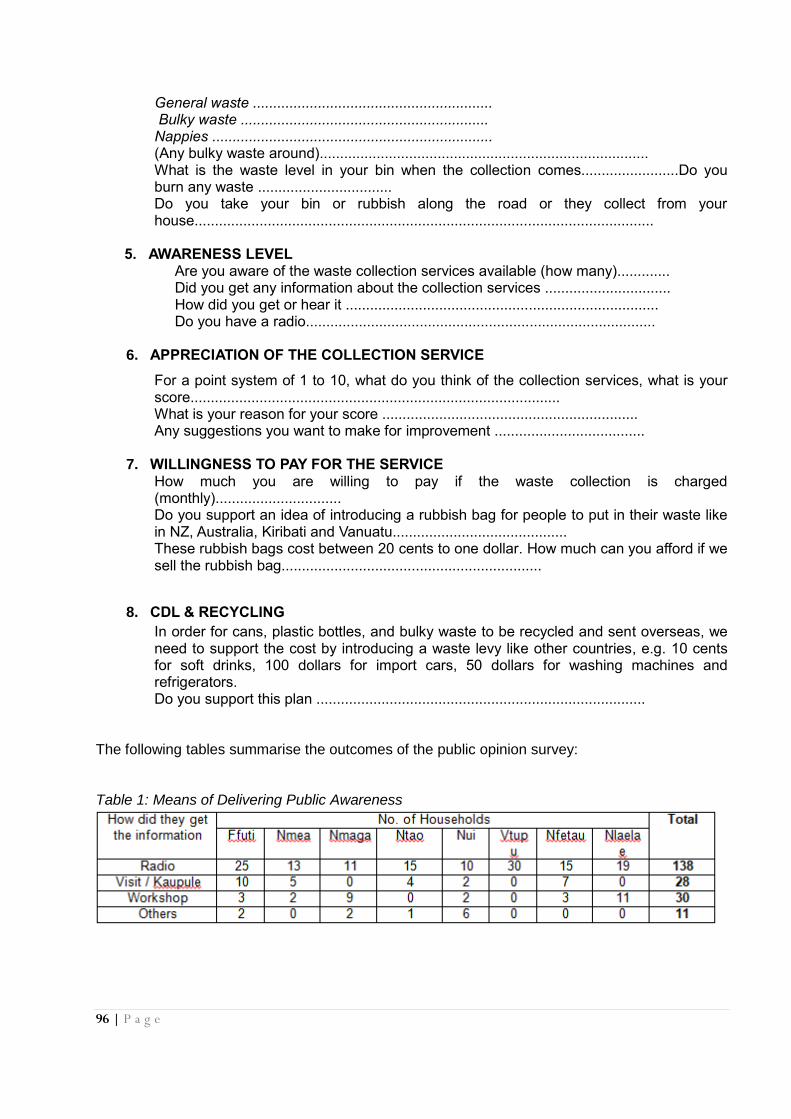
96 | P a g e
General waste ........................................................... Bulky waste ............................................................. Nappies ..................................................................... (Any bulky waste around)................................................................................. What is the waste level in your bin when the collection comes........................Do you burn any waste ................................. Do you take your bin or rubbish along the road or they collect from your house.................................................................................................................
5. AWARENESS LEVEL Are you aware of the waste collection services available (how many)............. Did you get any information about the collection services ............................... How did you get or hear it ............................................................................. Do you have a radio......................................................................................
6. APPRECIATION OF THE COLLECTION SERVICE
For a point system of 1 to 10, what do you think of the collection services, what is your score........................................................................................... What is your reason for your score ............................................................... Any suggestions you want to make for improvement .....................................
7. WILLINGNESS TO PAY FOR THE SERVICE How much you are willing to pay if the waste collection is charged (monthly)............................... Do you support an idea of introducing a rubbish bag for people to put in their waste like in NZ, Australia, Kiribati and Vanuatu........................................... These rubbish bags cost between 20 cents to one dollar. How much can you afford if we sell the rubbish bag................................................................
8. CDL & RECYCLING
In order for cans, plastic bottles, and bulky waste to be recycled and sent overseas, we need to support the cost by introducing a waste levy like other countries, e.g. 10 cents for soft drinks, 100 dollars for import cars, 50 dollars for washing machines and refrigerators. Do you support this plan .................................................................................
The following tables summarise the outcomes of the public opinion survey:
Table 1: Means of Delivering Public Awareness
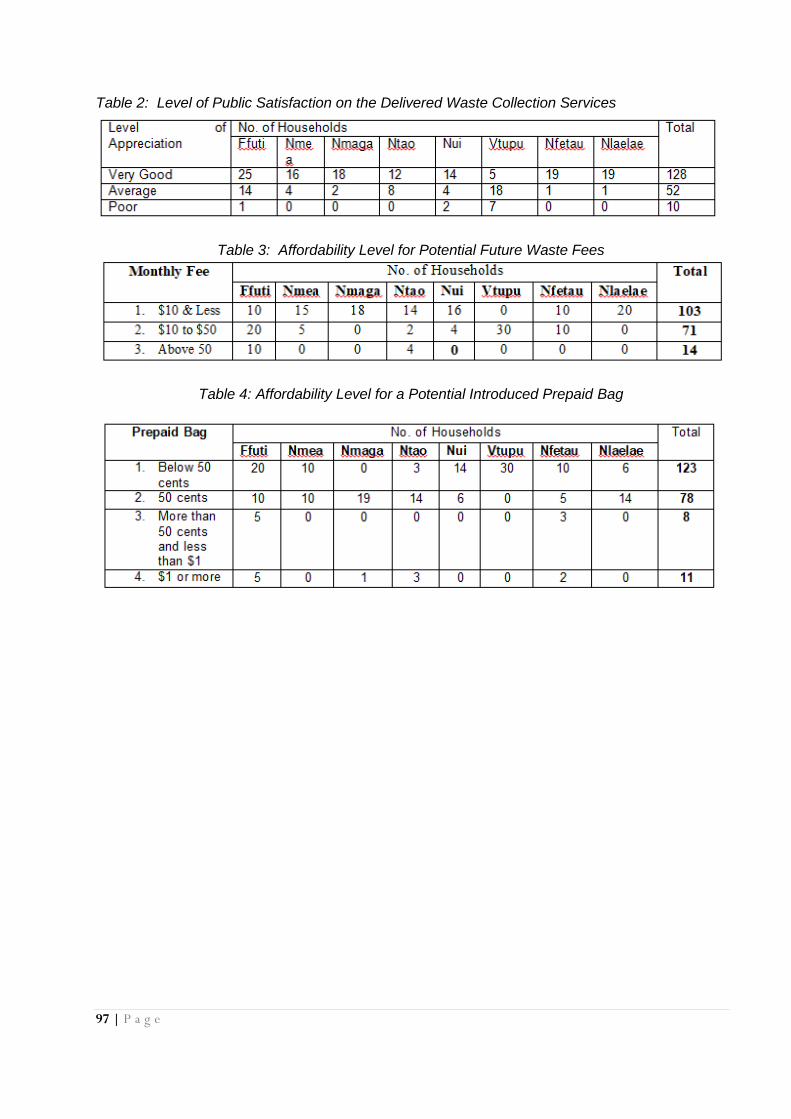
97 | P a g e
Table 2: Level of Public Satisfaction on the Delivered Waste Collection Services
Table 3: Affordability Level for Potential Future Waste Fees
Table 4: Affordability Level for a Potential Introduced Prepaid Bag

98 | P a g e
ANNEX IV: DEVELOPMENT OF SOLID WASTE
MANAGEMENT PLAN Case Study – Lautoka, Fiji
By Shalend Singh (Edited by Ma Bella Guinto)
a) Background Fiji with a population of over 835,230 (2007 Census) largely depends on the importation of goods and materials from developed countries. Urbanisation, economic development (growth in tourism, commerce and industry), population growth and changes in consumption patterns, all contributed to increasing quantities of solid wastes in Fiji. Due to its geographical isolation and relatively small recycling market, it is very difficult to recycle waste in Fiji. In addition, finding suitable landfill sites is quite difficult considering land issues like customary rights over the use of land and reluctance by landowners to lease land for use as disposal sites due to the fear of negative environmental, social and economic impacts. Lautoka is the second largest city in Fiji with a population estimated at 44,000 in 2008. The Lautoka City Council was very concerned with solid waste generation and the potential to cause negative impacts on the fragile environment, tourism, trade, economy, social conditions, public health, water quality, and on the existing limited resources. The council was already implementing various cleaning services which included garbage collection, green and bulky waste collection on a user pays basis, grass cutting/drain cleaning, street sweeping, market/bus terminal/public convenience cleaning, etc.
The Vunato Disposal Site was operated through controlled open dumping with unregulated scavenging of waste, pollution of the coastal water from leachate, frequent fires, vector breeding, public health nuisancem etc. Only one old bulldozer was available for landfill operation and required regular maintenance work.
Awareness activities were not well-structured, with outdated education materials. Open burning of wastes was a common practice contributing to a public health nuisance and emission of greenhouse gases. Littering of wastes in public places and creeks/drains, illegal disposal sites and backyard accumulation of wastes were also very evident.
There was legislation regulating solid waste issues such as the Environment Management Act, Open Fire By-Laws, Garbage By-Laws, Public Health Act Cap 111, etc., but enforcement and monitoring was weak.
There was no recycling facility to process and recycle waste in Lautoka. Recycling companies were not interested in dealing with a range of recyclable items. This was a major drawback towards any recycling initiative since there was seemingly negligible or no rewards for potentially recyclable items. This also contributed to a low recycling rate.
Problems identified
While the council was providing major cleaning services, the following problems or issues were
identified which needed to be addressed to improve SWM:
Baseline surveys were not conducted on SWM issues due to lack of capacity to undertake the survey. Hence, council did not hold baseline data (waste generation and disposal rates, waste composition, waste diversion and/or recycling rates, etc.) or information on collection system, frequency, collection routes, type of collection vehicle, type of wastes collected, collection efficiency, occupational health and safety in waste management and other cleaning services. The lack of data did not allow council to develop the waste flow from generation, collection, treatment, recycling and disposal.
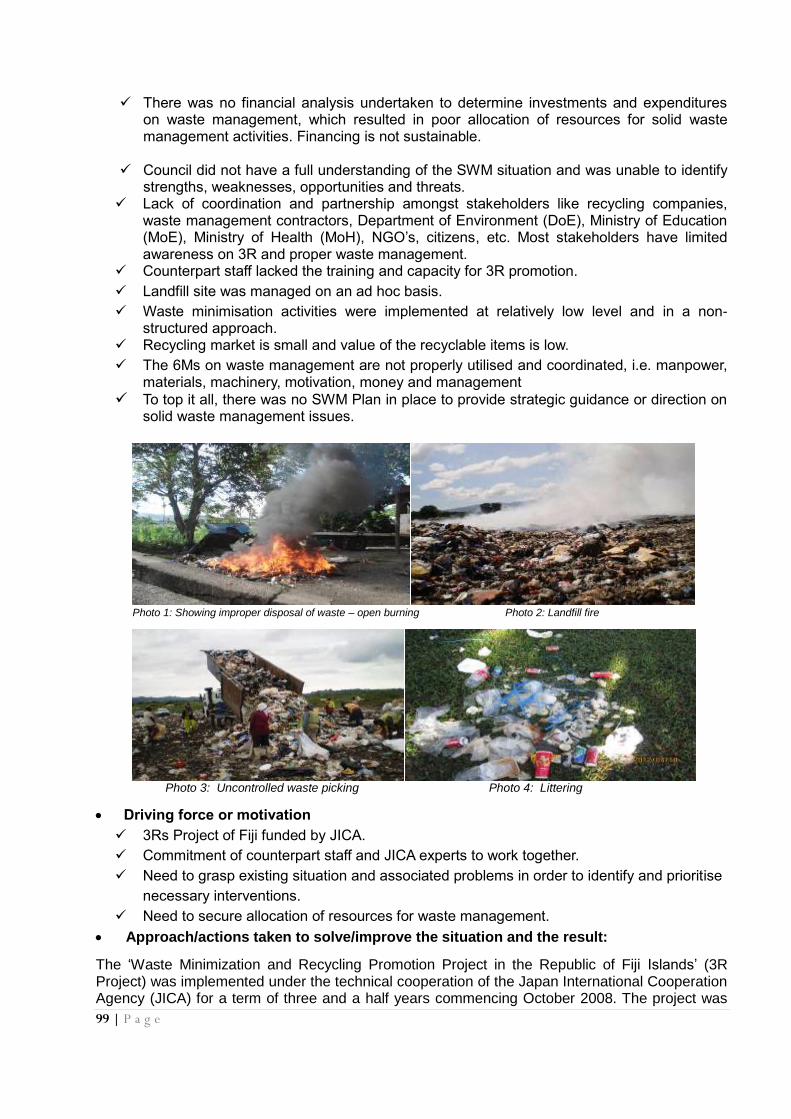
99 | P a g e
There was no financial analysis undertaken to determine investments and expenditures on waste management, which resulted in poor allocation of resources for solid waste management activities. Financing is not sustainable.
Council did not have a full understanding of the SWM situation and was unable to identify
strengths, weaknesses, opportunities and threats. Lack of coordination and partnership amongst stakeholders like recycling companies,
waste management contractors, Department of Environment (DoE), Ministry of Education (MoE), Ministry of Health (MoH), NGO’s, citizens, etc. Most stakeholders have limited awareness on 3R and proper waste management.
Counterpart staff lacked the training and capacity for 3R promotion.
Landfill site was managed on an ad hoc basis.
Waste minimisation activities were implemented at relatively low level and in a non-structured approach.
Recycling market is small and value of the recyclable items is low.
The 6Ms on waste management are not properly utilised and coordinated, i.e. manpower, materials, machinery, motivation, money and management
To top it all, there was no SWM Plan in place to provide strategic guidance or direction on solid waste management issues.
Photo 1: Showing improper disposal of waste – open burning Photo 2: Landfill fire
Photo 3: Uncontrolled waste picking Photo 4: Littering
Driving force or motivation
3Rs Project of Fiji funded by JICA.
Commitment of counterpart staff and JICA experts to work together.
Need to grasp existing situation and associated problems in order to identify and prioritise
necessary interventions.
Need to secure allocation of resources for waste management.
Approach/actions taken to solve/improve the situation and the result:
The ‘Waste Minimization and Recycling Promotion Project in the Republic of Fiji Islands’ (3R Project) was implemented under the technical cooperation of the Japan International Cooperation Agency (JICA) for a term of three and a half years commencing October 2008. The project was

100 | P a g e
implemented to strengthen the capacity of two municipalities - Lautoka City Council (LCC) with a population of 45,000 and Nadi Town Council (NCC) with a population of 12,700 - and the Department of Environment (DOE) to promote waste minimisation. Since the 3R Project was a technical cooperation project with JICA, the emphasis was on building capacity of the two councils. This was achieved by identifying project counterparts in both councils to work side-by-side with JICA Technical Experts. Funding for the project activities was provided by JICA with counterpart funding from LCC, NTC and DOE. The scope of the project included (i) conducting baseline surveys to grasp the existing situation and issues relating to solid waste management, (ii) developing Solid Waste Management Plans for the two municipalities based on baseline data, (iii) implementing pilot projects to examine the applicability, sustainability and expandability of waste minimisation practices such as home composting, market waste composting, Clean Schools Programme, separate collection for recyclables, and green waste collection and chipping, (iv) improving the operation and management of the Vunato Disposal Site, (v) developing a wide range of educational tools, which were utilised for extensive awareness raising to citizens through house to house visits, community meetings etc., and (vi) expanding viable pilot projects to other areas based on the validity and lessons learnt from the pilot projects.
Photos 5, 6, 7 & 8: 3R Pilot Project (3R-PP) Activities of Home Composting, Separate Collection of Recyclables, Green
Waste Chipping and Market Waste Composting
A Solid Waste Management Plan was formulated based on the lessons learnt from pilot projects. These lessons became tools to provide strategic guidance to implement an Integrated Solid Waste Management system taking into consideration social, financial, political,
environment, institutional and technical factors.
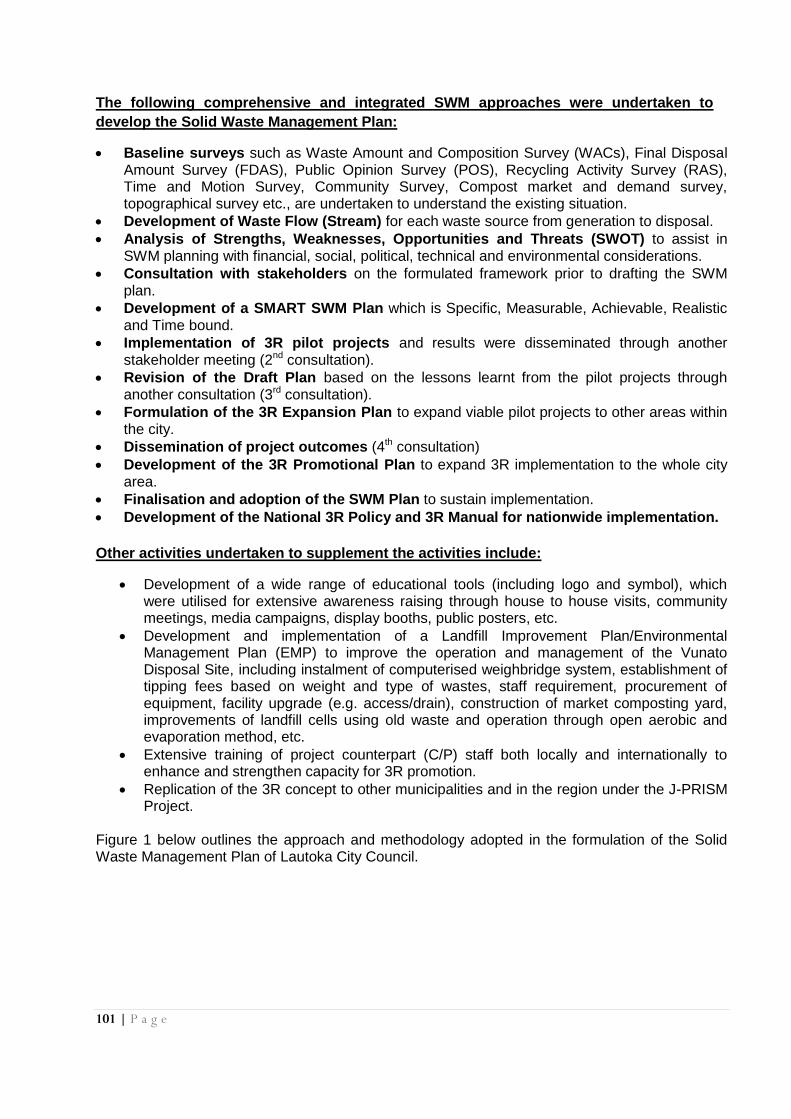
101 | P a g e
The following comprehensive and integrated SWM approaches were undertaken to
develop the Solid Waste Management Plan:
Baseline surveys such as Waste Amount and Composition Survey (WACs), Final Disposal Amount Survey (FDAS), Public Opinion Survey (POS), Recycling Activity Survey (RAS), Time and Motion Survey, Community Survey, Compost market and demand survey, topographical survey etc., are undertaken to understand the existing situation.
Development of Waste Flow (Stream) for each waste source from generation to disposal.
Analysis of Strengths, Weaknesses, Opportunities and Threats (SWOT) to assist in SWM planning with financial, social, political, technical and environmental considerations.
Consultation with stakeholders on the formulated framework prior to drafting the SWM plan.
Development of a SMART SWM Plan which is Specific, Measurable, Achievable, Realistic and Time bound.
Implementation of 3R pilot projects and results were disseminated through another stakeholder meeting (2nd consultation).
Revision of the Draft Plan based on the lessons learnt from the pilot projects through another consultation (3rd consultation).
Formulation of the 3R Expansion Plan to expand viable pilot projects to other areas within the city.
Dissemination of project outcomes (4th consultation)
Development of the 3R Promotional Plan to expand 3R implementation to the whole city area.
Finalisation and adoption of the SWM Plan to sustain implementation.
Development of the National 3R Policy and 3R Manual for nationwide implementation.
Other activities undertaken to supplement the activities include:
Development of a wide range of educational tools (including logo and symbol), which were utilised for extensive awareness raising through house to house visits, community meetings, media campaigns, display booths, public posters, etc.
Development and implementation of a Landfill Improvement Plan/Environmental Management Plan (EMP) to improve the operation and management of the Vunato Disposal Site, including instalment of computerised weighbridge system, establishment of tipping fees based on weight and type of wastes, staff requirement, procurement of equipment, facility upgrade (e.g. access/drain), construction of market composting yard, improvements of landfill cells using old waste and operation through open aerobic and evaporation method, etc.
Extensive training of project counterpart (C/P) staff both locally and internationally to enhance and strengthen capacity for 3R promotion.
Replication of the 3R concept to other municipalities and in the region under the J-PRISM Project.
Figure 1 below outlines the approach and methodology adopted in the formulation of the Solid Waste Management Plan of Lautoka City Council.

102 | P a g e
Figure 1: Approach and Methodology for SWM Planning by LCC
Types and amount of resources/inputs provided
Technical funding including technical expertise for guidance – JICA 3Rs Project. Resources for base line surveys. Logistics for the conduct of consultations. Office space for experts.
Keys for success:
Comprehensive and reliable data is vital in developing a good SWM Plan. Extensive and representative stakeholder consultations will ensure that real issues are
captured and encourage ownership of the SWM Plan by the stakeholders. A step-by-step formulation of the SWM Plan will enable a systematic approach to
addressing real issues. Political and administrative support by LCC, NCC and DoE facilitated the development of
the plan. The ‘Think Globally, Act Locally’, ‘Plan to Work, Work to Plan’ and ‘Think outside the box’
philosophies contributed to the development of suitable and attainable targets specific for local conditions but dependent on the availability of 6Ms.
The piloting of initiatives will ensure better outcomes.
Challenges:
The SWM Plan does not have the full support of some stakeholders during the implementation phase.
Most stakeholders are not giving priority to SWM.
Baseline surveys (Waste amount and composition, Final disposal amount, Public opinion, Recycling activity, etc) Oct 2008 – May 2009
Framework of SWM M/P
Draft SWM M/P
Review of SWM M/P
Final SWM M/P
First Workshop
Second Workshop
Third Workshop
Final Workshop
Jun 2009
Oct 2009
Feb 2010
Nov 2011
Review & Modify
Review & Modify
Review & Modify
3R Pilot Projects (3R-PP)
Comments
Comments
Explain
Explain
Explain
Explain
Comments
Comments
Lessons learnt from 3R Pilot Projects (3R-PP)
Lessons learnt from 3R-PP and 3R Promotion

103 | P a g e
It is difficult to get more stakeholders to the consultations to make these representative with a higher level of ownership
SWM takes lower priority, and funding or allocation of resources is not always sustained.
Good Lessons:
The ‘trial and error’ approach through implementation of the pilot projects proved effective in identifying workable solutions to waste issues.
Implementation of the plan built capacities of local C/Ps. A SWM Plan provides strategic direction and guidance in a more structured and
comprehensive manner in addressing the SWM issues. A SWM Plan helps in securing budget.

104 | P a g e
ANNEX V: PLANNING & DESIGNING OF BASIC WASTE
FACILITIES By Faafetai Sagapolutele
The following discusses some cases of planning and designing basic waste facilities using information and data from waste generation and composition surveys. 1) PLANNING OF SIZE OF WASTE BINS In Honiara, the population is about 84,52218 and a daily waste generation of 0.5kg per person per day is used for calculation purposes, as shown below for planning and making decisions on some waste facilities like rubbish bins, trash bags, rubbish trucks and disposal site.
Step 1: Waste Quantities Estimation.
= Waste Generation per person x Average Family Size (get from the latest Population Census). = 0.5kg per person per day x 7 people per household (for example)
= 3.5 kg is the daily amount generated by one household
= 3.5 kg x 7 days
= 24.5 kg is the weekly amount of the waste per household
The estimates of the generated wastes by one household provide the basis for planning and making decisions on the waste facilities to be used. To understand how much waste is expected to be recovered and stored for collection and disposal, the other waste generation parameters (densities and composition) need to be included in the planning of facilities.
Table 1: Wheelie Bins and Carrying Capacity
Common Available Bin Size Carrying Capacity Limit (Kg)
80 L 30
120L 60
240L 110
N.B: The above information is always written on the bins.
With the calculated weekly generated waste of 24.5 kg, and the one collection service a week, a 80L bin is appropriate. Similar consideration must be made when selecting a rubbish bag size. Consider the Density of the Waste before selecting the bin or bag size.
18 http://www.statistics.gov.sb/statistics/social-statistics/population

105 | P a g e
= Weekly Generated Waste (kg) divided by the Waste Density
= 24.5kg / 256 kg per m3 (refer waste density calculation on page 10).
= .096m3
= 96L (a bin larger than 80L will avoid overloading, which can lead to breakage).
As part of the decision-making, the following can be considered:
Select the 80L bin or Trash bag if two collection services can be implemented. Select the 120L bin or Trash bag if there is only one collection service.
2) PLANNING OF COLLECTION SERVICES
Step 1: Check the Population Census Information for the population of an area, location and town Check the number of households in that particular area or location and multiply by the estimated average weekly household waste as discussed earlier. Let us assume that the area has 1,000 people and the daily waste generation is 0.5 kg per person. Daily Waste = 1,000 people x 0.5 kg per person
= 500 kg
Weekly Waste = 500 kg x 7 days
= 3,500 kg
Let us assume that the Waste Density is 200 kg per m3. Based on this, the expected generated weekly waste volume needed for collection and disposal is: = 3,500 kg
200kg/m3
= 17.5m3
Step 2: Deciding on the size and type of vehicles to be used.
The final details of your collection service will depend on the type and size of the rubbish truck you will use. Example: If considering a rubbish compactor of 4m3 size, it will take more than 4 truckloads to complete the collection of the indicated households. If it is a 6m3 rubbish compactor, it will take 2.9 truckloads of waste to complete the area in a week.
= 17.5m3 = 4.3 truckloads of waste a week
4m3 truck size

106 | P a g e
= 17.5m3 = 2.9 truckloads of waste a week
6m3 truck size
While load numbers to collect decreases with increasing vehicle carrying capacity, the final decision on the vehicle size must depend on the condition of the roads and accessibility to the generating sources. Smaller vehicles are easy to move around in narrow roads. Trucks with higher carrying capacity on the other hand reduce the number of trips to collect the waste.
Readymade compactor trucks are convenient but not recommended for areas with high waste densities (density > 450kg/m3)19. Other general aspects must also be considered when making decisions on the type of collection vehicles like:
Maintenance and availability of spare parts. Readymade compactors require a supply of spare parts to be ordered in advance from overseas suppliers. This must be considered when making deals with overseas suppliers to ensure the smooth flow of collection service operations.
In recent years, the use of readymade rubbish trucks has been increasing in many Pacific island countries. This has also improved the knowledge and skills of local engineers to maintain and fix these trucks when they become faulty. With the increasing use of these trucks compared to 10 years ago, the maintenance of these trucks is no longer a major problem for some countries like Fiji and Samoa.
Ease to load waste during collection. Trucks with higher loading ends, like most open dump trucks for construction purposes, create problems for the workers because the loading is above the workers waist or chest. Proper rubbish compactors on the other hand have low rear loading ends at the waist level of the workers, which are easier to load with waste.
Non self-dumping trucks must not be used for any collection service programme because of the time taken to manually unload a waste load at the disposal site.
Other important aspects are discussed under the Time and Motion Survey section.
3) PLANNING OF WASTE DISPOSAL FACILITIES One of the important uses of the extracted waste data and information from the generation and composition survey is for the planning and design of waste disposal facilities. Like the other examples on the planning of storage and collection facilities, the use of the daily waste generation rate is important in estimating the disposal space for the collected wastes. Example:
Assuming that the population of a remote island is 10,000 people with a daily generation rate of
0.5kg per person per day and waste density of 450 kg per m3, how much space is needed to
dispose of the generated waste from these 10, 000 people in a year?
= 0.5 kg per person per day x 10,000 people
= 5,000 kg
= 5,000 kg x 365 days
= 1,825,000 kg
19 Guide for Municipal Solid Waste Management in Pacific Island Countries, 1996.
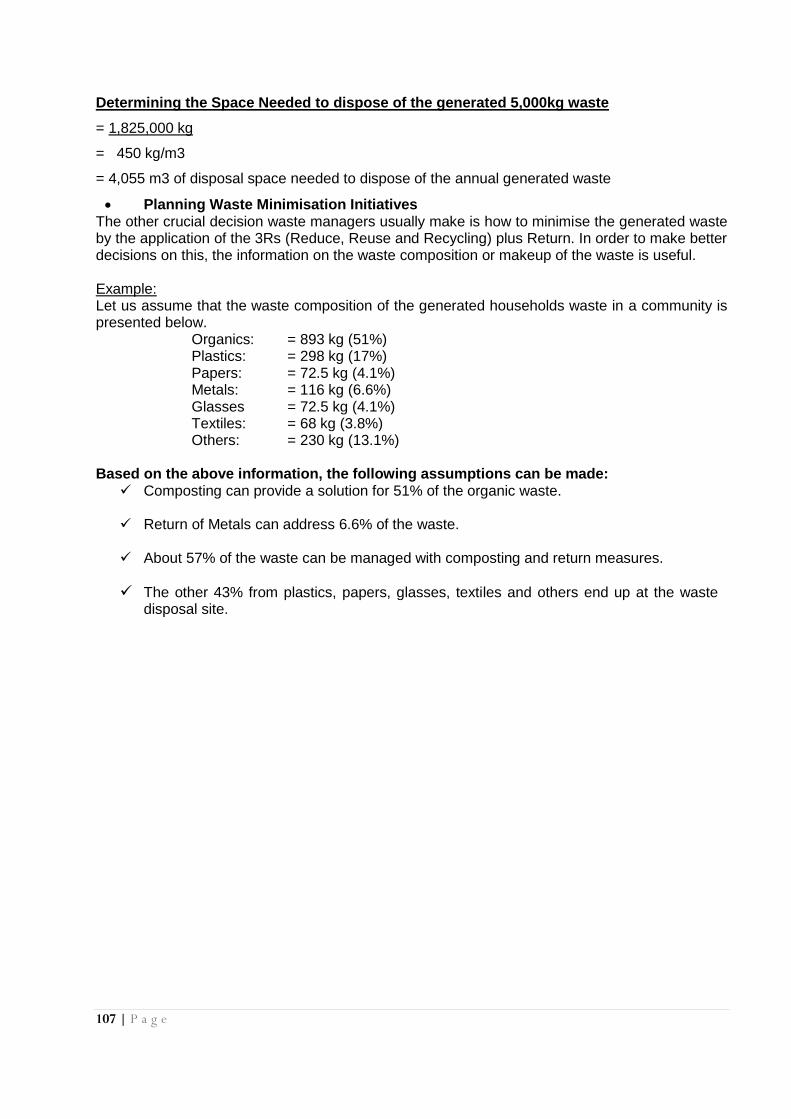
107 | P a g e
Determining the Space Needed to dispose of the generated 5,000kg waste
= 1,825,000 kg
= 450 kg/m3
= 4,055 m3 of disposal space needed to dispose of the annual generated waste
Planning Waste Minimisation Initiatives The other crucial decision waste managers usually make is how to minimise the generated waste by the application of the 3Rs (Reduce, Reuse and Recycling) plus Return. In order to make better decisions on this, the information on the waste composition or makeup of the waste is useful. Example: Let us assume that the waste composition of the generated households waste in a community is presented below.
Organics: = 893 kg (51%) Plastics: = 298 kg (17%) Papers: = 72.5 kg (4.1%) Metals: = 116 kg (6.6%) Glasses = 72.5 kg (4.1%) Textiles: = 68 kg (3.8%) Others: = 230 kg (13.1%)
Based on the above information, the following assumptions can be made: Composting can provide a solution for 51% of the organic waste.
Return of Metals can address 6.6% of the waste.
About 57% of the waste can be managed with composting and return measures.
The other 43% from plastics, papers, glasses, textiles and others end up at the waste disposal site.
108 | P a g e
ANNEX VI: CONTRACT MANAGEMENT Case Study - Port Moresby, Papua New Guinea
By Joshua Sam (Edited by Mahmoud Riad)
1. Background Information
A review of the history of SWM shows that the services were initially started by the private sector, but were gradually taken over by the national and local authorities as the services became regulated and there was a need to expand them to a wider range of beneficiaries.
Many of the national and local authorities in the Pacific island countries have contracted out waste collection and disposal operations in recent years. In Port Moresby, the NCDC has contracted out all SWM services (collection, waste disposal and street sweeping) to private contractors.
NCDC objectives and considerations in fully contracting out the services were:
The desire to achieve cost effectiveness in service delivery.
Obtaining desired standards of quality and coverage within a sustainable unit cost.
Identifying key pre-conditions to enable the services to be cost effective.
2. Ensuring a successful contract system
NCDC has a long history of employing private contractors and recognises that certain factors need to be in place to achieve satisfactory contract out of the services. These can be listed as follows:
Good preparation to define required service levels and contract conditions, through a deep understanding of site conditions and laws regulating contract writing.
A transparent and thorough process for tendering, contract award, contract documents and signing.
A qualification system to register competent contractors to provide waste services.
Ensure that funds are available to pay for the services in the amounts and schedules set out in the contracts.
Develop and effective monitoring and control system through training and standardising the works of the NCDC responsible staff and involving communities in this process.
NCDC is continuously working to realise these factors.
3. Securing efficient contractors
Originally in the NCDC the hired contractors were not solely working in the waste services business. Usually they had trucks and therefore bid for waste collection, or some heavy equipment such as a backhoe and dozer and accordingly bid for disposal site operation.
As the waste services grew and NCDC demanded a higher quality of services, some contractors became specialised in waste collection. Unfortunately the same cannot be said for the waste disposal site, and the process to develop contractors dedicated to disposal operations is ongoing.
In order to secure and develop efficient contractors, the following items are promoted by NCDC:
Ensuring healthy competition of contractors to eliminate inefficient ones.
Contracting out the services to a number of contractors to avoid monopolies and encourage the waste industry.
Providing learning and training opportunities to contractors in order to enhance their technical knowledge and organise their efforts.

109 | P a g e
4. Fulfilling Obligations under the contract
The contract should clearly state the roles of each municipality and service provider. The municipality or responsible public agency should ensure that the work is implemented according to the public health requirements and should make payments entitled for provision of the services as indicated in the contract. The payments should be made based on the service qualities described in the contract and any penalties due to poor service performances should be deducted. Key points on both payments and monitoring and control are described below.
a) Payments by Municipality
Contract payments are a powerful tool to controlling contracts and making sure that objectives are achieved.
Local authorities must know the real cost of SWM services and reflect this in the payments.
A generous profit margin should be considered for contractors because they are business enterprises and are driven by profits.
Important to pay contractors on time to avoid inconvenience to their operations. b) Monitoring and control of contractor’s responsibilities
Effective monitoring and control are key issues to making contracts work.
The most effective means of monitoring should be examined and clearly included in contract documents.
Contract stipulations must be strictly adhered to.
Rewards must be paid as well as penalties for failure to uphold contract stipulations.
5. Services contracted out
a) Waste Collection and Transport
Waste collection services are contracted out by waste type in the NCDC. Individual contracts are made for domestic waste, commercial waste, markets, schools, hospitals and street cleaning.
Due to lack of a weighbridge the quantities described in the contract are in truckloads or in volumes. Contracts describe service collection levels such as collection frequencies, where waste is discharged, types of bins, etc.
b) Waste Disposal
NCDC has developed a landfill operations manual and this has been provided to the contractor in order to properly operate the landfill. Upon signing the contract the contractor was obliged to prepare an environmental management programme. There are many waste pickers at the site and the contractor was advised to develop programmes to engage some of them to work in the rehabilitation and operation works.
Due to the high costs of procuring heavy equipment the contractor does not possess standby heavy equipment and the work is often interrupted when the heavy equipment breaks down.

110 | P a g e
ANNEX VII – HARMONISATION OF WASTE PICKERS Case Study - Baruni Waste Landfill, Port Moresby, Papua New Guinea
By Joshua Sam (Edited by Mahmoud Riad)
a) Background
In September 2014, the NCDC developed a plan to ensure that safety measures are enforced at Baruni landfill, which serves the city of Port Moresby. For a very long time there were problems at the site between the NCDC officers, the operator staff, the waste pickers and their families, and residents in the nearby villages. These problems included open fires, fights at the site, attacks on passing cars, dangerous working environment for NCDC officers, accidents involving waste pickers children, amongst others.
This plan was drawn up by the project team for ‘The Daily Operation and Management of the Baruni Landfill and its Upgrade from an Open Dump to a Sanitary Landfill’ (the Project). The contractor entrusted with operation and upgrading of the Baruni disposal site was contractually responsible to provide safety control for all Baruni disposal site users; WMD staff, Project personnel, waste pickers and contractor staff. However it was NCDC’s responsibility to monitor the Contract and the Contractor’s performance.
NCDC Policy towards Waste Pickers at Baruni Disposal Site
The policy adopted by WMD towards the waste pickers at Baruni was as follows: (1) Involve the waste pickers in an organised manner, and try and retain at the site the waste
pickers who have been working there for a long time. (2) Control the waste pickers to avoid any confrontations, threats or harassment. (3) There was no intention to evict the waste pickers from the site. (4) NCDC would like to work together with the waste pickers to improve the site safety control
and management and make them part of the system at Baruni. (5) Involve some of the waste pickers in operations and upgrade works.
Strategy to achieve the Waste Pickers policy
To deliver this strategy, the Project team identified countermeasures that should be taken by both NCDC and the Waste Pickers.
NCDC measures Waste Pickers measures
(1) Employment of some waste pickers for operation and upgrade works
(2) Include separation work by waste pickers in operation process
(3) Provide temporary resting places and water use from the facilities to be introduced in the upgraded landfill.
(4) In future provide space for the separation works to remove recyclables from the waste
(5) Cooperate with waste pickers and related authorities to provide access for waste pickers’ children to education and other social services
(1) No burning of the waste
(2) Acceptance of waste vehicles control by NCDC
(3) Cooperate to maintain security and safety at the site
(4) Coordinate among all the waste pickers blocks to self-manage safety of waste pickers and their families working there

111 | P a g e
b) Safety Concerns at Baruni Disposal Site Implementation of the Project started in earnest in July 2014. On the operational level, there were significant improvements. However, the Project Team also identified certain issues that cause safety concerns and require immediate attention by the Operator, NCDC, and the Waste Pickers. These were as follows:
Operator
(1) Resources allocated to Operations and Upgrade activities were not properly separated (2) Supervision of the operation activities was insufficient (3) Control of the waste pickers was not enough (4) Site safety plan was not fully implemented at the site
NCDC
(1) Monitoring of the Contract needed to be strengthened (2) Constant presence of WMD staff at the site was required (3) Operation and upgrade progress records were not sufficiently maintained
Waste Pickers
(1) Endangered their children by making them work in waste picking and letting them play in the site
(2) Generally did not follow the safety instructions of the Operator and NCDC (3) Were not coordinating enough amongst the different waste pickers blocks on security matters c) Actions to Improve Safety Control at Baruni While contractually the Operator had the responsibility to control safety at the site, the Project Team recognised that NCDC has the role of monitoring the project activities discharged by the contractor. To improve its monitoring capability at the site, NCDC implemented the following immediate actions.
1. Confirmation of Baruni Project Team formation and duties 2. Establish WMD Officers presence at Baruni during working hours 3. Effectively supervise and monitor the Operations & Upgrade Contract 4. Continue and enhance safety control measures already introduced 5. Activate and participate in the Baruni Landfill Safety Committee 6. Consider measures to improve social conditions of waste pickers
NCDC, the Operator and the waste pickers agreed to set-up the Baruni Landfill Safety Committee, with the following duties:
Report to the Operator Site Supervisor any issues related to safety that the members notice
During working hours, advise and caution the waste pickers on any activities that might create safety problems
Inform waste pickers of any safety notifications issued by the Operator
Report to the Operations & Upgrade Weekly meetings every Tuesday The Project Team conducted a survey on the conditions of the waste pickers at Baruni site, in 2014. There were 11 blocks of waste pickers, with 95 households. The total population was 503 persons. Around 73% were engaged in waste picking, and 32% were children. All the waste pickers (99%) complained of poor health, with 95% responding that respiratory related sickness were the main ailment (95%), and followed by malnutrition (80%) and addiction (60%). While 65% reported that they have access to health services, only 37% have access to

112 | P a g e
educational facilities for their children. And 85% of the waste pickers desired to continue to work as waste pickers.
The survey results indicate the following:
There were over 100 children working in waste picking The children did not have sufficient access to educational facilities The waste pickers did not have a desire to change to other jobs The waste pickers were interested in working on other jobs related to the upgrade Baruni
landfill, such as security, landfill workers and operators d) Other Measures In the long term the Project Team was expected to implement a number of measures related to improving the safety control at the site. These included the following measures: 1. Review the contract for Operations & Upgrade and related submissions by the Operator 2. Future plans for the Baruni Landfill expansion 3. Relocation of waste pickers living inside the site
4. Study on NCDC direct operation of the landfill in the future
113 | P a g e
ANNEX VIII – WEIGHBRIDGE DATA MANAGEMENT Case Study – Lautoka, Fiji
By Shalend Singh (Edited by Ma Bella Guinto)
a) Background
Fiji with a population of over 835,230 (2007 Census) largely depended on the importation of goods and materials from developed countries. Urbanisation, economic development (growth in tourism, commerce and industry), population growth, changes in consumption patterns, all contributed to increasing quantities of solid wastes in Fiji. Due to its geographical isolation and relatively small recycling market, it is very difficult to recycle waste in Fiji. In addition, finding suitable landfill sites is quite difficult considering land issues like customary rights over the use of land and reluctance by landowners to lease land for use as disposal sites due to fear of negative environmental, social and economic impacts.
Lautoka is the second largest city in Fiji with a population estimated at 44,000 in 2008. Lautoka City Council was very concerned with solid waste generation and the potential to cause negative impacts on the fragile environment, tourism, trade, economy, social conditions, public health, water quality, and on the existing limited resources.
Increasing waste generation places additional burden on the existing open dumpsite, Vunatu Disposal Site. The landfill site was located only about 1 km from the main city area. It is operated through controlled open dumping with unregulated scavenging of waste, pollution of the coastal water from leachate, frequent fire, vector breeding, public health nuisance etc. Only one old bulldozer was available for landfill operation and required maintenance work on a regular basis.
The dumpsite catered for wastes from Lautoka City, Nadi Town, hotels, islands and rural areas from Nadi and mid-way to Ba. The Council lacked the financial capacity to handle such an influx of waste with very limited resources (manpower, machinery, landfill operation/improvement costs etc.). There was an attempt to levy tipping fees for users of the dumpsite but the charging was believed to be subjective because it was based on vehicle type/capacity and type/origin of waste. It was not based on actual weight of waste disposed. The landfill also lacked basic facilities like a proper office, washroom and dining amenities for the staff.
During natural disasters, the influx of huge amounts of green and bulky waste results in exorbitant landfill management costs, more so because Vunato Disposal Site is required to cater for disaster wastes from Nadi and rural areas, including the islands and hotels. If not properly
managed, there is always a risk of fire outbreak at the landfill site due to dried green waste.
b) Problems identified
Unsustainable financing for landfill operations, management and improvements including procurement and maintenance of machinery. One old and worn out bulldozer was allocated for landfill operations which required regular maintenance. The landfill was inadequately resourced.
Uncontrolled waste picking by scavengers from nearby settlements.
Lack of landfill data, e.g. sources and amount of incoming waste, etc.)
Unfair system of levying tipping fees as it was based on capacity of vehicles and not weight.
No mechanism of record keeping and reporting to management/council.
No system of environmental monitoring.
No demarcation of the boundary of the landfill; no provision of enclosed cell (without any periphery banks, dividers or buffers); open landfill with inefficient compaction resulting in scattered wastes into canals and sea shore/mangroves with potential environmental pollution risks.

114 | P a g e
No provision of proper drainage system and access.
Lack of motivation and expertise of counterparts for proper landfill operation and management.
Lack of interest from citizens for visits to the landfill site due to its poor condition.
c) Driving force or motive
Planned procurement of weighbridge through the 3Rs Project of Fiji funded by JICA.
Non-transparent and unfair system of tipping fee resulting in complaints from the public.
Expected increased income and sustainable financing for proper landfill operation and management.
d) Approach/actions taken to solve/improve the situation and the result
The ‘Waste Minimisation and Recycling Promotion Project in the Republic of Fiji islands’ (3R Project) was implemented under the technical cooperation of the Japan International Cooperation Agency (JICA) for a term of three and a half years commencing October 2008. The project was implemented to strengthen the capacity of two municipalities, Lautoka City (population of 45,000) and Nadi Town (population of 12,700), and Department of Environment (DOE) to promote waste minimisation.
Since the 3R Project was a technical cooperation project with JICA, the emphasis was on building capacity of the Lautoka City Council (LCC) and Nadi Town Council (NTC). This was achieved by identifying project counterparts in both Councils to work side-by-side with JICA Technical Experts. Funding for the project activities was provided by JICA with counterpart funding from LCC/NTC/DOE to enable sustainability of the project.
One of the scopes of the project is the improvement of the operation and management of the Vunato Disposal Site (VDS) through establishment of a computerised weighbridge system.
The following comprehensive and integrated approach was undertaken to introduce the computerised weighbridge system and improve landfill data management:
i. Preliminary Evaluation
Baseline survey undertaken including Final Disposal Amount Survey and Topographical Survey to understand the existing situation. This included SWM SWOT analysis to assist in developing waste flow and SWM planning incorporating landfill improvements.
Developed Waste Flow (Stream) using baseline data.
Estimated landfill operation costs.
Inventory of previous customers using the landfill and ascertain revenue generated from tipping fee.
Assessment of the current 6Ms (manpower, materials, machinery, motivation, money and management).
ii. Landfill Improvement Plan
Strengthen management system (define boundary, install weighbridge system, revise and set appropriate tipping fee, develop landfill plan, staff reinforcements etc.)
Minimisation of environment impacts (buffer zones, Environment Management Plan, special waste area, etc.).
Improvement of landfill operation system (open aerobic and evaporation method, access and drainage improvements, waste picker control/permit system, equipment procurement and maintenance system, regular fly spraying, etc.).
iii. Procurement of Weighbridge and installment

115 | P a g e
Tender process for procurement of weighbridge (Refer Table 1 for Specification).
Signing of contract – allow at least 13 weeks of procurement.
Installation of weighbridge ensuring it is above flood level. Figure 1 shows layout of VDS and location of weighbridge.
Installation and customisation of software to standardise or set up data entry formats for different filters to suit the requirements of VDS. Hardcopy of the manual is also available.
Entry of data of regular customers/vehicles into the computerised system (net/tare weight of vehicle, customer information, type of waste disposed according to customers, vehicle details etc.).
Preparation of draft format of receipting/invoicing.
Training by supplier for 6 operators and issuance of Public Weighmen License.
Trial operation for 3 months with recording of date and time of waste disposal, customer and vehicle information, waste category, weight disposed, fee charged etc. Table 2 shows a sample of data entries.
Revision and adoption by LCC of the tipping fees based on weight of waste disposed, type of waste, landfill operation costs, origin of waste (outside and within city area) - refer to Table 3 for tipping fee.
Finalise preparation of format of receipts/invoices.
Procured back-up generator as contingency measure for power cuts and disasters.
Role of Weighbridge Operators (Public Weigh Men) at Vunato Disposal Site (VDS)
The weighbridge operators (weigh men) at VDS play a vital role in ensuring that the weighbridge system operates in a systematic and effective manner after installation. Refer to Figure 2 for Standard Operating Procedure for VDS weighbridge operations and accountable means of handling revenue.
Some specific roles of weighbridge operators are as follows:
Basic inspection of weighbridge on a daily basis to ensure it is clean, free of any jam, no liquid spills and that the weighbridge is floating.
Ensure that weighbridge scale reads zero reading before any truck is weighed.
Ensure that vehicle drivers and passengers need to get off the truck before registering weight.
Ensure that the vehicle is parked properly on the weighbridge and all the wheels are on the weighbridge platform to avoid any errors in weight data or reading.
Verify type of waste to account for the correct tipping fee.
Ensure tare weight is accounted for. For vehicles with no tare weight in the system, weigh the empty vehicle after disposal.
Enter all the information correctly in the system to avoid errors and re-check if needed prior to processing of the receipts. Provide a backup data system daily. Retrieve and provide data to Council staff in charge.
Weighbridge Data Management and Operation System
All incoming vehicles are weighed at the entrance of the Vunato Disposal Site. The weight is transmitted electronically from the weighbridge to the computer system. Receipts are printed automatically once all the data are entered in the system. All the data generated by the system is transmitted to the administration office electronically through the internet to prevent any computer viruses. Figure 3 provides the basic illustration of the weighbridge data management system of VDS at LCC.
Other features and practices about weighbridge system at VSD are as follows:

116 | P a g e
Levied revised tipping fees after council conducted awareness activity (media release and circular).
Retrieved daily, monthly or yearly records in Excel format or PDF (refer to Table 2 for sample extract of raw data).
Analysed raw data generated from weighbridge system.
Collated record of expenses incurred in landfill operation/management (refer to Table 4 for sample of monthly expenses incurred at VDS).
Reporting to council management meetings (disposal amount, revenue generated, expenses incurred, recyclables collected by waste pickers, commercial weighing of vehicles, amount of market green waste disposed for composting etc.). Refer to Table 5 for sample reporting format of waste disposal and income record of VDS.
Figure 4 shows how data from the weighbridge system can be utilised to summarise and compare the waste disposal records for two years.
Certification and calibration of weighbridge by Weights and Measures on annual basis. This cost also caters for free backup service for a year. Significant budgetary provisions are utilised for this and in the case of Vunato Disposal Site (VDS) in Fiji, average costs for calibration, certification and backup service is FJD13,000. Bulk of the fees is utilised for transportation and hire of standard mass (weights), hire of forklifts and stamping fees.
Introduced controlled waste picking. Around 35 waste pickers are given permits with specific conditions after Occupational Health and Safety (OHS) training. Waste pickers pay FJD 20/month to enter the landfill to collect recyclables.
Weigh recyclable materials collected and removed from landfill site by waste pickers. Waste pickers collect an average of 30 tons/month of recyclables or resource materials from landfill for recycling and reuse.
Weighbridge is also used for commercial weighing of other vehicles at rate of FJD 21.00/weighing. For instance, weighing of logs as fuel for boiler as boiler operators pay for wood based on weight. Also, Land Transport Authority need net weight of commercial vehicles prior to annual certifications/registration.
Carry out regular servicing and maintenance of weighbridge and machinery.
Table 1: Main Specification of Weighbridge and Data Processing System
Item Specification
1. Weighbridge
(Truck Scale)
・ Size: 12m x 3m
・ Measuring capacity from 20Kg to 80ton
・ Including hire of any necessary equipment and machines to
install at the site
2. Data Recording
System for
Weighbridge
・ Electronic Indication System
・ 2 sets of Computers with Windows XP OS, MS Office (Word,
Excel), Anti-Virus Software and data backup system
・ Printer preferably with triplicate copy function
・ Data Management Software developed under the instruction of
End-User - LCC (sums up each collector, area, daily, monthly
and yearly data with a data backup system)

117 | P a g e
Figure 1: Layout of Vunato Disposal Site (VDS) and location of weighbridge
Table 2: Sample Extract of Raw Data from Computerised Weighbridge System
Note: Above table is a sample format of one customer and one waste category
Vehicle Customer Prod Fee/ton Wgt In Wgt Out Wgt Net Tot Price Time In Date In Time Out
FA 968 Carpenters 1 $23.00 10880 7200 3680 $84.64 3:29:40 p.m. 5/5/2014 3:30:04 p.m.
FA 968 Carpenters 1 $23.00 7100 6880 220 $5.06 12:03:39 p.m. 6/5/2014 12:19:04 p.m.
FA 968 Carpenters 1 $23.00 7660 6880 780 $17.94 12:38:24 p.m. 7/5/2014 1:00:24 p.m.
EW718 Carpenters 1 $23.00 7200 6960 240 $5.52 8:26:42 a.m. 14/05/2014 8:35:44 a.m.
EW718 Carpenters 1 $23.00 6960 7460 500 $11.50 8:35:44 a.m. 14/05/2014 9:13:16 a.m.
EW718 Carpenters 1 $23.00 7820 7000 820 $18.86 9:23:30 a.m. 15/05/2014 9:30:35 a.m.
FA 968 Carpenters 1 $23.00 7200 8800 1600 $36.80 9:19:55 a.m. 14/05/2014 4:30:53 p.m.
FA 968 Carpenters 1 $23.00 8540 7080 1460 $33.58 9:11:57 a.m. 16/05/2014 9:25:58 a.m.
HG 854 Carpenters 1 $23.00 7560 8640 1080 $24.84 10:00:24 a.m. 19/05/2014 4:43:07 p.m.
EW718 Carpenters 1 $23.00 7380 7000 380 $8.74 10:43:56 a.m. 23/05/2014 10:49:12 a.m.
EW718 Carpenters 1 $23.00 8540 7140 1400 $32.20 12:21:21 p.m. 30/05/2014 12:26:50 p.m.
Total
11
12,160 $279.68
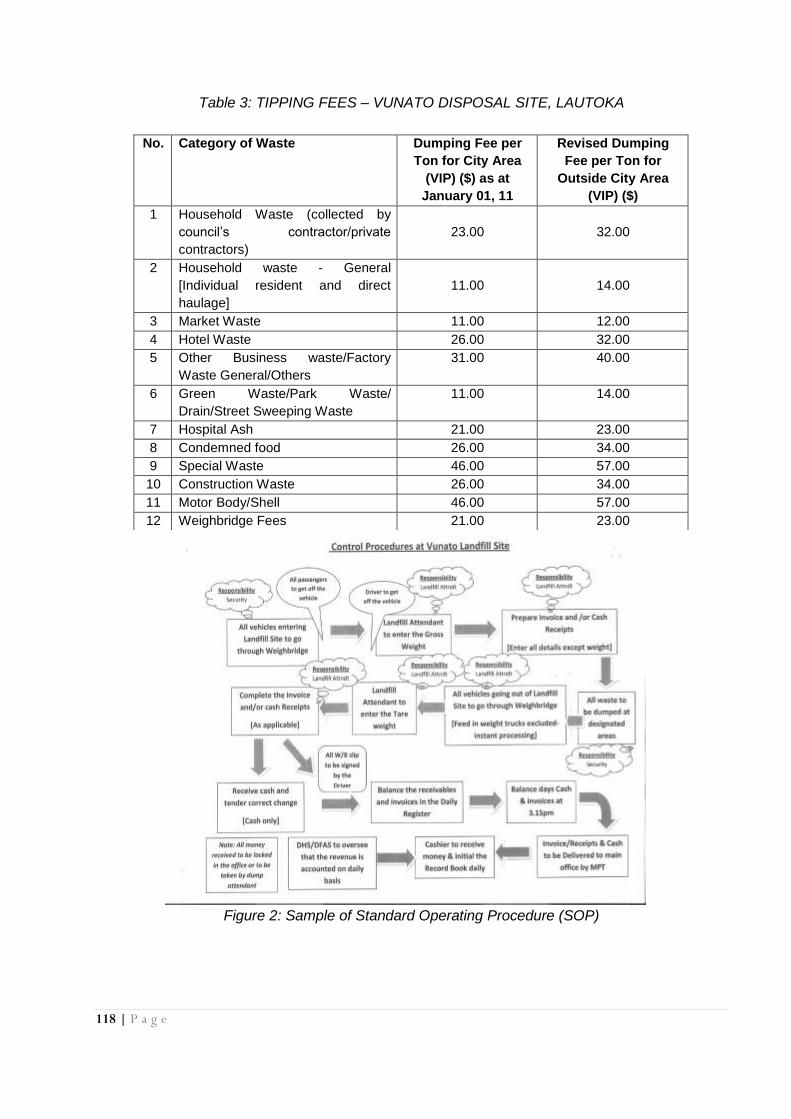
118 | P a g e
Table 3: TIPPING FEES – VUNATO DISPOSAL SITE, LAUTOKA
Figure 2: Sample of Standard Operating Procedure (SOP)
No. Category of Waste Dumping Fee per
Ton for City Area
(VIP) ($) as at
January 01, 11
Revised Dumping
Fee per Ton for
Outside City Area
(VIP) ($)
1 Household Waste (collected by
council’s contractor/private
contractors)
23.00
32.00
2 Household waste - General
[Individual resident and direct
haulage]
11.00
14.00
3 Market Waste 11.00 12.00
4 Hotel Waste 26.00 32.00
5 Other Business waste/Factory
Waste General/Others
31.00 40.00
6 Green Waste/Park Waste/
Drain/Street Sweeping Waste
11.00 14.00
7 Hospital Ash 21.00 23.00
8 Condemned food 26.00 34.00
9 Special Waste 46.00 57.00
10 Construction Waste 26.00 34.00
11 Motor Body/Shell 46.00 57.00
12 Weighbridge Fees 21.00 23.00

119 | P a g e
Figure 3: Weighbridge Data Management System at VDS, LCC
Table 4: Sample of Reporting format for monthly Expenses incurred at Vunato Disposal Site
Expenditure $ (FJD)
VDS staff Wages AA
Fuel D6 AA
Fuel for Kato Excavator AA
Fuel for Multi-Purpose Truck (MPT) AA
R C Manubhai ( purchases) AA
Niranjans - Servicing of FP 049 (MPT) AA
Overall Raincoat - Overall for VDS staffs AA
Naks Fashion Ltd - Uniform for staff AA
Lovely Auto Repairs - works for Excavator AA
Security (Paradise Security) AA
TOTAL BB
Weibridge Data System in Vunato
System in LCC Office
Send data
through Internet
Weighbridge Data System at Vunato, Lautoka

120 | P a g e
Table 5: Sample of reporting format for Disposal Record and Income for Vunato Disposal Site
Origin of Waste
Waste Category Disposal in tons
% Tipping fee/ton
Revenue FJD ($)
% Other notes
City Area
1,081.78 60.5%
AA BB CC
LCC/other free disposal ($) KK
Garbage collection(1) 522.00
29.2% 23.00 DD
Green (incl. Ravin)(9) 0.00
0.0% 11.00 DD
Park(12) 19.80 1.1% 11.00 DD
Drain/Street Sweeping(11) 126.63
7.1% 11.00 DD
Market(7+8) 48.58 2.7% 11.00 DD
Others(LCC, Ravin) 16 83.86
4.7% 11.00 DD
Special Waste (27) 12.54
0.7% 46.00 DD
11 x $50 machine hire
H/hold direct discharge (2) 19.36
1.1% 11.00 DD
Business (5) 150.77 8.4% 31.00 DD
Hotel Waste (14) 1.12 0.1% 26.00 DD
Garbage (others)1 2.24 0.1% 23.00 DD
Hospital Ash (22) 3.98
0.2% 21.00 DD
4 x$25 machine hire
Factory waste (18) 88.54 5.0% 31.00 DD
Construction Waste (23) 0.56
0.0% 26.00 DD
Condemned Food (20) 1.80
0.1% 26.00 DD
2 x $50 machine hire
Others (16) 0.00 0.0% 31.00 DD
Outside City area
706.62
39.5%
EE
NTC Garbage (3) 291.81
16.3% 32.00 FF
Construction(24) 18.72 1.0% 34.00 FF
Factory(19) 14.08 0.8% 40.00 FF
Hotel (15) 235.56
13.2% 32.00 FF
H/hold direct discharge (4) 45.73
2.6% 14.00 FF
Business (6) 49.68 2.8% 40.00 FF
Condemned food(21) 0.00
0.0% 34.00 FF
0 x $50 machine hire
Special waste(28) 0.92
0.1% 57.00 FF
1 x $50 machine hire
Garbage (excl. NTC)(3) 19.32
1.1% 32.00 FF
Park (13) 0.00 0.0% 14.00 FF
Drain/Street FF Sweeping(29) 30.80
1.7% 14.00 FF

121 | P a g e
Origin of Waste
Waste Category Disposal in tons
% Tipping fee/ton
Revenue FJD ($)
% Other notes
Total
1,788.40 100.0%
GG
Waste recycled from VDS by waste pickers (30) - ton/month 40.6
Weighbridge fees (32) from commercial weighing – FJD 21/weigh HH
Grand Total Revenue including free disposal II
Actual Income - Invoice/cash FJD($) :JJ
Figure 4: Sample Comparison of Total Waste Disposal Record at Vunato Disposal Site (VDS)
for 2013 vs 2014
1. Types and amount of resources/inputs provided
Infrastructure funding - Procurement/installment of computerised weighbridge system at a cost of FJD 238,110.00 through JICA
Technical Expertise for guidance – JICA 3Rs Project Manpower (weighbridge operations) - LCC Budget for servicing/ maintenance/certification/calibration – LCC
2. Keys for success:
Weighbridge is used for public weighing purposes. Hence, they need to be calibrated and certified by a competent agency to ensure accuracy and transparency.
Training by supplier and JICA experts of workers on the operation and data management – six trained weighbridge operators including two office staff.
Backup power supply – generator ensures that weighbridge is still operational during power cuts and disasters.

122 | P a g e
Monthly reporting to Council – ensures that management is made aware of the landfill data/issues.
Commitment of management for annual calibration and maintenance of weighbridge. It is also recommended that weighbridge be checked every 3 months to ensure it is operating normally and to avoid any unexpected error. Even a truck available at landfill sites with known tare weight can be used to check the accuracy of the weighbridge on a regular basis.
Stakeholders’ commitment in paying the tipping fees without any complaints.
Another computer is handy for purposes of backup storage of weighbridge data and use when the weighbridge computer is defective.
Internet provisions for computerised weighbridge are also handy for sending data by email.
It is essential to use a local supplier for installation of the weighbridge for maintenance purposes.
3. Lessons (good/bad) to share with other PICs:
Bad:
High costs of annual calibration and certification by Weights and Measures which was not considered before the procurement.
Good:
Improved financial base for proper SWM management including landfill operation, management and landfill improvements.
Reinforcement on resources and facilities - Procurement of heavy machinery (bulldozer), improved office facilities, increased manpower, introduction of contracted security on 24 hour basis.
Improved data management and reporting system (average of 70 tons of waste is disposed /day)
Controlled waste picking with improved working condition and compliance to OSH - partnership approach with waste pickers. Weighbridge is used for recording recyclables collected from VDS by waste pickers (average 30 tons/month).
More transparent, accountable and fair system of levying tipping fee.
Weighbridge also utilised for weighing market organic waste used for composting.
4. Move forward:
Utilisation of revenue generated from weighbridge system specifically for landfill improvements and facilities/equipment upgrade
Establishment of special account of tipping fees for SWM activities/initiatives.
Share the lessons learnt with counterparts.
5. Materials and Resources
Landfill Improvement Plan of Vunato Disposal Site, Lautoka Standard Operating Procedure (SOP) for weighbridge operations (Figure 2)

123 | P a g e
Photo 1: Weighbridge Construction Works. Constructed above ground due to flood-prone area
Photo 2: Testing of ramp gradient Photo 3: Two way access at weighbridge
Photo 4: Weighing of vehicles Photo 5: Weighbridge operator at work

124 | P a g e
Photo 6 & 7: Computer print out of receipt issued to customers ensuring transparency and accountability &
copy of invoice issued to Customers
Photo 8: Visit by JICA President, Sadako Ogata san to Weighbridge calibrations being conducted on
annual basis VDS & Weighbridge
Photo 9: Visits by students to landfill site, weighbridge and compost yard

125 | P a g e
Photo 10 & 11: Waste pickers selling recyclables collected from VDS & Regional Counterpart and JOCV
vists to VDS to recycling Company.

126 | P a g e
ANNEX IX – TIPPING FEES Case Study – Tipping Fee
By Newal Naidu (edited by Ma Bella Guinto)
a) Background
Labasa Town is the capital of Vanualevu, Fiji Islands and has a population of approximately 10,000. The Labasa Town Council is in charge of collection and disposal of garbage for the whole Town area which covers all residential, commercial, industrial, civic, schools, hospital, informal settlements and other areas. Previously, collection and disposal was done openly at the landfill sitem, with no control of dumping. All garbage brought to the landfill was disposed free of charge. No fee was levied with even the garbage from the rural areas being disposed of at the landfill. No recording was done therefore no data was in place. There was no control of incoming waste, which also lead to uncontrolled scavenging. Inadequate management of solid waste lead to environmental problems at the landfill site. A lack of environment monitoring was also experienced. b) Problems identified
The following problems were identified:
Due to lack of staff and security, there was no control of incoming waste.
Absence of finance was a contributing factor.
No waste mechanism was in place.
There was a lack of will and support.
c) Driving force or motive
Project/Aid – this was done by SPREP, AusAid and Department of Environment
Expertise was needed - J-PRISM assisted.
There was a desire to generate income to meet operation costs.
Sustainable financing.
d) Approach/actions taken to solve/improve the situation and the result
Labasa Town Council decided to have a baseline survey with the help of a consultant. Then applications were made to donor agencies to assist the council in rehabilitating the dumpsite. SPREP came to our rescue with assistance from Department of Environment who tried to secure funding from AusAid for a sum of USD $180,000. Quotations were obtained for hire of machines and supply of materials to rehabilitate the dumpsite. J-PRISM assisted in the technical advice and proper groundwork. All rehabilitation works were completed in November 2014 and the operation started. The operation cost was worked out by the council. Finally a levy was calculated by the Council for garbage collection and disposal from each premises, and a tipping fee for disposal at the landfill site.
A waste audit was also carried out. A gateman was appointed to record incoming waste. Estimates of landfill operation was calculated at FJD12.00/ton. A fee is collected at the gate for all incoming waste except for the contractor’s vehicles, with a transparent system for an improved financial base for sustainability.

127 | P a g e
There was an improvement in operation and management of the landfill with increased
manpower, equipment and facilities. Proper monitoring was done by the health department of the
council.
e) Keys for success
The key for success in the collection of data, tipping fee and rehabilitation was due to support from donors, government/council, community and other stakeholders.
f) Lessons (good/bad) to share with other Pacific island countries
The lessons learnt were that the system of charging a tipping fee and levy for disposal of garbage can improve the financial base for sustainable waste management. It can also improve data management and reporting. The installation and calibration of the weighbridge is very expensive.
128 | P a g e
ANNEX X – MULCHING AND CHIPPING Case Study – Lautoka, Fiji
By: Shalend Singh (Edited by Ma Bella Guinto)
1. Background and identification of problems:
(Illustrate the situation and identify problems. Then explain the driving force for action).
Situation
Fiji with a population of over 835,230 (2007 Census) largely depended on the importation of goods and materials from the developed countries. Urbanisation, population growth, increasing prosperity, commercial and industrial development, tourism, and most other forms of development all contributed in varying ways to increasing quantities of solid wastes in Fiji. Due to its geographical isolation and relatively small recycling market, it is very difficult to recycle waste in Fiji. In addition, finding suitable landfill sites is quite difficult considering the land issues like customary rights over the use of land and reluctance by landowners to lease land for use as disposal sites due to fear of negative environmental, social and economic impacts.
Lautoka is the second largest city in Fiji with a population estimated at 44,000 (2008). The Lautoka City Council was particularly concerned with Solid Waste Management and its potential to cause negative impacts on the fragile environment, tourism, trade, food supplies, public health and limited resources.
It was noted that the council was implementing various cleaning services which included garbage collection, green and bulky waste collection on a user pays basis, grass cutting/drain cleaning, street sweeping, market/bus terminal/public convenience cleaning, etc. The Vunato Disposal Site was managed under a controlled open landfilling system with scavenging of waste. Only one old bulldozer was provided for the landfill site which required regular maintenance.
It was also noted that green waste management was a major problem after natural disasters due to the huge amounts. There were exorbitant costs incurred in collection, transport and landfilling costs of green waste. There was also a risk of fire at landfill sites due to dried green waste.
Open burning of wastes by citizens contributed to a public health nuisance and emission of greenhouse gases. Littering of green wastes in public places and creeks/drains, illegal disposal sites and backyard accumulation of green wastes was also a problem. Both the LCC and Nadi Town Council area is surrounded by green vegetation especially in parks and roadsides which require regular pruning. This became an additional burden to the council in terms of collection and haulage to the landfill site.
It was however noted that most of the green waste generated from households was used for
cooking as firewood.
Problems identified
No proper and specific Green Waste Management system. Increased green waste generation after every cyclone adds to costs of
collection and haulage. Risk of fire outbreak from landfilled green waste. Council incurred increasing costs in terms of pruning service of greenery from
parks, reserves and roadsides due to increased haulage and transportation costs.
Green waste collection and transportation service was inefficient from the

129 | P a g e
perspective of collection and haulage due to the bulky nature of green waste. Inefficient and ineffective compaction of green waste at the landfill site due its
bulky nature. Thus green wastes occupied larger space at landfills. Littering of green waste in public places (roadsides, parks, drains, creeks, etc.).
This was an eyesore and even caused flash flooding of heavily littered drains/creeks during heavy rains.
Open burning of wastes by citizens was a concern contributing to a public health nuisance and emission of greenhouse gases.
Driving force or motive
3Rs Project of Fiji funded by JICA. - Procurement of Wood Chipper Need for wood chips for market waste composting, Base material for home
composting and mulching in councils parks/gardens.
2. Approach/actions taken to solve/improve the situation and the result:
(Illustrate the approach/actions taken and types and amount of resources/inputs provided such as money, machinery, materials, manpower, etc.)
Approach/actions taken and the result achieved
The ‘Waste Minimisation and Recycling Promotion Project in the Republic of Fiji islands’ (3R Project) was implemented under the technical cooperation of the Japan International Cooperation Agency (JICA) for a term of three and a half years commencing October 2008. The project was implemented to strengthen the capacity of two municipalities, which were Lautoka City (population of 45,000) and Nadi Town (population of 12,700), and Department of Environment (DOE) to promote waste minimisation.
Since the 3R Project was a technical cooperation project with JICA, the emphasis was on building capacity of the Lautoka City Council (LCC) and Nadi Town Council (NTC). This was achieved by identifying project counterparts in both councils to work side-by-side with JICA Technical Experts. Funding for the project activities was provided by JICA whilst LCC/NTC/DOE also allocated some budget for implementation of the project.
The scope of the project included (i) conducting baseline surveys to grasp the existing situation and issues relating to solid waste management, (ii) developing Solid Waste Management Plans for the two municipalities based on baseline data, (iii) implementing pilot projects to examine the applicability, sustainability and expandability of waste minimisation practices such as home-composting, market waste composting, clean schools programme, separate collection for recyclables, and green waste collection and chipping, (iv) improving the operation and management of the Vunato Disposal Site, (v) developing a wide range of educational tools, which were utilised for extensive awareness raising to citizens through house to house visits, community meetings etc., and (vi) expanding viable pilot projects to other areas based on the validity and lessons learnt from the pilot projects.
The following comprehensive and integrated SWM approaches were undertaken as an
attempt to address SWM problems:
A. Baseline survey undertaken to understand the existing situation including SWM SWOT Analysis to assist in developing of waste flow and SWM planning incorporating green waste. (Oct 2008 – May 2009).
Analysis of data obtained from various surveys. Developed Waste Flow (Stream) using baseline data – Current/Projected for each
waste generation source including green waste.

130 | P a g e
B. Preliminary Evaluation
Conducted to determine whether council could implement green waste chipping and recycling service.
Find ways of dealing with Constraining factors/Pre-Conditions: Manpower, Money, Motivation, Management System, Machinery and Materials (6
Ms) for implementation of Green Waste Chipping and Recycling Service. Need for reduction of green waste ( Motivation) Knowledge on green waste generation (Manpower, Expertise, baseline data) Budget for Fuel, Service and maintenance (Money) Availability of wood chipper ( Machinery/Materials) Whether green waste collection service is provided or planned for (Management) Partnership Approach with other departments or agencies
A. Examine Implementation System - Basic concept formulated for Green waste
collection and Chipping Service.
Use of User Pays concept for collection of green waste generated by citizens for purpose of chipping at landfill site.
B. Procurement of Wood Chipper (Sept 2009)
Training by supplier for operators and service/maintenance Company. 250 mm capacity Vermeer wood chipper (BC 1000XL) was procured by JICA at
cost of FJD 112,600.00 through a Local Company ( Niranjans Autoport) from Pacific Marketing Consultants Pty Ltd in Australia.
This wood chipper was manufactured by Vermeer Manufacturing Company, 1210 Vermeer Road East, P O Box 200, Pella, Lowa 50219, USA, Ph: (641) 628-3141, Fax : (641) 621-7734, www.vermeer.com.
Specification of wood chipper is as follows: 1910 Kg in weight, 4.27 m in length, 1. 6m in width, 2.46m in height, 85 hose power engine, diesel operated, 4 cylinder engines, 95 Litre fuel tank capacity, 26 Litre hydraulic tank, sped of 2000 RPM, drum size of 53 cm x 43 cm and 12 volt electrical system.
C. Conduct Awareness Activity (leaflet, media, onsite chipping demonstrations etc.)
D. Implement Green Waste Chipping Service
Regular pruning is conducted by horticulturist for public areas and onsite chipping of green waste is conducted for mulching purposes.
Offsite wood chipping is done for green wastes disposed at the landfill site. Onsite and offsite wood chipping of green waste is also conducted during the
aftermath of cyclones. 650 tons of green waste was chipped after Cyclone Evan in 2012. Increased efficiency from perspective of reduction in haulage costs.
Regular servicing work is carried out to ensure that the wood chipper is operational at all times. It costs an average of FJD 500 – FJD 1,000 per servicing.
Chipping blades also require regular sharpening by saw doctor to ensure that finer and small size wood chips are produced. Worn out chipping blades will produce rough and longer wood chips. The wood chipper is provided with two sets of blades.
Wood chips are used for mulching on council gardens (acts as soil conditioner, eliminates weeds, retains moisture, reduces watering costs, finally returns to soil).
330 tons of wood Chips was also sold as fuel for boiler to FSC. Wood chips used as base material for home composting under home compost subsidy
programme (balance Carbon:Nitrogen ratio and for moisture control). One bag of wood chips is delivered free to citizens upon buying one home composter.

131 | P a g e
Wood Chips used for market composting (balance C:N ratio and as moisture control, yield better quality of compost).
Photo showing normal servicing work carried out on wood chipper by local company
A. Reviewed the progress of Green Waste Recycling System and amend accordingly.
B. Finalised and adopted SWM Plan incorporating reviewed green waste flow based on
comments of stakeholders and lessons learnt from 3R Promotion Activities and
Compiling of weighbridge data of Final Disposal. (Feb 2012).
Types and amount of resources/inputs provided.
Technical Funding – JICA 3Rs Project for procurement of wood chipper (FJD112,600.00) and Multi-Purpose Truck (MPT) – FJD 82, 450.00
Technical Expertise for guidance – JICA 3Rs Project Manpower Fuel Budget for servicing and maintenance
3. Keys for success:
(Indicate recommendations or tips for success)
Training by supplier for workers on operation/maintenance.
Regular servicing and maintenance of wood chipper.
Proper segregation of green waste for effective chipping.
Participation by citizens to discharge green waste for chipping instead of burning or littering.
4. Lessons (good/bad) to share with other PICs:
(Provide lessons learnt both good and bad, to share with other countries)
Bad:
Difficult to maintain wood chipper due to high costs.
Difficulty in meeting targets as most green waste discharged now by citizens is used for firewood.
Good:
Wood chipper can be very effectively used for onsite chipping of green waste after disaster – efficiency from perspective of collection/haulage costs.

132 | P a g e
Wood chips effectively recycled for home composting, market composting and mulching on gardens.
Wood chips when used for composting assists in moisture control, acts as browns for composting, ensures good C:N ratio and yields better quality of compost.
By green waste chipping and mulching, we can effectively prevent the accumulation of such waste in backyards, minimise open burning and littering in public places, and reduce the amount of waste going to the dumpsite.
250 mm wood chipper is more applicable for use in Pacific island countries which can cater for wood trunks up to a diameter of 250 mm and even chip twigs and smaller branches.
5. Move forward:
(Indicate what you can do next or how you can further improve the situation)
Sustain green waste chipping programme.
Regular maintenance of wood chipper.
6. Materials and Resources (List other material(s) to attach, if any, and explain the
content such as manuals, guidelines, etc.
3R Manual of Fiji
PHOTOS
Photo showing Green Waste Collection Photo showing chipping of hurricane waste
Photos showing training by wood chipper supplier of servicing/maintenance company and wood
chipper operators

133 | P a g e
Photo showing wood chips used as mulching Photo showing wood chips used as base
material for market waste composting
Photo showing wood chips used as cover, moisture
control and source of carbon for market waste
composting
Photo showing wood chips supplied by LCC to
citizens to be used as base material for home
composting
Photo showing green waste and wood chips used as base material for home composting

134 | P a g e
ANNEX XI – PROMOTING HOME COMPOSTING Case Study – Procedures and Manual
By Rouhit Karan Singh (Edited by Ma Bella Guinto)
It is estimated through a Waste Amount and Composition Survey (WACS) and based on waste flow that most of the Pacific island countries including Lautoka City Council in Fiji, has 68% potential amount of waste to be turned into compost which includes kitchen wastes, grass, wood, etc. This is equivalent to 1.132 kg/person/day and contributes towards total Municipal Waste generation.
Photo 1: Residents practicing home composting and its benefits
Home Composting have many benefits such as:
Minimise 55% of total Household Wastes and 68% of total Municipal Waste.
Reduce the waste collection and transport costs.
Reduce landfill management and operation costs.
Increase the lifespan of landfill sites.
Promote environmental friendly approach towards cleaner and greener SWM.
Provide better control and minimise indiscriminate disposal, littering in public place (roads, parks, reserves, vacant lands), polluting rivers and creeks, open burning, accumulation of refuse, scattering by dogs and birds etc.
Provide good source of organic fertiliser and reduce the use of artificial fertiliser that have negative health and environmental impacts.
Promote interest in vegetable gardening and reduce food insecurity.
Promote interest in horticulture (pot planting) with financial returns and beautification of environment.
Essential factors to be considered in Home Composting
Before finalising the decision to introduce and promote Home Composting, planning to tackle the constraining factors (pre-conditions) that may arise is to be considered. The use of steps will assist in proper implementation of a Home Composting Programme.

135 | P a g e
Conduct a Preliminary Evaluation
The use of the following checklist will determine whether or not an organisation can implement the Home Composting activities and sustain the same.
Table 1: Pre-conditions that determines the organisations capability to implement home
composting
PRECONDITIONS CATEGORY CHECKLIST
1 Is the organisation in need of minimisation of organic waste (kitchen
waste, grass, garden wastes) generated in household?
Political
Will
2 Has adequate knowledge on the concept, benefits and composting
process which can be imparted to the residents
Knowledge
3 Can establish programme (subsidy) for compost bins to encourage the
residents to acquire bins
Finance
4 Can provide resources for awareness, distribution, installation and
monitoring of compost bins
Human
Resources
Coping with constraining factors
Amount of organic waste generated in the area
The results of the Waste Amount and Composition Survey (WACS) show the potential amount of organic waste generated in a household which can be converted into compost. Based on the figures, around 68% of municipal waste can be recycled if all residents practice home composting.
Need more knowledge on compost?
To acquire basic knowledge on compost, the following section presents some simple steps to start and manage home composting. The procedures serve as a useful guide on how to use compost bins and also explains countermeasures in case of foul odours and insect infestation. With the manual, the users of home compost bins gain basic information on composting and enhance knowledge and experience.
Establish programmes to promote and acquire Home Compost bins
Every organisation who provides effective and efficient waste management services allocate a substantial budget. Considering the amount of waste generated in households and the collection, transport and management costs it is wise to review the current financial status allocated to SWM. If home composting is not considered, there is a possibility that the residents have to bear more costs as the budget allotment for collection and management of wastes will increase. There will be an increase in the waste collection levy or service fee. If home composting is practiced, the quality and frequency of service can be reviewed and savings could be utilised for other activities.
Monitoring of Home Compost bins
It is difficult for the trainers (of the Local Authority) to monitor all the compost bins practiced by the households due to limited human resources and therefore it is suggested to integrate the

136 | P a g e
monitoring work into day-to-day activities. Continuous monitoring is very important as it generates more interest to the users and they maintain the bins in a sustainable way.
Selecting suitable compost method
There are many basic concepts adopted by residents, villages and schools such as in-ground compost, open wooden box, drums, and plastic made containers. All methods have certain advantages and disadvantages over each other and issues such as control of odour, aesthetic view, control of leachate, insect infestation, etc., is to be considered in choosing the suitable method. The cost, affordability and availability of resources are to carefully be considered.
Establish programmes (subsidy) for compost bins
To effectively start a Home Composting Programme, and depending on the type of method to be selected, there are expenses. There is always a question of who will facilitate and bear the costs incurred to procure necessary materials like timber, drums, and plastic containers. It all depends on the budget of the local authority/government (enforcement agency) and the cooperation of the community. In many cases it is encouraged to establish a subsidy programme whereby costs are equally shared between the implementing authority and the community.
Develop an Implementation Plan for Home Composting
In order to successfully implement Home Composting, a budget is to be secured and a plan to action the activity is to be developed. The plan includes the following components:
Goal - what we want to achieve?
Implementation Agency - who is responsible? (Local Authority, Government)
Action/activities - what is to be done and how?
Timeframe - the setting of targets and timelines
Indicator - monitoring and evaluation
Budget - allocation of funds and sustainability
Procurement of Home Composting Bins
Depending on the implementation plan, the regulating authority should procure the necessary number of bins or purchase materials to confirm the delivery and implement the programme in a timely manner. It is recommended to check the bins and materials meet the required specifications.
Awareness Materials
For the purpose of good awareness and effective promotion of home composting activities, the following materials are required:
Home Composting Manual
Application Form
Poster for Subsidy Programme
These materials are subject to amendments according to the capacity of the regulating authority.
Conducting Awareness Activity
Using the developed materials, various forms of awareness and advertising can be carried out for the community which may include:

137 | P a g e
Setting up booth at the front counter or near reception area where public can access information.
House to house visit along with other programmes. Community meetings. Promotion during local and national events (festivals, carnivals, open day). Demonstration in schools (Clean Schools Programme). Advertising through local newspaper. Radio and TV programmes.
Distribution of Home Compost bins
The Home Composting activity can be sustained if the regulating authority manages the programme systematically. It should keep proper records by ordering the necessary number of bins, storage and conducting awareness.
The residents to submit APPLICATION FORM. Council to provide and install COMPOST BIN with LEAFLET. Council to conduct 1st MONITORING to check the installation and usage. Council to conduct 2nd MONITORING to provide advice if there are any challenges.
Conduct monitoring of Compost bins
The regulating authority should develop a monitoring plan by allocating staff, and set a timeframe and schedule of monitoring. It is preferable to monitor the conditions of compost bins over three months in order to ascertain that the community is using the bins properly. At times due to the lack of human resources, monitoring becomes difficult and therefore providing other means of communication through emails, telephones, etc., becomes more convenient to give advice and instructions and have proper feedback from residents.
Review the progress of home composting activity to amend (if necessary)
The regulating authority should develop a database for an effective and sustainable home compost programme which includes:
Basic information of those who own the compost bins (name, location, contacts).
Record of the number of bins sold (estimate target for the year).
Results of monitoring.
Based on the above database, it is recommended to develop monthly reports to be considered by
the organisations management, Ministry and other interested stakeholders to share the progress
and challenges. The Home Composting programme should be re-examined and reviewed
periodically in order to achieve the results. It will also give opportunities to promote other practical
and cost effective methods.
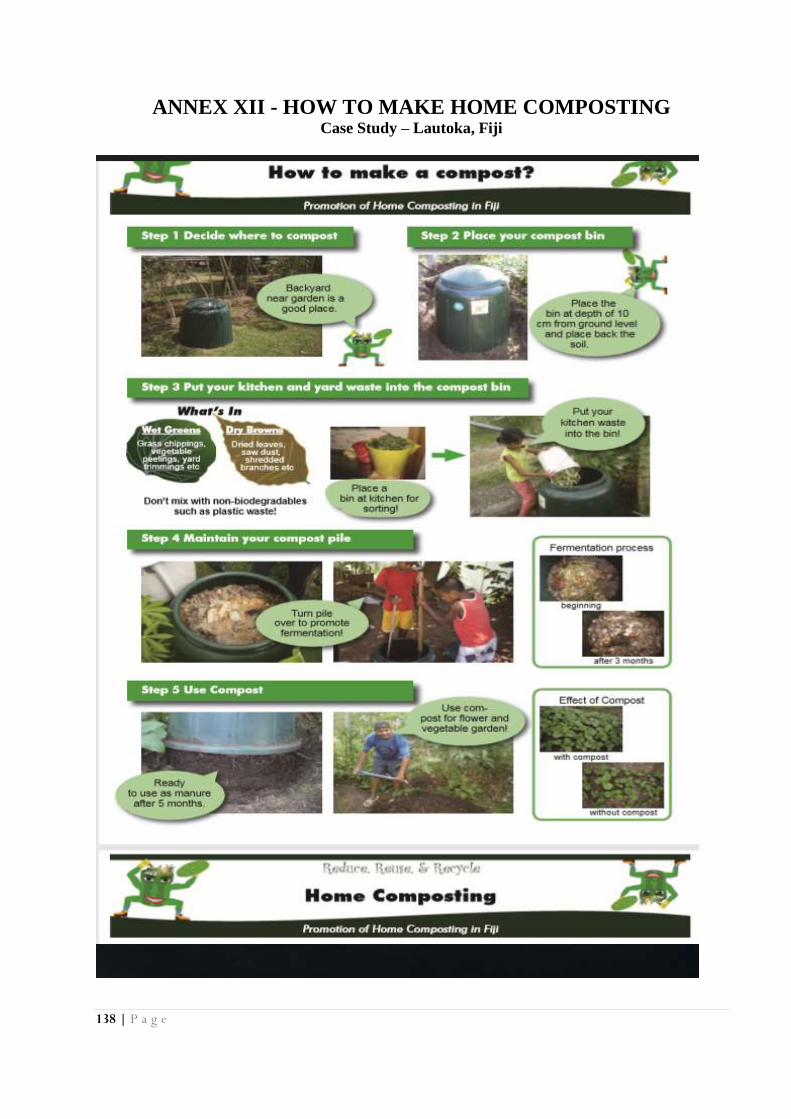
138 | P a g e
ANNEX XII - HOW TO MAKE HOME COMPOSTING Case Study – Lautoka, Fiji
139 | P a g e
ANNEX XIII - MARKET COMPOSTING PROJECT Case Study – Port Vila, Vanuatu
By Roger Tary (Edited by Shiro Amano)
In Pacific island countries, our local markets are another waste stream that generates much of our green and organic waste. Some council policies allow farmers and vendors to bring their products and clean them at the market area thus making it more difficult for the market management to manage waste in a proper manner.
In the case of Port Vila, Vanuatu, the main market which is owned by the council generates 11.5 tons of green/organic waste per day. As the market operates six days a week, it is expected that the weekly generation rate would be around 69 tons of green/organic waste that ends up at the landfill every week.
The market is located in the centre of the city, and attracts the general public as well as tourists and visitors. Contributing to the generation rate, the inter-island shipping vessels which provide regular services to and from the islands, bring in farmers to sell their products at the city market, thus generating more waste. Adding to the waste generated from the market, this represents over 3,588 tons per year, taking up space at the landfill, and with the increasing amount of other waste generated from households and businesses the landfill is filling up rapidly.
Why Implement Market Waste Compost
As the markets are situated in the centre of the city or in a suitable location accessible to the general public, tourists and visitors, it is very important to properly dispose of market waste, to maintain a clean and safe environment.
In the past there were heaps of waste around the market compound causing bad smells that attract flies, cockroaches and rats, which can cause harmful health hazards to human life. The negative environmental impact from improper and uncontrolled waste management at the market site is a threat to the staff, farmers, vendors, general public, tourists and visitors who are directly exposed to the bad hygiene and the environment of the market area. There is a need to address the market waste management issues and explore solutions for improvement.
Objective of the Market Waste Compost
To take appropriate action and measures to improve the market waste management and apply and implement good waste management practices.
To improve health and hygiene at the market and its surroundings and to offer a safer and healthier environment for the market staff, farmers, vendors, general public and visitors.
To reduce the amount of organic waste generated by the market and ending up at the landfill, which will contribute to a significant expansion of the life span of the landfill.
To introduce and implement the concept of 3R’s plus return for organic waste for farming purposes, and recycle as much as possible other recyclable waste items.
To promote organic composting by encouraging the vendors, farmers and the general public to apply home or backyard composting. The compost can be re-used in backyard gardening which is very good as it will act as fertiliser or soil conditioner to re-enrich the soil.
How to implement this Market Waste Compost
Due to limited resources, in terms of human resources in Solid Waste Management, such as materials and equipment, it was decided to implement this activity under a Public and Private Partnership Programme (PPP).
140 | P a g e
A private local company by the name of Rainbow Garden, which is involved in the floriculture activities and botanical garden, has a close working relationship with the council on a similar activity. The Project Team decided to approach the management of the company and to re-establish this working relationship, under the Market Waste Compost Project. With good consultation efforts and collaboration with the company’s management, the Project Team had re-established this working partnership for the Market Waste Compost Project, and reached an agreement for the company to receive the organic waste. With limited human resources in Solid Waste Management, it was agreed to implement the Market Waste Compost under the following resolutions:
1. The Market Management is responsible to move the organic waste to the company’s farm which is the compost site.
2. The Market Management provides the transportation which means the vehicle available to
move the organic waste from the market to the compost site.
3. The Market Management must make sure that only green and organic wastes are moved to the compost site and not to include mixed waste.
4. The company will provide a vehicle in the future for the transportation of organic waste.
The Project Team also had discussions with other stakeholders and partners and managed to receive positive feedback where the Petroleum Company agreed to assist the project initiative by donating 12 x 44 gallons drums to start the activity. The 12 – 44 gallons drums were used to put in green and organic waste ready for transportation. The drums were designed by Wan Smol Bag Theatre (a local NGO group – another stakeholder in the Project) with educative signs such as Green and Organic Waste Only, Aluminum and Metal Cans and Other Waste.
Start of Pilot Phase
At the launching ceremony, the invited guests demonstrated to the farmers, vendors and the public how to separate the waste and place them into the designated drums. This demonstration (separation of waste) at the launching ceremony is a very good activity to educate the farmers and vendors on how to properly separate and place the waste into the designated drums. Market Management staff also participated in and carried out their responsibilities in separating the waste at the designated discharge point. Sign boards were placed at certain areas of the market as a tool to educate the farmers and vendors on how to separate the waste and the designated discharge area or point.
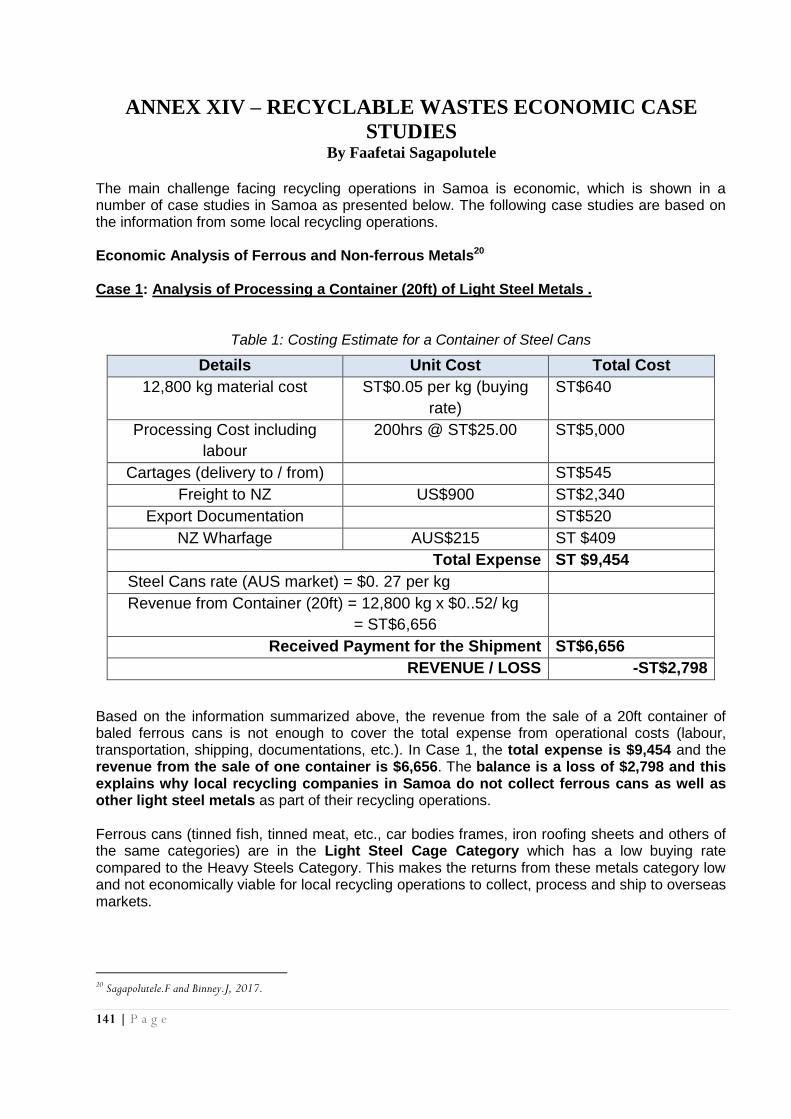
141 | P a g e
ANNEX XIV – RECYCLABLE WASTES ECONOMIC CASE
STUDIES By Faafetai Sagapolutele
The main challenge facing recycling operations in Samoa is economic, which is shown in a number of case studies in Samoa as presented below. The following case studies are based on the information from some local recycling operations. Economic Analysis of Ferrous and Non-ferrous Metals20 Case 1: Analysis of Processing a Container (20ft) of Light Steel Metals .
Table 1: Costing Estimate for a Container of Steel Cans
Details Unit Cost Total Cost
12,800 kg material cost ST$0.05 per kg (buying
rate)
ST$640
Processing Cost including
labour
200hrs @ ST$25.00 ST$5,000
Cartages (delivery to / from) ST$545
Freight to NZ US$900 ST$2,340
Export Documentation ST$520
NZ Wharfage AUS$215 ST $409
Total Expense ST $9,454
Steel Cans rate (AUS market) = $0. 27 per kg
Revenue from Container (20ft) = 12,800 kg x $0..52/ kg
= ST$6,656
Received Payment for the Shipment ST$6,656
REVENUE / LOSS -ST$2,798
Based on the information summarized above, the revenue from the sale of a 20ft container of baled ferrous cans is not enough to cover the total expense from operational costs (labour, transportation, shipping, documentations, etc.). In Case 1, the total expense is $9,454 and the revenue from the sale of one container is $6,656. The balance is a loss of $2,798 and this explains why local recycling companies in Samoa do not collect ferrous cans as well as other light steel metals as part of their recycling operations. Ferrous cans (tinned fish, tinned meat, etc., car bodies frames, iron roofing sheets and others of the same categories) are in the Light Steel Cage Category which has a low buying rate compared to the Heavy Steels Category. This makes the returns from these metals category low and not economically viable for local recycling operations to collect, process and ship to overseas markets.
20 Sagapolutele.F and Binney.J, 2017.

142 | P a g e
Case 2: Analysis of Processing a Container (20ft) of Non-Ferrous Cans
Table 2: Cost Estimate for a Container (20ft) of Aluminium Cans
Details Unit Cost Total Cost
11,520 kg material cost ST$0.20 per kg (buying rate) ST$2,304
Processing Cost including labour
200hrs @ ST$25.00 ST$5,000
Cartages (delivery to/from) ST$545.80
Freight to NZ US$900 ST$2,340
Export Documentation ST$520
NZ Wharfage NZ$215 ST$409
Total Expense ST$14,574
Aluminum Cans Rate21 (Australia market) = NZ$0. 70 per kg
Revenue from Container (20ft) = 11,520 kg x ST$1.30/kg = ST$14,976
ST$14,976
Received Payment for the Total Shipment ST$14,976
REVENUE / LOSS ST$402
Table 2 shows the analysis of processing and shipping a 20ft container of baled aluminium cans to Australia. Based on the information in table 2, the revenue earned is not much about ST$402, but it is better than nothing. One way to increase the revenue is to eliminate or reduce other expenses such as the buying of cans from people by establishing their own collection systems. E.g. Placing recycling cages at public areas, schools and others to recover and collect cans free of charge. This would save the ST$2,304 spent on the purchase of empty cans. This type of practice is useful for local companies to survive.
A collection cage for aluminum cans at a Bus Station in Apia, Samoa
21 http://www.currentscrapmetalpricesperpound.com/scrap-metal-prices-new-zealand.php