march 2007 presentation to: regarding an evaluation of
TRANSCRIPT

March 2007
Presentation to:Presentation to:
Regarding an Evaluation ofRegarding an Evaluation of

Table of Contents
1. Executive Summary
2. GSN Business Plan Review
3. Discussion of Liberty Case
4. Discussion of SPE Case
5. Discussion of Major Strategic Case
6. GSN Valuation Analysis
Exhibits
A. Precedent Transaction Analysis – Casual Games
B. Precedent Transaction Analysis – International Cable Networks
C. Overview of Fun Technologies
D. Alternative WACC Analysis

Executive SummaryExecutive Summary

Executive Summary
Introduction Salem Partners LLC is pleased to present to Sony Pictures Entertainment (“SPE”) a valuation
of Game Show Network, LLC (“GSN” or the “Company”).
Salem Partners was engaged by SPE to render the following services:
a) Review certain due diligence materials, including documentation supplied by the Company regarding its financial history, affiliate contracts, programming commitments and advertisers.
b) Evaluate the Company’s financial plan.
c) Estimate the value of revenue growth or cost savings opportunities that might arise in connection with a merger of GSN into Liberty Media Corporation (“Liberty”).
d) Provide estimates of value for GSN on a standalone basis as well as under Liberty ownership.
SPE Management has also verbally requested that we focus particular attention on GSN’s new businesses related to digital media and audience participation-based linear programming.
In order to compare the value of GSN in an acquisition by Liberty to that in an acquisition by SPE, we have also taken into account potential cost savings, synergies and risk to affiliate status under SPE’s ownership. Cost savings opportunities have been provided by SPE Management.
1

Executive Summary
Introduction (Continued) Salem Partners has also analyzed two other scenarios.
The first reflects the value implied if GSN achieved the financial performance projected by Management.
The second reflects the potential value achievable in a sale to a major cable network owner such as Viacom, Time Warner, Fox, Comcast, NBC/Universal, or Scripps (“Major Strategics”).
2

Executive SummarySummary of Projection Scenarios and Valuation The following chart sets forth a summary of major business plan assumptions and valuation as of January 1, 2007
under five different scenarios.
Note: Range for traditional linear business assumes a 10% to 12% discount rate and a 10.5x to 14.5x exit multiple. Note: Range for online and participation businesses assumes a 35% to 42% discount rate and a 10.5x to 14.5x exit multiple. Note: Valuation assumes a 38% tax rate and mid-year convention.Note: Uses 2006 average subscriber figures.(1) Online valuation based on comparable company transactions and precedent transactions. Online valuation for Liberty Case includes cost savings to Fun Technologies.
“Liberty Case”
“Management Case”
Base Case except for: Higher ratings assumptions 100% reduction in ad sales, affiliate
sales, and marketing expenses 50% reduction in G&A
($ in millions)
Valuation Range as of January 1, 2007
Participation BusinessOnline Business(1)Traditional Linear Business
Base Case projections except for: Lower expense structure due to
consolidation into SPE
“SPE Case”
$33$19$40$30$505$366Liberty Revenue Enhancement Case Base Case except for:
Higher ratings assumptions
Liberty Full Consolidation Case Includes revenue synergies and assumes full
consolidation
$33$19$32$25$372$273 Management projections except for: Lower projected advertising and affiliate
sales growth Increase in participation expense Salem Partners’ online model replaces
Management’s
“Base Case”
HighLowHighLowHighLowMajor Assumptions
International Opportunity
$56$37
$0$0
HighLow
Total
$634$452
$437$317
HighLow
$33$19$40$30$547$397 $56$37 $676$483
$4.98 to $6.79 per sub
$6.72 to $9.23 per sub
$7.26 to $9.99 per sub
$33$19$32$25$471$345 $0$0 $536$389
$6.31 to $8.60 per sub
“Major Strategic
Case”
$33$19$32$25$865$631 $56$37 $986$712
$11.51 to $15.80 per sub
$40$24$34$29$682$493 $0$0 $756$546
$9.00 to $12.45 per sub
Management projections Compares to over $1 billion in value three
years ago, reflecting lower expectations for business by Management
3

Executive Summary
Valuation Methodology We have been instructed to value GSN objectively.
Valuation is intended for internal SPE use and was not prepared as a negotiating tool for use with Liberty.
Salem Partners would be pleased to revise and reconsider our analysis in connection with SPE’s negotiation with Liberty.
Traditional Linear Business Salem Partners has relied primarily on a discounted cash flow analysis to value GSN’s linear
channel. This methodology is consistent with the approach utilized by potential buyers in recent
cable channel acquisitions. Per subscriber values have been computed from DCF valuation to provide context and
assess overall reasonableness. However, the dearth of comparable recent transactions and the substantial recent change in the business environment causes a valuation based primarily on per subscriber values to be less reliable.
GSN’s current position on the subscriber and revenue growth curve makes an analysis based on cash flow multiples unreliable.
4

Executive Summary
Valuation Methodology (Continued)
Online Business GSN's online business is valued through an analysis of comparable publicly traded
companies and precedent transactions, together with a discounted cash flow analysis. Synergies from a combination with Fun Technologies is valued on a discounted cash flow
basis utilizing a range of discount rates of 35% to 42% for consistency.
Participations GSN’s participations business is valued on a discounted cash flow basis utilizing a range of
discount rates of 35% to 42% to reflect higher risk and expected returns of the business.
International Opportunity The value of the international opportunity was derived by analyzing the values implied by
analyzing comparable public companies and precedent transactions to arrive at a range of potential values that could be created internationally by GSN. The valuation ranges relevant to each ownership case have been discounted back to the
present assuming a 5-year time frame in which such businesses could be built.
5

Executive Summary
GSN Business Plan Review – Base Case versus Management Case
Item Revision made
Comment
Traditional Linear Network Affiliate Revenue Lowered
Company has projected increases in subscribers and license fees. Given distribution environment, subscriber fee growth reduced to a CAGR of 3.0% rather than the 6.6% CAGR GSN Management is projecting.
Advertising Revenue Lowered Company has projected increases in CPMs, ratings and subscribers. Given historical ratings performance and likelihood of increasingly weak channel positioning as a standalone channel, we have estimated ratings to stay flat rather than increase at the 11.0% CAGR GSN Management is projecting.
Online Business Lowered Company has projected that 20% of unique visitors subscribe at $4.85 per month, which is an increase from 0.46% and 1% of uniques in 2006 and 2007E, respectively. We have revised the subscription percentage to grow to 10% in 2011. Further, we believe Management’s expectations of non-GSN viewer visitors is conservative compared to other similar business plans. On balance, the reduction in subscriber growth, along with a reduction in download conversion and video viewings, lowers financial results. Valuation is based on venture capital expected rates of return, comparable company analysis and precedent M&A transactions.
Participation Business Increased expense
Company has projected an 89% increase in participation revenue over the next five years. However, the Company has not projected prize money to grow proportionately with the participation rate and revenue. Salem Partners has projected prize money per winner to increase 45% over the next five years. Management projected this variable to increase 20% over the next five years. This adjusts the prize money CAGR up to 89%, in line with revenue projections. Valuation is based on venture capital expected rates of return to reflect higher business risk.
Cost Structure No change Management’s projected expense items appeared to be reasonable considering historical costs and industry analysis of other channels.
6

Executive Summary
Overview of Revenue Enhancement Opportunities and Cost Savings The following chart presents a more detailed review of the potential revenue enhancement opportunities
and cost savings for GSN under 100% Liberty ownership, 100% SPE ownership and under the ownership of a major strategic.
Liberty Case SPE Case Major Strategic Case
Advertising Revenue Increase/Decrease
19% increase in 2008 (35% increase in national ad revenue) due to cross promotional opportunity of Liberty channels.
9% increase in 2009-2011 due to ratings impact of security of channel positioning.
Few revenue enhancement opportunities identified.
Possibility of revenue decrease due to ratings impact of weakening channel positioning.
23% increase in 2008 (45% increase in national ad revenue) due to cross promotional opportunity of Major Strategic channels.
9% increase in 2009-2011 due to ratings impact of security of channel positioning.
Affiliate Revenue Increase/Decrease
Consistent with Base Case. Consistent with Base Case. Consistent with Base Case.
International Network Opportunity
Utilize Chellomedia and Liberty Global to expand GSN internationally.
None, as instructed by SPE Management.
Leverage other international assets to roll out GSN internationally.
Cost Savings/Increases In Liberty Revenue and Cost Savings Case: 25% decrease in G&A. 50% headcount reduction in finance. 100% headcount reduction in HR. 20% decrease in affiliate sales cost. 50% cost reduction in facilities. 10% cost reduction in network operations. Severance costs equal to 50% of 2008
salaries. Moving costs incurred of $1 million. Lease breakage equal to one year’s rent.
Significant due to consolidation within SPE Los Angeles operation.
10% decrease in marketing. 61% decrease in ad sales cost. 25% decrease in G&A. Severance costs equal to 50% of annual
salaries of terminated employees. Moving costs incurred of $1 million for
incidentals.
100% decrease in marketing with the exception of media spending.
100% decrease in ad sales cost. 100% decrease in affiliate sales cost. 50% decrease in G&A. Severance costs equal to 50% of
annual salaries of terminated employees.
Moving costs incurred of $1 million for incidentals.
Increase in FUN Technologies value
Liberty can use FUN as a skill game tracking stock and drive valuation increase through a contractual arrangement with FUN.
Zero Zero
7

Notes: Queer Eye for the Straight Guy premiered on Bravo in July 2003 (T+8).
Notes: Beach Patrol: Miami Beach premiered on Court TV in July 06 (T+2).
Notes: 'Til Death Do Us Part premiered on Court TV in April 06 (T-1).
Notes: Las Vegas Law premiered on Court TV in February 06 (T-3).
Notes: The Chapelle Show premiered on Comedy Central in November 03 (T+7).
Notes: Each data point represents one month.
Executive Summary
Potential Ratings Increase due to Liberty Acquisition The chart below illustrates the ratings increase that occurred when Bravo, Comedy Central and Court TV
were acquired by NBC, MTV Networks and Time Warner, respectively. These transactions represent recent consolidations of formerly independent channels into major
media companies. We believe that cross promotion was a primary driver of the ratings increases.
Ratings Increase Due to Acquisition
0.10
0.20
0.30
0.40
0.50
0.60
0.70
0.80
T-9 T-8 T-7 T-6 T-5 T-4 T-3 T-2 T-1 0 T+1 T+2 T+3 T+4 T+5 T+6 T+7 T+8 T+9 T+10 T+11 T+12 T+13 T+14 T+15 T+16 T+17 T+18 T+19 T+20
Bravo Comedy Central Court TV
Acquisition Date
0.75
0.46
0.30
24
-Ho
ur
Nie
lse
n R
ati
ng
s
8

Executive Summary
Other Transactional Considerations We believe SPE should consider a number of other issues in preparation for negotiations with
Liberty and in making its ultimate buy/sell/hold decision.
Almost every major GSN affiliation agreement is either expired or will expire in 2007. We believe this factor presents significant risk to the business plan if the current
ownership of the Company is maintained or if SPE acquires 100% of the Company. We believe GSN’s affiliate status will be more stable under Liberty ownership due to
Liberty’s significant stake in DirecTV.
Liberty has shown in the past the willingness to utilize distribution leverage in mergers and acquisitions negotiations. Liberty or its predecessors have threatened the affiliate status of networks, even those in
which it maintains significant ownership, to force other owners of that business to sell their stake at a lower price.
9

Executive Summary
Other Transactional Considerations (Continued) From our conversations with GSN Management, we believe Liberty is enthusiastic about the
prospects for GSN and GSN.com to become large and dominant platforms for cash skill games. Certain value from cash skill games is included in the linear channel valuation. Identifying the incremental value Liberty might attribute to the opportunity has proven to
be difficult.
Although we have projected significant revenue enhancement opportunities for GSN under 100% Liberty ownership, such opportunities would have even greater potential if Liberty purchased Rainbow Media Holdings, which is rumored to be a possibility.
As reflected in the Major Strategic Case, we believe it is possible that the highest value for GSN would be in a sale of 100% of the Company to a party other than either SPE or Liberty. In a sale to Liberty, SPE should propose receiving a premium comparable to such a
scenario.
10

Executive Summary
Other Transactional Considerations (Continued) Liberty Management has communicated to the market that it intends to consolidate its holdings in an effort
to become more of an operating company and effect a simpler organizational structure. We believe an additional source of value for Liberty in a transaction involving GSN is the potential
transaction’s indication to the marketplace that the consolidation plan is viable. Liberty has not been able to consolidate 100% ownership of partially-owned subsidiary in quite some
time. Such an event could cause an increase in Liberty’s stock price that is disproportionate to the intrinsic
value created by its ownership of 100% of the Company.
Research Company Date Research Analyst Commentary
Bear Sterns 11/6/06 Robert S. Peck “With more than adequate liquidity on its balance sheet, outside share repurchases, we think it is likely the company could pursue strategic acquisitions to achieve synergistic leverage with its existing commerce platforms. We continue to remain bullish on the LINTA story while looking for further clarity on usage of liquidity/acquisitions.”
Citigroup 10/5/06 Jason Bazinet “We think Liberty will further exchange its passive stakes in other media companies (Time Warner, CBS, and Viacom) for assets that fit strategically with DIRECTV, allowing Liberty to emerge as a vertically integrated media company. Even though Liberty may acquire DIRECTV at $20 per share (its intrinsic value is $18), we find the savings from avoided taxes and a lower conglomerate discount would result in a share price of $101.”
Bear Stearns 8/9/06 Robert S. Peck “The shares are trading at a 23% discount to the net asset value, primarily reflecting the risks inherent in the complex capital structure, in our opinion. As the segment continues to deliver significant free cash flows and there is additional visibility into integration of recently acquired businesses (Provide Commerce & BUYSEASONS, Inc.), the use of cash for acquisitions (that could drive further growth) or for share repurchases (await for quarterly updates from Management on this front), as well as clarity on the potential tax liabilities, we think there is significant scope for multiple expansion.”
Jefferies 8/9/06 Robert G. Routh “As far as growth is concerned, Management said it plans to grow LINTA both organically as well as through strategic acquisitions and equity shrink as mentioned above. Dr. Malone also noted on the call that although now LINTA gets little value for them, eventually he would like LINTA to own and control both Expedia and InterActiveCorp, two entities now controlled by Barry Diller. He mentioned that long term these are strategic operations for LINTA and that the one year anniversary of the split off of Expedia from IACI is coming up, causing Morris Trust limitations to be ending and allowing for an aggressive restructuring of both companies, something he sees as happening in the not too distant future….we like the story, the stock’s visibility and cash flow generating capability.”
Jefferies 8/9/06 Robert G. Routh “We continue to think that the opportunity to combine QVC with HSN makes sense, and would simplify the overall company, which would reduce the holding company and tracking stock discount currently ascribed to the shares.”
11

Executive Summary
Information Reviewed/Collected In connection with this assignment, Salem Partners has reviewed:
Summaries of affiliation agreements between MSOs and satellite service providers and GSN.
Historical and projected subscriber information for GSN. Historical and projected license fee information for GSN. Historical and projected ratings information for GSN. Historical and projected financial information for GSN from 2003 through 2011. Schedule of programming commitments. Summary of top 10 advertisers. FUN Technologies and Game Trust agreements with GSN. Wall Street and industry research regarding long term advertising and affiliate revenue
growth rates. Industry research on online CPMs and unique visitor long term growth rates. Unique visitors of comparable online websites. Participation rates of comparable networks with participation revenue. Publicly available financial information regarding precedent change of control
transactions of US and international cable networks and online gaming companies. Ratings data for previously acquired networks. Publicly available financial information regarding publicly-traded US and international
cable network companies and online gaming sites.
12

Executive Summary
Information Reviewed/Collected (Continued) In addition, Salem Partners has conducted numerous due diligence sessions with GSN
Management to confirm information provided and assess the reasonableness of the GSN plan.
We have conducted discussions with numerous cable and cable network industry executives to assess certain qualitative elements of both the market environment for cable networks overall and that of independent cable channels in particular.
We have conducted discussions with numerous analysts and online gaming company executives to analyze and construct a plan for GSN.com that we believe reflects market expectations of similar opportunities.
We have conducted discussions with several international cable executives in order to analyze the opportunities for GSN outside of the United States.
We have compiled and analyzed available market data and projections for the cable network industry.
13

Executive Summary
Qualifications
This Report is subject in all respects to the following qualifications: This Report is intended only to provide a potential valuation of GSN, as defined herein, and expresses
no opinion as to the ability of GSN to fund any of its current obligations or to the solvency of GSN. This Report may only be used in connection with the matter of SPE, as defined in the engagement
letter dated February 14, 2007 (the “Engagement Letter”). This Report may not be summarized, excerpted from or otherwise used, made available to any other
third parties, other than to SPE, or publicly referred to, without the prior written approval of Salem Partners.
In arriving at the valuation presented in this Report, Salem Partners has not conducted a physical inspection of the properties and facilities of GSN and has not made, obtained or assumed any independent evaluations or appraisals of any such properties and facilities or of the assets or liabilities of GSN and have not assumed any responsibility or obligation to do so.
Salem Partners has taken into account our assessment of general economic, market and financial conditions and our experience in similar transactions, as well as our experience in valuation in general. The report necessarily is based upon conditions as they exist and can only be evaluated on the date hereof.
In arriving at a valuation, we have not considered the value that SPE, its shareholders or creditors may be able to obtain in a liquidation of GSN. The analysis of GSN as presented herein represents only the “fair market value” of a 100% ownership and controlling interest in GSN. The term “fair market value” as used herein, is defined as the amount at which the aggregate asset would change hands between a willing buyer and a willing seller, each having reasonable knowledge of all relevant facts, neither being under any compulsion to act, with equity to both. The projected cash flows also do not take into account any impact on the value of GSN due to the success of SPE’s or Liberty’s other activities.
14

Executive Summary
Qualifications (Continued) In our preparation of the Report, Salem Partners has relied upon the accuracy and completeness of
the financial and other information supplied to or otherwise used by it, has further relied upon the assurances of Management of the Company that they are not aware of any facts or circumstances that would make such information inaccurate or misleading, and shall not be obligated to attempt independently to verify, or undertake any obligation to verify, such information.
We express no opinion as to the value of GSN going forward. Developments subsequent to the date of this Report may affect the value of GSN and we do not have any obligation to update, revise or reaffirm this Report.
Salem Partners has reviewed unaudited financial information from SPE regarding GSN, and does not make any assumptions regarding the potential results of an audit.
Salem Partners shall be entitled to assume, and shall not be obligated to attempt independently to verify, or undertake any obligation to verify, that forecasts and projections supplied to it by the Management of SPE or GSN represent the best current judgments of such parties as to the future revenues to be received from and expenses associated with operation of GSN, and shall be entitled to assume that such forecasts and projections have been reasonably prepared based on such current judgment; provided, however, this reliance by Salem Partners does not eliminate its obligations under the Engagement to perform any and all tasks required to provide the Report. The Company will promptly notify Salem Partners if it learns of any material inaccuracy or misstatement in, or material omission from, any information provided to Salem Partners.
As compensation for its services rendered pursuant to this Report, Salem Partners has been or will be paid a cash fee and will be indemnified against certain liabilities that may arise as a result of its engagement and this Report. Salem Partners has not received any other compensation for investment banking services from the SPE, Liberty or GSN in the past five years.
15

GSN Business Plan ReviewGSN Business Plan Review

GSN Business Plan Review
Financial Overview The chart below sets forth historical and projected financial results for GSN as provided by
GSN Management (the “Management Case”).
($ in 000)For the Years Ended December 31, Projected for the Years Ending December 31,
2001A 2002A 2003A 2004A 2005A 2006A 2007E 2008E 2009E 2010E 2011E
RevenueAd Revenue (Net) $25,626 $33,518 $43,851 $49,742 $58,076 $62,292 $68,207 $78,189 $90,719 $106,364 $126,536Affiliate Revenue 33,711 39,800 44,576 53,066 58,763 61,483 66,994 74,312 82,901 91,943 102,445Participation Revenue 0 0 0 0 0 711 11,149 14,669 19,734 26,781 36,111Online Revenue 0 0 0 0 229 801 4,036 9,638 20,182 36,416 60,231Casino Revenue 0 0 0 0 375 710 1,000 1,450 1,850 2,250 2,500Other Revenue 8 27 31 34 118 626 811 1,224 1,741 2,625 3,796
Total Gross Revenue $59,345 $73,345 $88,458 $102,842 $117,561 $126,623 $152,197 $179,481 $217,128 $266,379 $331,619Launch Support Amort (22,008) (20,031) (12,813) (15,287) (14,449) (11,634) (6,865) (172) 0 0 0Online Revenue Share 0 0 0 0 (77) (296) (1,739) (3,721) (8,163) (14,953) (24,940)
Total Net Revenue $37,337 $53,314 $75,645 $87,555 $103,035 $114,693 $143,592 $175,588 $208,964 $251,426 $306,679
Operating CostsProgramming $21,368 $16,979 $26,713 $33,749 $39,393 $36,909 $41,247 $43,866 $50,903 $56,432 $62,009Participation Expense 0 0 0 0 0 859 8,432 9,041 9,937 11,074 12,489Network Operations 2,566 4,233 4,458 3,412 3,203 3,398 3,649 3,855 4,074 4,308 4,557Online/Interactive 714 2,795 4,050 4,370 5,295 6,375 8,748 9,109 9,640 10,478 10,751Marketing 5,018 15,670 14,157 26,421 24,421 25,520 26,015 27,377 28,828 30,377 32,031Ad Sales 4,692 5,410 6,084 6,012 6,533 6,823 7,509 8,104 8,938 9,652 10,425Affiliate Sales 3,298 5,953 4,947 3,220 4,444 4,795 4,837 4,711 5,009 5,327 5,671Gen & Admin 16,273 13,189 14,608 12,041 12,483 13,801 16,009 17,181 18,715 19,948 21,269
Total Operating Costs $53,929 $64,229 $75,017 $89,225 $95,772 $98,479 $116,446 $123,243 $136,045 $147,596 $159,201
EBITDA ($16,592) ($10,915) $628 ($1,670) $7,263 $16,214 $27,147 $52,345 $72,920 $103,830 $147,478
Other Inc/(Exp) (756) (872) (1,104) (1,116) (237) (215) 32 60 453 661 969
Net Income ($17,348) ($11,787) ($476) ($2,786) $7,026 $15,998 $27,178 $52,405 $73,373 $104,492 $148,447
16

GSN Business Plan Review
Financial Overview (Continued) The chart below sets forth our Base Case assumptions for GSN.
($ in 000)For the Years Ended December 31, Projected for the Years Ending December 31,
2001A 2002A 2003A 2004A 2005A 2006A 2007E 2008E 2009E 2010E 2011E
RevenueAd Revenue (Net) $25,626 $33,518 $43,851 $49,742 $58,076 $62,292 $65,340 $71,114 $77,619 $84,853 $93,249Affiliate Revenue 33,711 39,800 44,576 53,066 58,763 61,483 65,300 71,203 75,834 80,706 86,443Participation Revenue 0 0 0 0 0 711 11,149 14,669 19,734 26,781 36,111Online Revenue 0 0 0 0 229 801 3,132 9,163 18,403 32,634 55,680Casino Revenue 0 0 0 0 375 710 1,000 1,450 1,850 2,250 2,500Other Revenue 8 27 31 34 118 626 813 1,229 1,756 2,656 3,865
Total Gross Revenue $59,345 $73,345 $88,458 $102,842 $117,561 $126,623 $146,734 $168,827 $195,196 $229,880 $277,848Launch Support Amort (22,008) (20,031) (12,813) (15,287) (14,449) (11,634) (6,865) (172) 0 0 0Online Revenue Share 0 0 0 0 (77) (296) (1,261) (3,397) (7,085) (12,796) (22,221)
Total Net Revenue $37,337 $53,314 $75,645 $87,555 $103,035 $114,693 $138,608 $165,258 $188,111 $217,084 $255,627
Operating CostsProgramming $21,368 $16,979 $26,713 $33,749 $39,393 $36,909 $41,205 $43,775 $50,722 $56,137 $61,565Participation Expense 0 0 0 0 0 859 8,599 9,483 10,818 12,641 15,107Network Operations 2,566 4,233 4,458 3,412 3,203 3,398 3,649 3,855 4,074 4,308 4,557Online/Interactive 714 2,795 4,050 4,370 5,295 6,375 8,748 9,109 9,640 10,478 10,751Marketing 5,018 15,670 14,157 26,421 24,421 25,520 26,015 27,377 28,828 30,377 32,031Ad Sales 4,692 5,410 6,084 6,012 6,533 6,823 7,502 8,097 8,931 9,644 10,417Affiliate Sales 3,298 5,953 4,947 3,220 4,444 4,795 4,833 4,703 4,991 5,299 5,631Gen & Admin 16,273 13,189 14,608 12,041 12,483 13,801 16,009 17,181 18,715 19,948 21,269
Total Operating Costs $53,929 $64,229 $75,017 $89,225 $95,772 $98,479 $116,560 $123,579 $136,720 $148,833 $161,329
EBITDA ($16,592) ($10,915) $628 ($1,670) $7,263 $16,214 $22,048 $41,680 $51,392 $68,251 $94,298
Other Inc/(Exp) (756) (872) (1,104) (1,116) (237) (215) 32 60 453 661 969
Net Income ($17,348) ($11,787) ($476) ($2,786) $7,026 $15,998 $22,080 $41,740 $51,845 $68,913 $95,267
17

GSN Business Plan Review
Financial Overview – Management Case versus Base Case The chart below sets forth the differences between Management’s projected financial results
and the Base Case assumptions for GSN.
($ in 000)For the Years Ended December 31, Projected for the Years Ending December 31,
2001A 2002A 2003A 2004A 2005A 2006A 2007E 2008E 2009E 2010E 2011E
RevenueAd Revenue (Net) $0 $0 $0 $0 $0 $0 ($2,867) ($7,075) ($13,101) ($21,511) ($33,287)Affiliate Revenue 0 0 0 0 0 0 (1,694) (3,109) (7,067) (11,237) (16,002)Participation Revenue 0 0 0 0 0 0 0 0 0 0 0Online Revenue 0 0 0 0 0 0 (904) (474) (1,779) (3,782) (4,551)Casino Revenue 0 0 0 0 0 0 0 0 0 0 0Other Revenue 0 0 0 0 0 0 2 5 15 32 69
Total Gross Revenue $0 $0 $0 $0 $0 $0 ($5,463) ($10,654) ($21,931) ($36,499) ($53,771)Launch Support Amort 0 0 0 0 0 0 0 0 0 0 0Online Revenue Share 0 0 0 0 0 0 479 324 1,078 2,157 2,719
Total Net Revenue $0 $0 $0 $0 $0 $0 ($4,984) ($10,329) ($20,853) ($34,342) ($51,052)
Operating CostsProgramming $0 $0 $0 $0 $0 $0 ($41) ($92) ($182) ($295) ($444)Participation Expense 0 0 0 0 0 0 167 442 882 1,567 2,618Network Operations 0 0 0 0 0 0 0 0 0 0 0Online/Interactive 0 0 0 0 0 0 0 0 0 0 0Marketing 0 0 0 0 0 0 0 0 0 0 0Ad Sales 0 0 0 0 0 0 (7) (7) (7) (7) (7)Affiliate Sales 0 0 0 0 0 0 (4) (8) (18) (28) (40)Gen & Admin 0 0 0 0 0 0 0 0 0 0 0Severance 0 0 0 0 0 0 0 0 0 0 0Moving Costs 0 0 0 0 0 0 0 0 0 0 0
Total Operating Costs $0 $0 $0 $0 $0 $0 $114 $336 $675 $1,237 $2,127
EBITDA $0 $0 $0 $0 $0 $0 ($5,098) ($10,665) ($21,528) ($35,579) ($53,179)
Other Inc/(Exp) 0 0 0 0 0 0 0 0 0 0 0
Net Income $0 $0 $0 $0 $0 $0 ($5,098) ($10,665) ($21,528) ($35,579) ($53,179)
18

GSN Business Plan Review
Assumptions The chart below illustrates the 5 year CAGR assumptions Salem Partners used to derive its
valuation of GSN compared to the assumptions GSN Management used to derive its long range plan.
5 Year CAGR AssumptionsManagement
Case Base Case
Affiliate RevenueSubscriber Growth 3.9% 3.9%License Fee/Subscriber Growth 6.6 3.0
Total Affiliate Revenue Growth 10.8% 7.1%
Advertising Revenue% Sold Growth 2.4% 2.4%Ratings Growth 11.0 0.0CPM Growth 5.5 5.5VPVH Growth 5.0 5.0
Total Advertising Revenue Growth 15.2% 8.3%
Online RevenueMonthly Uniques - GSN TV Viewers Growth 38.1% 38.1%Monthly Uniques - Non GSN TV Viewers (1)
77.8 73.2Total Monthly Uniques Growth 46.0 54.0Banner Ad CPM Growth 17.6 17.6Video Ad CPM Growth 5.0 5.0% Visits Watching Videos(1)
49.5 10.0Videos Watched Per Visit(1)
31.6 10.0% Uniques Subscribing 112.5 85.3Subscription Growth 219.6 193.9% Download Games(1)
31.6 18.3Total Online Revenue Growth 137.2% 133.5%
Participation RevenueAverage Rating per Airing Growth 10.0% 10.0%Total Participants Growth 68.1 68.1Entries per Participant Growth 8.7 8.7Net Revenue per Entry Growth 3.2 3.2
Total Participation Revenue Growth 119.4% 119.4%
Participation ExpenseWinner/On Air % 0.0% 0.0%Money Per Winner 20.0 45.0Total Prize Money 70.4 89.4
Total Participation Expense Growth 70.8% 77.4%(1) Represents a 4 year CAGR from 2007 through 2011.
19

GSN Business Plan Review
Introduction Salem Partners has conducted a detailed review of GSN’s 2007 budget as well as its long
range plan.
The objective of the review is to assess the reasonableness of the revenue and expense assumptions utilized in the Company’s cash flow projections and suggest potential modifications to the projections for use as our Base Case for valuation purposes.
In general, the Base Case differs from the Management Case in the following areas: Subscriber fee growth. Advertising sales growth, primarily as driven by ratings increases. Participation and online components of the business.
– Very little data has been provided to support either business model.– While we believe the online opportunity is of the order of magnitude reflected in
Management’s plan, we do not believe the business model provided to us reflected our, or Management’s, view of how the business will develop.
20

GSN Business Plan Review
Advertising Revenue
Cable networks as a group have continued to take audience from broadcast networks, surpassing broadcast networks in April 2002.
This positive effect has been mitigated somewhat by the proliferation of networks over the previous ten years as well as competition from non-television entertainment options. Average ratings growth for the cable networks industry of 5.9% annually over the past 10
years.
Growth in ratings combined with CPM growth in the mid-single digits has resulted in advertising growth for the industry group overall of 17.3% annually over the past 9 years.
In 2006, advertising revenue growth for the cable industry slowed to 14.8%. Industry sources indicate that the significant share growth of cable networks advertising
has slowed significantly.
21

GSN Business Plan Review
Advertising Revenue GSN Management projects 9% growth in gross advertising revenue in fiscal 2007 and a 15% CAGR from
fiscal 2006 through fiscal 2011.
The following chart compares GSN’s projected advertising growth with that of several other network groups and for the cable network industry overall. Information supplied regarding GSN reflects a blend of national spot advertising, infomercial and
direct response advertising.
Projected Advertising Revenue Growth Rate2006 2007 L-T Growth Rate
GSN(1)7.7% 9.2% 15.2%
Hallmark Channel(2)13.3 16.5 NA
Viacom Cable Networks(3)7.5 6.9 6.7%
Disney Cable Networks(4)7.5 15.2 10.6
Time Warner Networks(3)6.0 6.7 7.0
Discovery Networks(4)2.0 5.8 5.9
News Corp. Networks(4)11.1 8.0 7.2
Cable Network Industry(2)14.8 13.8 12.7
(1) Long term growth rate is from 2006 through 2011.(2) Long term growth rate for overall industry is from 2006 through 2010, source is Kagan Research.(3) Long term growth rate is from 2006 through 2010, source is Wall Street consensus estimates.(4) Long term growth rate is from 2006 through 2008, source is Wall Street consensus estimates.
22

GSN Business Plan ReviewNational Spot Revenue Discussion GSN has a relatively low level of national spot sales, with approximately $27 million generated on a gross basis in 2006.
GSN Management projects 27% growth in national spot sales in fiscal 2007 and a 29% CAGR from fiscal 2006 through fiscal 2011.
Over the long term projection period (five years), revenue is expected to increase almost four times. The growth in national spot revenue at GSN is projected to be driven by three primary factors:
Growth in ratings Growth in viewers per viewing household Growth in CMPs
Ratings GSN Management expects to grow ratings an average of 11% over the next five years, to an average household rating
of 0.545. The following charts set forth the ratings of the top 20 highest rated cable networks in 2005: a 0.545 rating would
establish GSN in that list, a potentially unrealistic assumption for a standalone niche channel.
2005 Average 24-Hour Rating by Cable Network
Source: Kagan research and Nielsen Source: Kagan research and Nielsen
Average 24-Hour Rating by Cable Network Five Year2000 2001 2002 2003 2004 2005 CAGR
Nickelodeon 1.53 1.39 1.16 1.52 1.64 1.70 2.1%TNT 0.87 0.88 0.93 1.13 1.18 1.23 7.2Cartoon 1.11 1.13 1.13 1.14 1.13 1.18 1.2Disney Channel 0.00 0.80 0.83 1.13 1.13 1.15 NALifetime 1.11 1.23 1.22 1.14 1.00 1.00 (2.1)Fox News 0.00 0.55 0.70 1.00 0.88 0.93 NATBS 1.14 1.05 0.95 0.90 0.85 0.85 (5.7)USA 0.89 0.80 0.85 0.83 0.86 0.77 (2.9)ESPN 0.69 0.60 0.68 0.75 0.77 0.73 1.1Hallmark 0.00 0.30 0.26 0.44 0.58 0.71 NAMTV 0.57 0.50 0.52 0.56 0.58 0.64 2.3Spike TV 0.41 0.46 0.44 0.45 0.47 0.61 8.3ABC Family 0.52 0.53 0.51 0.46 0.57 0.59 2.6FX Network 0.53 0.50 0.53 0.52 0.57 0.58 1.8History Channel 0.57 0.53 0.48 0.52 0.58 0.58 0.3TV Land 0.46 0.43 0.46 0.48 0.49 0.58 4.7A&E 0.91 0.81 0.66 0.61 0.60 0.56 (9.3)Court TV 0.34 0.35 0.41 0.40 0.54 0.53 9.3CNN 0.63 0.85 0.55 0.68 0.48 0.53 (3.4)Discovery 0.65 0.63 0.57 0.53 0.52 0.51 (4.7)GSN 0.33 0.31 0.27 0.28 0.25 0.31 (1.2)Total 13.26 14.63 14.11 15.47 15.67 16.27 4.2%
1.70
1.231.18 1.15
1.000.93
0.850.77 0.73 0.71
0.64 0.61 0.59 0.58 0.58 0.58 0.56 0.55 0.53 0.53 0.51
0.00
0.20
0.40
0.60
0.80
1.00
1.20
1.40
1.60
1.80
Nic
kelo
deon
TN
T
Car
toon
Dis
ney
Cha
nnel
Life
time
Fox
New
s
TB
S
US
A
ES
PN
Hal
lmar
k
MT
V
Spi
ke T
V
AB
C F
amily
FX
Net
wor
k
His
tory
Cha
nnel
TV
Lan
d
A&
E
2011
GS
N P
roje
ctio
n
Cou
rt T
V
CN
N
Dis
cove
ry
2005
Ave
rag
e 24
Hr.
Rat
ing
23

GSN Business Plan Review
National Spot Revenue Discussion (Continued) In addition, we believe that the continued
proliferation of entertainment product, including cable networks, that compete for consumers’ share may lead to more difficulty in establishing higher ratings without a significant hit show. Historical ratings have been flat for the past
three years as outlined by the graph on the right.
CPM GSN Management expects CPMs to grow at an
average rate of 5% over the next five years to an average rate of $5.66.
We believe this assumption reflects market expectations for the growth of cable network CPMs overall.
The table to the right sets forth the CPMs of comparable, independently operated networks.
Source: Kagan research and the Cabletelevision Advertising Bureau
2005 CPM Target Demographics
Style $6.44 W18-49
Food 5.13 W18-49, W25-54
Lifetime 4.33 A18-49, A25-54, W18-49, W25-54
GSN 4.23 A25-54, W25-54
A&E 3.95 A18-49, A25-34, A25-54, M18-49, W18-49
E! 3.72 A18-49
History Channel 3.45 A18-49, A25-54, M18-49, M25-54, M35-49, W25-54
Weather Channel 3.43 A18-54
MSNBC 3.34 A25-54, M25-54, W25-54
Hallmark Channel 2.48 A18-49, A25-54, W18-49, W25-54
Historical GSN Total Day Ratings
0.00
0.05
0.10
0.15
0.20
0.25
0.30
0.35
0.40
0.45
0.50
12/2
7/99
-03/
26/0
0
06/2
6/00
-10/
01/0
0
01/0
1/01
-04/
01/0
1
07/0
2/01
-09/
30/0
1
12/3
1/01
-03/
31/0
2
07/0
1/02
-09/
29/0
2
12/3
0/02
-03/
30/0
3
06/3
0/03
-09/
28/0
3
12/2
9/03
-03/
28/0
4
06/2
8/04
-09/
26/0
4
12/2
7/04
-03/
27/0
5
06/2
7/05
-09/
25/0
5
12/2
6/05
-03/
26/0
6
06/2
6/06
-09/
24/0
6
01/0
1/07
-02/
25/0
7
24

GSN Business Plan Review
Comparison to Hallmark Channel We believe that there is validity to the assumption that advertising revenue per subscriber
increases as the number of subscribers of a cable network grows.
Hallmark Channel’s growth from approximately 47 million subscribers to approximately 75 million subscribers can be used to analyze the appropriateness of GSN advertising projections as it grows from 55 million subscribers to a projected 68 million subscribers by the end of 2011.
($ in 000)Hallmark Channel For the Years Ended December 31, 4 Year
2002A 2003A 2004A 2005A 2006A CAGR
Total Advertising Revenue(1)$40,991 $76,153 $104,481 $143,780 $172,950 43.3%
Average Subscribers 46,800 53,100 61,700 69,100 74,600 12.4Average 24 Hour Ratings 0.26 0.44 0.58 0.71 0.76 31.0Revenue per Subscriber
per Ratings Point $0.22 $0.63 $0.98 $1.47 $1.75 67.1%
Total Programming Cost $50,600 $66,200 $85,700 $122,300 $130,900 26.8%
Total Marketing Cost $34,004 $16,619 $16,477 $24,160 $16,021 (17.2%)
GSN(2) For the Years Ending December 31, 4 Year2007E 2008E 2009E 2010E 2011E CAGR
Net Advertising Revenue(1)$68,207 $78,189 $90,719 $106,364 $126,536 16.7%
Average Subscribers 56,325 58,790 61,290 63,636 66,353 4.2Average 24 Hour Ratings 0.36 0.40 0.44 0.49 0.55 11.0Revenue per Subscriber
per Ratings Point $0.43 $0.53 $0.65 $0.82 $1.04 24.4%Total Programming Cost(3)
$41,247 $43,866 $50,903 $56,432 $62,009 10.7%
Total Marketing Cost $26,015 $27,377 $28,828 $30,377 $32,031 5.3%
(1) Represents net advertising revenue.(2) Represents GSN Management Case.(3) Represents programming expense, programming amortization, acquisitions and scheduling and new media and short form.
25
GSN Business Plan Review
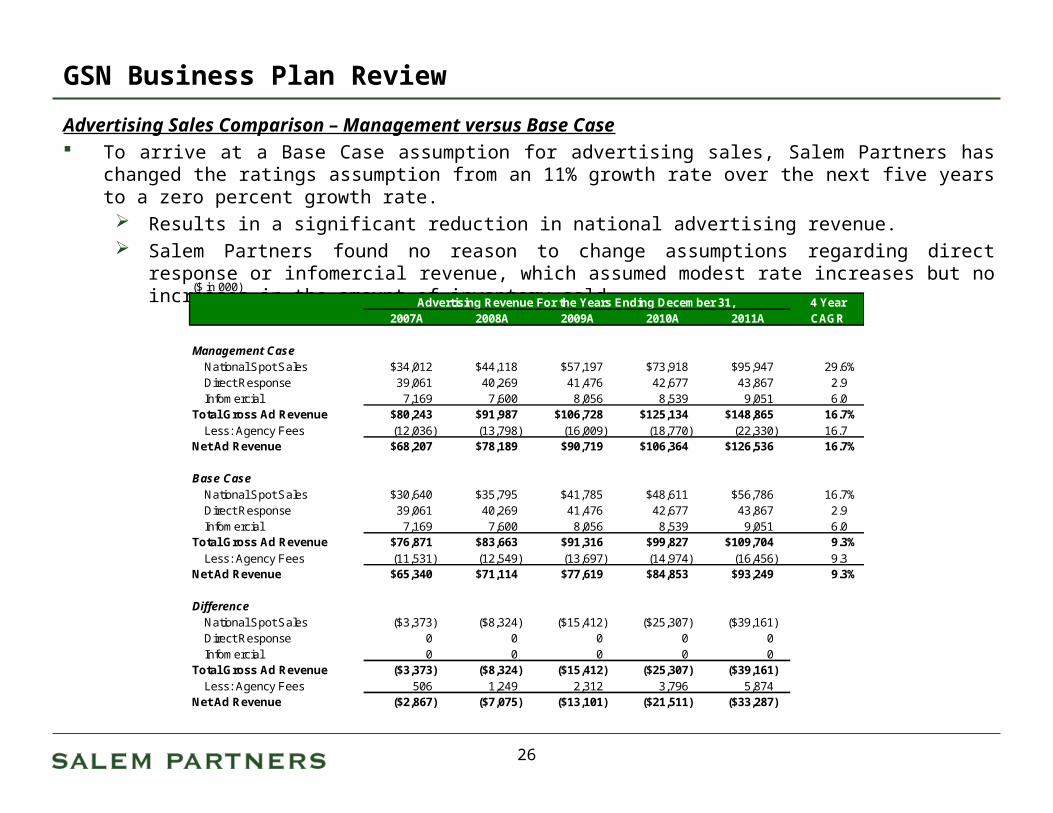
Advertising Sales Comparison – Management versus Base Case To arrive at a Base Case assumption for advertising sales, Salem Partners has changed the ratings
assumption from an 11% growth rate over the next five years to a zero percent growth rate. Results in a significant reduction in national advertising revenue. Salem Partners found no reason to change assumptions regarding direct response or infomercial
revenue, which assumed modest rate increases but no increases in the amount of inventory sold.
($ in 000)Advertising Revenue For the Years Ending December 31, 4 Year
2007A 2008A 2009A 2010A 2011A CAGR
Management CaseNational Spot Sales $34,012 $44,118 $57,197 $73,918 $95,947 29.6%Direct Response 39,061 40,269 41,476 42,677 43,867 2.9Infomercial 7,169 7,600 8,056 8,539 9,051 6.0
Total Gross Ad Revenue $80,243 $91,987 $106,728 $125,134 $148,865 16.7%Less: Agency Fees (12,036) (13,798) (16,009) (18,770) (22,330) 16.7
Net Ad Revenue $68,207 $78,189 $90,719 $106,364 $126,536 16.7%
Base CaseNational Spot Sales $30,640 $35,795 $41,785 $48,611 $56,786 16.7%Direct Response 39,061 40,269 41,476 42,677 43,867 2.9Infomercial 7,169 7,600 8,056 8,539 9,051 6.0
Total Gross Ad Revenue $76,871 $83,663 $91,316 $99,827 $109,704 9.3%Less: Agency Fees (11,531) (12,549) (13,697) (14,974) (16,456) 9.3
Net Ad Revenue $65,340 $71,114 $77,619 $84,853 $93,249 9.3%
DifferenceNational Spot Sales ($3,373) ($8,324) ($15,412) ($25,307) ($39,161)Direct Response 0 0 0 0 0Infomercial 0 0 0 0 0
Total Gross Ad Revenue ($3,373) ($8,324) ($15,412) ($25,307) ($39,161)Less: Agency Fees 506 1,249 2,312 3,796 5,874
Net Ad Revenue ($2,867) ($7,075) ($13,101) ($21,511) ($33,287)
26

GSN Business Plan Review
Affiliate Revenue Over the last several years the distribution environment has grown increasingly difficult for cable
networks, particularly independent networks that lack the benefit of critical mass of popularity with viewers.
The difficulties in the market have resulted from several factors:
Continued consolidation of distributors (MSOs), further increasing their negotiating leverage when establishing affiliation fee levels,
Increased focus by MSOs on services other than linear video programming, such as high speed data and telephony, limiting bandwidth available for growing networks, and
Increased focus on reducing the growth of programming costs.
These trends have resulted in: Longer and sometimes more acrimonious negotiations between networks and distributors, and A noticeable reduction in the rate of growth in subscriber fees.
The chart on the following page outlines GSN’s current affiliation agreements. Most of GSN’s agreements have either expired or will expire this year. The status of these agreements presents significant risk to the business plan.
27

GSN Business Plan Review
MSO Total GSN Subs Current Term Current Rates Status of Contract Discussions
DirectTV 14,031,000 Expired on 1/31/07
$0.0775 Did not exercise option to extend term through 1/31/09. Do not want to lock in specific tier but would discuss carriage in terms of penetration.
Comcast 13,962,000 Expires on 5/1/07
$0.08 Comcast contact is on maternity leave until April/May. Will start negotiations when she returns.
Echostar 7,840,000 Expires on 3/31/11
MFN Recently concluded long-term affiliation agreement with Echostar for AT120 carriage.
Time Warner 5,596,000 Expires on 12/31/07
$0.095 (digital), $0.08 (expanded basic)
Prepared to begin contract renewal discussions in the upcoming weeks.
Charter 3,892,000 Expired on 12/31/06
TBD (Charter proposed $0.13, GSN proposed $0.14)
Have been exchanging proposals since last fall. GSN to send counter proposal. Significant reduction in per subscriber fees will be implemented.
NCTC 2,550,000 Expires on 12/31/08
$0.20 in 2007, $0.22 in 2008
Agreement recently rolled over for an additional two years, ending in 2008.
Cablevision 2,300,000 Expired on 1/31/05
TBD (still receiving 2005 rate of $0.11)
In negotiations.
Cox 1,898,000 Expires on 1/31/07
$0.22 Contract discussions to begin in summer 2007.
28

GSN Business Plan Review
Affiliate Revenue GSN generated approximately $64 million of affiliate fees on a gross basis in 2006.
GSN Management projects 7% growth in affiliate fee revenue in fiscal 2007 and a 10% CAGR from fiscal 2006 through fiscal 2011.
Salem Partners has had conversations with a number of professionals in the cable networks industry and has conducted other research. These conversations generally indicate that cable network affiliate discussions can be divided into
three tiers when determining growth rates agreed in the current round of affiliate contracts. Tier 1: High-single digit to low- to mid-teen growth rates Tier 2: Low- to mid-single digit growth rates Tier 3: Flat to decreasing growth rates
We believe GSN would be considered a Tier 2 cable network. The following chart compares GSN’s projected affiliate fee growth with that of several other network groups
and for the cable network industry overall.Projected Affiliate Revenue Growth Rate
2006 2007 L-T Growth Rate
GSN(1)5.9% 6.5% 9.7%
Hallmark Channel(2)13.0 19.5 NA
Viacom Cable Networks(3)9.5 6.4 6.0
Disney Cable Networks(3)10.9 9.0 7.7
Time Warner Networks(3)5.9 6.2 7.7
Discovery Networks(4)16.9 10.0 8.9
News Corp. Networks(4)20.9 17.0 16.0
Cable Network Industry(5)9.5 7.8 7.6
(1) Long term growth rate is from 2006 through 2011.(2) Source is Kagan Research.(3) Long term growth rate is from 2006 through 2010, source is Wall Street consensus estimates.(4) Long term growth rate is from 2006 through 2008, source is Wall Street consensus estimates.(5) Long term growth rate for overall industry is from 2006 through 2010, source is Wachovia Securities research.
29
GSN Business Plan Review
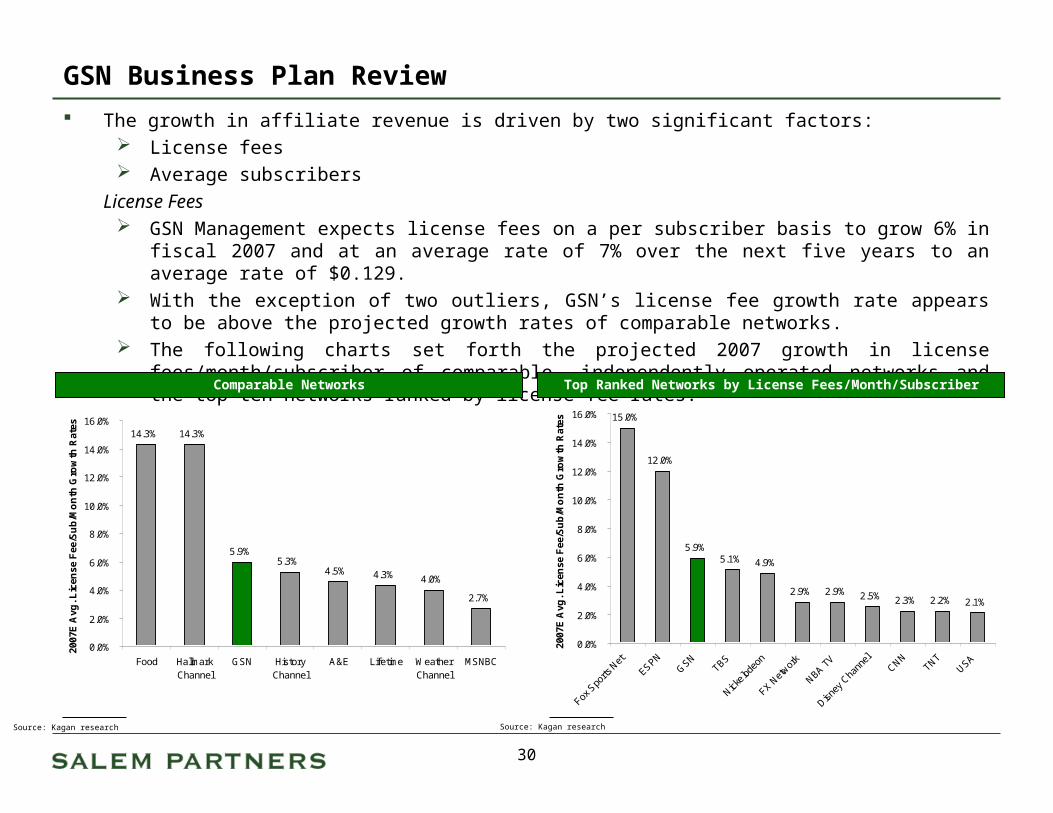
The growth in affiliate revenue is driven by two significant factors: License fees Average subscribers
License Fees GSN Management expects license fees on a per subscriber basis to grow 6% in fiscal 2007 and at
an average rate of 7% over the next five years to an average rate of $0.129. With the exception of two outliers, GSN’s license fee growth rate appears to be above the projected
growth rates of comparable networks. The following charts set forth the projected 2007 growth in license fees/month/subscriber of
comparable, independently operated networks and the top ten networks ranked by license fee rates.
Source: Kagan research
Comparable Networks Top Ranked Networks by License Fees/Month/Subscriber
Source: Kagan research
15.0%
12.0%
5.9%5.1% 4.9%
2.9% 2.9% 2.5% 2.3% 2.2% 2.1%
0.0%
2.0%
4.0%
6.0%
8.0%
10.0%
12.0%
14.0%
16.0%
Fox S
ports
Net
ESPNG
SNTBS
Nickelod
eon
FX Net
work
NBA TV
Disney
Cha
nnel
CNNTNT
USA
2007
E A
vg. L
icen
se F
ee/S
ub
/Mo
nth
Gro
wth
Rat
es
14.3% 14.3%
5.9%5.3%
4.5% 4.3% 4.0%
2.7%
0.0%
2.0%
4.0%
6.0%
8.0%
10.0%
12.0%
14.0%
16.0%
Food HallmarkChannel
GSN HistoryChannel
A&E Lifetime WeatherChannel
MSNBC
2007
E A
vg. L
icen
se F
ee/S
ub
/Mo
nth
Gro
wth
Rat
es
30

GSN Business Plan Review
Average Subscribers GSN Management expects average subscribers to grow 3% in fiscal 2007 and at an average rate of
4% over the next five years to 68 million subscribers. GSN’s subscriber growth rate assumptions appear to be in line with the growth rates of similar
networks within the industry. The following charts set forth the 2007 growth in average subscribers of comparable, independently
operated networks.
Source: Kagan research
Comparable Networks
5.9%
3.7%3.5% 3.4%
2.8%
1.9%1.6%
1.3%
0.0%
1.0%
2.0%
3.0%
4.0%
5.0%
6.0%
7.0%
HallmarkChannel
MSNBC Food WeatherChannel
GSN Lifetime HistoryChannel
A&E
2007
E A
vera
ge
Su
bsc
rib
er G
row
th R
ates
31

GSN Business Plan Review
Affiliate Revenue Comparison – Management versus Base Case To arrive at a Base Case assumption for affiliate revenue, Salem Partners has changed the subscriber fee
growth rate assumption from approximately 7% to 3% from 2006 to 2011. We believe there is further downside exposure to affiliate subscriber fees.
($ in 000)Affiliate Revenue For the Years Ending December 31, 4 Year
2007A 2008A 2009A 2010A 2011A CAGR
Management CaseAverage Subscribers 56,325 58,790 61,290 63,636 66,353 4.2%Average Subscriber Fee/Month $0.10 $0.11 $0.11 $0.12 $0.13 6.7
Total Subscriber Revenue $66,994 $74,312 $82,901 $91,943 $102,445 11.2%
Base CaseAverage Subscribers 56,325 58,790 61,290 63,636 66,353 4.2%Average Subscriber Fee/Month $0.10 $0.10 $0.10 $0.11 $0.11 3.0
Total Subscriber Revenue $65,300 $71,203 $75,834 $80,706 $86,443 7.3%
DifferenceAverage Subscribers 0 0 0 0 0Average Subscriber Fee/Month ($0.00) ($0.00) ($0.01) ($0.01) ($0.02)
Total Subscriber Revenue ($1,694) ($3,109) ($7,067) ($11,237) ($16,002)
32

50.0%
30.0%
15.0%12.0% 11.0%
4.1%
0.0%
10.0%
20.0%
30.0%
40.0%
50.0%
60.0%
Pro Sieben Media(1) Top Chef (Bravo) Flavor of Love (VH1) Last Comic Standing(NBC)
GSN 2011 Projection GSN Historical
Par
ticip
atio
n R
ate
GSN Business Plan Review
Participation Business GSN’s programming allows viewers to participate in its game shows through phone and SMS entries. GSN Management projects participation revenue to grow to approximately $7 million in fiscal 2007, or
482%, with a long term average growth rate of 89% through fiscal 2011. A significant driver of participation revenue is the participation rate.
GSN’s current participation rate is 4% and is projected to grow to 11% over the course of the projection period.
Amounts charged per phone or SMS entry is projected to remain flat through fiscal 2011. The volume of participation-based programming is also projected to grow significantly over the period, from
6 hours per week currently to 16 hours per week in 2011. Below is a graph of other programs’ participation rates when inclusive of an audience participation
component.Participation Rates
(1) Pro Sieben Media owns 9Live in Germany and other gaming networks with interactive programming.
33

GSN Business Plan Review
Participation Business Currently, participants can only participate via SMS entries. However, in 2007 GSN will begin to offer the ability to phone into the game show.
Expected to be 50% of volume by 2011. Phone capability enables GSN to access its older skewing demographic, which typically
does not use SMS technology. GSN Management admits that participation is a new business model for the network and for this
country. $1.2 million gross revenue generated in 2006. $30.1 million gross revenue projected in 2011. We believe this revenue and cash flow stream is speculative. Early results from Playmania are interesting, but do not support the anticipated growth in that
segment of the business. We have reflected the speculative nature of the participation segment of the business in the
discount rate applied to the projections in the discounted cash flow analysis. Management has projected an 89% increase in participation revenue over the next five years.
However, the Company has not projected prize money to grow proportionately with the participation rate and revenue.
Salem Partners has projected the money per winner to grow by 45% each year, reaching $509 by 2011, while Management projected this to grow by 20% each year.
This adjustment brings the prize money CAGR up to 89%, in line with revenue projections.
34
GSN Business Plan Review
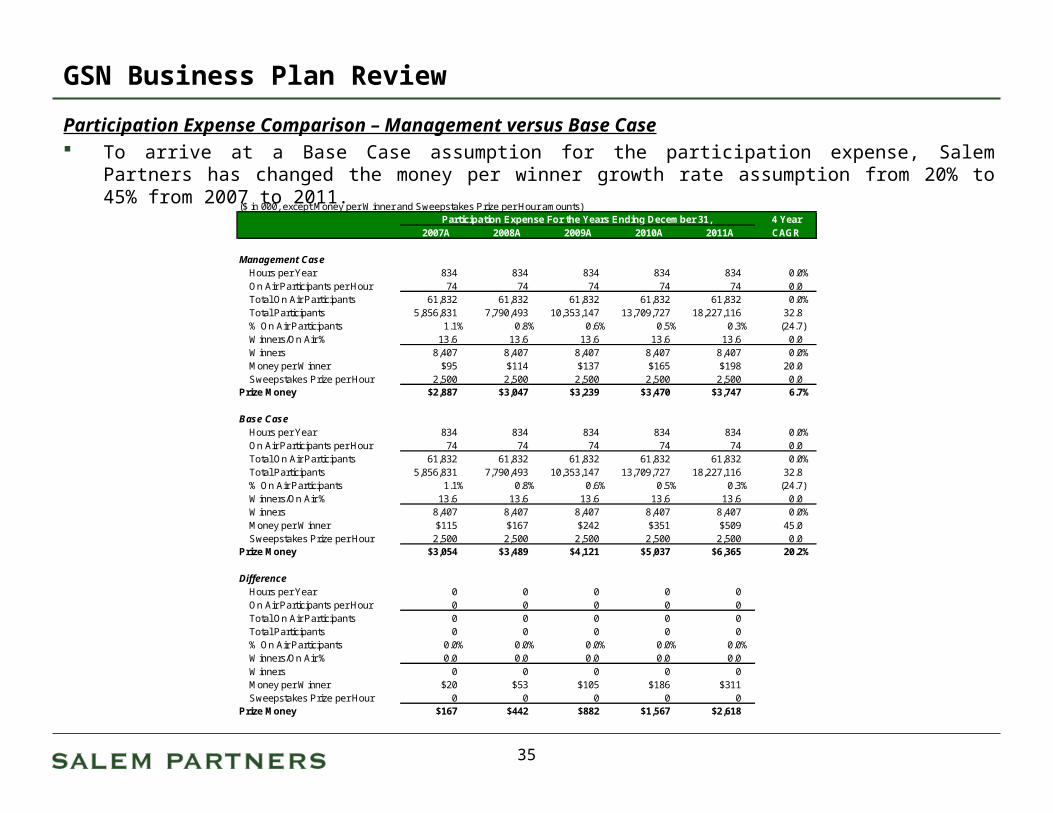
Participation Expense Comparison – Management versus Base Case To arrive at a Base Case assumption for the participation expense, Salem Partners has changed the
money per winner growth rate assumption from 20% to 45% from 2007 to 2011.
($ in 000, except Money per Winner and Sweepstakes Prize per Hour amounts)Participation Expense For the Years Ending December 31, 4 Year
2007A 2008A 2009A 2010A 2011A CAGR
Management CaseHours per Year 834 834 834 834 834 0.0%On Air Participants per Hour 74 74 74 74 74 0.0Total On Air Participants 61,832 61,832 61,832 61,832 61,832 0.0%Total Participants 5,856,831 7,790,493 10,353,147 13,709,727 18,227,116 32.8% On Air Participants 1.1% 0.8% 0.6% 0.5% 0.3% (24.7)Winners/On Air % 13.6 13.6 13.6 13.6 13.6 0.0Winners 8,407 8,407 8,407 8,407 8,407 0.0%Money per Winner $95 $114 $137 $165 $198 20.0Sweepstakes Prize per Hour 2,500 2,500 2,500 2,500 2,500 0.0
Prize Money $2,887 $3,047 $3,239 $3,470 $3,747 6.7%
Base CaseHours per Year 834 834 834 834 834 0.0%On Air Participants per Hour 74 74 74 74 74 0.0Total On Air Participants 61,832 61,832 61,832 61,832 61,832 0.0%Total Participants 5,856,831 7,790,493 10,353,147 13,709,727 18,227,116 32.8% On Air Participants 1.1% 0.8% 0.6% 0.5% 0.3% (24.7)Winners/On Air % 13.6 13.6 13.6 13.6 13.6 0.0Winners 8,407 8,407 8,407 8,407 8,407 0.0%Money per Winner $115 $167 $242 $351 $509 45.0Sweepstakes Prize per Hour 2,500 2,500 2,500 2,500 2,500 0.0
Prize Money $3,054 $3,489 $4,121 $5,037 $6,365 20.2%
DifferenceHours per Year 0 0 0 0 0On Air Participants per Hour 0 0 0 0 0Total On Air Participants 0 0 0 0 0Total Participants 0 0 0 0 0% On Air Participants 0.0% 0.0% 0.0% 0.0% 0.0%Winners/On Air % 0.0 0.0 0.0 0.0 0.0Winners 0 0 0 0 0Money per Winner $20 $53 $105 $186 $311Sweepstakes Prize per Hour 0 0 0 0 0
Prize Money $167 $442 $882 $1,567 $2,618
35

21.6
7.05.9 5.5
4.9
2.7 2.51.9
0.7 0.6
0.0
5.0
10.0
15.0
20.0
25.0
Yahoo
!Gam
es
Real A
rcad
e
Shock
Wav
e
Min
iclip
Addict
ingG
ames
.com
Big F
ish
Fun T
echno
logies
iWin
Wild
Tan
gent
GSN
2006
Ave
rage
Mon
thly
Uni
ques
(m
m)
2.6%
(19.5%)4.8% 62.2%
65.6%
56.6% NA28.2%
623.4% (6.3%)
GSN Business Plan Review
Online Business• GSN’s online revenue is $801K in fiscal 2006 and is projected to grow 137% on average
through fiscal 2011 to approximately $60 million. Total monthly uniques is a significant driver of online revenue and it is projected to
increase 46% each year through fiscal 2011. The charts below compare GSN’s 2006 average monthly uniques with that of other
network websites and online gaming websites.Average Monthly Uniques – Cable Networks Average Monthly Uniques – Online Gaming Websites
Source: ComscoreNote: Percentages represent YOY January 2007 growth ratesSource: Public filings
10.0
7.0
4.0 4.0
2.0 2.0 2.0
0.7 0.6
0.0
2.0
4.0
6.0
8.0
10.0
12.0
FoodN
etwor
kM
TVVH1
HGTV
Comed
y Cen
tral
BETDIY
Life
time
GSN
2006
Ave
rage
Mon
thly
Uni
ques
(m
m)
36
GSN Business Plan Review
Online Revenue Comparison – Management vs. Base Case
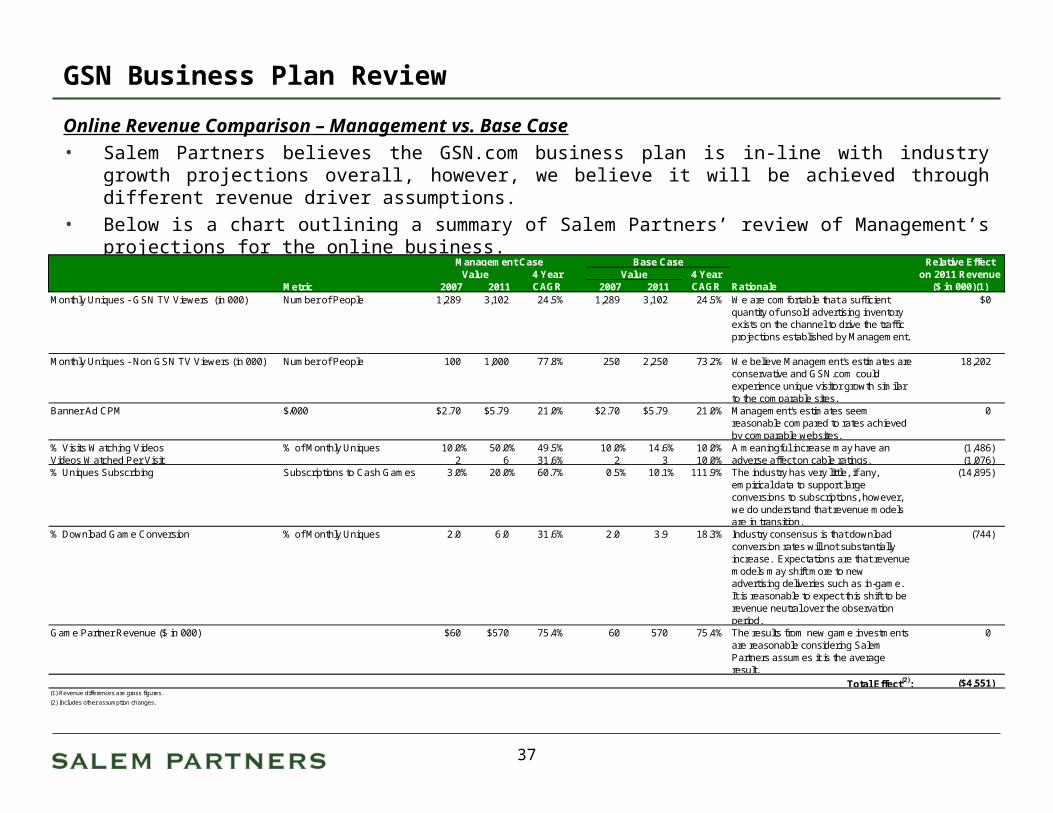
• Salem Partners believes the GSN.com business plan is in-line with industry growth projections overall, however, we believe it will be achieved through different revenue driver assumptions.
• Below is a chart outlining a summary of Salem Partners’ review of Management’s projections for the online business.
Management Case Base Case Relative EffectValue 4 Year Value 4 Year on 2011 Revenue
Metric 2007 2011 CAGR 2007 2011 CAGR Rationale ($ in 000)(1)Monthly Uniques - GSN TV Viewers (in 000) Number of People 1,289 3,102 24.5% 1,289 3,102 24.5% We are comfortable that a sufficient
quantity of unsold advertising inventory exists on the channel to drive the traffic projections established by Management.
$0
Monthly Uniques - Non GSN TV Viewers (in 000) Number of People 100 1,000 77.8% 250 2,250 73.2% We believe Management's estimates are conservative and GSN.com could experience unique visitor growth similar to the comparable sites.
18,202
Banner Ad CPM $/000 $2.70 $5.79 21.0% $2.70 $5.79 21.0% Management's estimates seem reasonable compared to rates achieved by comparable websites.
0
% Visits Watching Videos % of Monthly Uniques 10.0% 50.0% 49.5% 10.0% 14.6% 10.0% (1,486)Videos Watched Per Visit 2 6 31.6% 2 3 10.0% (1,076)% Uniques Subscribing Subscriptions to Cash Games 3.0% 20.0% 60.7% 0.5% 10.1% 111.9% The industry has very little, if any,
empirical data to support large conversions to subscriptions, however, we do understand that revenue models are in transition.
(14,895)
% Download Game Conversion % of Monthly Uniques 2.0 6.0 31.6% 2.0 3.9 18.3% Industry consensus is that download conversion rates will not substantially increase. Expectations are that revenue models may shift more to new advertising deliveries such as in-game. It is reasonable to expect this shift to be revenue neutral over the observation period.
(744)
Game Partner Revenue ($ in 000) $60 $570 75.4% 60 570 75.4% The results from new game investments are reasonable considering Salem Partners assumes it is the average result.
0
Total Effect(2): ($4,551)(1) Revenue differences are gross figures.
(2) Includes other assumption changes.
A meaningful increase may have an adverse affect on cable ratings.
37

GSN Business Plan Review
Online Comparison – Management versus Base Case• Below is a chart comparing the revenue of GSN.com in the Management Case to revenue of
GSN.com in the Base Case.
($ in 000)Online Revenue For the Years Ending December 31, 4 Year
2007A 2008A 2009A 2010A 2011A CAGR
Management CaseTotal Online Gaming Revenue $3,517 $8,210 $17,507 $31,667 $52,427 96.5%Total Online Content Revenue 519 1,428 2,675 4,749 7,804 96.9%
Total Gross Online Revenue $4,036 $9,638 $20,182 $36,416 $60,231 96.5%
Revenue Shares (1,739) (3,721) (8,163) (14,953) (24,940) 94.6Total Net Online Revenue $2,297 $5,916 $12,019 $21,464 $35,291 98.0%
Base CaseTotal Online Gaming Revenue $2,560 $7,627 $15,540 $27,753 $47,855 107.9%Total Online Content Revenue 572 1,536 2,863 4,881 7,825 92.3%
Total Gross Online Revenue $3,132 $9,163 $18,403 $32,634 $55,680 105.3%
Revenue Shares (1,261) (3,397) (7,085) (12,796) (22,221) 104.9Total Net Online Revenue $1,871 $5,766 $11,318 $19,838 $33,459 105.6%
DifferenceTotal Online Gaming Revenue ($957) ($583) ($1,967) ($3,914) ($4,572)Total Online Content Revenue 53 109 188 132 21
Total Gross Online Revenue ($904) ($474) ($1,779) ($3,782) ($4,551)
Revenue Shares 479 324 1,078 2,157 2,719Total Net Online Revenue ($425) ($150) ($701) ($1,625) ($1,832)
38

Discussion of Liberty CaseDiscussion of Liberty Case

Discussion of Liberty Case
Overview Salem Partners believes potential incremental value to Liberty of owning 100% of GSN lies in
six general areas.
Comments
Advertising Revenue Enhancement Due to Ratings Increase
Analysis of precedent cable networks transactions indicates a significant near-term increase in ratings, which Salem Partners attributes primarily to cross promotion.
We believe modest ratings growth under Liberty ownership will be possible over the projection term due to the ability of Liberty to cause increased stability in channel positioning.
Affiliate Revenue Enhancement
No change.
Cost Savings Opportunities
We believe the cost savings opportunities under Liberty ownership are not as great as originally anticipated by SPE and will only be realized upon a full consolidation of GSN into Liberty operations. Primary savings opportunities are in network operations and G&A. Ad sales, marketing and affiliates sales were also considered.
International Network Opportunities
Discussions with international cable network executives have indicated that Liberty has significant power to launch channels internationally. Given the strong appeal of game show programming internationally, this concept would seem to be a natural part of the strategy.
Opportunity with FUN Technologies
Liberty can use Fun as a skill game tracking stock and may drive a valuation increase through a contractual arrangement with Fun or an outright contribution of GSN.com’s business.
Value Enhancement Opportunity with Other Liberty Entities Considered But Not Included
DirecTV (other than ability to leverage distribution for better GSN channel placement). OpenTV Starz/Encore (shared programming considered but not included). QVC (joint programming considered but not included).
39
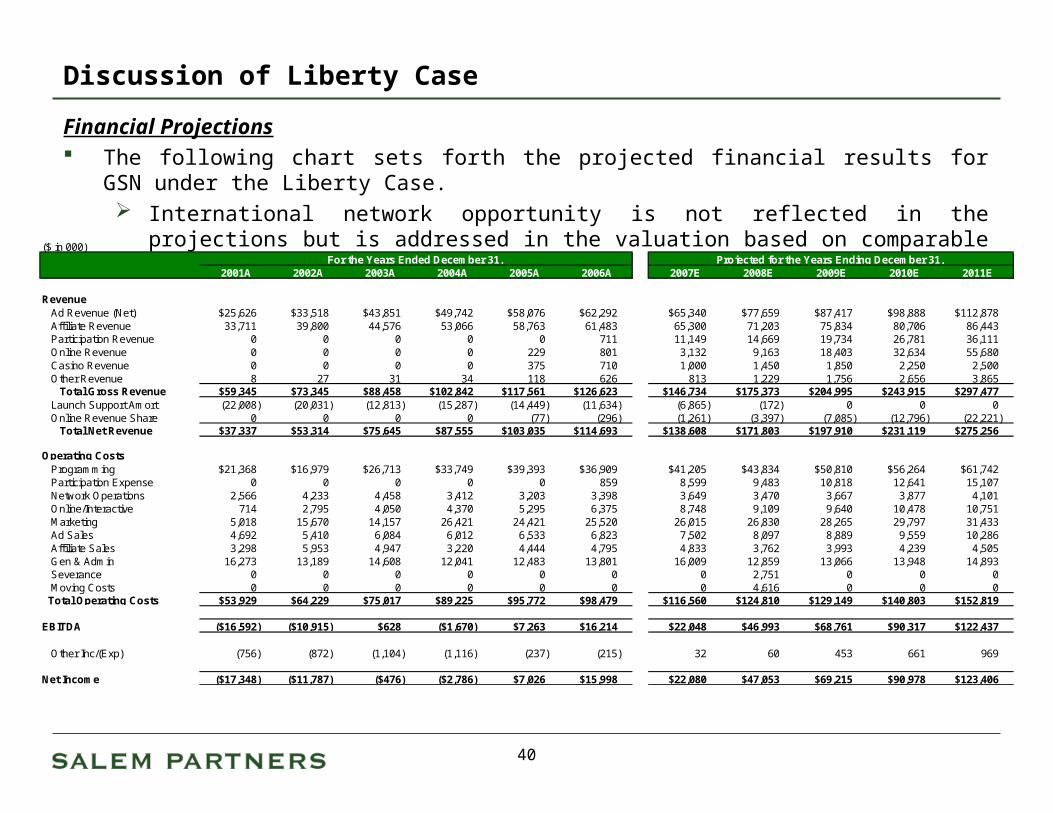
Discussion of Liberty Case
Financial Projections The following chart sets forth the projected financial results for GSN under the Liberty Case.
International network opportunity is not reflected in the projections but is addressed in the valuation based on comparable transactions.
($ in 000)For the Years Ended December 31, Projected for the Years Ending December 31,
2001A 2002A 2003A 2004A 2005A 2006A 2007E 2008E 2009E 2010E 2011E
RevenueAd Revenue (Net) $25,626 $33,518 $43,851 $49,742 $58,076 $62,292 $65,340 $77,659 $87,417 $98,888 $112,878Affiliate Revenue 33,711 39,800 44,576 53,066 58,763 61,483 65,300 71,203 75,834 80,706 86,443Participation Revenue 0 0 0 0 0 711 11,149 14,669 19,734 26,781 36,111Online Revenue 0 0 0 0 229 801 3,132 9,163 18,403 32,634 55,680Casino Revenue 0 0 0 0 375 710 1,000 1,450 1,850 2,250 2,500Other Revenue 8 27 31 34 118 626 813 1,229 1,756 2,656 3,865
Total Gross Revenue $59,345 $73,345 $88,458 $102,842 $117,561 $126,623 $146,734 $175,373 $204,995 $243,915 $297,477Launch Support Amort (22,008) (20,031) (12,813) (15,287) (14,449) (11,634) (6,865) (172) 0 0 0Online Revenue Share 0 0 0 0 (77) (296) (1,261) (3,397) (7,085) (12,796) (22,221)
Total Net Revenue $37,337 $53,314 $75,645 $87,555 $103,035 $114,693 $138,608 $171,803 $197,910 $231,119 $275,256
Operating CostsProgramming $21,368 $16,979 $26,713 $33,749 $39,393 $36,909 $41,205 $43,834 $50,810 $56,264 $61,742Participation Expense 0 0 0 0 0 859 8,599 9,483 10,818 12,641 15,107Network Operations 2,566 4,233 4,458 3,412 3,203 3,398 3,649 3,470 3,667 3,877 4,101Online/Interactive 714 2,795 4,050 4,370 5,295 6,375 8,748 9,109 9,640 10,478 10,751Marketing 5,018 15,670 14,157 26,421 24,421 25,520 26,015 26,830 28,265 29,797 31,433Ad Sales 4,692 5,410 6,084 6,012 6,533 6,823 7,502 8,097 8,889 9,559 10,286Affiliate Sales 3,298 5,953 4,947 3,220 4,444 4,795 4,833 3,762 3,993 4,239 4,505Gen & Admin 16,273 13,189 14,608 12,041 12,483 13,801 16,009 12,859 13,066 13,948 14,893Severance 0 0 0 0 0 0 0 2,751 0 0 0Moving Costs 0 0 0 0 0 0 0 4,616 0 0 0
Total Operating Costs $53,929 $64,229 $75,017 $89,225 $95,772 $98,479 $116,560 $124,810 $129,149 $140,803 $152,819
EBITDA ($16,592) ($10,915) $628 ($1,670) $7,263 $16,214 $22,048 $46,993 $68,761 $90,317 $122,437
Other Inc/(Exp) (756) (872) (1,104) (1,116) (237) (215) 32 60 453 661 969
Net Income ($17,348) ($11,787) ($476) ($2,786) $7,026 $15,998 $22,080 $47,053 $69,215 $90,978 $123,406
40

Discussion of Liberty Case
Financial Projections – Liberty Case versus Base Case The following chart highlights the changes from the Base Case to arrive to the Liberty Case.
($ in 000)For the Years Ended December 31, Projected for the Years Ending December 31,
2001A 2002A 2003A 2004A 2005A 2006A 2007E 2008E 2009E 2010E 2011E
RevenueAd Revenue (Net) $0 $0 $0 $0 $0 $0 $0 $6,545 $9,799 $14,035 $19,629Affiliate Revenue 0 0 0 0 0 0 0 0 0 0 0Participation Revenue 0 0 0 0 0 0 0 0 0 0 0Online Revenue 0 0 0 0 0 0 0 0 0 0 0Casino Revenue 0 0 0 0 0 0 0 0 0 0 0Other Revenue 0 0 0 0 0 0 0 0 0 0 0
Total Gross Revenue $0 $0 $0 $0 $0 $0 $0 $6,545 $9,799 $14,035 $19,629Launch Support Amort 0 0 0 0 0 0 0 0 0 0 0Online Revenue Share 0 0 0 0 0 0 0 0 0 0 0
Total Net Revenue $0 $0 $0 $0 $0 $0 $0 $6,545 $9,799 $14,035 $19,629
Operating CostsProgramming $0 $0 $0 $0 $0 $0 $0 $59 $88 $126 $177Participation Expense 0 0 0 0 0 0 0 0 0 0 0Network Operations 0 0 0 0 0 0 0 (386) (407) (431) (456)Online/Interactive 0 0 0 0 0 0 0 0 0 0 0Marketing 0 0 0 0 0 0 0 (547) (563) (580) (597)Ad Sales 0 0 0 0 0 0 0 0 (42) (85) (131)Affiliate Sales 0 0 0 0 0 0 0 (941) (998) (1,060) (1,126)Gen & Admin 0 0 0 0 0 0 0 (4,322) (5,649) (6,000) (6,376)Severance 0 0 0 0 0 0 0 2,751 0 0 0Moving Costs 0 0 0 0 0 0 0 4,616 0 0 0
Total Operating Costs $0 $0 $0 $0 $0 $0 $0 $1,232 ($7,571) ($8,030) ($8,510)
EBITDA $0 $0 $0 $0 $0 $0 $0 $5,314 $17,370 $22,065 $28,139
Other Inc/(Exp) 0 0 0 0 0 0 0 0 0 0 0
Net Income $0 $0 $0 $0 $0 $0 $0 $5,314 $17,370 $22,065 $28,139
41

0.10
0.20
0.30
0.40
0.50
0.60
0.70
0.80
T-9 T-8 T-7 T-6 T-5 T-4 T-3 T-2 T-1 0 T+1 T+2 T+3 T+4 T+5 T+6 T+7 T+8 T+9 T+10 T+11 T+12 T+13 T+14 T+15 T+16 T+17 T+18 T+19 T+20
Bravo Comedy Central Court TV
Acquisition Date
0.75
0.46
0.30
Notes: Queer Eye for the Straight Guy premiered on Bravo in July 2003 (T+8).
Notes: Beach Patrol: Miami Beach premiered on Court TV in July 06 (T+2).
Notes: 'Til Death Do Us Part premiered on Court TV in April 06 (T-1).
Notes: Las Vegas Law premiered on Court TV in February 06 (T-3).
Notes: The Chapelle Show premiered on Comedy Central in November 03 (T+7).
Notes: Each data point represents one month.
Discussion of Liberty Case
Ratings Increase due to Liberty Acquisition The chart below illustrates the ratings increase that occurred when Bravo, Comedy Central and Court TV
were acquired by NBC, MTV Networks and Time Warner, respectively. These transactions represent recent consolidations of formerly independent channels into major
media companies. We believe that cross promotion was a primary driver of the ratings increases.
Ratings Increase Due to Acquisition
24
-Ho
ur
Nie
lse
n R
ati
ng
s
42

Discussion of Liberty Case
Potential Ratings Increase due to Cross Promotional Opportunities Salem Partners evaluated the number of cross promotional subscribers Bravo, Comedy Central and Court
TV picked up once it became affiliated with a larger group of networks. These subscriber increases were then compared to the ratings increases and used to approximate the
increase in GSN’s rating if it were owned by Liberty. We calculated the approximate ratings increase to be 16%, which contributes to an increase of 35% in
national spot revenue and 19% in advertising revenue overall in 2008. This analysis would demonstrate a much larger potential impact if it included the Rainbow channels.(In millions)
(In millions)
Liberty Media Networks SubscribersQVC 88.0Total Cross Promotional Subscribers 88.0GSN % Ratings Increase 15.7%Current GSN Rating (February 2007) 0.33GSN Ratings Increase 0.05
New GSN Rating from Liberty Acquisition 0.38
MTV Networks SubscribersMTV 88.8MTV2 58.4VH1 88.5CMT 79.4Logo 6.2Spike 89.6BET 80.9Total Cross Promotional Subscribers 491.8Comedy Central Percent Ratings Increase (0 to T+9) 24.3%% Ratings Increase/Cross Promotional Subscriber 0.049%
NBC Networks SubscribersMSNBC 85.1NBC 110.3USA 89.7Total Cross Promotional Subscribers 285.1Bravo Percent Ratings Increase (0 to T+9) 76.5%% Ratings Increase/Cross Promotional Subscriber 0.268%
Time Warner SubscribersTBS 89.5TNT 89.8Turner Classic Movies 71.5CNN 89.9Total Cross Promotional Subscribers 340.7Court TV Ratings Increase (0 to T+9) 74.4%% Ratings Increase/Cross Promotional Subscriber 0.218%
Average % Ratings Increase/Cross Promotional Subscriber 0.179%
43

Discussion of Liberty Case
Potential Ratings Increase Due to Enhanced Channel Stability We believe that Liberty will be able to utilize its influence as a major distributor of cable programming to cause
greater stability in GSN’s channel positioning, leading to a higher possibility of organic ratings growth going forward. Liberty will have direct influence over DirecTV. Liberty should be able to utilize the threat of retaliation to keep cable MSOs from altering GSN’s channel
positioning. An analysis of GSN’s ratings history in two different markets highlights the difficulties in maintaining or growing
ratings when channel positioning is changed by an MSO or satellite provider. The chart below highlights GSN’s historical ratings in two markets where Comcast is the cable provider.
Comcast Sacramento carries GSN on expanded basic and has been on the same channel for many years. Comcast Baltimore use to carry GSN on expanded basic, but was migrated to digital by Comcast in
September 2006. GSN’s rating went from a 0.23 to a 0.08 when it was migrated.
0.00
0.10
0.20
0.30
0.40
0.50
0.60
0.70
0.80
0.90
Jan-
04
Mar
-04
May
-04
Jul-0
4
Sep-0
4
Nov-0
4
Jan-
05
Mar
-05
May
-05
Jul-0
5
Sep-0
5
Nov-0
5
Jan-
06
Mar
-06
May
-06
Jul-0
6
Sep-0
6
Nov-0
6
Rat
ing
Sacramento Baltimore
0.65
0.08
Local Market GSN Ratings
Notes: Ratings data is based against total cable subs in the DMA, not against GSN’s universe. No single MSO owns all the cable subs in a DMA. While some may dominate a DMA, other smaller MSO/systems exist and impact ratings, therefore, some ratings impact may be muted by other systems.
GSN is migrated from expanded basic to digital.
44

Discussion of Liberty Case
Cost Savings Opportunities Salem Partners has performed an analysis of the potential cost savings due to consolidation
of GSN into Liberty’s operations.
We believe that cost savings opportunities exist but will be realized only if Liberty fully consolidates. Rather than speculate about whether Liberty would make such a decision and the timing
of when such a move might occur, we have quantified the opportunity but have valued the Liberty Case with and without such cost savings.
One-time costs to move are estimated at $7.4 million, including 50% of total annual payroll (six months) of assumed severance, one year of rent from lease breakage and $1 million of moving costs.
45

Discussion of Liberty Case
Cost Savings Opportunities (Continued) The following chart highlights a summary of our cost savings analysis
($ in 000)
Projected 2008 Expense
Assumed Percentage Reduction
Pro Forma 2008 Expense Comment
Production and Programming Costs(1) $62,367 0.1% $62,425 Although Liberty subsidiaries, Overture Films and Starz Encore have programming operations in Los Angeles, GSN's programming operator will have to operate on a standalone basis due to its unique nature. Small increase in music royalties projected due to higher ad revenue.
Network Operations 3,855 (10.0%) 3,470 Some savings due to headcount eliminations.Marketing 27,377 (2.0%) 26,830 We have assumed a 5% reduction in the cost of
purchased media ($10.6 million in 2007) to reflect greater buying power of Liberty. Impact is small due to the uncertain timing of GSN media buys, leading to a relative inability to coordinate purchases with other Liberty operators.
Advertising Sales 8,097 0.0% 8,097 Liberty's consolidated operations do not appear to include a strong advertising sales capability.
Affiliate Sales 4,703 (20.0%) 3,762 With QVC incorporating a different MSO compensation model and Starz/Encore being a consumer subscription sale as opposed to a MSO-driven sale, savings in this area may not be as much as would initially appear. GSN's affiliate relations process will be unique among Liberty's current bouquet of channels.
G&A 17,181 (25.0%) 12,882 In a full consolidation, significant savings opportunities would exist in the areas of finance, human resources and facilities.
(1) Represents programming, programming amortization, acquisitions and scheduling, new media & short form, participation expense and online/interactive.
46

Discussion of Liberty Case
International Network Opportunity In our survey of international cable network executives, we received the following comments
regarding the potential for Liberty to launch international channels.
“[Liberty] has the ability, at least in some territories, to launch channels. Whether they have the desire is something else.”
“It is possible to launch new international channels, but much more difficult than it used to be. You need either a brand or other channel or distribution leverage. Liberty has that.”
– International cable network executive response to the question, “Does Liberty have the clout internationally to launch new networks?”
– International cable network executive response to the question, “How difficult is it to launch new international networks? Can Liberty do it?”
47

Discussion of Liberty Case
Impact on FUN Technologies The potential incremental value of GSN.com to Liberty is suggested in the chart below. Salem Partners has assumed that Liberty can reduce website costs and G&A by 80% if Liberty and Fun
entered into a contractual relationship whereby Fun manages the entirety of GSN.com.($ in 000)
OpEx Reduction For the Years Ending December 31, Discounted Cash Flow Sensitivity Analysis - Cost Savings to Fun Technologies2007E 2008E 2009E 2010E 2011E
Website Cost 6/30/2007 6/30/2008 6/30/2009 6/30/2010 6/30/2011Website Buildout 0 $160 $160 $400 $160Additional Hosting Costs 0 210 221 232 243
Total Website Cost Savings $0 $370 $381 $632 $403
G&ASalaries $0 $1,126 $1,182 $1,241 $1,303Bonuses 0 113 118 124 130Benefits 0 136 143 150 158Legal Fees 0 168 176 185 194Consultants 0 42 44 46 49Recruitment fees 0 0 0 0 0Research (Comscore) 0 63 66 69 73Traffic Software 0 168 176 185 194Other 0 84 88 93 97Rent 0 161 169 178 187
Total G&A $0 $2,061 $2,164 $2,272 $2,385Cash Taxes(1)
0 (783) (822) (863) (906)
Total Cost Savings $0 $1,278 $1,341 $1,409 $1,479Discount Rate 38.5%PV of 80% of Certain OpEx Reduction at 6/30/2007(2)
2,552PV of 80% of Certain OpEx Reduction at 12/31/2007 $2,168Terminal Value 4,269 12.5x MulipleTotal Value of Cost Savings $6,437(1) Assumes a 38% tax rate.
(2) Assumes mid-year convention.
Discounted Cash Flow Sensitivity Analysis - Cost Savings to Fun Technologies
Total DCF ValuationPresent Value of Terminal Total Present Value Assuming Implied Perpetuity Cash Flow
Projection Period Assuming Terminal Multiple Terminal Multiple Growth RatesCash Flow 10.5x 12.5x 14.5x 10.5x 12.5x 14.5x 10.5x 12.5x 14.5x
35.0% $2,322 $4,024 $4,790 $5,557 $6,346 $7,112 $7,879 25.5% 27.0% 28.1%38.5 2,168 3,586 4,269 4,952 5,754 6,437 7,120 29.0 30.5 31.642.0 2,029 3,205 3,816 4,426 5,235 5,845 6,456 32.5 34.0 35.1
48

Discussion of Liberty Case
Liberty annotated stock price analysis Salem Partners analyzed the catalysts for significant stock price movement of Liberty’s common stock in
order to determine whether there is precedent for an expected increase in Liberty’s stock upon an acquisition of GSN. While no precedent is obvious, we still believe an announcement would indicate further proof of
concept of Liberty Management’s business plan and could lead to a stock price increase. Given Liberty Capital’s current market capitalization, a 1% increase in stock price indicates a $153
million increase in market value.
Stock price as of
3/23/07: $23.39
2/13/07: Exchanges
shares with CBS;
tracked by LCAPA
7/21/05: Spins off
Discovery Holding Co.;
tracked by LCAPA
8/9/06: Reports 2nd quarter
results; revenue increased 16%
11/3/04: Enters into swap
transaction with News Corp.
6/7/04: Spins off
Liberty Media Int’l
5/24/02: Reports 1st
quarter results
3/27/03: Investment
into News Corp.
8/28/02: Acquires
stake in OpenTV
6/25/03: Withdraws
from Vivendi bidding
10/27/03: Reports
3rd quarter results
10/8/02: Amends
rights offering
5/16/06: Acquires
IDT Entertainment
7/26/06: Acquires
BUYSEASONS, Inc.
12/22/06: Acquires
large stake in DIRECTV;
tracked by LCAPA
49

Discussion of SPE CaseDiscussion of SPE Case

Discussion of SPE Case
Financial Projections The following chart sets forth the projected financial results for GSN under the SPE Case.
SPE Management’s projections of synergies were assumed.
($ in 000)For the Years Ended December 31, Projected for the Years Ending December 31,
2001A 2002A 2003A 2004A 2005A 2006A 2007E 2008E 2009E 2010E 2011E
RevenueAd Revenue (Net) $25,626 $33,518 $43,851 $49,742 $58,076 $62,292 $65,340 $71,114 $77,619 $84,853 $93,249Affiliate Revenue 33,711 39,800 44,576 53,066 58,763 61,483 65,300 71,203 75,834 80,706 86,443Participation Revenue 0 0 0 0 0 711 11,149 14,669 19,734 26,781 36,111Online Revenue 0 0 0 0 229 801 3,132 9,163 18,403 32,634 55,680Casino Revenue 0 0 0 0 375 710 1,000 1,450 1,850 2,250 2,500Other Revenue 8 27 31 34 118 626 813 1,229 1,756 2,656 3,865
Total Gross Revenue $59,345 $73,345 $88,458 $102,842 $117,561 $126,623 $146,734 $168,827 $195,196 $229,880 $277,848Launch Support Amort (22,008) (20,031) (12,813) (15,287) (14,449) (11,634) (6,865) (172) 0 0 0Online Revenue Share 0 0 0 0 (77) (296) (1,261) (3,397) (7,085) (12,796) (22,221)
Total Net Revenue $37,337 $53,314 $75,645 $87,555 $103,035 $114,693 $138,608 $165,258 $188,111 $217,084 $255,627
Operating CostsProgramming $21,368 $16,979 $26,713 $33,749 $39,393 $36,909 $41,205 $43,775 $50,722 $56,137 $61,565Participation Expense 0 0 0 0 0 859 8,599 9,483 10,818 12,641 15,107Network Operations 2,566 4,233 4,458 3,412 3,203 3,398 3,649 3,855 4,074 4,308 4,557Online/Interactive 714 2,795 4,050 4,370 5,295 6,375 8,748 9,109 9,640 10,478 10,751Marketing 5,018 15,670 14,157 26,421 24,421 25,520 26,015 24,639 25,946 27,339 28,828Ad Sales 4,692 5,410 6,084 6,012 6,533 6,823 7,502 3,158 3,483 3,761 4,063Affiliate Sales 3,298 5,953 4,947 3,220 4,444 4,795 4,833 4,703 4,991 5,299 5,631Gen & Admin 16,273 13,189 14,608 12,041 12,483 13,801 16,009 12,882 14,159 15,118 16,146Severance 0 0 0 0 0 0 0 1,177 0 0 0Moving Costs 0 0 0 0 0 0 0 1,000 0 0 0
Total Operating Costs $53,929 $64,229 $75,017 $89,225 $95,772 $98,479 $116,560 $113,780 $123,834 $135,082 $146,647
EBITDA ($16,592) ($10,915) $628 ($1,670) $7,263 $16,214 $22,048 $51,478 $64,278 $82,002 $108,980
Other Inc/(Exp) (756) (872) (1,104) (1,116) (237) (215) 32 60 453 661 969
Net Income ($17,348) ($11,787) ($476) ($2,786) $7,026 $15,998 $22,080 $51,538 $64,731 $82,664 $109,949
50

Discussion of SPE Case
Financial Projections – SPE Case versus Base Case The following chart highlights the changes from the Base Case to arrive to the SPE Case.
($ in 000)For the Years Ended December 31, Projected for the Years Ending December 31,
2001A 2002A 2003A 2004A 2005A 2006A 2007E 2008E 2009E 2010E 2011E
RevenueAd Revenue (Net) $0 $0 $0 $0 $0 $0 $0 $0 $0 $0 $0Affiliate Revenue 0 0 0 0 0 0 0 0 0 0 0Participation Revenue 0 0 0 0 0 0 0 0 0 0 0Online Revenue 0 0 0 0 0 0 0 0 0 0 0Casino Revenue 0 0 0 0 0 0 0 0 0 0 0Other Revenue 0 0 0 0 0 0 0 0 0 0 0
Total Gross Revenue $0 $0 $0 $0 $0 $0 $0 $0 $0 $0 $0Launch Support Amort 0 0 0 0 0 0 0 0 0 0 0Online Revenue Share 0 0 0 0 0 0 0 0 0 0 0
Total Net Revenue $0 $0 $0 $0 $0 $0 $0 $0 $0 $0 $0
Operating CostsProgramming $0 $0 $0 $0 $0 $0 $0 $0 $0 $0 $0Participation Expense 0 0 0 0 0 0 0 0 0 0 0Network Operations 0 0 0 0 0 0 0 0 0 0 0Online/Interactive 0 0 0 0 0 0 0 0 0 0 0Marketing 0 0 0 0 0 0 0 (2,738) (2,883) (3,038) (3,203)Ad Sales 0 0 0 0 0 0 0 (4,939) (5,448) (5,883) (6,355)Affiliate Sales 0 0 0 0 0 0 0 0 0 0 0Gen & Admin 0 0 0 0 0 0 0 (4,298) (4,556) (4,830) (5,123)Severance 0 0 0 0 0 0 0 1,177 0 0 0Moving Costs 0 0 0 0 0 0 0 1,000 0 0 0
Total Operating Costs $0 $0 $0 $0 $0 $0 $0 ($9,798) ($12,886) ($13,751) ($14,681)
EBITDA $0 $0 $0 $0 $0 $0 $0 $9,798 $12,886 $13,751 $14,681
Other Inc/(Exp) 0 0 0 0 0 0 0 0 0 0 0
Net Income $0 $0 $0 $0 $0 $0 $0 $9,798 $12,886 $13,751 $14,681
51

Discussion of Major Strategic CaseDiscussion of Major Strategic Case

Discussion of Major Strategic Case
Financial Projections The following chart sets forth the projected financial results for GSN under the Major Strategic
Case.
($ in 000)For the Years Ended December 31, Projected for the Years Ending December 31,
2001A 2002A 2003A 2004A 2005A 2006A 2007E 2008E 2009E 2010E 2011E
RevenueAd Revenue (Net) $25,626 $33,518 $43,851 $49,742 $58,076 $62,292 $65,340 $80,406 $90,784 $103,000 $117,922Affiliate Revenue 33,711 39,800 44,576 53,066 58,763 61,483 65,300 71,203 75,834 80,706 86,443Participation Revenue 0 0 0 0 0 711 11,149 14,669 19,734 26,781 36,111Online Revenue 0 0 0 0 229 801 3,132 9,163 18,403 32,634 55,680Casino Revenue 0 0 0 0 375 710 1,000 1,450 1,850 2,250 2,500Other Revenue 8 27 31 34 118 626 813 1,229 1,756 2,656 3,865
Total Gross Revenue $59,345 $73,345 $88,458 $102,842 $117,561 $126,623 $146,734 $178,119 $208,362 $248,028 $302,521Launch Support Amort (22,008) (20,031) (12,813) (15,287) (14,449) (11,634) (6,865) (172) 0 0 0Online Revenue Share 0 0 0 0 (77) (296) (1,261) (3,397) (7,085) (12,796) (22,221)
Total Net Revenue $37,337 $53,314 $75,645 $87,555 $103,035 $114,693 $138,608 $174,550 $201,277 $235,232 $280,300
Operating CostsProgramming $21,368 $16,979 $26,713 $33,749 $39,393 $36,909 $41,205 $43,858 $50,840 $56,301 $61,787Participation Expense 0 0 0 0 0 859 8,599 9,483 10,818 12,641 15,107Network Operations 2,566 4,233 4,458 3,412 3,203 3,398 3,649 3,855 4,074 4,308 4,557Online/Interactive 714 2,795 4,050 4,370 5,295 6,375 8,748 9,109 9,640 10,478 10,751Marketing 5,018 15,670 14,157 26,421 24,421 25,520 26,015 10,934 11,262 11,600 11,948Ad Sales 4,692 5,410 6,084 6,012 6,533 6,823 7,502 0 0 0 0Affiliate Sales 3,298 5,953 4,947 3,220 4,444 4,795 4,833 0 0 0 0Gen & Admin 16,273 13,189 14,608 12,041 12,483 13,801 16,009 8,590 9,358 9,974 10,635Severance 0 0 0 0 0 0 0 1,376 0 0 0Moving Costs 0 0 0 0 0 0 0 1,000 0 0 0
Total Operating Costs $53,929 $64,229 $75,017 $89,225 $95,772 $98,479 $116,560 $88,205 $95,993 $105,302 $114,785
EBITDA ($16,592) ($10,915) $628 ($1,670) $7,263 $16,214 $22,048 $86,345 $105,284 $129,930 $165,515
Other Inc/(Exp) (756) (872) (1,104) (1,116) (237) (215) 32 60 453 661 969
Net Income ($17,348) ($11,787) ($476) ($2,786) $7,026 $15,998 $22,080 $86,405 $105,737 $130,592 $166,484
52

Discussion of Major Strategic Case
Financial Projections – Major Strategic Case versus Base Case The following chart highlights the changes from the Base Case to arrive to the Major Strategic
Case.
($ in 000)For the Years Ended December 31, Projected for the Years Ending December 31,
2001A 2002A 2003A 2004A 2005A 2006A 2007E 2008E 2009E 2010E 2011E
RevenueAd Revenue (Net) $0 $0 $0 $0 $0 $0 $0 $9,292 $13,165 $18,148 $24,673Affiliate Revenue 0 0 0 0 0 0 0 0 0 0 0Participation Revenue 0 0 0 0 0 0 0 0 0 0 0Online Revenue 0 0 0 0 0 0 0 0 0 0 0Casino Revenue 0 0 0 0 0 0 0 0 0 0 0Other Revenue 0 0 0 0 0 0 0 0 0 0 0
Total Gross Revenue $0 $0 $0 $0 $0 $0 $0 $9,292 $13,165 $18,148 $24,673Launch Support Amort 0 0 0 0 0 0 0 0 0 0 0Online Revenue Share 0 0 0 0 0 0 0 0 0 0 0
Total Net Revenue $0 $0 $0 $0 $0 $0 $0 $9,292 $13,165 $18,148 $24,673
Operating CostsProgramming $0 $0 $0 $0 $0 $0 $0 $84 $118 $163 $222Participation Expense 0 0 0 0 0 0 0 0 0 0 0Network Operations 0 0 0 0 0 0 0 0 0 0 0Online/Interactive 0 0 0 0 0 0 0 0 0 0 0Marketing 0 0 0 0 0 0 0 (16,443) (17,566) (18,777) (20,083)Ad Sales 0 0 0 0 0 0 0 (8,097) (8,931) (9,644) (10,417)Affiliate Sales 0 0 0 0 0 0 0 (4,703) (4,991) (5,299) (5,631)Gen & Admin 0 0 0 0 0 0 0 (8,590) (9,358) (9,974) (10,635)Severance 0 0 0 0 0 0 0 1,376 0 0 0Moving Costs 0 0 0 0 0 0 0 1,000 0 0 0
Total Operating Costs $0 $0 $0 $0 $0 $0 $0 ($35,373) ($40,727) ($43,531) ($46,543)
EBITDA $0 $0 $0 $0 $0 $0 $0 $44,665 $53,892 $61,679 $71,217
Other Inc/(Exp) 0 0 0 0 0 0 0 0 0 0 0
Net Income $0 $0 $0 $0 $0 $0 $0 $44,665 $53,892 $61,679 $71,217
53

Discussion of Major Strategic Case
Ratings Increase due to Major Strategic Acquisition The chart below illustrates the ratings increase that occurred when Viacom was acquired by MTV
Networks. These transactions represent recent consolidations of formerly independent channels into major
media companies. We believe that cross promotion was the primary driver of the ratings increases.
Ratings Increase Due to Acquisition
24
-Ho
ur
Nie
lse
n R
ati
ng
s
Notes: The Chapelle Show premiered on Comedy Central in November 03 (T+7).
Notes: Each data point represents one month.
0.10
0.20
0.30
0.40
0.50
0.60
0.70
0.80
T-9 T-8 T-7 T-6 T-5 T-4 T-3 T-2 T-1 0 T+1 T+2 T+3 T+4 T+5 T+6 T+7 T+8 T+9 T+10 T+11 T+12 T+13 T+14 T+15 T+16 T+17 T+18 T+19 T+20
Comedy Central
Acquisition Date
0.46
54
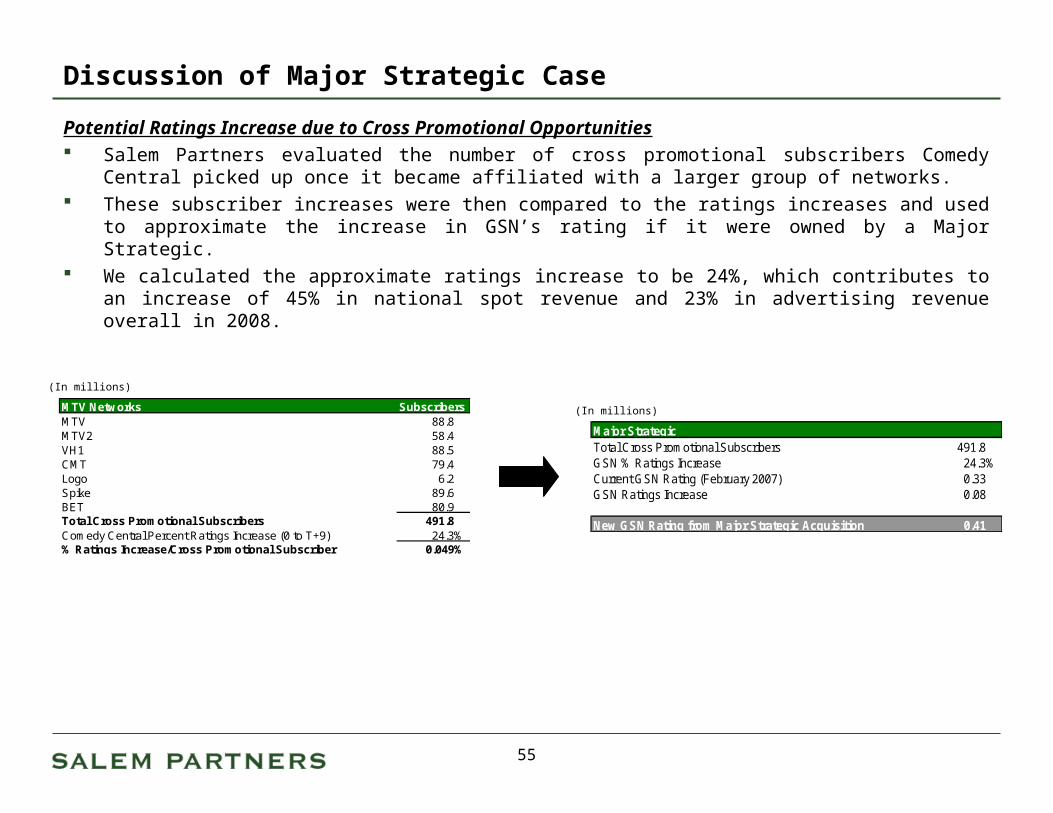
Discussion of Major Strategic Case
Potential Ratings Increase due to Cross Promotional Opportunities Salem Partners evaluated the number of cross promotional subscribers Comedy Central picked up once it
became affiliated with a larger group of networks. These subscriber increases were then compared to the ratings increases and used to approximate the
increase in GSN’s rating if it were owned by a Major Strategic. We calculated the approximate ratings increase to be 24%, which contributes to an increase of 45% in
national spot revenue and 23% in advertising revenue overall in 2008.
(In millions)
(In millions)
Major StrategicTotal Cross Promotional Subscribers 491.8GSN % Ratings Increase 24.3%Current GSN Rating (February 2007) 0.33GSN Ratings Increase 0.08
New GSN Rating from Major Strategic Acquisition 0.41
MTV Networks SubscribersMTV 88.8MTV2 58.4VH1 88.5CMT 79.4Logo 6.2Spike 89.6BET 80.9Total Cross Promotional Subscribers 491.8Comedy Central Percent Ratings Increase (0 to T+9) 24.3%% Ratings Increase/Cross Promotional Subscriber 0.049%
55

GSN Valuation AnalysisGSN Valuation Analysis
GSN Valuation Analysis
Introduction Salem Partners’ valuation of GSN is based on a number of analyses, including:
Discounted projected cash flow: A detailed discounted cash flow valuation analysis applied to the Base Case, the Liberty Case, the SPE Case and the Major Strategic Case.
Precedent comparable transactions: An analysis of precedent transactions involving cable network companies, online gaming and content companies and international cable networks companies.
Public market comparables: An analysis of publicly-traded cable network companies, online gaming companies and international cable networks companies.
Salem Partners believes that the most relevant valuation analyses for GSN’s linear channel is the discounted cash flow analysis.
We have valued the online business utilizing two primary methodologies, a discounted cash flow analysis and an analysis of precedent transactions.
The opportunity to create international versions of GSN was valued considering a number of precedent transactions and a discounted value analysis.
56
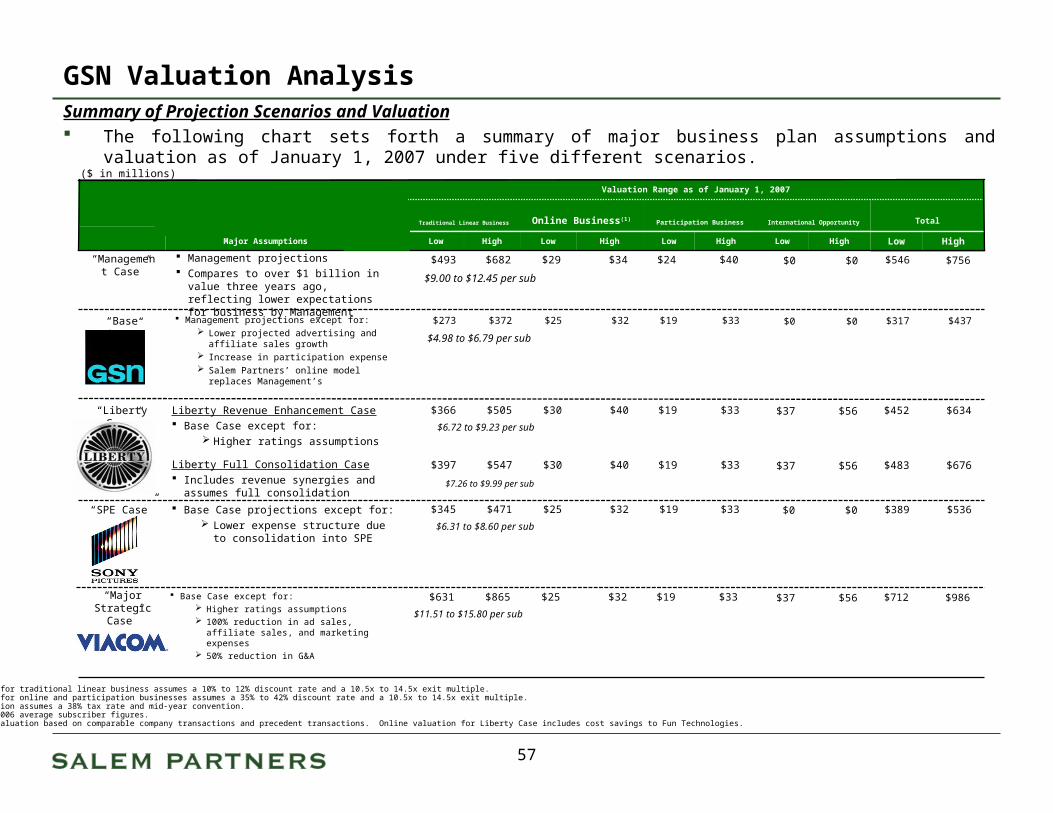
GSN Valuation AnalysisSummary of Projection Scenarios and Valuation The following chart sets forth a summary of major business plan assumptions and valuation as of January 1, 2007
under five different scenarios.
Note: Range for traditional linear business assumes a 10% to 12% discount rate and a 10.5x to 14.5x exit multiple. Note: Range for online and participation businesses assumes a 35% to 42% discount rate and a 10.5x to 14.5x exit multiple. Note: Valuation assumes a 38% tax rate and mid-year convention.Note: Uses 2006 average subscriber figures.(1) Online valuation based on comparable company transactions and precedent transactions. Online valuation for Liberty Case includes cost savings to Fun Technologies.
“Liberty Case”
“Management Case”
Base Case except for: Higher ratings assumptions 100% reduction in ad sales, affiliate
sales, and marketing expenses 50% reduction in G&A
($ in millions)
Valuation Range as of January 1, 2007
Participation BusinessOnline Business(1)Traditional Linear Business
Base Case projections except for: Lower expense structure due to
consolidation into SPE
“SPE Case”
$33$19$40$30$505$366Liberty Revenue Enhancement Case Base Case except for:
Higher ratings assumptions
Liberty Full Consolidation Case Includes revenue synergies and assumes full
consolidation
$33$19$32$25$372$273 Management projections except for: Lower projected advertising and affiliate
sales growth Increase in participation expense Salem Partners’ online model replaces
Management’s
“Base Case”
HighLowHighLowHighLowMajor Assumptions
International Opportunity
$56$37
$0$0
HighLow
Total
$634$452
$437$317
HighLow
$33$19$40$30$547$397 $56$37 $676$483
$4.98 to $6.79 per sub
$6.72 to $9.23 per sub
$7.26 to $9.99 per sub
$33$19$32$25$471$345 $0$0 $536$389
$6.31 to $8.60 per sub
“Major Strategic
Case”
$33$19$32$25$865$631 $56$37 $986$712
$11.51 to $15.80 per sub
$40$24$34$29$682$493 $0$0 $756$546
$9.00 to $12.45 per sub
Management projections Compares to over $1 billion in value three
years ago, reflecting lower expectations for business by Management
57

GSN Valuation Analysis
Discounted Cash Flow Analysis Salem Partners often utilizes a discounted cash flow analysis (“DCF”), among other analyses, for
determining the fair market value of a company or asset. This approach estimates the present value of the projected cash flows expected to be generated by certain assets, and available to the owners of the assets.
The two components to this cash flow analysis are: Estimated cash flows generated from January 1, 2007 through December 31, 2011 (the “Projection
Period”) from the operations of GSN. The value of GSN at the end of the projection period (the “Terminal Value”). This value is calculated
using a multiple of free cash flow in the final year of the Projection Period, which is determined by estimating GSN’s perpetuity free cash flow growth rate.
– Each of these values are then discounted to January 1, 2007 using the appropriate discount rate. The appropriate discount rate in a DCF analysis should reflect all risk of ownership and the corresponding risks of achieving the forecasted cash flows. It can also be interpreted as the rate of return that would be required by a capital investor to compensate them for the time value of their money as well as the inherent risk of the investment.
Salem Partners has performed a detailed Weighted-Average Cost of Capital (“WACC”) analysis as a means of determining an appropriate and accurate range of discount rates. We have analyzed the WACC of public cable network companies as a basis for our estimates of the appropriate discount rates.
We have also calculated a theoretical cost of capital for GSN utilizing a number of market-based assumptions.
Salem Partners used two different ranges of discount rates to value the traditional linear business (ad and affiliate revenue) and the new media business (online and participation revenue).
58

GSN Valuation Analysis
Summary Discounted Cash Flow Analysis – Traditional Linear Business The chart below illustrates a sensitivity analysis for the discounted cash flow valuation for GSN utilizing
various discount rate, terminal multiples and implied perpetuity cash flow growth rates.($ in 000)
Discounted Cash Flow Sensitivity Analysis - Traditional Linear Business - Major Strategic Case
Total DCF ValuationPresent Value of Terminal Total Present Value Assuming Implied Perpetuity Cash Flow
Projection Period Assuming Terminal Multiple Terminal Multiple Growth RatesCash Flow 10.5x 12.5x 14.5x 10.5x 12.5x 14.5x 10.5x 12.5x 14.5x
10.0% $187,414 $490,813 $584,301 $677,789 $678,227 $771,715 $865,204 0.5% 2.0% 3.1%11.0 182,572 471,226 560,984 650,741 653,799 743,556 833,314 1.5 3.0 4.112.0 177,920 452,587 538,794 625,001 630,507 716,714 802,921 2.5 4.0 5.1
Discounted Cash Flow Sensitivity Analysis - Traditional Linear Business - SPE Case
Total DCF ValuationPresent Value of Terminal Total Present Value Assuming Implied Perpetuity Cash Flow
Projection Period Assuming Terminal Multiple Terminal Multiple Growth RatesCash Flow 10.5x 12.5x 14.5x 10.5x 12.5x 14.5x 10.5x 12.5x 14.5x
10.0% $108,637 $262,524 $312,529 $362,534 $371,162 $421,166 $471,171 0.5% 2.0% 3.1%11.0 105,964 252,048 300,057 348,066 358,012 406,021 454,031 1.5 3.0 4.112.0 103,395 242,078 288,188 334,298 345,473 391,583 437,693 2.5 4.0 5.1
Discounted Cash Flow Sensitivity Analysis - Traditional Linear Business - Liberty Case with Cost Savings
Total DCF ValuationPresent Value of Terminal Total Present Value Assuming Implied Perpetuity Cash Flow
Projection Period Assuming Terminal Multiple Terminal Multiple Growth RatesCash Flow 10.5x 12.5x 14.5x 10.5x 12.5x 14.5x 10.5x 12.5x 14.5x
10.0% $114,546 $313,065 $372,696 $432,328 $427,611 $487,243 $546,874 0.5% 2.0% 3.1%11.0 111,601 300,572 357,823 415,075 412,173 469,424 526,676 1.5 3.0 4.112.0 108,772 288,682 343,670 398,657 397,454 452,442 507,429 2.5 4.0 5.1
59
Discounted Cash Flow Sensitivity Analysis - Traditional Linear Business - Base Case
Total DCF ValuationPresent Value of Terminal Total Present Value Assuming Implied Perpetuity Cash Flow
Projection Period Assuming Terminal Multiple Terminal Multiple Growth RatesCash Flow 10.5x 12.5x 14.5x 10.5x 12.5x 14.5x 10.5x 12.5x 14.5x
10.0% $86,851 $206,253 $245,539 $284,825 $293,104 $332,390 $371,676 0.5% 2.0% 3.1%11.0 84,766 198,022 235,740 273,459 282,788 320,507 358,225 1.5 3.0 4.112.0 82,762 190,189 226,416 262,642 272,951 309,178 345,404 2.5 4.0 5.1

GSN Valuation Analysis
Base Case Discounted Cash Flow Analysis The chart below illustrates the summary discounted cash flow valuation analysis for GSN’s
traditional linear business assuming Base Case projections.
(1) Allocation between traditional linear and new media businesses based on revenue contribution.(2) Assumes a 38% tax rate.(3) Valuation as of January 1, 2007, assumes mid-year convention.
($ in 000)Traditional Linear Business Results for the Years
Ended December 31, Projected Results for the Years Ending December 31,2005A 2006A 2007E 2008E 2009E 2010E 2011E
6/30/2007 6/30/2008 6/30/2009 6/30/2010 6/30/2011Revenue
Advertising Revenue $58,076 $62,292 $65,340 $71,114 $77,619 $84,853 $93,249Affiliate Revenue 58,763 61,483 65,300 71,203 75,834 80,706 86,443Casino Revenue 375 710 1,000 1,450 1,850 2,250 2,500Other Revenue 118 626 813 1,229 1,756 2,656 3,865
Total Revenue $117,333 $125,111 $132,453 $144,995 $157,059 $170,465 $186,057Less Expenses:
Programming Costs $5,230 $5,682 $5,926 $6,470 $6,959 $7,465 $7,998Acquisitions & Scheduling 307 309 332 357 384 412 443Network Operations 3,203 3,398 3,649 3,855 4,074 4,308 4,557Ad Sales 6,533 6,823 7,502 8,097 8,931 9,644 10,417Affiliate Sales 4,444 4,795 4,833 4,703 4,991 5,299 5,631G&A(1)
12,467 13,669 14,577 15,058 15,626 15,664 15,481Marketing 24,421 25,520 26,015 27,377 28,828 30,377 32,031Severance 0 0 0 0 0 0 0Moving Costs 0 0 0 0 0 0 0
Total Expenses $56,605 $60,195 $62,834 $65,917 $69,793 $73,170 $76,558Cash Taxes(2)
($5,411) ($9,245) ($11,419) ($16,925) ($17,655) ($19,690) ($22,531)Other Working Capital Changes(1)
(801) (23,955) (1,751) (3,739) 7,244 (3,568) 2,841Production / Acquisition Costs (40,942) (25,973) (40,700) (36,775) (54,102) (44,822) (58,421)Cash Launch Incentives 0 0 0 0 0 0 0Fixed Asset CapEx 0 (857) (2,620) (1,225) (1,225) (1,225) (1,225)
Free Cash Flow $13,572 $4,885 $13,129 $20,415 $21,528 $27,990 $30,163
Discount Rate 11.0%PV of Cash Flow at 6/30/2007 89,307
Total PV of Cash Flow at 12/31/2007(3) $84,766 26.4% of ValuationTerminal Value at 12/31/2007(3) 235,740 73.6% of Valuation 3.0% Growth Rate
Total Enterprise Value $320,507
Implied Terminal Value Multiple 12.5x
60
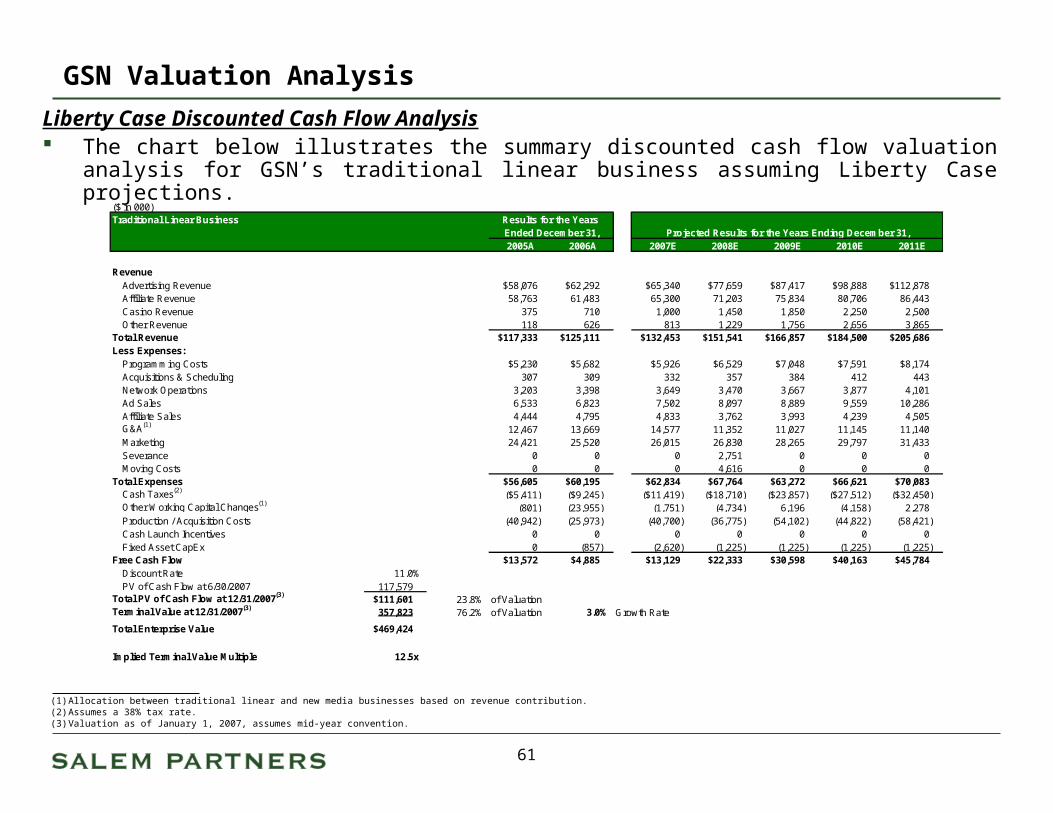
GSN Valuation Analysis
Liberty Case Discounted Cash Flow Analysis The chart below illustrates the summary discounted cash flow valuation analysis for GSN’s
traditional linear business assuming Liberty Case projections.
(1) Allocation between traditional linear and new media businesses based on revenue contribution.(2) Assumes a 38% tax rate.(3) Valuation as of January 1, 2007, assumes mid-year convention.
($ in 000)Traditional Linear Business Results for the Years
Ended December 31, Projected Results for the Years Ending December 31,2005A 2006A 2007E 2008E 2009E 2010E 2011E
6/30/2007 6/30/2008 6/30/2009 6/30/2010 6/30/2011Revenue
Advertising Revenue $58,076 $62,292 $65,340 $77,659 $87,417 $98,888 $112,878Affiliate Revenue 58,763 61,483 65,300 71,203 75,834 80,706 86,443Casino Revenue 375 710 1,000 1,450 1,850 2,250 2,500Other Revenue 118 626 813 1,229 1,756 2,656 3,865
Total Revenue $117,333 $125,111 $132,453 $151,541 $166,857 $184,500 $205,686Less Expenses:
Programming Costs $5,230 $5,682 $5,926 $6,529 $7,048 $7,591 $8,174Acquisitions & Scheduling 307 309 332 357 384 412 443Network Operations 3,203 3,398 3,649 3,470 3,667 3,877 4,101Ad Sales 6,533 6,823 7,502 8,097 8,889 9,559 10,286Affiliate Sales 4,444 4,795 4,833 3,762 3,993 4,239 4,505G&A(1)
12,467 13,669 14,577 11,352 11,027 11,145 11,140Marketing 24,421 25,520 26,015 26,830 28,265 29,797 31,433Severance 0 0 0 2,751 0 0 0Moving Costs 0 0 0 4,616 0 0 0
Total Expenses $56,605 $60,195 $62,834 $67,764 $63,272 $66,621 $70,083Cash Taxes(2)
($5,411) ($9,245) ($11,419) ($18,710) ($23,857) ($27,512) ($32,450)Other Working Capital Changes(1)
(801) (23,955) (1,751) (4,734) 6,196 (4,158) 2,278Production / Acquisition Costs (40,942) (25,973) (40,700) (36,775) (54,102) (44,822) (58,421)Cash Launch Incentives 0 0 0 0 0 0 0Fixed Asset CapEx 0 (857) (2,620) (1,225) (1,225) (1,225) (1,225)
Free Cash Flow $13,572 $4,885 $13,129 $22,333 $30,598 $40,163 $45,784
Discount Rate 11.0%PV of Cash Flow at 6/30/2007 117,579
Total PV of Cash Flow at 12/31/2007(3) $111,601 23.8% of ValuationTerminal Value at 12/31/2007(3) 357,823 76.2% of Valuation 3.0% Growth Rate
Total Enterprise Value $469,424
Implied Terminal Value Multiple 12.5x
61

GSN Valuation Analysis
SPE Case Discounted Cash Flow Analysis The chart below illustrates the summary discounted cash flow valuation analysis for GSN’s
traditional linear business assuming SPE Case projections.
(1) Allocation between traditional linear and new media businesses based on revenue contribution.(2) Assumes a 38% tax rate.(3) Valuation as of January 1, 2007, assumes mid-year convention.
($ in 000)Traditional Linear Business Results for the Years
Ended December 31, Projected Results for the Years Ending December 31,2005A 2006A 2007E 2008E 2009E 2010E 2011E
6/30/2007 6/30/2008 6/30/2009 6/30/2010 6/30/2011Revenue
Advertising Revenue $58,076 $62,292 $65,340 $71,114 $77,619 $84,853 $93,249Affiliate Revenue 58,763 61,483 65,300 71,203 75,834 80,706 86,443Casino Revenue 375 710 1,000 1,450 1,850 2,250 2,500Other Revenue 118 626 813 1,229 1,756 2,656 3,865
Total Revenue $117,333 $125,111 $132,453 $144,995 $157,059 $170,465 $186,057Less Expenses:
Programming Costs $5,230 $5,682 $5,926 $6,470 $6,959 $7,465 $7,998Acquisitions & Scheduling 307 309 332 357 384 412 443Network Operations 3,203 3,398 3,649 3,855 4,074 4,308 4,557Ad Sales 6,533 6,823 7,502 3,158 3,483 3,761 4,063Affiliate Sales 4,444 4,795 4,833 4,703 4,991 5,299 5,631G&A(1)
12,467 13,669 14,577 11,291 11,822 11,871 11,752Marketing 24,421 25,520 26,015 24,639 25,946 27,339 28,828Severance 0 0 0 1,177 0 0 0Moving Costs 0 0 0 1,000 0 0 0
Total Expenses $56,605 $60,195 $62,834 $56,650 $57,659 $60,456 $63,271Cash Taxes(2)
($5,411) ($9,245) ($11,419) ($20,446) ($22,266) ($24,521) ($27,580)Other Working Capital Changes(1)
(801) (23,955) (1,751) (3,865) 7,236 (3,577) 2,833Production / Acquisition Costs (40,942) (25,973) (40,700) (36,775) (54,102) (44,822) (58,421)Cash Launch Incentives 0 0 0 0 0 0 0Fixed Asset CapEx 0 (857) (2,620) (1,225) (1,225) (1,225) (1,225)
Free Cash Flow $13,572 $4,885 $13,129 $26,034 $29,042 $35,864 $38,393
Discount Rate 11.0%PV of Cash Flow at 6/30/2007 111,640
Total PV of Cash Flow at 12/31/2007(3) $105,964 26.1% of ValuationTerminal Value at 12/31/2007(3) 300,057 73.9% of Valuation 3.0% Growth Rate
Total Enterprise Value $406,021
Implied Terminal Value Multiple 12.5x
62
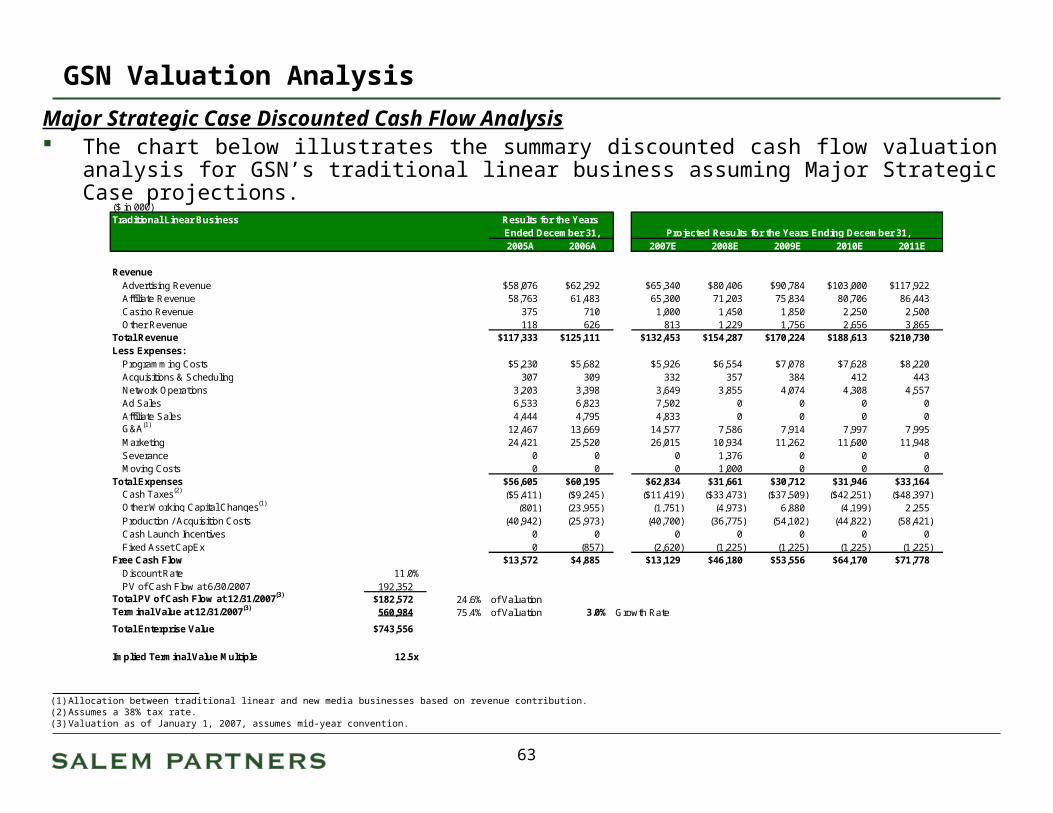
GSN Valuation Analysis
Major Strategic Case Discounted Cash Flow Analysis The chart below illustrates the summary discounted cash flow valuation analysis for GSN’s
traditional linear business assuming Major Strategic Case projections.
(1) Allocation between traditional linear and new media businesses based on revenue contribution.(2) Assumes a 38% tax rate.(3) Valuation as of January 1, 2007, assumes mid-year convention.
($ in 000)Traditional Linear Business Results for the Years
Ended December 31, Projected Results for the Years Ending December 31,2005A 2006A 2007E 2008E 2009E 2010E 2011E
6/30/2007 6/30/2008 6/30/2009 6/30/2010 6/30/2011Revenue
Advertising Revenue $58,076 $62,292 $65,340 $80,406 $90,784 $103,000 $117,922Affiliate Revenue 58,763 61,483 65,300 71,203 75,834 80,706 86,443Casino Revenue 375 710 1,000 1,450 1,850 2,250 2,500Other Revenue 118 626 813 1,229 1,756 2,656 3,865
Total Revenue $117,333 $125,111 $132,453 $154,287 $170,224 $188,613 $210,730Less Expenses:
Programming Costs $5,230 $5,682 $5,926 $6,554 $7,078 $7,628 $8,220Acquisitions & Scheduling 307 309 332 357 384 412 443Network Operations 3,203 3,398 3,649 3,855 4,074 4,308 4,557Ad Sales 6,533 6,823 7,502 0 0 0 0Affiliate Sales 4,444 4,795 4,833 0 0 0 0G&A(1)
12,467 13,669 14,577 7,586 7,914 7,997 7,995Marketing 24,421 25,520 26,015 10,934 11,262 11,600 11,948Severance 0 0 0 1,376 0 0 0Moving Costs 0 0 0 1,000 0 0 0
Total Expenses $56,605 $60,195 $62,834 $31,661 $30,712 $31,946 $33,164Cash Taxes(2)
($5,411) ($9,245) ($11,419) ($33,473) ($37,509) ($42,251) ($48,397)Other Working Capital Changes(1)
(801) (23,955) (1,751) (4,973) 6,880 (4,199) 2,255Production / Acquisition Costs (40,942) (25,973) (40,700) (36,775) (54,102) (44,822) (58,421)Cash Launch Incentives 0 0 0 0 0 0 0Fixed Asset CapEx 0 (857) (2,620) (1,225) (1,225) (1,225) (1,225)
Free Cash Flow $13,572 $4,885 $13,129 $46,180 $53,556 $64,170 $71,778
Discount Rate 11.0%PV of Cash Flow at 6/30/2007 192,352
Total PV of Cash Flow at 12/31/2007(3) $182,572 24.6% of ValuationTerminal Value at 12/31/2007(3) 560,984 75.4% of Valuation 3.0% Growth Rate
Total Enterprise Value $743,556
Implied Terminal Value Multiple 12.5x
63

GSN Valuation Analysis
WACC Analysis The chart below is a detailed WACC analysis for Outdoor Channel, Crown Media and
Viacom.
Weighted Average Cost of Capital Analysis
3/29/2007
Beta (1) Assumptions
Outdoor Channel 0.79 10-yr. Risk Free Rate 4.6% (2)
Equity Risk Premium 8.0 (3)
Crown Media 2.44 Outdoor Channel Tax Rate 34.8Crown Media Tax Rate 0.0
Viacom 1.10 Viacom Tax Rate 31.6
Market Value Pre-Tax Cost Market Value Levered Unlevered Costof Debt of Debt of Equity Beta Beta of Equity WACC
Outdoor Channel $2,360 12.5% $256,291 0.79 0.78 10.9% 10.8%
Crown Media 754,117 9.4 551,185 2.44 1.03 12.9% 10.9
Viacom 7,647,900 6.4 28,240,052 1.10 0.93 12.0% 10.4
Average WACC: 10.7%
Notes:
USD in thousands.
(1) 5 Year beta versus the S&P 500.
(2) The Risk Free Rate is the current yield on the 10-yr. US Treasury Bond as of March 28, 2007.
(3) Calculated as the difference between the expected return on stocks and the expected return on a low-risk asset, as estimated by Salem Partners.
64

GSN Valuation Analysis
Perpetuity Growth Matrix
Note: Free Cash Flow equals EBIT after applying a 38% tax rate.
Free Cash Flow Multiple DerivationSustainable Growth Rate
12.5x 2.0% 3.0% 4.0% 5.0% 6.0%10.0% 12.5x 14.3x 16.7x 20.0x 25.0x11.0% 11.1 12.5 14.3 16.7 20.012.0% 10.0 11.1 12.5 14.3 16.713.0% 9.1 10.0 11.1 12.5 14.314.0% 8.3 9.1 10.0 11.1 12.515.0% 7.7 8.3 9.1 10.0 11.1
WA
CC
EBIT Multiple DerivationSustainable Growth Rate
10.0x 2.0% 3.0% 4.0% 5.0% 6.0%10.0% 7.8x 8.9x 10.3x 12.4x 15.5x11.0% 6.9 7.8 8.9 10.3 12.412.0% 6.2 6.9 7.8 8.9 10.313.0% 5.6 6.2 6.9 7.8 8.914.0% 5.2 5.6 6.2 6.9 7.815.0% 4.8 5.2 5.6 6.2 6.9
WA
CC
65

GSN Valuation Analysis
Precedent Transaction Analysis – Cable Networks Salem Partners has analyzed 28 precedent transactions involving cable network companies
since 1993. These transactions have been mergers, acquisitions or investments that have resulted
in a significant equity stake in a cable network company, including situations where a company has been acquired, an entire controlling stake in a company has been acquired, or a company has taken a significant equity stake of a company.
These transactions are more likely to include a ‘control premium’ paid by the acquiror.
These precedent transactions are indicative of the historical prices paid for equity interests in cable networks. Typical metrics to analyze in a transaction are enterprise value per subscriber and
enterprise value divided by EBITDA. Many of these transactions are outdated and many in the industry place less emphasis
on per subscriber multiples in valuing channels than they did 10 years ago.
66

GSN Valuation Analysis
Precedent Transaction Analysis The chart below illustrates precedent transactions in the cable network industry.
Note: Enterprise value is defined as the total equity value of the target company less certain assets, including cash and marketable securities, and plus certain liabilities, such as debt and minority interest. Does not include 3/29/2007 Travel Channel transaction as a value was not disclosed.
($ in millions) ImpliedEquity Implied Enterprise Implied EV /
Date % of Value of Enterprise Value / Target LTM EBITDAAnnounced Target Name Acquiror Name Shares Acq. Transaction Value Subs Subscriber LTM EBITDA Multiple
9/06 E! Entertainment Television Comcast 39.5% $1,230 $3,114 88.0 $35.39 NA NA5/06 Court TV Time Warner Inc. 50.0 735 1,470 84.5 17.40 83.4 17.6x3/04 TechTV, LLC Comcast 100.0 300 300 21.0 14.29 NA NA7/03 QVC Liberty Media 57.0 7,900 13,860 85.0 163.05 858.0 16.24/03 Comedy Central Viacom 50.0 1,225 2,467 82.0 (j) 30.08 108.0 (af) 22.811/02 Bravo NBC (General Electric) 100.0 1,250 1,250 68.0 (k) 18.38 58.8 (ag) 21.34/02 Discovery Civilization New York Times 50.0 100 200 14.0 (n) 14.29 NA NA10/01 Telemundo NBC (General Electric) 100.0 1,980 2,657 90.0 (p) 29.52 97.0 (p) 27.49/01 The Health Network Discovery Communications 90.0 255 283 24.5 (q) 11.56 NA NA7/01 Fox Family Worldwide Walt Disney Co. 100.0 2,900 5,200 81.0 (r) 64.20 198.4 (ah) 26.25/01 The Golf Channel Comcast Corp. 30.8 365 1,185 46.0 (s) 25.76 NA NA5/01 Outdoor Life Channel Comcast 83.2 512 616 36.7 (o) 16.77 NA NA3/01 Speedvision Fox Cable Networks Group 53.4 401 750 43.8 (t) 17.13 NA NA3/01 Outdoor Life Network Fox Cable Networks Group 50.2 309 615 36.7 (t) 16.76 NA NA11/00 BET Holdings Inc. Viacom 100.0 2,410 (d) 3,000 62.4 (v) 48.08 110.0 (am) 27.38/00 The Game Show Network Liberty Digitial / AT&T Corp. 50.0 275 550 27.8 (w) 19.78 NM NM5/00 Trio and NWI USA 100.0 100 100 11.7 (y) 8.55 NA NA2/00 The Golf Channel Comcast 20.2 138 682 30.0 22.74 NA NA3/98 BET Holdings Inc. Liberty Media 32.0 455 (e) 1,490 62.4 23.88 83.0 18.09/97 USA Networks / Sci-Fi Seagram Co. Ltd. 50.0 1,700 3,400 119.0 (ac) 28.57 NA NA9/97 Classic Sports Network ESPN (Disney) 100.0 175 175 10.0 17.50 NM (aa) NM9/97 Food Network E.W. Scripps 57.0 133 234 26.5 8.82 NM NM7/97 Box Worldwide Inc. TCI Music (TCI - Liberty) 100.0 42 (g) 42 3.5 11.96 NM NM6/97 The Family Channel Fox Kids Worldwide 100.0 1,713 1,862 68.1 27.34 (ad) 69.5 26.8 (ad)1/97 E! Entertainment Television Disney / Comcast 68.8 322 468 42.0 11.14 NA NA2/97 TNN / CMT Westinghouse (CBS) 100.0 1,500 1,542 133.7 (ab) 11.54 NA (ak) NA3/94 Lifetime Capital Cities (ABC) / Hearst 16.7 159 954 59.0 16.17 47.7 20.09/93 American Movie Classics Cablevision Systems 50.0 195 375 46.0 8.15 NA (ab) NA
67
GSN Valuation Analysis
Public Market Comparables – Cable Networks Salem Partners has selected the following companies to compare their trading values to the
value of GSN: Discovery Holdings, Ltd. (“Discovery Holdings”)
– Discovery Holdings, Ltd. holds 50% interest in Discovery Communications, Inc., which operates and manages a portfolio of channels, including Discovery Channel, TLC, Animal Planet and Discovery Kids.
– Discovery Channel, one of Discovery Holdings’ networks, has over 90 million subscribers and is one of top ten cable networks when ranked by ratings.
Outdoor Channel Holdings, Inc. (“Outdoor Channel”):– Outdoor Channel is an independent cable network that focuses primarily on
hunting, fishing and motorsports programming.– Outdoor Channel has over 31 million subscribers as well as carriage with most of
the major MSOs and satellite service providers, including DirecTV, Comcast, Time Warner, Cox, Charter and others.
Crown Media Holdings, Inc. (“Crown”):– Crown is an independent cable network operator that owns and operates The
Hallmark Channel (“Hallmark Channel”).– In 2006, Crown sold its film library to RHI.– Crown has over 75 million domestic subscribers and is one of top ten cable
networks when ranked by ratings.
68

GSN Valuation Analysis
Public Market Comparables The chart below illustrates financial metrics and valuation multiples for Discovery Holdings,
Outdoor Channel and Crown.
Note: Stock price as of March 28, 2007.
($ in 000)Discovery Holdings
Outdoor Channel Crown Media
Equity Market Capitalization $5,130,877 $256,291 $551,185Plus: Debt 0 2,360 754,117Less: Cash (154,775) (15,447) (13,965)Enterprise Value $4,976,102 $243,204 $1,291,337
Revenues (LTM) $688,087 $48,522 $201,179EBITDA (LTM) 161,644 (637) 134,644EBIT (LTM) 93,715 (4,144) (74,945)
Enterprise Value / EBITDA 30.8 NM 9.6Enterprise Value / EBIT 53.1 NM NMEnterprise Value / Subscriber Value $54.15 $7.72 $17.31
69

GSN Valuation Analysis
Base Case Summary Valuation Analysis – Online Business The chart below illustrates the summary valuation analysis for GSN’s online business.
Summary Valuation
DCF Valuation $47,359Comparable Company Analysis Valuation 24,631Precedent Transaction Valuation 32,321
Break Even Discount Rate to get to Comparable Company Valuation 44.1%Break Even Discount Rate to get to Precedent Transaction Valuation 41.5
70
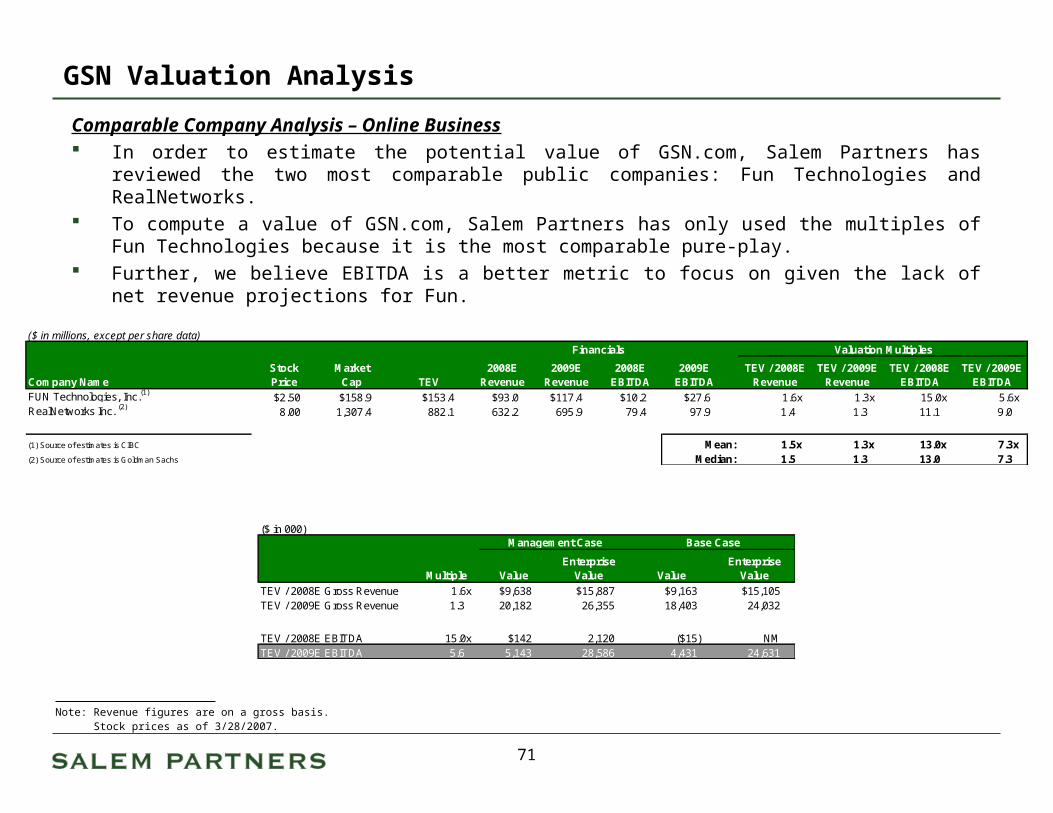
GSN Valuation Analysis
Comparable Company Analysis – Online Business In order to estimate the potential value of GSN.com, Salem Partners has reviewed the two most
comparable public companies: Fun Technologies and RealNetworks. To compute a value of GSN.com, Salem Partners has only used the multiples of Fun Technologies
because it is the most comparable pure-play. Further, we believe EBITDA is a better metric to focus on given the lack of net revenue projections for
Fun.
Note: Revenue figures are on a gross basis. Note: Stock prices as of 3/28/2007.
($ in millions, except per share data)Financials Valuation Multiples
Company NameStockPrice
Market Cap TEV
2008ERevenue
2009ERevenue
2008E EBITDA
2009E EBITDA
TEV / 2008E Revenue
TEV / 2009E Revenue
TEV / 2008E EBITDA
TEV / 2009E EBITDA
FUN Technologies, Inc.(1)$2.50 $158.9 $153.4 $93.0 $117.4 $10.2 $27.6 1.6x 1.3x 15.0x 5.6x
RealNetworks Inc. (2)8.00 1,307.4 882.1 632.2 695.9 79.4 97.9 1.4 1.3 11.1 9.0
(1) Source of estimates is CIBC Mean: 1.5x 1.3x 13.0x 7.3x(2) Source of estimates is Goldman Sachs Median: 1.5 1.3 13.0 7.3
($ in 000)Management Case Base Case
Multiple ValueEnterprise
Value ValueEnterprise
Value
TEV / 2008E Gross Revenue 1.6x $9,638 $15,887 $9,163 $15,105TEV / 2009E Gross Revenue 1.3 20,182 26,355 18,403 24,032
TEV / 2008E EBITDA 15.0x $142 2,120 ($15) NMTEV / 2009E EBITDA 5.6 5,143 28,586 4,431 24,631
71

GSN Valuation Analysis
Precedent Transactions – Online Business In order to estimate the potential value of GSN.com, Salem Partners has analyzed a
number of precedent transactions.
Management Case Base CaseY+0 2008E GSN.com Revenue Enterprise 2008E GSN.com Revenue Enterprise
Revenue Gross Net Value Gross Net Value
Skill Game Precedents 5.1x $9,638 $49,256 $9,163 $46,831Casual Game Precedents 3.1 5,916 18,274 5,766 17,811Average Enterprise Value $33,765 $32,321Note: Used gross online revenue to value GSN.com with the skill game precedents multiple. Note: Used net online revenue to value GSN.com with the casual game precedents multiple.
72

GSN Valuation Analysis
Precedent Transactions – Online Business The chart below outlines the relevant transactions used to value GSN.com (complete list in
Exhibit A).
Date Target BuyerTransaction Size
($mm)
TEV /
Revenue(1) Target Business Description
3/20/2006 WorldWinner, Inc. SkillJam Technologies Corporation
$23.0 2.4x WorldWinner, Inc. provides online games for cash and prizes. It conducts tournaments in various games, such as chess, bridge, solitaire, and 9-ball pool.
2/7/2006 Zylom Media Group B.V. RealNetworks Inc. 21.0 2.6 Zylom Media Group B.V. develops, publishes, and distributes casual games in Europe. It offers various downloadable and Web-based games, personal computer games, and subscription services. Zylom distributes these games through its own direct-to-consumer Web site and through European distributors.
9/23/2005 FUN Technologies Inc. Liberty Media Corp. 148.5 6.3 FUN Technologies, Inc. develops online gaming technologies in casual gaming and fantasy sports services sectors. It provides private label person-to-person gaming systems and services to online entertainment companies.
7/1/2004 SkillJam Technologies Corporation
FUN Technologies, Inc. 8.0 3.9 SkillJam Technologies Corporation provides Internet cash prize skill game play. It offers games, such as puzzle games, arcade games, multiplayer games, card and tile games, word games, chess, checkers, dominoes, and spades.
1/26/2004 GameHouse, Inc. RealNetworks Inc. 35.5 3.5 GameHouse, Inc. develops, publishes, and distributes software games for personal computers. The Company’s products include Super Collapse II, Puzzle Inlay, TextTwist, online casino, Bingo, Glinx, and Crossword puzzles.
(1) Year purchased
(1) Revenue figure is from year acquisition occurred.
73

GSN Valuation Analysis
Summary Discounted Cash Flow Analysis – Online and Participation Business The chart below illustrates a sensitivity analysis for the discounted cash flow valuation for
GSN.com and GSN’s participation business, utilizing various discount rates, terminal multiples and implied perpetuity cash flow growth rates.
($ in 000)
Discounted Cash Flow Sensitivity Analysis - Online Business
Total DCF ValuationPresent Value of Terminal Total Present Value Assuming Implied Perpetuity Cash Flow
Projection Period Assuming Terminal Multiple Terminal Multiple Growth RatesCash Flow 10.5x 12.5x 14.5x 10.5x 12.5x 14.5x 10.5x 12.5x 14.5x
35.0% $5,213 $40,341 $48,025 $55,709 $45,554 $53,238 $60,923 25.5% 27.0% 28.1%38.5 4,558 35,952 42,801 49,649 40,510 47,359 54,207 29.0 30.5 31.642.0 3,983 32,133 38,254 44,375 36,116 42,237 48,357 32.5 34.0 35.1
Discounted Cash Flow Sensitivity Analysis - Participation Business
Total DCF ValuationPresent Value of Terminal Total Present Value Assuming Implied Perpetuity Cash Flow
Projection Period Assuming Terminal Multiple Terminal Multiple Growth RatesCash Flow 10.5x 12.5x 14.5x 10.5x 12.5x 14.5x 10.5x 12.5x 14.5x
35.0% $1,619 $22,819 $27,166 $31,512 $24,438 $28,784 $33,131 25.5% 27.0% 28.1%38.5 1,269 20,337 24,210 28,084 21,606 25,479 29,353 29.0 30.5 31.642.0 964 18,176 21,638 25,100 19,140 22,602 26,064 32.5 34.0 35.1
74

GSN Valuation Analysis
Base Case Discounted Cash Flow Analysis – Online Business The chart below illustrates the summary discounted cash flow valuation analysis for GSN’s
online business.
(1) Allocation between traditional linear and new media businesses based on revenue contribution.(2) Assumes a 38% tax rate.(3) Valuation as of January 1, 2007, assumes mid-year convention.
($ in 000)Online Business Results for the Years
Ended December 31, Projected Results for the Years Ending December 31,2005A 2006A 2007E 2008E 2009E 2010E 2011E
6/30/2007 6/30/2008 6/30/2009 6/30/2010 6/30/2011Revenue
Online Revenue $229 $801 $3,132 $9,163 $18,403 $32,634 $55,680Online Revenue Share (77) (296) (1,261) (3,397) (7,085) (12,796) (22,221)
Total Revenue $152 $505 $1,871 $5,766 $11,318 $19,838 $33,459Less Expenses:
Online $409 $1,188 $4,303 $4,449 $4,754 $5,352 $5,371G&A(1)
16 55 206 599 1,126 1,823 2,784Salaries & Benefits(1)
1,069 501 186 393 546 686 833Consulting & Temps/Other(1)
370 506 165 340 462 566 672Total Expenses $1,865 $2,250 $4,861 $5,782 $6,887 $8,426 $9,660
Cash Taxes(2)$651 $663 $1,136 $6 ($1,684) ($4,337) ($9,044)
Other Working Capital Changes(1)(1) (97) (25) (149) 522 (415) 511
Production / Acquisition Costs 0 (285) (300) (330) (363) (399) (439)Cash Launch Incentives 0 0 0 0 0 0 0Fixed Asset CapEx 0 0 0 0 0 0 0
Free Cash Flow ($1,063) ($1,464) ($2,178) ($488) $2,906 $6,261 $14,827
Discount Rate 38.5%PV of Cash Flow at 6/30/2007 5,364
Total PV of Cash Flow at 12/31/2007(3) $4,558 9.6% of ValuationTerminal Value at 12/31/2007(3) 42,801 90.4 of Valuation 30.5% Growth Rate
Total Enterprise Value $47,359
Implied Terminal Value Multiple 12.5x
75

GSN Valuation Analysis
Base Case Discounted Cash Flow Analysis – Participation Business The chart below illustrates the summary discounted cash flow valuation analysis for GSN’s
participation business.
(1) Allocation between traditional linear and new media businesses based on revenue contribution.(2) Assumes a 38% tax rate.(3) Valuation as of March 31, 2007, assumes mid-year convention.
($ in 000)Participation Business Results for the Years
Ended December 31, Projected Results for the Years Ending December 31,2005A 2006A 2007E 2008E 2009E 2010E 2011E
6/30/2007 6/30/2008 6/30/2009 6/30/2010 6/30/2011Revenue
Participation Revenue $0 $711 $11,149 $14,669 $19,734 $26,781 $36,111Less Expenses:
New Media & Short Form $371 $272 $835 $961 $1,108 $1,282 $1,486Participation Expense 0 859 8,599 9,483 10,818 12,641 15,107Interactive Programming 3,446 3,413 2,000 2,060 2,122 2,185 2,251Salaries & Benefits(1)
0 705 1,110 1,000 952 925 899Consulting & Temps/Other(1)
0 712 984 866 805 764 725G&A(1)
0 78 1,227 1,523 1,963 2,461 3,005Total Expenses $3,817 $6,038 $14,754 $15,893 $17,769 $20,258 $23,473
Cash Taxes(2)$1,450 $2,024 $1,370 $465 ($747) ($2,479) ($4,802)
Other Working Capital Changes(1)0 (136) (147) (378) 910 (561) 551
Production / Acquisition Costs 0 0 0 0 0 0 0Cash Launch Incentives 0 0 0 0 0 0 0Fixed Asset CapEx 0 0 0 0 0 0 0
Free Cash Flow ($2,367) ($3,439) ($2,382) ($1,137) $2,129 $3,483 $8,387
Discount Rate 38.5%
PV of Cash Flow at 6/30/2007(3) 1,494
Total PV of Cash Flow at 12/31/2007 $1,269 5.0% of ValuationTerminal Value at 12/31/2007(3) 24,210 95.0 of Valuation 30.5% Growth Rate
Total Enterprise Value $25,479
Implied Terminal Value Multiple 12.5x
76

GSN Valuation Analysis
Precedent Transactions – International Cable Networks In order to estimate the potential value of GSN in the international marketplace, Salem
Partners has analyzed a number of precedent transactions (complete list in Exhibit B). The following transactions are deemed to be most relevant.
Date Target BuyersTransaction Value ($mm)
TEV / Revenue TEV / EBITDA Business Description
2/27/2007 Imagen Satelital SA Turner Broadcasting System, Inc. $269.5 7.5x - Imagene Satelital develops, manages and distributes a total of 14 distinct entertainment brands for Spanish and Portuguese speaking markets 24 hours a day.
12/14/2006 Claxson Interactive Group, Inc., 7 Pay Television Networks
Turner Broadcasting System, Inc. 235.0 - - Claxson Interactive Group, Inc., 7 Pay Television Networks operates as pay television channels which are distributed through cable and direct-to-home television platforms in Latin America to approximately 51 million subscribers. The television channels comprise of Fashion TV, HTV, Infinito, I.Sat, MuchMusic, Retro and Space.
12/5/2006 Groupe AB S.A. Television Francaise 1 SA 306.3 - - Groupe AB supplies thematic channels to the digital pay-television market in France. Its activities are organized into three business segments: thematic channels, television programming, and merchandising. The Company operates a total of 18 channels, including RTL9, a cable and satellite channel in France, ABI (fiction and series), AB Moteurs (motorized vehicles), Escates (travel), RFM-TV (popular music) and XXL (adult). Its portfolio of channels also includes Onyx Television (Onyx), a music channel that is distributed via cable in Germany. The Company is also an independent distributor and producer of television programming with library of television programming rights. Its merchandising activities include the sale of videocassette recordings, the publication of magazines, and the sale of merchandising licenses.
3/21/2005 Euvia Media AG & Co. KG ProSiebenSat.1 Media AG 206.6 - - Euvia Media AG & Co. KG operates Neun Live (9Live) that focuses on interactive entertainment programs, and Sonnenklar TV, a travel oriented channel that provides live programming, travel news and features, and travel packages.
2/23/2005 Crown Media International, Inc.(1) 3i Group plc, Providence Equity Partners, Inc.
142.0 - - Crown Media International, Inc. engages in the ownership and operation of Hallmark Channel. It offers broadcast transmission services. The Company also owns the right to use the Hallmark and Hallmark Entertainment trademarks to promote, market, advertise, distribute, and sell television motion pictures and miniseries in Europe, Asia, and Latin America. It also provides entertainment programs for adults and families internationally.
(1) Crown Media International, Inc. includes a network and a library. The total transaction value was $242 mm and it was assumed that the library was worth $100 mm.
77

GSN Valuation Analysis
International Discounted Cash Flow Analysis The chart below illustrates the summary valuation analysis if Liberty were to create an
international GSN channel.
($ in 000)For the Years Ending December 31,
Low Range 2007E 2008E 2009E 2010E 2011E6/30/2007 6/30/2008 6/30/2009 6/30/2010 6/30/2011Free Cash Flow $0 $0 $0 $0 $0Terminal Value (Low) 0 0 0 0 100,000Free Cash Flow (Low) $0 $0 $0 $0 $100,000Cash Taxes(1)
0 0 0 0 (38,000)After Tax Free Cash Flow for DCF (Low) $0 $0 $0 $0 $62,000
Discount Factor at Rate 12.0%PV of Cash Flow at 6/30/2007(2)
39,390Total Enterprise Value at 12/31/2007 $37,220
For the Years Ending December 31, High Range 2007E 2008E 2009E 2010E 2011E6/30/2007 6/30/2008 6/30/2009 6/30/2010 6/30/2011Free Cash Flow $0 $0 $0 $0 $0Terminal Value (High) 0 0 0 0 150,000Free Cash Flow (High) $0 $0 $0 $0 $150,000Cash Taxes(1)
0 0 0 0 (57,000)After Tax Free Cash Flow for DCF (High) $0 $0 $0 $0 $93,000Discount Factor at Rate 12.0%PV of Cash Flow at 6/30/2007(2)
59,085Total Enterprise Value at 12/31/2007 $55,830
(1) Assumes a 38% tax rate.
(2) Assumes mid-year convention.
78

ExhibitsExhibits

Precedent Transaction AnalysisPrecedent Transaction Analysis
Casual GamesCasual Games

Exhibits
A. Precedent Transaction Analysis – Online Business
Date Target BuyerTransaction Size
($mm)
TEV /
Revenue(1) Target Business Description
12/31/2006 Atrativa, Inc. RealNetworks Inc. $3.8 - Atrativa, Inc. engages in the distribution of online and downloadable casual games to the Internet portals and Internet service providers in Latin American Internet market. It offers game downloads, online games, casual games, and community tools for end users through distribution network, and infrastructure for the distribution of content.
10/16/2006 Gamehub Boonty S.A. - - Gamehub develops multiplayer casual digital game titles. It provides game-centric social networking solutions for portals and media sites.
8/15/2006 Teagames Ltd. FUN Technologies, Inc. 2.4 - Teagames, Ltd. operates as a game development company.
8/9/2006 Atom Entertainment, Inc. / Shockwave
MTV Networks Company 200.0 8.0x Atom Entertainment, Inc. markets and distributes digital entertainment products. The Company’s products include games, films, animation, and entertainment software titles.
3/20/2006 WorldWinner, Inc. SkillJam Technologies Corporation
23.0 2.4 WorldWinner, Inc. provides online games for cash and prizes. It conducts tournaments in various games, such as chess, bridge, solitaire, and 9-ball pool.
2/7/2006 Zylom Media Group B.V. RealNetworks Inc. 21.0 2.6 Zylom Media Group B.V. develops, publishes, and distributes casual games in Europe. It offers various downloadable and Web-based games, personal computer games, and subscription services. Zylom distributes these games through its own direct-to-consumer Web site and through European distributors.
(1) Revenue figure is from year acquisition occurred.
79
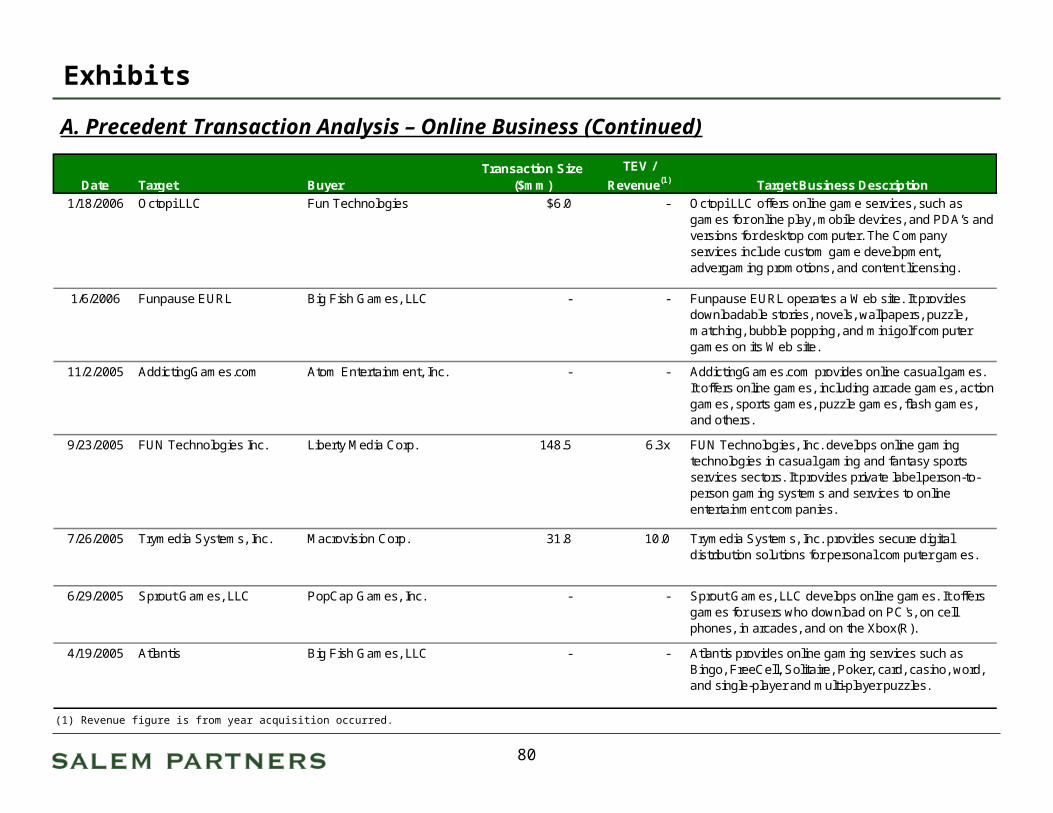
Exhibits
A. Precedent Transaction Analysis – Online Business (Continued)
Date Target BuyerTransaction Size
($mm)
TEV /
Revenue(1) Target Business Description
1/18/2006 Octopi LLC Fun Technologies $6.0 - Octopi LLC offers online game services, such as games for online play, mobile devices, and PDA’s and versions for desktop computer. The Company services include custom game development, advergaming promotions, and content licensing.
1/6/2006 Funpause EURL Big Fish Games, LLC - - Funpause EURL operates a Web site. It provides downloadable stories, novels, wallpapers, puzzle, matching, bubble popping, and mini golf computer games on its Web site.
11/2/2005 AddictingGames.com Atom Entertainment, Inc. - - AddictingGames.com provides online casual games. It offers online games, including arcade games, action games, sports games, puzzle games, flash games, and others.
9/23/2005 FUN Technologies Inc. Liberty Media Corp. 148.5 6.3x FUN Technologies, Inc. develops online gaming technologies in casual gaming and fantasy sports services sectors. It provides private label person-to-person gaming systems and services to online entertainment companies.
7/26/2005 Trymedia Systems, Inc. Macrovision Corp. 31.8 10.0 Trymedia Systems, Inc. provides secure digital distribution solutions for personal computer games.
6/29/2005 Sprout Games, LLC PopCap Games, Inc. - - Sprout Games, LLC develops online games. It offers games for users who download on PC's, on cell phones, in arcades, and on the Xbox(R).
4/19/2005 Atlantis Big Fish Games, LLC - - Atlantis provides online gaming services such as Bingo, FreeCell, Solitaire, Poker, card, casino, word, and single-player and multi-player puzzles.
(1) Revenue figure is from year acquisition occurred.
80

Exhibits
A. Precedent Transaction Analysis – Online Business (Continued)
Date Target BuyerTransaction Size
($mm)
TEV /
Revenue(1) Target Business Description
7/1/2004 SkillJam Technologies Corporation
FUN Technologies, Inc. $8.0 3.9x SkillJam Technologies Corporation provides Internet cash prize skill game play. It offers games, such as puzzle games, arcade games, multiplayer games, card and tile games, word games, chess, checkers, dominoes, and spades.
1/26/2004 GameHouse, Inc. RealNetworks Inc. 35.5 3.5 GameHouse, Inc. develops, publishes, and distributes software games for personal computers. The Company’s products include Super Collapse II, Puzzle Inlay, TextTwist, online casino, Bingo, Glinx, and Crossword puzzles.
2/28/2001 Pogo.com Inc. EA.com 43.3 - Pogo.com, Inc. develops Web, downloadable, and mobile games in the United States. It provides subscription services through Club Pogo.
2/6/2001 Uproar Inc. Flipside Inc. 139.9 4.1 Uproar Inc., and its subsidiaries operates as an interactive entertainment company, which provides online game shows and interactive single- and multi-player games, that appeal to a broad audience.
7/26/2000 iWin.com Uproar Inc. 78.3 223.7 iWin.com is an operator of an entertainment website offering end-users various games and prizes. It also provides businesses with advertising and marketing services and offer internet service for no cost.
(1) Revenue figure is from year acquisition occurred.
81

Precedent Transaction Analysis Precedent Transaction Analysis
International Cable NetworksInternational Cable Networks

Exhibits
B. Precedent Transaction Analysis – International Cable Networks
Date Target BuyersTransaction Value ($mm)
TEV / Revenue TEV / EBITDA Business Description
3/15/2007 Documania IPS Multicanal - - - Documania operates as a documentary television channel.
2/27/2007 Imagen Satelital SA Turner Broadcasting System, Inc. $269.5 7.5x - Imagene Satelital develops, manages and distributes a total of 14 distinct entertainment brands for Spanish and Portuguese speaking markets 24 hours a day.
12/14/2006 Claxson Interactive Group, Inc., 7 Pay Television Networks
Turner Broadcasting System, Inc. 235.0 - - Claxson Interactive Group, Inc., 7 Pay Television Networks operates as pay television channels which are distributed through cable and direct-to-home television platforms in Latin America to approximately 51 million subscribers. The television channels comprise of Fashion TV, HTV, Infinito, I.Sat, MuchMusic, Retro and Space.
12/8/2006 MTV Networks Polska sp. z o.o. MTV Networks Production B.V. - - - MTV Networks Polska sp. z o.o. offers entertainment production services and is based in Warsaw, Poland.
12/5/2006 Groupe AB S.A. Television Francaise 1 SA 306.3 - - Groupe AB supplies thematic channels to the digital pay-television market in France. Its activities are organized into three business segments: thematic channels, television programming, and merchandising. The Company operates a total of 18 channels, including RTL9, a cable and satellite channel in France, ABI (fiction and series), AB Moteurs (motorized vehicles), Escates (travel), RFM-TV (popular music) and XXL (adult). Its portfolio of channels also includes Onyx Television (Onyx), a music channel that is distributed via cable in Germany. The Company is also an independent distributor and producer of television programming with library of television programming rights. Its merchandising activities include the sale of videocassette recordings, the publication of magazines, and the sale of merchandising licenses.
12/4/2006 Telewizja Polsat S.A. Axel Springer Verlag AG 333.2 - - Telewizja Polsat S.A. owns and operates cable television networks, pay channels, and television broadcasting stations in Poland.
82

Exhibits
B. Precedent Transaction Analysis – International Cable Networks (Continued)
Date Target BuyersTransaction Value ($mm)
TEV / Revenue TEV / EBITDA Business Description
10/2/2006 TV Travel Shop Germany GmbH & Co KG
Television Voyages Ltd. - - - TV Travel Shop Germany GmbH & Co KG is a television channel that sells holiday packages, circular tours and cruises. It provide entertaining and informative programming for travelers and features studio reports and interviews; video guided tours of destinations, resorts and hotels; and exclusive offers from major tour operators.
8/29/2006 MTV Japan, Inc. MTV Networks Company - - - MTV Japan is a Japanese language music television channel. The Company offers its services through cable and satellite platforms.
7/25/2006 Hungama TV Walt Disney Co. - - - Hungama TV operates as an entertainment channel for Indian kids. It has multigenre programming, such as drama, action, game shows, and animation to appeal to various subsegments.
4/5/2006 Diema Vision AD Apace Media Group plc - - - Diema Vision AD provides satellite and cable broadcasting services in Bulgaria. It operates cable television channels, which cover sports, films, news, and paid programs.
1/16/2006 XXP TV Discovery Communications, Inc. - - - XXP TV owns and operates a television channel that offers news, information, current affairs programs, and documentaries to over 20 million households in Germany, Austria, Italy, Switzerland, Luxembourg, and Liechtenstein.
12/1/2005 Diema Vision AD Apace Media Group plc - - - Diema Vision AD provides satellite and cable broadcasting services in Bulgaria. It operates cable television channels, which cover sports, films, news, and paid programs.
11/28/2005 IPS Multicanal Chellomedia, B.V. - - - IPS Multicanal provides thematic television channels in the Spain and Portugal. It operates channels related to movies, documentaries, music, kids, and cooking.
11/7/2005 United Broadcasting Corp. Public Co. Ltd.
True Corp. Public Co. Ltd. $331.0 - - United Broadcasting Corporation Public Company Limited, through its subsidiaries, engages in the operation of pay television networks, such as digital satellite and cable televisions in Thailand. The Company produces programs and renders related services; offers home shopping through its digital and cable television; sells space for advertisements in its television magazines; provides artist management services, and creates and produces music; and engages in the interactive television business.
83

Exhibits
B. Precedent Transaction Analysis – International Cable Networks (Continued)
Date Target BuyersTransaction Value ($mm)
TEV / Revenue TEV / EBITDA Business Description
9/1/2005 Galaxie Sport s.r.o. Central European Media Enterprises Ltd.
$4.9 - - Galaxie Sport s.r.o. broadcasts sports and sport-related programming in the Czech Republic and Slovak Republic. It owns broadcast license rights for sports programming in various markets, including the National Hockey League, Premier League British Football, Series A Italian Football, Premiere Division Spanish Football, the National Basketball Association, and ATP Tennis tournaments, as well as motorcycle and automobile races.
8/9/2005 National Cable Network Basic Element Company 15.0 - - National Cable Network operates cable networks in Russia.
7/31/2005 JSC "Ukrainian Independent TV-corporation"
- - - - JSC "Ukrainian Independent TV-corporation" operates as a Ukrainian national broadcaster. The Company broadcasts programs, such as factual documentary, sports news, football matches translations, factual entertainment, cultural, entertaining, musical-entertaining, game shows, entertainment, children, and social programs. It distributes the channel through cable and cellular TV of Russian Federation, Byelorussia, Moldova, Armenia, Bulgaria, Latvia, Lithuania, Estonia, Germany, Czech Republic, Slovakia, Canada, the United States, Israel, Australia, and New Zealand.
7/21/2005 CNBC Asia Pacific NBC Universal, Inc. - - - CNBC Asia Pacific is a business and financial news organization of Dow Jones & Company, which publishes The Wall Street Journal and its international and online editions and provides world business and financial information and NBC, which is a television network in United States and a broadcasting unit of General Electric Company. CNBC Asia Pacific’s channels include CNBC Asia, CNBC Australia, CNBC India, Nikkei-CNBC (Japan), CNBC Singapore, and CNBC Hong Kong. These channels are distributed via satellite, cable, and terrestrial broadcast networks in more than 26 million homes across the Asia Pacific.
6/17/2005 The Horror Channel Limited Zonemedia - - - The Horror Channel Limited provides cable television, broadcasting, and telecommunications services in the United Kingdom. It offers horror movies, including classics, thrillers, series, home-produced, biographies, and documentaries for horror fans and serious horror buffs.
84

Exhibits
B. Precedent Transaction Analysis – International Cable Networks (Continued)
(1) Crown Media International, Inc. includes a network and a library. The total transaction value was $242 mm and it was assumed that the library was worth $100 mm.
Date Target BuyersTransaction Value ($mm)
TEV / Revenue TEV / EBITDA Business Description
4/29/2005 Sky Network Television Ltd. Nationwide News Pty Limited $196.0 0.6x - Sky Network Television Limited, through its subsidiaries, operates as a pay television company in New Zealand. It operates multi-channels, including sports, movie, general entertainment, documentary, news, weather, and children’s channels, as well as other niche channels. SKY Network also offers pay-per-view movies; live events; and free-to-air television and interactive services. In addition, it provides online DVD rental; personal video recorder; and mobile and wireless video services.
3/21/2005 Euvia Media AG & Co. KG ProSiebenSat.1 Media AG 206.6 - - Euvia Media AG & Co. KG operates Neun Live (9Live) that focuses on interactive entertainment programs, and Sonnenklar TV, a travel oriented channel that provides live programming, travel news and features, and travel packages.
2/23/2005 Crown Media International, Inc.(1) 3i Group plc, Providence Equity Partners, Inc.
142.0 - - Crown Media International, Inc. engages in the ownership and operation of Hallmark Channel. It offers broadcast transmission services. The Company also owns the right to use the Hallmark and Hallmark Entertainment trademarks to promote, market, advertise, distribute, and sell television motion pictures and miniseries in Europe, Asia, and Latin America. It also provides entertainment programs for adults and families internationally.
2/8/2005 CTC Media, Inc Fidelity Investments 5.0 - - CTC Media, Inc. operates as a commercial television broadcaster in Russia that airs targeted entertainment programming. It operates two networks, the CTC and the Domashny television networks. The CTC Network offers entertainment programming targeted at 6-54 year-old viewers.
11/16/2004 Canal+ N.V. Chellomedia, B.V. 32.0 - - Canal+ N.V. owns and operates television stations. The company airs CANAL + red and CANAL + blue.
9/24/2004 CT Cinetrade AG Swisscom AG - - - CT Cinetrade AG owns and operates Teleclub, which is a pay television channel.
1/15/2004 Paris Première Metropole Television M6 31.9 - - Paris Première is a specialized Television channel based in France. The website offers information on a variety of topics including television listings for the channels, cinema information for the area, and music concerts in and around the city. It is a source of information for anyone wishing to explore Paris by day or night.
85
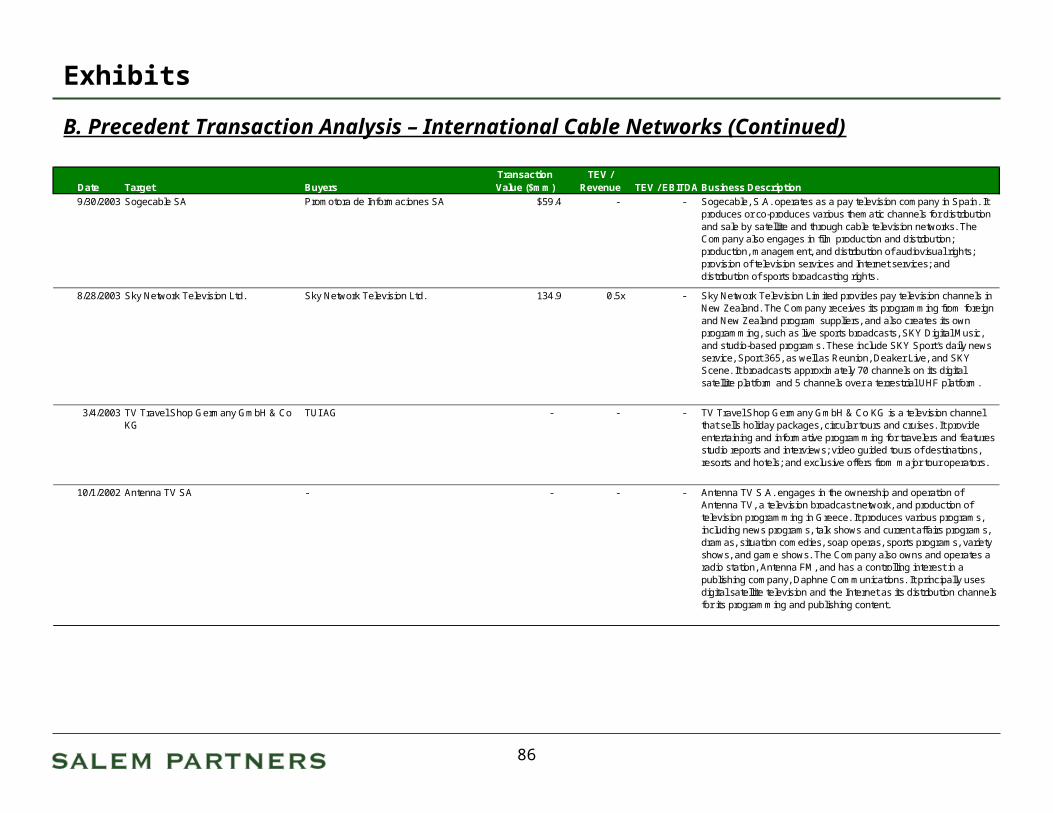
Exhibits
B. Precedent Transaction Analysis – International Cable Networks (Continued)
Date Target BuyersTransaction Value ($mm)
TEV / Revenue TEV / EBITDA Business Description
9/30/2003 Sogecable SA Promotora de Informaciones SA $59.4 - - Sogecable, S.A. operates as a pay television company in Spain. It produces or co-produces various thematic channels for distribution and sale by satellite and through cable television networks. The Company also engages in film production and distribution; production, management, and distribution of audiovisual rights; provision of television services and Internet services; and distribution of sports broadcasting rights.
8/28/2003 Sky Network Television Ltd. Sky Network Television Ltd. 134.9 0.5x - Sky Network Television Limited provides pay television channels in New Zealand. The Company receives its programming from foreign and New Zealand program suppliers, and also creates its own programming, such as live sports broadcasts, SKY Digital Music, and studio-based programs. These include SKY Sport's daily news service, Sport 365, as well as Reunion, Deaker Live, and SKY Scene. It broadcasts approximately 70 channels on its digital satellite platform and 5 channels over a terrestrial UHF platform.
3/4/2003 TV Travel Shop Germany GmbH & Co KG
TUI AG - - - TV Travel Shop Germany GmbH & Co KG is a television channel that sells holiday packages, circular tours and cruises. It provide entertaining and informative programming for travelers and features studio reports and interviews; video guided tours of destinations, resorts and hotels; and exclusive offers from major tour operators.
10/1/2002 Antenna TV SA - - - - Antenna TV S.A. engages in the ownership and operation of Antenna TV, a television broadcast network, and production of television programming in Greece. It produces various programs, including news programs, talk shows and current affairs programs, dramas, situation comedies, soap operas, sports programs, variety shows, and game shows. The Company also owns and operates a radio station, Antenna FM, and has a controlling interest in a publishing company, Daphne Communications. It principally uses digital satellite television and the Internet as its distribution channels for its programming and publishing content.
86

Overview of Fun TechnologiesOverview of Fun Technologies

Exhibits
C. Overview of Fun Technologies Liberty Media owns 53% of FUN Technologies and is the lender to FUN on a C$15 million
senior debt facility of which C$5 million is currently drawn. Liberty became a shareholder in FUN in March 2006 when Liberty Media Corp. purchased 33.8 million shares of FUN for $148.7 million.
FUN is a publicly-traded company listed on the TSX and is quoted on the AIM and OTC pinksheets.
FUN has a track record of acquiring and integrating gaming sites and technologies: August 2006, Teagames Ltd. March 2006, WorldWinner, Inc. January 2006, Octopi LLC July 2004, SkillJam Technologies Corporation
FUN and subsidiary “SkillJam” and GSN.com entered into a revenue sharing agreement in January 2005 whereby SkillJam implements and services a skill-game content area on GSN.com and splits revenue from such content 50/50%.
87

Exhibits
C. Overview of Fun Technologies (Continued)
8/15/06: Acquires Teagames Ltd.
3/20/06: SkillJam acquires WorldWinner, Inc.
1/18/06: Acquires Octopi, LLC
Stock price as of 3/26/07: $2.58
11/13/07: Release 3rd quarter report; revenues increase 30.1%
8/24/06: Acquires CDM Fantasy Sports.
1/5/05: Acquires Don Best Sports
1/14/05: Signs agreement with GSN.
4/7/06: Acquires Fantasy Sports, Inc.
3/10/06: Liberty Media Corp. acquires 54% of FUN
88

Exhibits
C. Overview of Fun Technologies (Continued)
Enterprise Value (as adjusted(1)) – $153.4 million
Market Capitalization – $158.9 million
Cash (as of December 2006) – $9.8 million
The chart below details the acquisition history of FUN.
(1) Adjusted for C$5 million ($4.3 million) under credit facility.
Date Target Buyer Target Business Description
8/15/2006 Teagames Ltd. FUN Technologies, Inc. Teagames, Ltd. operates as a game development company.
3/20/2006 WorldWinner, Inc. SkillJam Technologies Corporation
WorldWinner, Inc. provides online games for cash and prizes. It conducts tournaments in various games, such as chess, bridge, solitaire, and 9-ball pool.
1/18/2006 Octopi LLC Fun Technologies Octopi LLC offers online game services, such as games for online play, mobile devices, and PDA’s and versions for desktop computer. The Company services include custom game development, advergaming promotions, and content licensing.
7/1/2004 SkillJam Technologies Corporation
FUN Technologies, Inc. SkillJam Technologies Corporation provides Internet cash prize skill game play. It offers games, such as puzzle games, arcade games, multiplayer games, card and tile games, word games, chess, checkers, dominoes, and spades.
89

Exhibits
C. Overview of Fun Technologies (Continued)
Equity Research
Analyst Coverage: CIBC World Markets
Rating: Sector Out-performer: Speculative
Price Target: $7.00
Thesis: “For 2007, we expect revenues of $71.59 million up 52% year over year, and fully diluted adjusted EPS of breakeven.”
Primary Valuation Methodology: DCF at 12% discount rate and 14.0x terminal multiple.
Date of last report: March 28, 2007
90

Alternative WACC AnalysisAlternative WACC Analysis
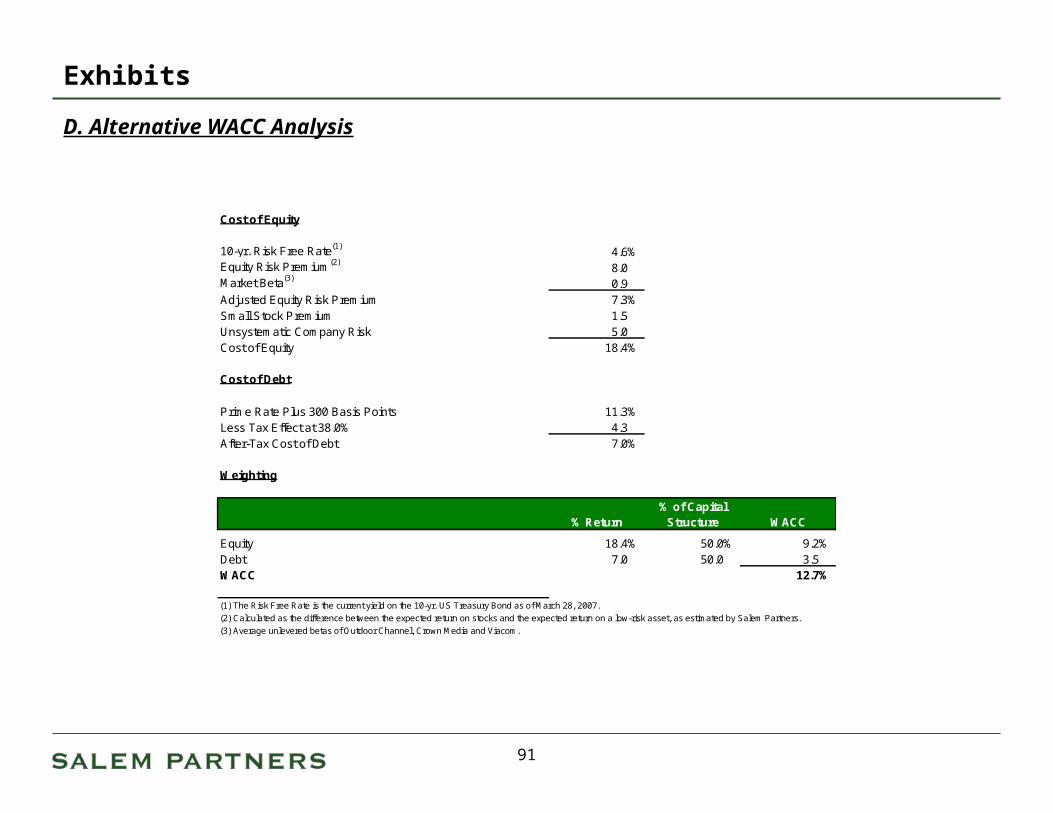
Exhibits
D. Alternative WACC Analysis
Cost of Equity
10-yr. Risk Free Rate(1)4.6%
Equity Risk Premium(2)8.0
Market Beta(3)0.9
Adjusted Equity Risk Premium 7.3%Small Stock Premium 1.5Unsystematic Company Risk 5.0Cost of Equity 18.4%
Cost of Debt
Prime Rate Plus 300 Basis Points 11.3%Less Tax Effect at 38.0% 4.3After-Tax Cost of Debt 7.0%
Weighting
% Return% of Capital
Structure WACC
Equity 18.4% 50.0% 9.2%Debt 7.0 50.0 3.5WACC 12.7%
(1) The Risk Free Rate is the current yield on the 10-yr. US Treasury Bond as of March 28, 2007.
(2) Calculated as the difference between the expected return on stocks and the expected return on a low-risk asset, as estimated by Salem Partners.
(3) Average unlevered betas of Outdoor Channel, Crown Media and Viacom.
91