evaluation of fuel cell vehicle regarding hybridization ... · evaluation of fuel cell vehicle...
TRANSCRIPT

Journal of Electrical Engineering 3 (2015) 36-51 doi: 10.17265/2328-2223/2015.01.006
Evaluation of Fuel Cell Vehicle Regarding Hybridization
Degree and Its Impact on Range, Weight and Energy
Consumption
Marina Roche and Natalia Artal
Applus IDIADA group, Santa Oliva (Tarragona), E-43710, Spain
Abstract: PUMA Mind is a co-funded project aimed at enhancing the understanding of the behavior of fuel cell systems in vehicles taking advantage of the new freedoms in design that electric powertrains provide. Within this project, IDIADA focused on the integration of fuel cell systems in the automotive sector and the resulting fuel cell power demand profiles were used as base line to develop the fuel cell technology within the scope of the project. This paper presents a further study on the PUMA Mind vehicles with the simulation software for Simulink environment vemSim developed at IDIADA. The paper deals with the sizing of a pure fuel cell vehicle, a hybrid fuel cell vehicle and a plug-in hybrid fuel cell vehicle. For each case, a dynamic vehicle model and an energy management algorithm were implemented in vemSim in order to calculate the required energy storage and optimize the powertrain efficiency and range in a variety of real driving conditions. Finally, simulations results were used to evaluate the impact of the hybridization degree on vehicle weight, components size, hydrogen and electric consumption and variability of the fuel cell and battery load. Those results unveil that all typologies of hybridization mentioned in the following paragraphs reach the target of range and obtain good performances according to different mission profiles.
Key words: Fuel cell, hybrid, plug-in, simulation, range.
1. Introduction
Contamination and its impact on health and climatic
change are some of the main priorities of society today.
Increasingly more people are convinced that vehicles
with ICE (internal combustion engines) need to be
replaced by more efficient powertrain technologies
with the main objective of achieving “zero emissions”
or at least greener vehicles.
The 19th century was the century of steam engine,
the 20th was the century of the ICE, but in the 1990’s,
hybrid and electricpowertrain architectures became
serious alternatives, although the concept was not
entirely new. A hybrid vehicle uses two or more
different power sources for propulsion. The most
Corresponding author: Natalia Artal, mechanical engineer,
research fields: automotive, electric & hybrid vehicles, fuel cell technologies and new propulsion sources. E-mail: [email protected].
This paper was originally presented at EEVC Congress 2015.
widespread configuration is the hybrid electric vehicle
which uses an ICE as primary power source and
batteries as accumulators, but hydraulic and pneumatic
hybrids are also being sold as reasonable alternatives.
However, in order to reduce emissions and the
dependency on fossil fuels, a transition in alternative
energy sources is expected in the next few years, thus, a
mix of biofuels, hydrogen and electricity is expected to
be found in the future. The freedom in design that
electric drivesprovide permits developing new
powertrain architectures with other propulsion systems
such as FC (fuel cell) [1]. The 21st century is supposed
to be the century of FC as a result of the large amount
of researches performed in the hydrogen technology in
the last years. Although hydrogen is not a renewable
resource, it is an abundant element and can be obtained
by means of renewable sources.
D DAVID PUBLISHING

2. Objective
The main goal of the study within the PUMA Mind
project [2]
configurations with different
terms of FC load profiles, weight and performance by
maintaining the same range target of 500 km for NEDC
(new European
in energy saving for 5 mission profiles. The results
used to compare each v
� weight
� FC and battery load profiles
� range and full electric range
� H2 consumption
� electric
� average
The energy management algorithms were optimized
in order to operate close to the FC maximum efficiency
point and at reasonable battery
a variety of driving scenarios represented by the
mission profiles. The study concluded with three FC
load profiles to be used for automotive FC system
emulation on a single stack. In the following
paragraphs, the conditions in which the simulations
were set are discussed.
2.1 Vehicle Architectures
The target concept vehicles were set in the PUMA
Mind project [2] premises and consisted of
vehicle, a hybrid FC vehicle and a plug
vehicle with FC powers of 100 kW, 30 kW and 8 kW
respectively. The architecture selected was front wheel
drive with one motor and differential. The main
differences in their propulsion systems are evidenced
in Table 1.
2.1.1 Pure FC
In this architecture the hydrogen is the only energy
source for propulsion and there is just a tiny
accumulator to satisfy auxiliaries’ consumption.
Fig.1 shows the vehicle architecture implemented in
Simulink environment
vemSim. In this configuration the FC must absorb the
Evaluation of Fuel Cell Vehicle
Objective
The main goal of the study within the PUMA Mind
project [2] was to compare three
configurations with different
terms of FC load profiles, weight and performance by
maintaining the same range target of 500 km for NEDC
European driving cycle
in energy saving for 5 mission profiles. The results
used to compare each vehicle design are:
weight and capacity of accumulators
FC and battery load profiles
and full electric range
consumption;
electric consumption
average FC efficiency during operation
The energy management algorithms were optimized
perate close to the FC maximum efficiency
point and at reasonable battery
a variety of driving scenarios represented by the
mission profiles. The study concluded with three FC
load profiles to be used for automotive FC system
tion on a single stack. In the following
paragraphs, the conditions in which the simulations
were set are discussed.
Architectures
The target concept vehicles were set in the PUMA
Mind project [2] premises and consisted of
hybrid FC vehicle and a plug
vehicle with FC powers of 100 kW, 30 kW and 8 kW
respectively. The architecture selected was front wheel
drive with one motor and differential. The main
differences in their propulsion systems are evidenced
Pure FC Configuration
In this architecture the hydrogen is the only energy
source for propulsion and there is just a tiny
accumulator to satisfy auxiliaries’ consumption.
Fig.1 shows the vehicle architecture implemented in
Simulink environment with the simulation software
vemSim. In this configuration the FC must absorb the
valuation of Fuel Cell Vehicle Impact on Range, Weight and Energy Consumption
The main goal of the study within the PUMA Mind
was to compare three
configurations with different hybridization levels in
terms of FC load profiles, weight and performance by
maintaining the same range target of 500 km for NEDC
driving cycle) and good performances
in energy saving for 5 mission profiles. The results
ehicle design are:
and capacity of accumulators
FC and battery load profiles;
and full electric range;
consumption;
FC efficiency during operation
The energy management algorithms were optimized
perate close to the FC maximum efficiency
point and at reasonable battery SOC (state of charge
a variety of driving scenarios represented by the
mission profiles. The study concluded with three FC
load profiles to be used for automotive FC system
tion on a single stack. In the following
paragraphs, the conditions in which the simulations
The target concept vehicles were set in the PUMA
Mind project [2] premises and consisted of
hybrid FC vehicle and a plug
vehicle with FC powers of 100 kW, 30 kW and 8 kW
respectively. The architecture selected was front wheel
drive with one motor and differential. The main
differences in their propulsion systems are evidenced
Configuration
In this architecture the hydrogen is the only energy
source for propulsion and there is just a tiny
accumulator to satisfy auxiliaries’ consumption.
Fig.1 shows the vehicle architecture implemented in
with the simulation software
vemSim. In this configuration the FC must absorb the
valuation of Fuel Cell Vehicle Impact on Range, Weight and Energy Consumption
The main goal of the study within the PUMA Mind
was to compare three FC vehicle
hybridization levels in
terms of FC load profiles, weight and performance by
maintaining the same range target of 500 km for NEDC
) and good performances
in energy saving for 5 mission profiles. The results
ehicle design are:
and capacity of accumulators;
FC efficiency during operation.
The energy management algorithms were optimized
perate close to the FC maximum efficiency
state of charge
a variety of driving scenarios represented by the
mission profiles. The study concluded with three FC
load profiles to be used for automotive FC system
tion on a single stack. In the following
paragraphs, the conditions in which the simulations
The target concept vehicles were set in the PUMA
Mind project [2] premises and consisted of a pure FC
hybrid FC vehicle and a plug-in hybrid FC
vehicle with FC powers of 100 kW, 30 kW and 8 kW
respectively. The architecture selected was front wheel
drive with one motor and differential. The main
differences in their propulsion systems are evidenced
In this architecture the hydrogen is the only energy
source for propulsion and there is just a tiny
accumulator to satisfy auxiliaries’ consumption.
Fig.1 shows the vehicle architecture implemented in
with the simulation software
vemSim. In this configuration the FC must absorb the
valuation of Fuel Cell Vehicle Regarding Hybridization Degree and Impact on Range, Weight and Energy Consumption
The main goal of the study within the PUMA Mind
vehicle
hybridization levels in
terms of FC load profiles, weight and performance by
maintaining the same range target of 500 km for NEDC
) and good performances
in energy saving for 5 mission profiles. The results
The energy management algorithms were optimized
perate close to the FC maximum efficiency
state of charge) in
a variety of driving scenarios represented by the
mission profiles. The study concluded with three FC
load profiles to be used for automotive FC system
tion on a single stack. In the following
paragraphs, the conditions in which the simulations
The target concept vehicles were set in the PUMA
a pure FC
in hybrid FC
vehicle with FC powers of 100 kW, 30 kW and 8 kW,
respectively. The architecture selected was front wheel
drive with one motor and differential. The main
differences in their propulsion systems are evidenced
In this architecture the hydrogen is the only energy
source for propulsion and there is just a tiny
Fig.1 shows the vehicle architecture implemented in
with the simulation software
vemSim. In this configuration the FC must absorb the
instantaneous cycle power profile and regenerative
braking is not possible. For this configuration the
DC
absorb the voltage v
the energy loss in the DC
2.1.2
In this configuration there is a small traction battery
that allows the FC to follow a softened power profile
and the motors to perform regenerative
However, a DC
connect FC and traction battery. Fig.
of the model implemented in vemSim.
2.1.3
This configuration is similar to a hybrid FC vehicle
with the main
externally charged to also provide a full electric range
(Fig.
In this configuration the FC acts as a range extender
and the battery is the main energy accumulator
Table 1
Fig.
egarding Hybridization Degree and Impact on Range, Weight and Energy Consumption
instantaneous cycle power profile and regenerative
braking is not possible. For this configuration the
DC-DC is not required as long as the inverter can
absorb the voltage v
the energy loss in the DC
2.1.2 Hybrid FC
In this configuration there is a small traction battery
that allows the FC to follow a softened power profile
and the motors to perform regenerative
However, a DC
connect FC and traction battery. Fig.
of the model implemented in vemSim.
2.1.3 Plug-in Hybrid
This configuration is similar to a hybrid FC vehicle
with the main
externally charged to also provide a full electric range
(Fig. 3).
In this configuration the FC acts as a range extender
and the battery is the main energy accumulator
Table 1 Vehicles’ main traction
Fig. 1 VemSim model for a pure FC vehicle
Fuel cell stack
H2 tank
High voltage battery
Charger system
egarding Hybridization Degree and Impact on Range, Weight and Energy Consumption
instantaneous cycle power profile and regenerative
braking is not possible. For this configuration the
DC is not required as long as the inverter can
absorb the voltage variations of the FC, and therefore,
the energy loss in the DC-DC is avoided.
Hybrid FC Configuration
In this configuration there is a small traction battery
that allows the FC to follow a softened power profile
and the motors to perform regenerative
However, a DC-DC converter device is required to
connect FC and traction battery. Fig.
of the model implemented in vemSim.
Hybrid FC Configuration
This configuration is similar to a hybrid FC vehicle
with the main difference that the battery can be
externally charged to also provide a full electric range
In this configuration the FC acts as a range extender
and the battery is the main energy accumulator
Vehicles’ main traction
model for a pure FC vehicle
Fuel cell stack
High voltage battery
Charger system
egarding Hybridization Degree and Its
instantaneous cycle power profile and regenerative
braking is not possible. For this configuration the
DC is not required as long as the inverter can
ariations of the FC, and therefore,
DC is avoided.
Configuration
In this configuration there is a small traction battery
that allows the FC to follow a softened power profile
and the motors to perform regenerative
DC converter device is required to
connect FC and traction battery. Fig. 2 shows a detail
of the model implemented in vemSim.
Configuration
This configuration is similar to a hybrid FC vehicle
difference that the battery can be
externally charged to also provide a full electric range
In this configuration the FC acts as a range extender
and the battery is the main energy accumulator
Vehicles’ main traction components
model for a pure FC vehicle.
Pur
e F
C
Hyb
rid
FC
37
instantaneous cycle power profile and regenerative
braking is not possible. For this configuration the
DC is not required as long as the inverter can
ariations of the FC, and therefore,
DC is avoided.
In this configuration there is a small traction battery
that allows the FC to follow a softened power profile
and the motors to perform regenerative braking.
DC converter device is required to
2 shows a detail
This configuration is similar to a hybrid FC vehicle
difference that the battery can be
externally charged to also provide a full electric range
In this configuration the FC acts as a range extender
and the battery is the main energy accumulator allowing
.
.
Plu
g-in
hy
brid
FC
37
instantaneous cycle power profile and regenerative
braking is not possible. For this configuration the
DC is not required as long as the inverter can
ariations of the FC, and therefore,
In this configuration there is a small traction battery
that allows the FC to follow a softened power profile
braking.
DC converter device is required to
2 shows a detail
This configuration is similar to a hybrid FC vehicle
difference that the battery can be
externally charged to also provide a full electric range
In this configuration the FC acts as a range extender
allowing

38
Fig. 2 VemSim
Fig. 3 VemSim
regenerative braking. As in the hybrid FC vehicle, a
DC-DC converter connects the FC and the traction
battery.
2.2 Vehicle Characteristics
In order to simulate the impact of the integration of a
FC system on a real traction system [3], standard
market’s v
simulation as shown in Table 2.
The basis vehicle weight was calculated excluding
FC system, hydrogen tank and traction battery weights.
To obtain this weight it was considered that a
conventional C
1,300 kg. For a FC vehicle the ICE system weight
Evaluation of Fuel Cell Vehicle
emSim detail for a hybrid FC vehicle
emSim detail for a plug
regenerative braking. As in the hybrid FC vehicle, a
DC converter connects the FC and the traction
Characteristics
In order to simulate the impact of the integration of a
FC system on a real traction system [3], standard
market’s vehicle characteristics were used for
simulation as shown in Table 2.
The basis vehicle weight was calculated excluding
FC system, hydrogen tank and traction battery weights.
To obtain this weight it was considered that a
conventional C-Segment car weighs a
kg. For a FC vehicle the ICE system weight
valuation of Fuel Cell Vehicle Impact on Range, Weight and Energy Consumption
detail for a hybrid FC vehicle
detail for a plug-in hybrid FC vehicle
regenerative braking. As in the hybrid FC vehicle, a
DC converter connects the FC and the traction
Characteristics
In order to simulate the impact of the integration of a
FC system on a real traction system [3], standard
ehicle characteristics were used for
simulation as shown in Table 2.
The basis vehicle weight was calculated excluding
FC system, hydrogen tank and traction battery weights.
To obtain this weight it was considered that a
Segment car weighs around 1
kg. For a FC vehicle the ICE system weight
valuation of Fuel Cell Vehicle Impact on Range, Weight and Energy Consumption
detail for a hybrid FC vehicle.
in hybrid FC vehicle.
regenerative braking. As in the hybrid FC vehicle, a
DC converter connects the FC and the traction
In order to simulate the impact of the integration of a
FC system on a real traction system [3], standard
ehicle characteristics were used for
The basis vehicle weight was calculated excluding
FC system, hydrogen tank and traction battery weights.
To obtain this weight it was considered that a
round 1,200 kg to
kg. For a FC vehicle the ICE system weight
valuation of Fuel Cell Vehicle Regarding Hybridization Degree and Impact on Range, Weight and Energy Consumption
.
regenerative braking. As in the hybrid FC vehicle, a
DC converter connects the FC and the traction
In order to simulate the impact of the integration of a
FC system on a real traction system [3], standard
ehicle characteristics were used for
The basis vehicle weight was calculated excluding
FC system, hydrogen tank and traction battery weights.
To obtain this weight it was considered that a
200 kg to
kg. For a FC vehicle the ICE system weight
Table 2
(engine
gearbox is substituted with a fixed gear, which is
lighter. However, motor,
vehicle
be approximately 100
of 1
Regarding resistance to movement parameters, the
aim was to be in ac
size of a standard C
market study was performed to obtain these values.
The tire drag coefficient corresponds to a 205/55R16
with efficiency label C (as per regulation 1222/2009
C1) [4].
The powertrain parameters present a relevant impact
on the vehicle performance. Motors of electric vehicles
on the market were evaluated to size the motor power,
with the result of 70 kW as a representative value and
an estimated average efficiency of 80%.
permanent 12
was considered as 400
devices).
In short, the parameters previously set aim to meet a
real C
performance.
2.2.1
Regarding regenerative braking, simulations showed
Vehicle Class
Vehicle basis weight (kg)
Aerodynamic drag coefficient (Cd)
Frontal area (A) (m2)
Tire drag coefficient (t/t)
Architecture
Tire
Motor average efficiency
Motor power (kW)
Reducer efficiency
Differential efficiency
Equivalent inertia of rotating parts
Auxiliaries' consumption (W)
egarding Hybridization Degree and Impact on Range, Weight and Energy Consumption
Table 2 Vehicle characteristics used for simulation
(engine + fuel tank + auxiliaries) is removed and the
gearbox is substituted with a fixed gear, which is
lighter. However, motor,
vehicle) auxiliaries are included, and their weight can
be approximately 100
of 1,100 kg was set as vehicle basis for a C
Regarding resistance to movement parameters, the
aim was to be in ac
size of a standard C
market study was performed to obtain these values.
The tire drag coefficient corresponds to a 205/55R16
with efficiency label C (as per regulation 1222/2009
C1) [4].
The powertrain parameters present a relevant impact
on the vehicle performance. Motors of electric vehicles
on the market were evaluated to size the motor power,
with the result of 70 kW as a representative value and
an estimated average efficiency of 80%.
permanent 12 V consumption for vehicle electronics
was considered as 400
devices).
In short, the parameters previously set aim to meet a
real C-Segment vehicle design, configuration and
performance.
2.2.1 Regenerative
Regarding regenerative braking, simulations showed
Vehicle Class
Vehicle basis weight (kg)
Aerodynamic drag coefficient (Cd)
Frontal area (A) (m2)
Tire drag coefficient (t/t)
Architecture
Tire
Motor average efficiency
Motor power (kW)
Reducer efficiency
Differential efficiency
Equivalent inertia of rotating parts
Auxiliaries' consumption (W)
Vehicle resistance to movement
egarding Hybridization Degree and Impact on Range, Weight and Energy Consumption
Vehicle characteristics used for simulation
fuel tank + auxiliaries) is removed and the
gearbox is substituted with a fixed gear, which is
lighter. However, motor, inverter and EV (
) auxiliaries are included, and their weight can
be approximately 100-150 kg. Therefore, this weight
kg was set as vehicle basis for a C
Regarding resistance to movement parameters, the
aim was to be in accordance with the coefficients and
size of a standard C-Segment vehicle and therefore, a
market study was performed to obtain these values.
The tire drag coefficient corresponds to a 205/55R16
with efficiency label C (as per regulation 1222/2009
The powertrain parameters present a relevant impact
on the vehicle performance. Motors of electric vehicles
on the market were evaluated to size the motor power,
with the result of 70 kW as a representative value and
an estimated average efficiency of 80%.
V consumption for vehicle electronics
was considered as 400 W (without FC specific cooling
In short, the parameters previously set aim to meet a
Segment vehicle design, configuration and
Regenerative Braking
Regarding regenerative braking, simulations showed
Vehicle basis weight (kg)
Aerodynamic drag coefficient (Cd)
Frontal area (A) (m2)
Tire drag coefficient (t/t)
Motor average efficiency
Motor power (kW)
Reducer efficiency
Differential efficiency
Equivalent inertia of rotating parts
Auxiliaries' consumption (W)
Vehicle characteristics
Vehicle resistance to movement
Powertrain parameters
egarding Hybridization Degree and Its
Vehicle characteristics used for simulation
fuel tank + auxiliaries) is removed and the
gearbox is substituted with a fixed gear, which is
inverter and EV (
) auxiliaries are included, and their weight can
kg. Therefore, this weight
kg was set as vehicle basis for a C
Regarding resistance to movement parameters, the
cordance with the coefficients and
Segment vehicle and therefore, a
market study was performed to obtain these values.
The tire drag coefficient corresponds to a 205/55R16
with efficiency label C (as per regulation 1222/2009
The powertrain parameters present a relevant impact
on the vehicle performance. Motors of electric vehicles
on the market were evaluated to size the motor power,
with the result of 70 kW as a representative value and
an estimated average efficiency of 80%.
V consumption for vehicle electronics
W (without FC specific cooling
In short, the parameters previously set aim to meet a
Segment vehicle design, configuration and
raking
Regarding regenerative braking, simulations showed
C-Segment
Aerodynamic drag coefficient (Cd)
1 Motor, frontal
205/55R16
Equivalent inertia of rotating parts5% of total weight
400
Vehicle characteristics
Vehicle resistance to movement
Powertrain parameters
Vehicle characteristics used for simulation.
fuel tank + auxiliaries) is removed and the
gearbox is substituted with a fixed gear, which is
inverter and EV (electric
) auxiliaries are included, and their weight can
kg. Therefore, this weight
kg was set as vehicle basis for a C-Segment.
Regarding resistance to movement parameters, the
cordance with the coefficients and
Segment vehicle and therefore, a
market study was performed to obtain these values.
The tire drag coefficient corresponds to a 205/55R16
with efficiency label C (as per regulation 1222/2009
The powertrain parameters present a relevant impact
on the vehicle performance. Motors of electric vehicles
on the market were evaluated to size the motor power,
with the result of 70 kW as a representative value and
an estimated average efficiency of 80%. The
V consumption for vehicle electronics
W (without FC specific cooling
In short, the parameters previously set aim to meet a
Segment vehicle design, configuration and
Regarding regenerative braking, simulations showed
C-Segment
1100
0.3
1.91
0.0085
1 Motor, frontal
205/55R16
80%
70
97%
98%
5% of total weight
Vehicle resistance to movement
fuel tank + auxiliaries) is removed and the
gearbox is substituted with a fixed gear, which is
electric
) auxiliaries are included, and their weight can
kg. Therefore, this weight
Regarding resistance to movement parameters, the
cordance with the coefficients and
Segment vehicle and therefore, a
market study was performed to obtain these values.
The tire drag coefficient corresponds to a 205/55R16
with efficiency label C (as per regulation 1222/2009
The powertrain parameters present a relevant impact
on the vehicle performance. Motors of electric vehicles
on the market were evaluated to size the motor power,
with the result of 70 kW as a representative value and
The
V consumption for vehicle electronics
W (without FC specific cooling
In short, the parameters previously set aim to meet a
Segment vehicle design, configuration and
Regarding regenerative braking, simulations showed

Evaluation of Fuel Cell Vehicle Regarding Hybridization Degree and Its Impact on Range, Weight and Energy Consumption
39
that for the vehicle characteristics and the cycles to be
followed, under a good brake control, it is possible to
perform all the decelerations NEDC cycle with
regenerative brake only. This premise was used to
simulate the different cycles on the hybrid FC and
plug-in hybrid FC vehicle, and thus, it is an assumption
that no hydraulic brake is used and that the brake
energy is recovered taking into account the powertrain
components’ efficiency.
2.2.2 Propulsion System Characteristics
The FC power for each vehicle was a requirement
from the PUMA Mind project [2] scope, while the
battery or the hybrid cases was set to satisfy the energy
and power demand of the drive cycles. The power
stablished in the PUMA Mind project [2] for the FCs of
the pure FC, hybrid FC and plug-in hybrid FC
configurations is 100 kW, 30 kW and 8 kW,
respectively. The power characteristics of the three
simulated vehicles are summarized in Table 3. It can be
observed that the plug-in hybrid FC battery provides
more power than the minimum required because its
size is suited to high energy storage.
The main characteristics of the accumulation [5] and
traction systems used for simulation are shown in Table
4. As mentioned above, the pure FC vehicle has no
traction battery. Due to the different performance
requirements between a hybrid and plug-in hybrid
vehicle two different battery technologies were
considered in the simulation to choose the optimal one
for each hybrid vehicle configuration. For the hybrid
FC vehicle architecture, the battery must provide at
least 40 kW and thus, LiFePO4 was the chemistry used
because of its high power performance with reduced
battery size. On the contrary, the plug-in hybrid FC
vehicle must fulfil not only power requirements, but
mainly energy storage ones, to accumulate energy with
the minor weight and volume. For these reason the
chemistry in this case was LiNiCo which is more suited
for power storage.
2.2.3 FC System Efficiency
Regarding motor and FC system, apart from power,
Table 3 Vehicles’ power units specification.
Table 4 Accumulation [5] and traction systems’ characteristics.
other key point to be considered is the efficiency,
which depends on the power load.
For simulation, the average motor efficiency was
used as specified in Table 2. This assumption is
acceptable because the three vehicles perform the same
cycles, and, as the mechanical part is the same for all of
them, the motor operative points are similar and an
average efficiency can be assumed. However, the
operative points of the FC of each vehicle are
substantially different because of their different FC
sizes and energy management strategies. Thus, special
care must be taken to simulate the FC instantaneous
behaviour.
Normally FC stacks are systems with efficiency up
to 50-60% as shown hereinafter in Fig. 4. The FC
efficiency curves were considered to be scalable to the
FC size with a local maximum of 60% efficiency at
40% load point [3] as shown in Fig. 1.
2.3 Mission Profiles
Five cycles were selected to evaluate the vehicle
consumption and range under a wide variety of
situations. NEDC cycle was used to dimension the
energy storage systems for each vehicle to reach the
Pur
e F
C
Hyb
rid
FC
Plu
g-in
hy
brid
FC
Motor Power (kW) 70 70 70
Battery Power (kW) - 40 108
FC Power (kW) 100 30 8
Power density
(kW/kg)
Energy density
(kWh/kg)
Fuel cell 0.65 -
Hydrogen tank - 1.8
LiNiCo chemistry (Hybrid FC) 1.905 0.094
LiFePO4 chemistry (Plug-in H. FC) 0.482 0.132
Traction HV battery
Fuel cell system

40
Fig. 4 FC efficiency curves for a 8 kW FC (green), a 30 kW FC (blue) and a 100 kW FC (red) [3]
target 500 km range, and the other cycles were used to
develop the control strategy to provide good
performance in different situations.
The NEDC [6]
because is supposed to represent the typical usage of
passenger car in Europe and is currently used in Europe
to assess fuel economy.
The WLTP
test procedures
Federal Test Procedure cycle (US06) [8] were also
selected as mission profiles to adapt the operating
strategy to more dynamic and aggressive cycles.
Furthermore, another two customized profiles were
defined. The first one is a simplified representation of
highway driving at nearly constant speed of 120 km/h
as it would happen with cruise control with some
decelerations to 100 km/h as shown in Fig. 8. It is
aimed to test the vehicle range performance under this
situation that is very demanding for the vehicle
low-powered FC.
The second customized cycle is meant to represent
the real European urban and extra
based on a 3h
IDIADA (Fig. 9).
As a summary, Table 5 compares some of the main
characteristics
be observed that steady 120 has the most demanding
average speed while US06 combines the higher
average acceleration with a high average speed. WLTP
and real record cycles present similar acceleration
levels to US
Evaluation of Fuel Cell Vehicle
FC efficiency curves for a 8 kW FC (green), a 30 kW FC (blue) and a 100 kW FC (red) [3]
target 500 km range, and the other cycles were used to
develop the control strategy to provide good
performance in different situations.
The NEDC [6] was selected t
because is supposed to represent the typical usage of
car in Europe and is currently used in Europe
to assess fuel economy.
WLTP (worldwide harmonized light vehicles
test procedures) cycle
eral Test Procedure cycle (US06) [8] were also
selected as mission profiles to adapt the operating
strategy to more dynamic and aggressive cycles.
Furthermore, another two customized profiles were
defined. The first one is a simplified representation of
ghway driving at nearly constant speed of 120 km/h
as it would happen with cruise control with some
decelerations to 100 km/h as shown in Fig. 8. It is
aimed to test the vehicle range performance under this
situation that is very demanding for the vehicle
powered FC.
The second customized cycle is meant to represent
the real European urban and extra
based on a 3h-long measurement performed by
IDIADA (Fig. 9).
As a summary, Table 5 compares some of the main
characteristics of the five cycles to be simulated. It can
be observed that steady 120 has the most demanding
average speed while US06 combines the higher
average acceleration with a high average speed. WLTP
and real record cycles present similar acceleration
levels to US06 but with significantly lower average
valuation of Fuel Cell Vehicle Impact on Range, Weight and Energy Consumption
FC efficiency curves for a 8 kW FC (green), a 30 kW FC (blue) and a 100 kW FC (red) [3]
target 500 km range, and the other cycles were used to
develop the control strategy to provide good
performance in different situations.
was selected to dimension the vehicle
because is supposed to represent the typical usage of
car in Europe and is currently used in Europe
worldwide harmonized light vehicles
[7] and the Supplemental
eral Test Procedure cycle (US06) [8] were also
selected as mission profiles to adapt the operating
strategy to more dynamic and aggressive cycles.
Furthermore, another two customized profiles were
defined. The first one is a simplified representation of
ghway driving at nearly constant speed of 120 km/h
as it would happen with cruise control with some
decelerations to 100 km/h as shown in Fig. 8. It is
aimed to test the vehicle range performance under this
situation that is very demanding for the vehicle
The second customized cycle is meant to represent
the real European urban and extra-urban driving profile
long measurement performed by
As a summary, Table 5 compares some of the main
of the five cycles to be simulated. It can
be observed that steady 120 has the most demanding
average speed while US06 combines the higher
average acceleration with a high average speed. WLTP
and real record cycles present similar acceleration
06 but with significantly lower average
valuation of Fuel Cell Vehicle Impact on Range, Weight and Energy Consumption
FC efficiency curves for a 8 kW FC (green), a 30 .
target 500 km range, and the other cycles were used to
develop the control strategy to provide good
o dimension the vehicle
because is supposed to represent the typical usage of
car in Europe and is currently used in Europe
worldwide harmonized light vehicles
[7] and the Supplemental
eral Test Procedure cycle (US06) [8] were also
selected as mission profiles to adapt the operating
strategy to more dynamic and aggressive cycles.
Furthermore, another two customized profiles were
defined. The first one is a simplified representation of
ghway driving at nearly constant speed of 120 km/h
as it would happen with cruise control with some
decelerations to 100 km/h as shown in Fig. 8. It is
aimed to test the vehicle range performance under this
situation that is very demanding for the vehicle with the
The second customized cycle is meant to represent
urban driving profile
long measurement performed by
As a summary, Table 5 compares some of the main
of the five cycles to be simulated. It can
be observed that steady 120 has the most demanding
average speed while US06 combines the higher
average acceleration with a high average speed. WLTP
and real record cycles present similar acceleration
06 but with significantly lower average
valuation of Fuel Cell Vehicle Regarding Hybridization Degree and Impact on Range, Weight and Energy Consumption
FC efficiency curves for a 8 kW FC (green), a 30
target 500 km range, and the other cycles were used to
develop the control strategy to provide good
o dimension the vehicle
because is supposed to represent the typical usage of
car in Europe and is currently used in Europe
worldwide harmonized light vehicles
[7] and the Supplemental
eral Test Procedure cycle (US06) [8] were also
selected as mission profiles to adapt the operating
Furthermore, another two customized profiles were
defined. The first one is a simplified representation of
ghway driving at nearly constant speed of 120 km/h
as it would happen with cruise control with some
decelerations to 100 km/h as shown in Fig. 8. It is
aimed to test the vehicle range performance under this
with the
The second customized cycle is meant to represent
urban driving profile
long measurement performed by
As a summary, Table 5 compares some of the main
of the five cycles to be simulated. It can
be observed that steady 120 has the most demanding
average speed while US06 combines the higher
average acceleration with a high average speed. WLTP
and real record cycles present similar acceleration
06 but with significantly lower average
speed, and thus they are less demanding. To end up
with, NEDC requires very smooth accelerations and
low average speed, being one of the less demanding
cycles of the table.
3. Concepts Development
The three
were studied in
purpose of optimizing the operating strategy to reach
500 km of range in NEDC with the minimum energy
storage as possible. In this section, the three
simulations are firs
the results a
3.4.
The models were developed in the 1D simulation
software vemSim that runs in Matlab/Simulink
environment, and the controller was implemented in
Simulink. Fig
vemSim.
Fig.
Fig.
Table 5
NEDC
WLTP
US06
Steady 120
Real Record
egarding Hybridization Degree and Impact on Range, Weight and Energy Consumption
speed, and thus they are less demanding. To end up
with, NEDC requires very smooth accelerations and
low average speed, being one of the less demanding
cycles of the table.
Concepts Development
The three abovementioned vehicle architectures
were studied in
purpose of optimizing the operating strategy to reach
500 km of range in NEDC with the minimum energy
storage as possible. In this section, the three
simulations are firs
the results are summarized and discussed in
3.4.
The models were developed in the 1D simulation
software vemSim that runs in Matlab/Simulink
environment, and the controller was implemented in
Simulink. Figs.
vemSim.
Fig. 8 Conceptual highway driving profile
Fig. 9 Measured urban and extra
Table 5 Driving cycles main characteristics
NEDC
WLTP
US06
Steady 120
Real Record
egarding Hybridization Degree and Impact on Range, Weight and Energy Consumption
speed, and thus they are less demanding. To end up
with, NEDC requires very smooth accelerations and
low average speed, being one of the less demanding
cycles of the table.
Concepts Development
abovementioned vehicle architectures
were studied in-depth during simulation with the
purpose of optimizing the operating strategy to reach
500 km of range in NEDC with the minimum energy
storage as possible. In this section, the three
simulations are first explained in detail and at the end
re summarized and discussed in
The models were developed in the 1D simulation
software vemSim that runs in Matlab/Simulink
environment, and the controller was implemented in
. 1-3 show the block diagrams in
8 Conceptual highway driving profile
Measured urban and extra
Driving cycles main characteristics
V max (km/h)
V avg (km/h)
120 34
131 47
129 77
120 116
88 30
egarding Hybridization Degree and Its
speed, and thus they are less demanding. To end up
with, NEDC requires very smooth accelerations and
low average speed, being one of the less demanding
Concepts Development
abovementioned vehicle architectures
depth during simulation with the
purpose of optimizing the operating strategy to reach
500 km of range in NEDC with the minimum energy
storage as possible. In this section, the three
t explained in detail and at the end
re summarized and discussed in
The models were developed in the 1D simulation
software vemSim that runs in Matlab/Simulink
environment, and the controller was implemented in
show the block diagrams in
8 Conceptual highway driving profile.
Measured urban and extra-urban driving profile
Driving cycles main characteristics.
V avg (km/h)
Time stopped
34 23%
47 12%
77 7%
116 0%
30 15%
speed, and thus they are less demanding. To end up
with, NEDC requires very smooth accelerations and
low average speed, being one of the less demanding
abovementioned vehicle architectures
depth during simulation with the
purpose of optimizing the operating strategy to reach
500 km of range in NEDC with the minimum energy
storage as possible. In this section, the three
t explained in detail and at the end
re summarized and discussed in Section
The models were developed in the 1D simulation
software vemSim that runs in Matlab/Simulink
environment, and the controller was implemented in
show the block diagrams in
urban driving profile .
.
Time stopped
a avg (m/s2)
23% 0.26
12% 0.45
0.48
0.10
15% 0.46
speed, and thus they are less demanding. To end up
with, NEDC requires very smooth accelerations and
low average speed, being one of the less demanding
abovementioned vehicle architectures
depth during simulation with the
purpose of optimizing the operating strategy to reach
500 km of range in NEDC with the minimum energy
storage as possible. In this section, the three
t explained in detail and at the end
ection
The models were developed in the 1D simulation
software vemSim that runs in Matlab/Simulink
environment, and the controller was implemented in
show the block diagrams in

For the development of the three concepts, an initial
energy management strategy was defined. Then, the
software performed iterations to obtain a battery and
hydrogen storage that fitted wi
range target
battery and Hydrogen tank sizes affected the vehicl
weight which affects consumption and thus range.
Afterwards, the performance on the different mission
profiles was tested. The operating strategy was
improved to permit a soft FC power profile operating
close to the best efficiency point while maintainin
adequate SOC of the battery and a reasonable full
electric range for the
storage size was modified in the cases that the new
strategy affected the NEDC range and the mission
profiles were tested again. Fig. 10 shows the f
diagram of the design process.
3.1 Pure FC
3.1.1 Starting
The initial condition for the range simulation was
vehicle stopped and H
3.1.2 Vehicle
Profiles
Due to the lack of
a FC, the power distribution required by the NEDC
cycle corresponds to the FC’s power distribution as
shown in the histograms in Fig. 16. This means that all
the electric power is supplied to the traction system by
the FC as shown in Fig
to store enough H
It can be observed that the FC is continuously
working in traction situation, and is off when the
vehicle is decelerating or stopped. Then, the auxiliary
accumulator that is charged during traction provides
enough energy to supply the 400
consumption, and allows the FC to be switched off.
This accumulator prevents the FC from working at 400
W and very low efficiency when no traction is requir
Simulations showed that connecting the auxiliaries
directly to the FC would increase the total H
Evaluation of Fuel Cell Vehicle
For the development of the three concepts, an initial
management strategy was defined. Then, the
software performed iterations to obtain a battery and
hydrogen storage that fitted wi
[9]. It was an iterative process because the
battery and Hydrogen tank sizes affected the vehicl
weight which affects consumption and thus range.
Afterwards, the performance on the different mission
profiles was tested. The operating strategy was
improved to permit a soft FC power profile operating
close to the best efficiency point while maintainin
adequate SOC of the battery and a reasonable full
electric range for the plug
storage size was modified in the cases that the new
strategy affected the NEDC range and the mission
profiles were tested again. Fig. 10 shows the f
diagram of the design process.
Pure FC Vehicle
Starting Conditions
The initial condition for the range simulation was
vehicle stopped and H2 tank completely full.
Vehicle Development
Due to the lack of another traction source apart from
a FC, the power distribution required by the NEDC
cycle corresponds to the FC’s power distribution as
shown in the histograms in Fig. 16. This means that all
the electric power is supplied to the traction system by
as shown in Fig. 10. Thus, the H
to store enough H2 to cover the target NEDC range.
It can be observed that the FC is continuously
working in traction situation, and is off when the
vehicle is decelerating or stopped. Then, the auxiliary
accumulator that is charged during traction provides
enough energy to supply the 400
consumption, and allows the FC to be switched off.
This accumulator prevents the FC from working at 400
W and very low efficiency when no traction is requir
Simulations showed that connecting the auxiliaries
directly to the FC would increase the total H
valuation of Fuel Cell Vehicle Impact on Range, Weight and Energy Consumption
For the development of the three concepts, an initial
management strategy was defined. Then, the
software performed iterations to obtain a battery and
hydrogen storage that fitted with the 500 km NEDC
It was an iterative process because the
battery and Hydrogen tank sizes affected the vehicl
weight which affects consumption and thus range.
Afterwards, the performance on the different mission
profiles was tested. The operating strategy was
improved to permit a soft FC power profile operating
close to the best efficiency point while maintainin
adequate SOC of the battery and a reasonable full
plug-in case. Then the energy
storage size was modified in the cases that the new
strategy affected the NEDC range and the mission
profiles were tested again. Fig. 10 shows the f
diagram of the design process.
Conditions
The initial condition for the range simulation was
tank completely full.
Development as p
another traction source apart from
a FC, the power distribution required by the NEDC
cycle corresponds to the FC’s power distribution as
shown in the histograms in Fig. 16. This means that all
the electric power is supplied to the traction system by
10. Thus, the H
to cover the target NEDC range.
It can be observed that the FC is continuously
working in traction situation, and is off when the
vehicle is decelerating or stopped. Then, the auxiliary
accumulator that is charged during traction provides
enough energy to supply the 400
consumption, and allows the FC to be switched off.
This accumulator prevents the FC from working at 400
W and very low efficiency when no traction is requir
Simulations showed that connecting the auxiliaries
directly to the FC would increase the total H
valuation of Fuel Cell Vehicle Impact on Range, Weight and Energy Consumption
For the development of the three concepts, an initial
management strategy was defined. Then, the
software performed iterations to obtain a battery and
th the 500 km NEDC
It was an iterative process because the
battery and Hydrogen tank sizes affected the vehicl
weight which affects consumption and thus range.
Afterwards, the performance on the different mission
profiles was tested. The operating strategy was
improved to permit a soft FC power profile operating
close to the best efficiency point while maintaining an
adequate SOC of the battery and a reasonable full
case. Then the energy
storage size was modified in the cases that the new
strategy affected the NEDC range and the mission
profiles were tested again. Fig. 10 shows the f
The initial condition for the range simulation was
tank completely full.
per the Mission
another traction source apart from
a FC, the power distribution required by the NEDC
cycle corresponds to the FC’s power distribution as
shown in the histograms in Fig. 16. This means that all
the electric power is supplied to the traction system by
10. Thus, the H2 tank itself has
to cover the target NEDC range.
It can be observed that the FC is continuously
working in traction situation, and is off when the
vehicle is decelerating or stopped. Then, the auxiliary
accumulator that is charged during traction provides
W auxiliaries’
consumption, and allows the FC to be switched off.
This accumulator prevents the FC from working at 400
W and very low efficiency when no traction is requir
Simulations showed that connecting the auxiliaries
directly to the FC would increase the total H
valuation of Fuel Cell Vehicle Regarding Hybridization Degree and Impact on Range, Weight and Energy Consumption
For the development of the three concepts, an initial
management strategy was defined. Then, the
software performed iterations to obtain a battery and
th the 500 km NEDC
It was an iterative process because the
battery and Hydrogen tank sizes affected the vehicle
weight which affects consumption and thus range.
Afterwards, the performance on the different mission
profiles was tested. The operating strategy was
improved to permit a soft FC power profile operating
close to the best efficiency point while maintaining an
adequate SOC of the battery and a reasonable full
case. Then the energy
storage size was modified in the cases that the new
strategy affected the NEDC range and the mission
profiles were tested again. Fig. 10 shows the flow
The initial condition for the range simulation was
he Mission
another traction source apart from
a FC, the power distribution required by the NEDC
cycle corresponds to the FC’s power distribution as
shown in the histograms in Fig. 16. This means that all
the electric power is supplied to the traction system by
tank itself has
to cover the target NEDC range.
It can be observed that the FC is continuously
working in traction situation, and is off when the
vehicle is decelerating or stopped. Then, the auxiliary
accumulator that is charged during traction provides
W auxiliaries’
consumption, and allows the FC to be switched off.
This accumulator prevents the FC from working at 400
W and very low efficiency when no traction is required.
Simulations showed that connecting the auxiliaries
directly to the FC would increase the total H2
consumption by 9.5%, which means 14.6 kg more of
H2 tank. This accumulator is just used to supply energy
to the auxiliaries and it is not suited for regen
braking.
As per the power demand required for NEDC, it can
be observed that the FC power profile is very variable
(Fig.
points. The maximum power provided by the FC is 40
kW which means that it rea
efficiency point just once in a complete cycle.
According to that, the H
to cover the cycle requirements, but also the FC
efficiency reduction.
The detailed weight and energy consumption results
obtained for
Section 3.4.
3.2
3.2.1
As the battery cannot be recharged to its maximum
Fig. 10 Flow diagram of the design process
Fig.
egarding Hybridization Degree and Impact on Range, Weight and Energy Consumption
consumption by 9.5%, which means 14.6 kg more of
tank. This accumulator is just used to supply energy
to the auxiliaries and it is not suited for regen
braking.
As per the power demand required for NEDC, it can
be observed that the FC power profile is very variable
(Fig. 11) and it operates at low load and low efficiency
points. The maximum power provided by the FC is 40
kW which means that it rea
efficiency point just once in a complete cycle.
According to that, the H
to cover the cycle requirements, but also the FC
efficiency reduction.
The detailed weight and energy consumption results
obtained for the pu
ection 3.4.
Hybrid FC vehicle
3.2.1 Starting
As the battery cannot be recharged to its maximum
Fig. 10 Flow diagram of the design process
Fig. 11 Pure FC vehicle power profile on NEDC
egarding Hybridization Degree and Impact on Range, Weight and Energy Consumption
consumption by 9.5%, which means 14.6 kg more of
tank. This accumulator is just used to supply energy
to the auxiliaries and it is not suited for regen
As per the power demand required for NEDC, it can
be observed that the FC power profile is very variable
11) and it operates at low load and low efficiency
points. The maximum power provided by the FC is 40
kW which means that it rea
efficiency point just once in a complete cycle.
According to that, the H2 tank is not only dimensioned
to cover the cycle requirements, but also the FC
efficiency reduction.
The detailed weight and energy consumption results
the pure FC vehicle are presented in
Hybrid FC vehicle
Starting Conditions
As the battery cannot be recharged to its maximum
Fig. 10 Flow diagram of the design process
Pure FC vehicle power profile on NEDC
egarding Hybridization Degree and Its
consumption by 9.5%, which means 14.6 kg more of
tank. This accumulator is just used to supply energy
to the auxiliaries and it is not suited for regen
As per the power demand required for NEDC, it can
be observed that the FC power profile is very variable
11) and it operates at low load and low efficiency
points. The maximum power provided by the FC is 40
kW which means that it reaches its maximum
efficiency point just once in a complete cycle.
tank is not only dimensioned
to cover the cycle requirements, but also the FC
The detailed weight and energy consumption results
re FC vehicle are presented in
As the battery cannot be recharged to its maximum
Fig. 10 Flow diagram of the design process.
Pure FC vehicle power profile on NEDC
41
consumption by 9.5%, which means 14.6 kg more of
tank. This accumulator is just used to supply energy
to the auxiliaries and it is not suited for regenerative
As per the power demand required for NEDC, it can
be observed that the FC power profile is very variable
11) and it operates at low load and low efficiency
points. The maximum power provided by the FC is 40
ches its maximum
efficiency point just once in a complete cycle.
tank is not only dimensioned
to cover the cycle requirements, but also the FC
The detailed weight and energy consumption results
re FC vehicle are presented in
As the battery cannot be recharged to its maximum
.
Pure FC vehicle power profile on NEDC.
41
consumption by 9.5%, which means 14.6 kg more of
tank. This accumulator is just used to supply energy
erative
As per the power demand required for NEDC, it can
be observed that the FC power profile is very variable
11) and it operates at low load and low efficiency
points. The maximum power provided by the FC is 40
ches its maximum
efficiency point just once in a complete cycle.
tank is not only dimensioned
to cover the cycle requirements, but also the FC
The detailed weight and energy consumption results
re FC vehicle are presented in
As the battery cannot be recharged to its maximum

Evaluation of Fuel Cell Vehicle Regarding Hybridization Degree and Its Impact on Range, Weight and Energy Consumption
42
capacity, the initial SOC (state of charge) was for the
range simulation was set following the European
Regulation No. 101 [6] for hybrid electric vehicles not
externally chargeable: before testing, a previous
preconditioning test must be performed in which at
least two consecutive complete driving cycles are
carried out without soak. Independently of the initial
battery SOC, at the end of driving a preconditioning
cycle, the final SOC is within 60%-80%. Therefore, the
initial condition for the range simulation was vehicle
stopped H2 tank completely full and traction battery at
70% of initial SOC.
3.2.2 Energy Management as per the Mission
Profiles
The strategy followed is depicted in Table 6. Under
this strategy, the FC of 30 kW will always operate at its
maximum efficiency power or at higher loads in which
the efficiency is also very favourable to maintain the
battery SOC within 40%-80%. This strategy was set to
reach the minimum consumption on the five
abovementioned cycles by iterating with different
operating strategy charts.
The colour scales in Table 6 show the strategy to
follow at each moment depending on the traction
battery SOC and power demanded by the vehicle
Table 6 Hybrid FC consumption strategy.
compared with FC power. As the cycle power
requirements are strongly variable, in order to maintain
a soft operating strategy and not to demand abrupt load
peaks to the FC, an exponential moving average of the
cycle power demand with 4 m time constant was used
instead of the instantaneous power demand. The
exponential moving average weights the power loads
exponentially giving more relevance to the last value.
This method is fast to compute and does not require a
record of all the previous power values. Furthermore,
the variation of the FC power requirement coming from
the strategy is limited to a maximum raise of 0.6 kW/s
when the power request increases and -0.9 kW/s when
it decreases.
The black line marks in Table 6 represent the limit
SOC at which the FC is switched on. The offset when
switching the FC on and off at low power demand
avoids the occurrence of fast and short on/off cycles
that would imply many transitions from 0 to 12 kW
load and low efficiency of the FC.
Thus, the strategy consists on trying to keep the SOC
level within 40% and 80% and minimize hydrogen
consumption by working as much time as possible at
the maximum efficiency point of the FC. Therefore, the
FC is aimed at being switched off and work at its
maximum efficiency consecutively. However,
although this behavior is the optimal in terms of H2
consumption, there must be some exceptions to
maintain the battery SOC level. When the traction
battery SOC is very low (< 40%) or the vehicle
exponential moving average power demand is high
compared to the FC power, the FC either follows the
load demand point or works at its maximum power to
feed the battery. Furthermore, when the instantaneous
(not averaged) cycle power load exceeds 40 kW, which
is the maximum battery power, the FC must provide at
least all the exceeding power to fulfil the requirement
regardless of the strategy in Table 6. NEDC simulation
description, as mentioned in Section 3.2.1, at the
beginning of the NEDC cycle the traction battery is at
70% of SOC. Fig. 12 shows how the stored energy
-200
%
0% 10%
20%
30%
40%
50%
60%
70%
80%
90%
100%
350%
0% 4 4 4 4 4 4 4 4 4 4 4 4 4
10% 4 4 4 4 4 4 4 4 4 4 4 4 4
20% 4 4 4 4 4 4 4 4 4 4 4 4 4
30% 4 4 4 4 4 4 4 4 4 4 4 4 4
40% 2 2 2 2 2 2 3 3 4 4 4 4 4
50% 2 2 2 2 2 2 2 3 3 3 3 4 4
60% 2 2 2 2 2 2 2 2 2 2 3 4 4
70% 2 2 2 2 2 2 2 2 2 2 2 4 4
80% 1 1 1 1 1 1 1 1 1 1 1 1 1
90% 1 1 1 1 1 1 1 1 1 1 1 1 1
100% 1 1 1 1 1 1 1 1 1 1 1 1 1
1 FC off 2 FC = max eff.
3 FC =cycle load 4 FC= max power
Required Power / FC Power
SO
C (
%)

Evaluation of Fuel Cell Vehicle Regarding Hybridization Degree and Its Impact on Range, Weight and Energy Consumption
43
evolves in time. When the most demanding part of the
NEDC cycle is reached and thus the power requirement
is higher, the FC is switched on at its maximum
efficiency point. The NEDC power demand allows the
FC to either work at its maximum efficiency point (12
kW) or to be stopped. This FC on/off behaviour is
repeated maintaining the SOC level within 50% and
80% until the H2 tank is empty. At that moment the
battery provides all the power until it is completely
depleted at 500 km range. More demanding cycles in
which the FC needs to provide higher power levels are
shown in Annex A.
Fig. 13 shows a representative NEDC cycle, in
which it can be observed that the FC only operates at its
maximum efficiency point (12 kW) in the most
demanding part and that then it is switched off. The rest
of the energy demanded by the cycle is provided by
traction battery that absorbs all the power peaks and the
regenerated energy. Thus, thanks to the traction battery
and the energy management strategy, consumption is
reduced in contrast to the pure FC vehicle because it
Fig. 12 Hybrid FC vehicle in NEDC: FC power and remaining H2 and SOC during a range simulation.
Fig. 13 Hybrid FC vehicle in NEDC: Power distribution in one cycle.
allows regeneration and operation at the maximum
efficiency points.
The detailed weight and energy consumption results
obtained for the hybrid FC vehicle are presented in
Section 3.4. The performance of this concept vehicle in
other cycles can be observed in Annex A.
3.3 Plug-in Hybrid FC Vehicle
3.3.1 Starting Conditions
For this simulation, the initial condition is vehicle
stopped, H2 tank full and battery charged at 100%.
3.3.2 Energy Management as per the Mission
Profiles
In this concept vehicle the traction battery admits
external charge and the FC iss used as a range extender.
The strategy followed (Table 7) is designed to reach a
pure electric range of more than 80 km in NEDC cycle.
This requirement is aimed at covering the daily mileage
with electric energy only of 90% of the users according
to Ref. [10], and thus, making use of the H2 just for
long trips. Under this strategy first a battery depleting
occurs to allow electric range and then the FC of 8 kW
operates in high efficiency points to maintain the
battery SOC within 30%-50%. This strategy was set to
reach the minimum consumption and maximize the
electric range for the five abovementioned cycles
within the FC power limitations by iterating with
Table 7 Plug-in hybrid FC consumption strategy.
-650
%
0% 10%
20%
30%
40%
50%
60%
70%
80%
90%
100%
200%
1200
%
0% 4 4 4 4 4 4 4 4 4 4 4 4 4 4
10% 4 4 4 4 4 4 4 4 4 4 4 4 4 4
20% 4 4 4 4 4 4 4 4 4 4 4 4 4 4
30% 2 2 2 2 2 3 3 3 3 3 3 4 4 4
40% 2 2 2 2 2 2 2 2 2 2 3 4 4 4
50% 2 2 2 2 2 2 2 2 2 2 2 4 4 4
60% 1 2 2 2 2 2 2 2 2 2 2 4 4 4
70% 1 1 2 2 2 2 2 2 2 2 2 4 4 4
80% 1 1 2 2 2 2 2 2 2 2 2 4 4 4
90% 1 1 1 1 1 1 1 1 1 1 1 1 4 4
100% 1 1 1 1 1 1 1 1 1 1 1 1 1 1
1 FC off 2 FC = max eff.
3 FC =cycle load 4 FC= max power
Required Power / FC Power
SO
C (
%)

Evaluation of Fuel Cell Vehicle Regarding Hybridization Degree and Its Impact on Range, Weight and Energy Consumption
44
different operating strategy charts.
The colour scales and the black lines have the same
function as in the hybrid strategy described in Section
3.2.2. The strategy to follow depends on the traction
battery SOC and the exponential moving average
power demanded by the vehicle compared to the FC
power. The variation of the FC power requirement is
also limited to 0.6 kW/s and -0.9 kW/s to smooth the
FC load profile.
The black line marks that represent the limit SOC at
which the FC is switched on present a big offset with
respect to the FC off SOC level for average loads lower
than 16 kW to provide a high full electric range.
However, when the demand is higher, the FC is
switched on to its maximum power (8 kW) even though
the SOC is high to avoid the battery discharging too
fast. Even so, there are cases such as when driving in a
highway at 120 km/h, in which the FC power is not
enough to maintain the battery level and the vehicle is
stopped (SOC = 0) when there is still remaining H2 in
the tank (view Annex A). To avoid this phenomenon, a
15 kW FC or a speed limitation could be used as an
alternative, and were proposed within the PUMA Mind
project [2].
Under this strategy, for low- and
medium-demanding cycles the FC will always operate
at its maximum efficiency power or at higher loads in
which the efficiency is also very favourable to maintain
the battery SOC. As the FC maximum power is very
low, it usually does not switch off after the full electric
range, as it is demonstrated on Fig. 14 and on Figs. A.6
and A.9 of Annex A.
As mentioned in Section 3.3.1, in the beginning of
NEDC cycle traction battery is at 100% of SOC and
therefore the vehicle starts up in pure electric mode
with the FC switched off. Fig. 14 shows how the
energy stored evolves over time in the traction battery
and the H2 tank. When the SOC decreases to 40% the
FC starts working alternatively following the cycle
load and at its maximum efficiency point (3.2 kW).
With this strategy the pure electric range achieved is
119.5 km and the SOC level is then maintained within
40% and 45%. When all the hydrogen in the tank is
consumed, the battery provides all the power until it is
completely depleted for a range of 500 km.
The NEDC range could have also been achieved by
only operating the FC at its maximum efficiency point,
but under this situation there would not be a full
electric range which is the main advantage of plug-in
vehicles.
As per the power demand required in NEDC, Fig. 15
shows a representative NEDC in which the FC operates
only in its maximum efficiency point (3.2 kW) and
partially at higher loads. The rest of the energy is
provided by traction battery that absorbs all the power
peaks and the regenerated energy. The consumption is
reduced compared to the pure FC vehicle because
traction battery is capable of regenerating and it allows
the FC to work at high-efficiency operative points.
However, it is less efficient than the hybrid vehicle
because it works less time at its maximum efficiency
point.
Fig. 14 Plug-in hybrid FC vehicle in NEDC: FC power and remaining H2 and SOC during a range simulation.
Fig. 15 Plug-in hybrid FC vehicle in NEDC: Power distribution in one cycle.

Evaluation of Fuel Cell Vehicle Regarding Hybridization Degree and Its Impact on Range, Weight and Energy Consumption
45
The detailed weight and energy consumption results
obtained for the hybrid FC vehicle are presented
hereinafter. The performance of this concept vehicle in
other cycles can be observed in Annex A.
3.4 Concepts Comparison in NEDC
The results in terms of weight, energy storage and
consumption for the three concepts that are described
in this section were obtained by iteration because a
weight increase implies consumption and energy
storage increase. For better understanding of the
results, Fig. 16 shows the histogram of the power
distribution demanded by the NEDC cycle and the ones
followed by the three concepts. For better comparison,
all graphs have the same axis limits and column width.
The columns’ size was chosen to be so small to be able
to represent in detail the plug-in FC of only 8 kW
power profile.
This graph summarizes a lot of information. The
green columns represent either the cycle potential
energy recovery or the recovered energy that comes
back to the battery on each vehicle. It can be observed
that the vehicles that include a battery are able to
recover all this energy while the pure FC cannot and
thus has higher electric consumption (Table 10). The
blue columns represent either the time that the power
requirement is zero for the cycle or the time that the FC
is stopped. It can be observed that for the pure FC
vehicle the FC is only off during decelerations or
vehicle stopped while for the hybrid vehicle it is
stopped almost 70% of the time. For the plug-in hybrid
the total time that the FC is off taking into account the
initial electric range and the final part is 40%. The red
columns represent either the required cycle power or
the cycle profile followed by the FC. The pure FC
vehicle follows the cycle power distribution and does
not work at its maximum efficiency point of 40 kW. On
the other hand, the hybrid vehicle is optimized to work
always at its maximum efficiency point of 12 kW. To
end up with, the plug-in vehicle works most of the time
at its maximum efficiency load of 3.2 kW but has to
reach higher loads to maintain the SOC level, and thus
its average FC efficiency is lower than in the hybrid
case. The results obtained by simulation that are
described in the following paragraphs can be also
derived from these power histograms.
The weight of the base vehicle, FC stack, batteries
and hydrogen tank presented on Table 8 and Fig. 17
were calculated according to the densities that are
specified in Section 2.2. It can be observed that the
pure FC vehicle is the heavier because it requires a 100
kW FC and a big H2 tank due to the absence of
regeneration and its reduced average efficiency. The
plug-in case is also heavy compared to the hybrid FC
due to the weight of the battery.
Fig. 16 Vehicle power distribution histogram for NEDC cycle: (a) cycle requirements; (b) pure FC vehicle; (c) hybrid FC vehicle; (d) plug-in hybrid FC vehicle.
Table 8 Resulting components’ and total weight for the three concepts.
Pur
e F
C
Hyb
rid
FC
Plu
g-in
hy
brid
FC
Base weight (kg) 1100 1100 1100
Fuel Cell (kg) 154 46 12
H2 tank (kg) 87 50 33
Battery (kg) - 21 167
Total mass (kg) 1341 1217 1312
46
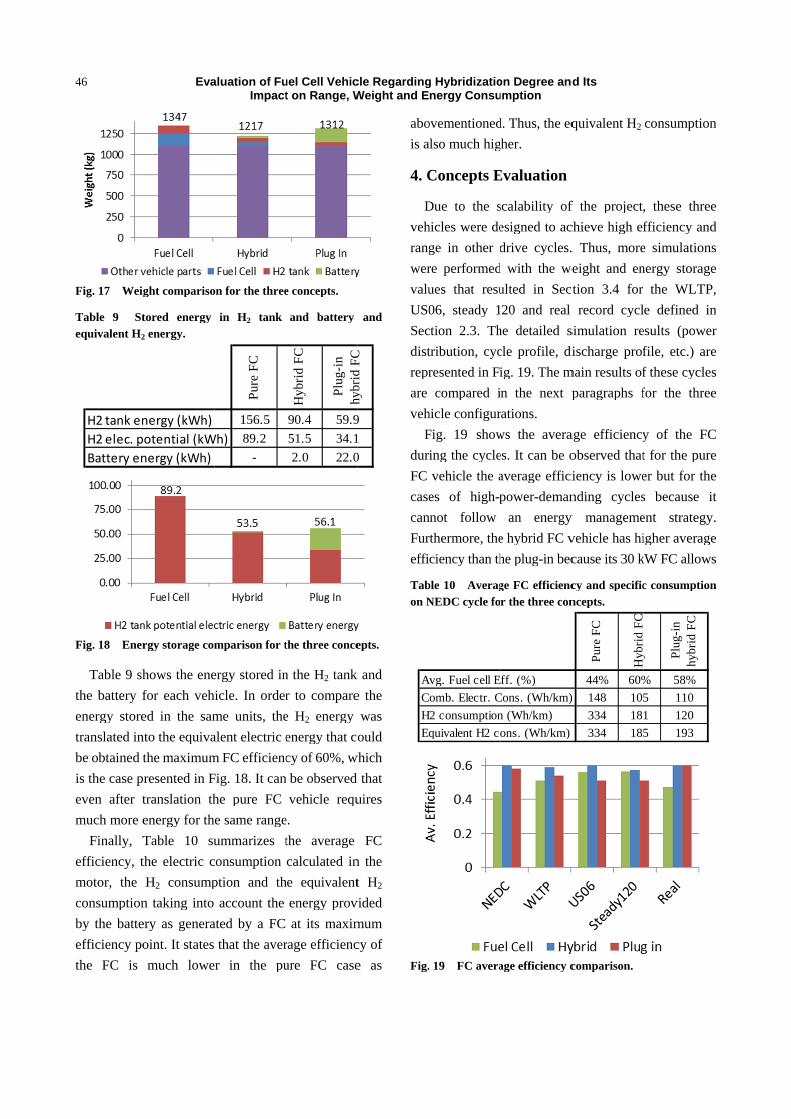
Fig. 17 Weight comparison for the three concepts
Table 9 Stored energy in equivalent H2
Fig. 18 Energy storage comparison for the three concepts
Table 9 shows the energy stored in the H
the battery for each vehicle. In order to compare the
energy stored in the same units, the H
translated into the equivalent electric energy that could
be obtained the maximum FC efficiency of 60%, which
is the case presented in Fig. 18. It can be observed that
even after translation the pure FC vehicle requires
much more energy for the
Finally, Table 10 summarizes the average FC
efficiency, the electric consumption calculated in the
motor, the H
consumption taking into account the energy provided
by the battery as generated by a FC at its m
efficiency point. It states that the average efficiency of
the FC is much lower in the pure FC case as
H2 tank energy (kWh)
H2 elec. potential (kWh)
Battery energy (kWh)
Evaluation of Fuel Cell Vehicle
Weight comparison for the three concepts
Stored energy in
2 energy.
Energy storage comparison for the three concepts
9 shows the energy stored in the H
the battery for each vehicle. In order to compare the
energy stored in the same units, the H
translated into the equivalent electric energy that could
be obtained the maximum FC efficiency of 60%, which
is the case presented in Fig. 18. It can be observed that
even after translation the pure FC vehicle requires
much more energy for the
Finally, Table 10 summarizes the average FC
efficiency, the electric consumption calculated in the
motor, the H2 consumption and the equivalent H
consumption taking into account the energy provided
by the battery as generated by a FC at its m
efficiency point. It states that the average efficiency of
the FC is much lower in the pure FC case as
H2 tank energy (kWh)
H2 elec. potential (kWh)
Battery energy (kWh)
valuation of Fuel Cell Vehicle Impact on Range, Weight and Energy Consumption
Weight comparison for the three concepts
Stored energy in H2 tank and battery and
Energy storage comparison for the three concepts
9 shows the energy stored in the H
the battery for each vehicle. In order to compare the
energy stored in the same units, the H
translated into the equivalent electric energy that could
be obtained the maximum FC efficiency of 60%, which
is the case presented in Fig. 18. It can be observed that
even after translation the pure FC vehicle requires
much more energy for the same range.
Finally, Table 10 summarizes the average FC
efficiency, the electric consumption calculated in the
consumption and the equivalent H
consumption taking into account the energy provided
by the battery as generated by a FC at its m
efficiency point. It states that the average efficiency of
the FC is much lower in the pure FC case as
Pur
e F
C
156.5
H2 elec. potential (kWh) 89.2
-
valuation of Fuel Cell Vehicle Impact on Range, Weight and Energy Consumption
Weight comparison for the three concepts.
tank and battery and
Energy storage comparison for the three concepts
9 shows the energy stored in the H2 tank and
the battery for each vehicle. In order to compare the
energy stored in the same units, the H2 energy was
translated into the equivalent electric energy that could
be obtained the maximum FC efficiency of 60%, which
is the case presented in Fig. 18. It can be observed that
even after translation the pure FC vehicle requires
same range.
Finally, Table 10 summarizes the average FC
efficiency, the electric consumption calculated in the
consumption and the equivalent H
consumption taking into account the energy provided
by the battery as generated by a FC at its maximum
efficiency point. It states that the average efficiency of
the FC is much lower in the pure FC case as
Hyb
rid
FC
Plu
g-i
n
hyb
rid
FC
90.4 59.9
51.5 34.1
2.0 22.0
valuation of Fuel Cell Vehicle Regarding Hybridization Degree and Impact on Range, Weight and Energy Consumption
tank and battery and
Energy storage comparison for the three concepts.
tank and
the battery for each vehicle. In order to compare the
energy was
translated into the equivalent electric energy that could
be obtained the maximum FC efficiency of 60%, which
is the case presented in Fig. 18. It can be observed that
even after translation the pure FC vehicle requires
Finally, Table 10 summarizes the average FC
efficiency, the electric consumption calculated in the
consumption and the equivalent H2
consumption taking into account the energy provided
aximum
efficiency point. It states that the average efficiency of
the FC is much lower in the pure FC case as
abovementioned. Thus, the equivalent H
is also much higher.
4. C
Due to the scalability of the project, these three
vehicles were designed to achieve high efficiency and
range in other drive cycles. Thus, more simulations
were performed with the weight and energy s
values that resulted in
US06, steady 120 an
Section 2.3. The detailed simulation results (power
distribution, cycle profile, discharge profile, etc.) are
represented in Fig. 19. The main results of these cycles
are compared in the next paragraphs for the three
vehicle configurations.
Fig. 19
during the cycles. It can be observed that for the pure
FC vehicle the average efficiency is lower but for the
cases of high
cannot follow an energy management strategy.
Furthermore, the hy
efficiency than the plug
Table 10on NEDC cycle for the three concepts
Fig.
hyb
rid
FC
59.9
34.1
22.0
Avg. Fuel cell Eff. (%)
Comb. Electr. Cons. (Wh/km)
H2 consumption (Wh/km)
Equivalent H2 cons. (Wh/km)
egarding Hybridization Degree and Impact on Range, Weight and Energy Consumption
abovementioned. Thus, the equivalent H
is also much higher.
4. Concepts Evaluation
Due to the scalability of the project, these three
vehicles were designed to achieve high efficiency and
range in other drive cycles. Thus, more simulations
were performed with the weight and energy s
values that resulted in
US06, steady 120 an
ection 2.3. The detailed simulation results (power
distribution, cycle profile, discharge profile, etc.) are
represented in Fig. 19. The main results of these cycles
are compared in the next paragraphs for the three
vehicle configurations.
Fig. 19 shows
during the cycles. It can be observed that for the pure
FC vehicle the average efficiency is lower but for the
cases of high-power
cannot follow an energy management strategy.
Furthermore, the hy
efficiency than the plug
Table 10 Average FC efficiency and specific consumption on NEDC cycle for the three concepts
Fig. 19 FC average efficiency comparison
Avg. Fuel cell Eff. (%)
Comb. Electr. Cons. (Wh/km)
H2 consumption (Wh/km)
Equivalent H2 cons. (Wh/km)
egarding Hybridization Degree and Impact on Range, Weight and Energy Consumption
abovementioned. Thus, the equivalent H
is also much higher.
Evaluation
Due to the scalability of the project, these three
vehicles were designed to achieve high efficiency and
range in other drive cycles. Thus, more simulations
were performed with the weight and energy s
values that resulted in Section 3.4 for the WLTP,
US06, steady 120 and real record cycle defined in
ection 2.3. The detailed simulation results (power
distribution, cycle profile, discharge profile, etc.) are
represented in Fig. 19. The main results of these cycles
are compared in the next paragraphs for the three
vehicle configurations.
shows the average efficiency of the FC
during the cycles. It can be observed that for the pure
FC vehicle the average efficiency is lower but for the
power-demanding cycles because it
cannot follow an energy management strategy.
Furthermore, the hybrid FC vehicle has higher average
efficiency than the plug-in because its 30 kW FC
Average FC efficiency and specific consumption on NEDC cycle for the three concepts
FC average efficiency comparison
Avg. Fuel cell Eff. (%)
Comb. Electr. Cons. (Wh/km)
H2 consumption (Wh/km)
Equivalent H2 cons. (Wh/km)
egarding Hybridization Degree and Its
abovementioned. Thus, the equivalent H2
Due to the scalability of the project, these three
vehicles were designed to achieve high efficiency and
range in other drive cycles. Thus, more simulations
were performed with the weight and energy s
ection 3.4 for the WLTP,
d real record cycle defined in
ection 2.3. The detailed simulation results (power
distribution, cycle profile, discharge profile, etc.) are
represented in Fig. 19. The main results of these cycles
are compared in the next paragraphs for the three
the average efficiency of the FC
during the cycles. It can be observed that for the pure
FC vehicle the average efficiency is lower but for the
demanding cycles because it
cannot follow an energy management strategy.
brid FC vehicle has higher average
in because its 30 kW FC
Average FC efficiency and specific consumption on NEDC cycle for the three concepts.
FC average efficiency comparison.
Pu
re F
C
Hyb
rid
FC
44% 60%
Comb. Electr. Cons. (Wh/km) 148 105
334 181
334 185
consumption
Due to the scalability of the project, these three
vehicles were designed to achieve high efficiency and
range in other drive cycles. Thus, more simulations
were performed with the weight and energy storage
ection 3.4 for the WLTP,
d real record cycle defined in
ection 2.3. The detailed simulation results (power
distribution, cycle profile, discharge profile, etc.) are
represented in Fig. 19. The main results of these cycles
are compared in the next paragraphs for the three
the average efficiency of the FC
during the cycles. It can be observed that for the pure
FC vehicle the average efficiency is lower but for the
demanding cycles because it
cannot follow an energy management strategy.
brid FC vehicle has higher average
in because its 30 kW FC allows
Average FC efficiency and specific consumption
Hyb
rid
FC
Plu
g-i
n
hyb
rid
FC
60% 58%
105 110
181 120
185 193
consumption
Due to the scalability of the project, these three
vehicles were designed to achieve high efficiency and
range in other drive cycles. Thus, more simulations
torage
ection 3.4 for the WLTP,
d real record cycle defined in
ection 2.3. The detailed simulation results (power
distribution, cycle profile, discharge profile, etc.) are
represented in Fig. 19. The main results of these cycles
are compared in the next paragraphs for the three
the average efficiency of the FC
during the cycles. It can be observed that for the pure
FC vehicle the average efficiency is lower but for the
demanding cycles because it
cannot follow an energy management strategy.
brid FC vehicle has higher average
allows
Average FC efficiency and specific consumption

a greater part of the cycle to work at maximum
efficiency.
Fig. 20 shows the H
case with respect to the optimal case of having
regenerative brake and operation at the maximum
efficiency point of the FC. It is evidenced that the
hybrid concept operates very close to the optimal
situation as well as the p
undergoes an increase in consumption of up to 80%.
Fig. 21 shows the electric consumption calculated in
the motor, which is the result of the addition of the
energy supplied by the battery and the FC, and thus, the
average effi
figure. It can be observed that the pure FC consumption
is always higher due to the higher vehicle weight and
the absence of regeneration, and that the difference is
minimal for the steady 120 cycle that has few
decelerations. In the same way, it can be observed that
the plug-in vehicle always consumes more than the
hybrid vehicle because it is heavier.
Regarding vehicle range, Fig. 22
FC vehicle maintains a similar range level for all the
cycles because it has a big H
average efficiency for the other cycles. On the other
hand, the hybrid concept lowers the range for the more
demanding cycles (WLTP, US06 and steady 120)
because although it keeps working at maximum
efficiency th
hybrid presents a considerable full electric range for the
urban and extra
km for WLTP, and 124 km for real record),
overcoming the initial target of 80 km due to the big
traction battery necessary to complement the small 8
kW FC.
On the other hand, under this vehicle configuration,
the vehicle range at cycles US06 and steady 120 is
diminished due not to lack of battery capacity but to the
lack of FC power. In these cycles, there is r
in the tank when the vehicle is stopped that is not
supplied because FC power is too low to maintain a
constant SOC of the traction battery. This phenomenon
Evaluation of Fuel Cell Vehicle
a greater part of the cycle to work at maximum
shows the H2 consumption increase for each
case with respect to the optimal case of having
regenerative brake and operation at the maximum
efficiency point of the FC. It is evidenced that the
hybrid concept operates very close to the optimal
situation as well as the p
undergoes an increase in consumption of up to 80%.
shows the electric consumption calculated in
the motor, which is the result of the addition of the
energy supplied by the battery and the FC, and thus, the
average efficiency has no direct influence on this
figure. It can be observed that the pure FC consumption
is always higher due to the higher vehicle weight and
the absence of regeneration, and that the difference is
minimal for the steady 120 cycle that has few
erations. In the same way, it can be observed that
in vehicle always consumes more than the
hybrid vehicle because it is heavier.
Regarding vehicle range, Fig. 22
FC vehicle maintains a similar range level for all the
ecause it has a big H
average efficiency for the other cycles. On the other
hand, the hybrid concept lowers the range for the more
demanding cycles (WLTP, US06 and steady 120)
because although it keeps working at maximum
efficiency the power demand is higher. The plug
hybrid presents a considerable full electric range for the
urban and extra-urban cycles (119 km for NEDC, 102
km for WLTP, and 124 km for real record),
overcoming the initial target of 80 km due to the big
tery necessary to complement the small 8
On the other hand, under this vehicle configuration,
the vehicle range at cycles US06 and steady 120 is
diminished due not to lack of battery capacity but to the
lack of FC power. In these cycles, there is r
in the tank when the vehicle is stopped that is not
supplied because FC power is too low to maintain a
constant SOC of the traction battery. This phenomenon
valuation of Fuel Cell Vehicle Impact on Range, Weight and Energy Consumption
a greater part of the cycle to work at maximum
consumption increase for each
case with respect to the optimal case of having
regenerative brake and operation at the maximum
efficiency point of the FC. It is evidenced that the
hybrid concept operates very close to the optimal
situation as well as the plug-in one while the pure FC
undergoes an increase in consumption of up to 80%.
shows the electric consumption calculated in
the motor, which is the result of the addition of the
energy supplied by the battery and the FC, and thus, the
ciency has no direct influence on this
figure. It can be observed that the pure FC consumption
is always higher due to the higher vehicle weight and
the absence of regeneration, and that the difference is
minimal for the steady 120 cycle that has few
erations. In the same way, it can be observed that
in vehicle always consumes more than the
hybrid vehicle because it is heavier.
Regarding vehicle range, Fig. 22 shows that the pure
FC vehicle maintains a similar range level for all the
ecause it has a big H2 storage and a higher
average efficiency for the other cycles. On the other
hand, the hybrid concept lowers the range for the more
demanding cycles (WLTP, US06 and steady 120)
because although it keeps working at maximum
e power demand is higher. The plug
hybrid presents a considerable full electric range for the
urban cycles (119 km for NEDC, 102
km for WLTP, and 124 km for real record),
overcoming the initial target of 80 km due to the big
tery necessary to complement the small 8
On the other hand, under this vehicle configuration,
the vehicle range at cycles US06 and steady 120 is
diminished due not to lack of battery capacity but to the
lack of FC power. In these cycles, there is r
in the tank when the vehicle is stopped that is not
supplied because FC power is too low to maintain a
constant SOC of the traction battery. This phenomenon
valuation of Fuel Cell Vehicle Impact on Range, Weight and Energy Consumption
a greater part of the cycle to work at maximum
consumption increase for each
case with respect to the optimal case of having
regenerative brake and operation at the maximum
efficiency point of the FC. It is evidenced that the
hybrid concept operates very close to the optimal
in one while the pure FC
undergoes an increase in consumption of up to 80%.
shows the electric consumption calculated in
the motor, which is the result of the addition of the
energy supplied by the battery and the FC, and thus, the
ciency has no direct influence on this
figure. It can be observed that the pure FC consumption
is always higher due to the higher vehicle weight and
the absence of regeneration, and that the difference is
minimal for the steady 120 cycle that has few
erations. In the same way, it can be observed that
in vehicle always consumes more than the
shows that the pure
FC vehicle maintains a similar range level for all the
storage and a higher
average efficiency for the other cycles. On the other
hand, the hybrid concept lowers the range for the more
demanding cycles (WLTP, US06 and steady 120)
because although it keeps working at maximum
e power demand is higher. The plug
hybrid presents a considerable full electric range for the
urban cycles (119 km for NEDC, 102
km for WLTP, and 124 km for real record),
overcoming the initial target of 80 km due to the big
tery necessary to complement the small 8
On the other hand, under this vehicle configuration,
the vehicle range at cycles US06 and steady 120 is
diminished due not to lack of battery capacity but to the
lack of FC power. In these cycles, there is remaining H
in the tank when the vehicle is stopped that is not
supplied because FC power is too low to maintain a
constant SOC of the traction battery. This phenomenon
valuation of Fuel Cell Vehicle Regarding Hybridization Degree and Impact on Range, Weight and Energy Consumption
a greater part of the cycle to work at maximum
consumption increase for each
case with respect to the optimal case of having
regenerative brake and operation at the maximum
efficiency point of the FC. It is evidenced that the
hybrid concept operates very close to the optimal
in one while the pure FC
undergoes an increase in consumption of up to 80%.
shows the electric consumption calculated in
the motor, which is the result of the addition of the
energy supplied by the battery and the FC, and thus, the
ciency has no direct influence on this
figure. It can be observed that the pure FC consumption
is always higher due to the higher vehicle weight and
the absence of regeneration, and that the difference is
minimal for the steady 120 cycle that has few
erations. In the same way, it can be observed that
in vehicle always consumes more than the
shows that the pure
FC vehicle maintains a similar range level for all the
storage and a higher
average efficiency for the other cycles. On the other
hand, the hybrid concept lowers the range for the more
demanding cycles (WLTP, US06 and steady 120)
because although it keeps working at maximum
e power demand is higher. The plug-in
hybrid presents a considerable full electric range for the
urban cycles (119 km for NEDC, 102
km for WLTP, and 124 km for real record),
overcoming the initial target of 80 km due to the big
tery necessary to complement the small 8
On the other hand, under this vehicle configuration,
the vehicle range at cycles US06 and steady 120 is
diminished due not to lack of battery capacity but to the
emaining H2
in the tank when the vehicle is stopped that is not
supplied because FC power is too low to maintain a
constant SOC of the traction battery. This phenomenon
Fig.efficiency and regenerative brake
Fig.
Fig.
can be observed in Fig
the FC is undersized for the US06 and steady 120
cycles, a powerful FC of 15 kW for the plug
was also simulated by IDIADA in the PUMA Mind
project [2] and proved to overcome this limitation, but
egarding Hybridization Degree and Impact on Range, Weight and Energy Consumption
Fig. 20 H2 consumption increase compared to optimal FC efficiency and regenerative brake
Fig. 21 Equivalent electric consumption
Fig. 22 Total range comparison
can be observed in Fig
the FC is undersized for the US06 and steady 120
cycles, a powerful FC of 15 kW for the plug
was also simulated by IDIADA in the PUMA Mind
project [2] and proved to overcome this limitation, but
egarding Hybridization Degree and Impact on Range, Weight and Energy Consumption
consumption increase compared to optimal FC efficiency and regenerative brake
Equivalent electric consumption
Total range comparison
can be observed in Figs. A.6 and A.9 of Annex A. As
the FC is undersized for the US06 and steady 120
cycles, a powerful FC of 15 kW for the plug
was also simulated by IDIADA in the PUMA Mind
project [2] and proved to overcome this limitation, but
egarding Hybridization Degree and Its
consumption increase compared to optimal FC efficiency and regenerative brake.
Equivalent electric consumption.
Total range comparison.
. A.6 and A.9 of Annex A. As
the FC is undersized for the US06 and steady 120
cycles, a powerful FC of 15 kW for the plug
was also simulated by IDIADA in the PUMA Mind
project [2] and proved to overcome this limitation, but
47
consumption increase compared to optimal FC
. A.6 and A.9 of Annex A. As
the FC is undersized for the US06 and steady 120
cycles, a powerful FC of 15 kW for the plug-in vehicle
was also simulated by IDIADA in the PUMA Mind
project [2] and proved to overcome this limitation, but
47
consumption increase compared to optimal FC
. A.6 and A.9 of Annex A. As
the FC is undersized for the US06 and steady 120
in vehicle
was also simulated by IDIADA in the PUMA Mind
project [2] and proved to overcome this limitation, but

Evaluation of Fuel Cell Vehicle Regarding Hybridization Degree and Its Impact on Range, Weight and Energy Consumption
48
at the end the 8 kW option was selected as established
in the premises of the project.
5. Conclusions
Range anxiety is one of the most important
drawbacks when buying an alternative powertrain
electric vehicle. Therefore, in this study, a range of 500
km in the NEDC driving cycle was set as a target of
three fuel cell-powered vehicles to reduce any
inconvenience and deal with the introduction of new
alternative power sources such as FCs.
Three concept vehicles where developed through
simulation in vemSim software, namely a pure FC, a
hybrid FC and a plug-in hybrid FC. Depending on the
vehicle’s architecture, relevant information in terms of
energy consumption was obtained. The results of the
simulation showed that the addition of a traction
battery to hybridize the vehicle reduces the energy
consumption because it allows regeneration and the
implementation of energy management strategies to
operate the FC at its more efficient loads.
The energy management strategy developed for the
hybrid cases was implemented in Simulink within
vemSim environment and was optimized through an
iterative process. The strategies are described and their
benefits are demonstrated through higher average
operating efficiency of the FC for these two cases in
comparison to the pure FC vehicle.
Finally, the resulting vehicle concepts were
simulated in other driving situations with different
demand levels to evaluate the overall powertrain
behaviour. According to the initial premises that were
aimed at a C-segment vehicle, the results in terms of
vehicle capabilities were reached successfully.
References
[1] Tazelaar, E., and Veenhuizen, B. HAN University of
Applied Sciences, the Netherlands. Energy Management
for Fuel Cell Hybrid Vehicles; On Road Evaluation.
[2] Puma Mind. http://www.pumamind.eu.
[3] Feroli, D. 2009. “Control and Design of PEM Fuel
Cell-Based Systems.” Ph.D. thesis, Universitat Politècnica
de Catalunya.
[4] UN/ECE Regulation No. 1222/2009.
[5] Dávila, A., Romero, E., Roche, M., Mammetti, M.,
Gutierrez, J., and Lesemann, M. 2014. “The ELVA
Project’s EV Design Support Tool.” Presented at SAE
2014 World Congress and Exhibition, USA.
[6] UN/ECE, Regulation No. 101, CO2 Emission/Fuel
Consumption.
[7] UN/ECE, Informal document No.WLTP-01-03.
[8] 40 CFR 86.159-08, Exhaust Emission Test Procedures for
US06 Emissions.
[9] Roche, M., and Mammetti, M. 2015. “An Innovative
Vehicle Behaviour Modelling Methodology for
Model-Based Development.” Presented at SAE 2015
World Congress and Exhibition, USA.
[10] Wu, Q., Nielsen, A. H., Østergaard, J., Cha, S. T., Marra,
F., Chen, Y., and Træholt, C. 2010. “Driving Pattern
Analysis for Electric Vehicle (EV) Grid Integration Study.”
Presented at 2010 IEEE PES Innovative Smart Grid
Technologies Conference Europe (ISGT Europe),
Gothenberg, Sweden.
Annex A—Performances in Other Cycles A.1 WLTP
Fig. A.1 Vehicle power distribution histogram for WLTP: (a) cycle requirements; (b) pure FC vehicle; (c) hybrid FC vehicle; (d) plug-in hybrid FC vehicle.

Evaluation of Fuel Cell Vehicle Regarding Hybridization Degree and Its Impact on Range, Weight and Energy Consumption
49
Fig. A.2 Power distribution in one WLTP: (a) hybrid FC vehicle; (b) plug-in hybrid FC vehicle.
Fig. A.3 FC power and remaining H2 and SOC during a WLTP range simulation: (a) hybrid FC vehicle; (b) plug-in hybrid FC vehicle.
A.2 US06
Fig. A.4 Vehicle power distribution histogram for US06 cycle: (a) cycle requirements; (b) pure FC vehicle; (c) hybrid FC vehicle; (d) plug-in hybrid FC vehicle.
Fig. A.5 Power distribution in one US06: (a) hybrid FC vehicle; (b) plug-in hybrid FC vehicle.

Evaluation of Fuel Cell Vehicle Regarding Hybridization Degree and Its Impact on Range, Weight and Energy Consumption
50
Fig. A.6 FC power and remaining H2 and SOC during a US06 range simulation: (a) hybrid FC vehicle; (b) plug-in hybrid FC vehicle.
A.3 Steady 120
Fig. A.7 Vehicle power distribution histogram for steady 120 cycle: (a) cycle requirements; (b) pure FC vehicle; (c) hybrid FC vehicle; (d) plug-in hybrid FC vehicle.
Fig. A.8 Power distribution in steady 120: (a) hybrid FC vehicle; (b) plug-in hybrid FC vehicle.
Fig. A.9 FC power and remaining H2 and SOC during a steady 120 range simulation: (a) hybrid FC vehicle; (b) plug-in hybrid FC vehicle.

Evaluation of Fuel Cell Vehicle Regarding Hybridization Degree and Its Impact on Range, Weight and Energy Consumption
51
A.4 Real Record
Fig. A.10 Vehicle power distribution histogram for real record cycle: (a) cycle requirements; (b) pure FC vehicle; (c) hybrid FC vehicle; (d) plug-in hybrid FC vehicle.
Fig. A.11 Power distribution in real record: (a) hybrid FC vehicle; (b) plug-in hybrid FC vehicle.
Fig. A.12 FC power and remaining H2 and SOC during a real record range simulation: (a) hybrid FC vehicle; (b) plug-in hybrid FC vehicle.