mapping the ocean floor simulation - … · mapping the ocean floor simulation description of...
TRANSCRIPT
MAPPING THE OCEAN FLOOR SIMULATION
Description of activity: Students will be given cardboard panels with a hidden inner piece of cardboard that is cut in a shape that represent a piece of ocean floor, likely with some mountains and plateaus. Without seeing the ocean floor, they will have to map it. They will push wooden measuring rods down into their ocean panels, sensing when they hit bottom. They will then record the depths on their graph. When all the data points have been collected, they can connect the dots and hopefully have an accurate picture of what their ocean floor looks like. They may then open the panels to see if they are right.
Target age group: 10-14
Time needed to do the activity: 20-30 minutes
Prep time: About 15-20 minutes per “slice of ocean” panel once you have materials gathered
You will need (per slice): ● 3 pieces of 8.5” x 11” (22 cm x 28 cm) corrugated cardboard (They don’t have to be exactly this size, but all need to be the same size.) ● scissors and/or Xacto knife ● masking tape or duct tape ● 2 medium binder clips ● bamboo skewers (sold in grocery stores for making shish-kebabs) ● copies of the graphing page ● pencils
How to assemble the cardboard “slices of ocean”:
1) Two of the pieces of cardboard will remain as they are, 8.5 x 11. The third piece will be cut to make the section of ocean floor. Here are some ideas. The dotted portion is the top you will cut off. BUT DON’T DISCARD IT. You will off the top strip and use it in the interior (see pic below).
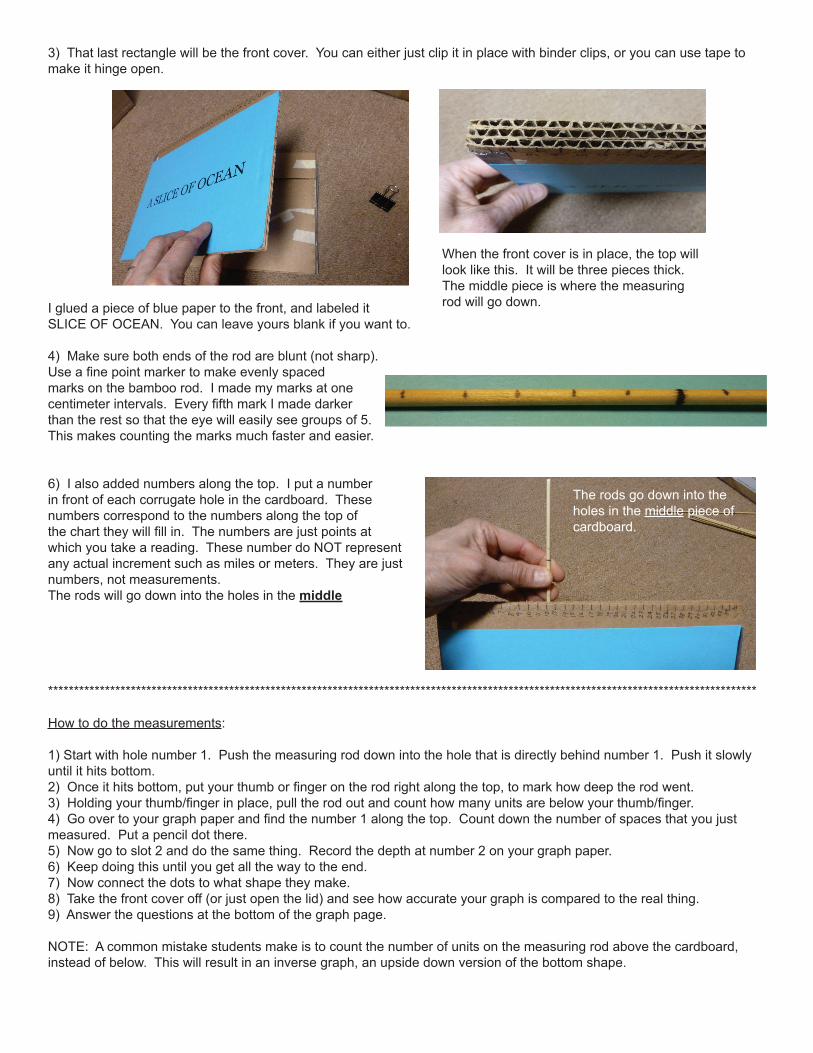
2) Put masking tape along the top edge of your contoured piece. The tape will prevent the measuring stick from going down in. Make sure there are not any holes in the tape where the measuringstick might get stuck.
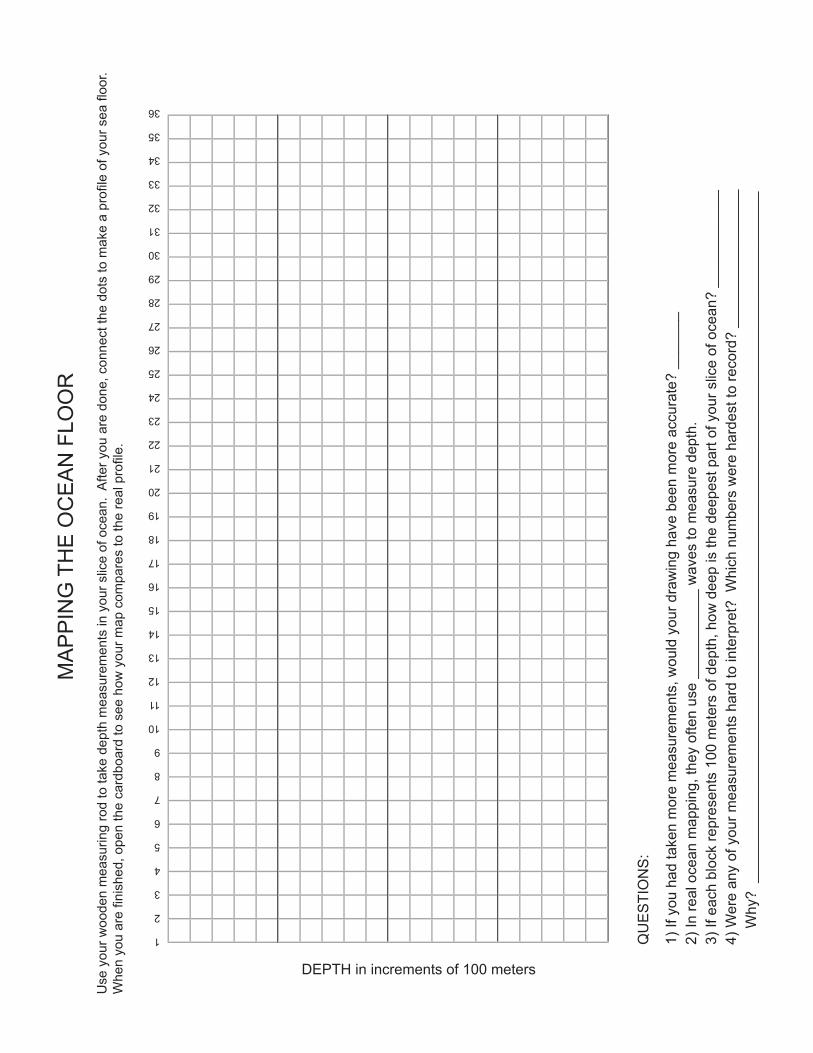
2) Now glue your contour piece to the bottom of one of the remaining rectangles. Cut a strip from that “discard” piece (the dotted area in the pictures above) and glue it to the top of that piece.
This picture shows how the measuring stick will go down through that top strip, and then hit the bottom down below.
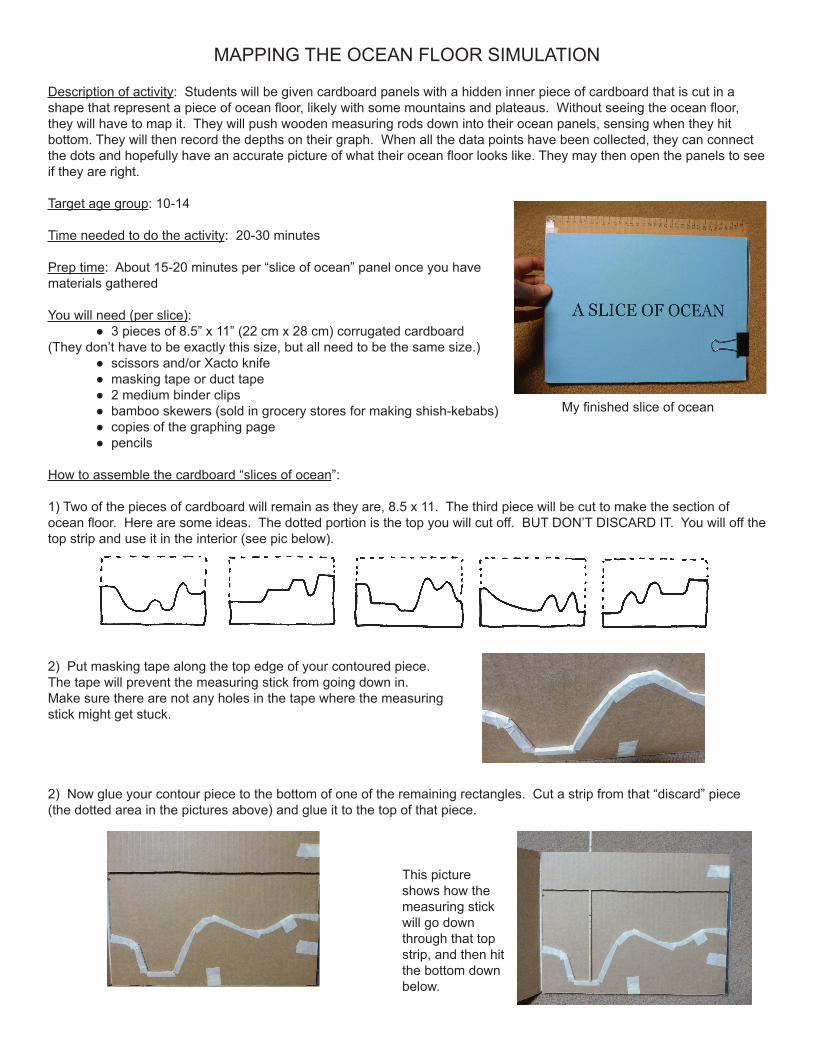
My finished slice of ocean
3) That last rectangle will be the front cover. You can either just clip it in place with binder clips, or you can use tape to make it hinge open.
I glued a piece of blue paper to the front, and labeled it SLICE OF OCEAN. You can leave yours blank if you want to.
4) Make sure both ends of the rod are blunt (not sharp).Use a fine point marker to make evenly spaced marks on the bamboo rod. I made my marks at onecentimeter intervals. Every fifth mark I made darkerthan the rest so that the eye will easily see groups of 5.This makes counting the marks much faster and easier.
6) I also added numbers along the top. I put a numberin front of each corrugate hole in the cardboard. These numbers correspond to the numbers along the top ofthe chart they will fill in. The numbers are just points at which you take a reading. These number do NOT representany actual increment such as miles or meters. They are just numbers, not measurements.The rods will go down into the holes in the middle
*****************************************************************************************************************************************
How to do the measurements:
1) Start with hole number 1. Push the measuring rod down into the hole that is directly behind number 1. Push it slowly until it hits bottom.2) Once it hits bottom, put your thumb or finger on the rod right along the top, to mark how deep the rod went. 3) Holding your thumb/finger in place, pull the rod out and count how many units are below your thumb/finger. 4) Go over to your graph paper and find the number 1 along the top. Count down the number of spaces that you just measured. Put a pencil dot there.5) Now go to slot 2 and do the same thing. Record the depth at number 2 on your graph paper.6) Keep doing this until you get all the way to the end.7) Now connect the dots to what shape they make.8) Take the front cover off (or just open the lid) and see how accurate your graph is compared to the real thing.9) Answer the questions at the bottom of the graph page.
NOTE: A common mistake students make is to count the number of units on the measuring rod above the cardboard, instead of below. This will result in an inverse graph, an upside down version of the bottom shape.
When the front cover is in place, the top will look like this. It will be three pieces thick. The middle piece is where the measuring rod will go down.
The rods go down into the holes in the middle piece of cardboard.
MA
PP
ING
TH
E O
CE
AN
FLO
OR
Use
you
r woo
den
mea
surin
g ro
d to
take
dep
th m
easu
rem
ents
in y
our s
lice
of o
cean
. A
fter y
ou a
re d
one,
con
nect
the
dots
to m
ake
a pr
ofi le
of y
our s
ea fl
oor.
Whe
n yo
u ar
e fi n
ishe
d, o
pen
the
card
boar
d to
see
how
you
r map
com
pare
s to
the
real
pro
fi le.
DEPTH in increments of 100 meters
1
2
3
4
5
6
7
8
9
10
11
12
13
14
15
16
17
18
19
20
21
22
23
24
25
26
27
28
29
30
31
32
33
34
35
36
QU
ES
TIO
NS
:
1) If
you
had
take
n m
ore
mea
sure
men
ts, w
ould
you
r dra
win
g ha
ve b
een
mor
e ac
cura
te?
____
___
2) In
real
oce
an m
appi
ng, t
hey
ofte
n us
e __
____
____
_ w
aves
to m
easu
re d
epth
.3)
If e
ach
bloc
k re
pres
ents
100
met
ers
of d
epth
, how
dee
p is
the
deep
est p
art o
f you
r slic
e of
oce
an?
____
____
____
4)
Wer
e an
y of
you
r mea
sure
men
ts h
ard
to in
terp
ret?
Whi
ch n
umbe
rs w
ere
hard
est t
o re
cord
? __
____
____
____
___
W
hy?
___
____
____
____
____
____
____
____
____
____
____
____
____
____
____
____
____
____
____
____
____
__