mapping qtls for witches’ broom (crinipellis perniciosa...
TRANSCRIPT

Euphytica (2006) 149: 227–235
DOI: 10.1007/s10681-005-9070-7 C© Springer 2006
Mapping QTLs for Witches’ Broom (Crinipellis perniciosa) Resistancein cacao (Theobroma cacao L.)
Fabio Gelape Faleiro1,2, Vagner Tibaldi Queiroz3, Uilson Vanderlei Lopes1,∗, Claudia TeixeiraGuimaraes3, Jose Luis Pires1, Milton Macoto Yamada1, Iona Santos Araujo4, Messias GonzagaPereira4, Raymond Schnell5, Goncalo Apolinario de Souza Filho4, Claudia Fortes Ferreira1,Everaldo Goncalves Barros3 & Maurılio Alves Moreira3
1Centro de Pesquisas do Cacau, CEPLAC, Itabuna, BA, Brazil; 2Currently Centro de Pesquisa Agropecuariados Cerrados, Embrapa, Planaltina, DF, Brazil; 3Instituto de Biotecnologia Aplicada a Agropecuaria, Universi-dade Federal de Vicosa, Vicosa, MG, Brazil; 4Departamento de Ciencias Agrarias, Universidade Estadual NorteFluminense, Campos, RJ; 5USDA/ARS, Miami, USA ∗(author for correspondence: e-mail: [email protected])
Received 8 April 2004; accepted 6 December 2005
Key words: molecular markers, linkage map, disease resistance
Summary
Molecular markers (RAPD, AFLP and microsatellites) were used to generate a linkage map and to identify QTLsassociated to witches’ broom (Crinipellis perniciosa) resistance in cacao (Theobroma cacao), using 82 individualsof an F2 population derived from the clones ICS-1 (susceptible) and Scavina-6 (resistant). Fifteen evaluations of thenumber of brooms have been carried out in six years (1997–2002). In order to increase the precision and accuracy inthe measures of resistance, each F2 plant was cloned in three replications in a randomized block design with single-tree plots and evaluated over 2 years. Three hundred and forty-two markers were obtained, being 33 microsatellites,77 AFLPs and 232 RAPDs. The distribution of the number of brooms in the F2 population was skewed to resistance,suggesting the involvement of major genes controlling resistance and the repeatability estimated for resistance was44%. A strong putative QTL was detected as being related to witches’ broom resistance. Associated to this QTL,the microsatellite mTcCIR35 explained 35.5% of the phenotypic variation in resistance. This marker is being usedfor marker-assisted selection in Scavina-6 progenies, including those selected in private plantations, as an auxiliarytool to the phenotypic selection.
Introduction
Cacao, Theobroma cacao L., is a perennial crop culti-vated mainly in holdings of small farms in the tropics,under native shade trees, and is the major ingredient inthe chocolate manufacture. Cacao cultivation in Brazilis of significant importance to the socio-economicstanding of more than 3 million people dependingdirectly or indirectly on this crop, generating an econ-omy of 1.5 billion US dollars per year (ABC et al.,2001).
Since its introduction in Bahia, in 1989 (Pereiraet al., 1989), witches’ broom disease (causal agent
Crinipellis perniciosa (Stahel) Singer) devastated thisregion economically, ecologically and socially. Losseswere as high as 100% and due to the continued pres-ence of the disease many farms were abandoned. Erad-ication was attempted but multi-foci and rapid spreadof witches’ broom deemed this measure ineffective.Within a disease management strategy many methodsof control were implemented, including fungicides, bi-ological agents (Trichoderma stromaticum), sanitationpruning and the use of resistant plants. Natural resis-tance has been preferred by most farmers because, com-pared to other methods, it does not involve recurrentuse of costly inputs. A similar story of ruined cocoa

228
industries was registered in all cacao producer coun-tries where witches’ broom was introduced, includingEcuador and Trinidad, then important world cocoaproducers.
The perennial nature of cacao and the time framein which accurate evaluation of resistance can beundertaken, limits the pace in which generation of newresistant varieties can be made accessible. Further,preventive breeding to benefit countries where the dis-ease does not occur is limited due to the difficulties intransferring germplasms and the absence of screeningmethods not involving germplasms transfer. Molecularmarker can be an important tool in overcoming theseproblems.
The construction of linkage maps allows the asso-ciation of markers to agronomically important traitsand then marker assisted selection (Tanksley et al.,1989) speeding up the process of breeding. In thespecific case of disease resistance, this would allowfor the pyramiding of different genes, even whenthe addition of new genes cannot be phenotypicallyperceived. The pyramiding of genes tends to in-crease the durability of resistance, essential in peren-nial crops like cacao, which can be commerciallyexploited for more than 30 years (sometimes 100years), subject to many cycles of disease infection andselection.
Many linkage maps have been developed for ca-cao aiming to associate molecular markers to agro-nomic traits (Lanaud et al., 1995, 1997; Crouzillat et al.,1996, 2000a, 2000b; Risterucci et al., 2000; Clementet al., 2001; Motilal et al., 2001; Queiroz et al., 2003).However, except that by Queiroz et al. (2003), none ofthem involved resistance to witches’ broom. Queirozet al. (2003), for the same population used in this pa-per, published a preliminary linkage map involving 193markers (124 RAPD and 69 AFLP) and only two yearsof disease data. They identified two marker loci as-sociated to the QTL of resistance to witches’ broom(AV14.940 and acgcat.78). These two marker loci ex-plained 34.7% and 25.5% of the variation in resistance,respectively. That population continued being pheno-typically and molecularly evaluated and the individu-als were cloned to get more accuracy in the phenotypicmeasurements.
This study aimed to add more markers to thepreliminary map published by Queiroz et al. (2003)and to map new (or to confirm old) QTLs forwitches’ broom in cacao, now using much betterphenotypic and molecular data than those previouslyused.
Materials and methods
Plant material
The mapping population consisted of 82 F2 cacaotrees, obtained by selfing the F1 clone TSH-516, orig-inated from the cross between the clones ICS-1 andScavina-6. ICS-1 was selected in Trinidad and belongsto the Trinitario group, has large seeds, red pods andsusceptibility to witches’ broom and other diseases.Scavina-6 was selected in Peru and belongs to theUpper-Amazon group, has small seeds, green podsand is the most widely used source of resistance towitches’ broom in the world. Because the F1 (TSH-516) is self-incompatible, before selfing it, its pollenwas mixed with Herrania spp pollen to overcome theself-incompatibility. The pollination was made protect-ing the female flowers 24 hours before the pollinationand unprotecting 24 hours after, in order to avoid pollencontamination. The F2 seedlings were transferred to thefield in 1992.
Evaluation for witches’ broom resistance
From 1998 to 2002, the number of vegetative brooms(NVV) was counted in the canopy of each of the F2
trees, summing 15 evaluations. After counting, thebrooms were removed avoiding repeated recording. Inorder to increase the precision and accuracy in the mea-sures of resistance, each F2 plant was cloned in threereplicates in a randomized block design with single-tree plots and evaluated over 2 years.
Besides the number of brooms, the trunk diameterat 50 cm height was also evaluated aiming to correctNVV by the number of potential infection points, whichis associated to the vigor of the tree. In many popu-lations we have observed that the number of broomsis positively correlated with the trunk diameter, evenwithin clones. In order to overcome the effect of thecanopy size (or potential number of infection points)on the number of brooms, this number was adjustedconsidering the slope of the regression of the numberof brooms on the trunk diameter as:
NVVC = NVV + b(DT − DT)
Where, NVVC is the number of vegetative broomscorrected by the diameter of the tree; NVV is theuncorrected number of brooms; b is the angularcoefficient of the regression of NVV on DT; DT isthe average diameter in the F2 and DT is the trunkdiameter of tree.

229
The repeatability was estimated aiming to evalu-ate the confidence on the phenotypic data, using theyearly average of brooms per tree after correction forthe diameter, as:
R = σ 2G/
(σ 2
G + σ 2w
)Where, R is the repeatability, σ 2
G is the variance compo-nent between F2 trees and σ 2
w is the variance componentamong measurements, within trees.
DNA extraction
Leaves of each F2 plant, the parents (ICS-1 andScavina-6) and the F1 (clone TSH-516) were col-lected and stored at −80◦C until the DNA extrac-tion. Genomic DNA was extracted using the CTABmethod (Doyle & Doyle, 1990) with some modifica-tions (Faleiro et al., 2002). After the extraction, theconcentration of DNA was estimated by spectropho-tometry at 260 nm (Sambrook et al., 1989). Bands oftotal genomic DNA separated by electrophoresis onagarose gel at 0.8% were used as an indication of theintegrity and purity of the DNA extracted. After quan-tification, those samples with good quality DNA werediluted for 10 ng/μL.
RAPD markers
Besides the 148 RAPD markers generated by Queirozet al. (2003), new RAPD markers were obtained usingamplification reactions in a total volume of 25 μl, hav-ing Tris-HCl 10 mM (pH 8.3), KCl 50 mM, MgCl22 mM, 100 μM of each of the dNTPs, 0.4 μM ofa primer (Operon Technologies Inc., Alameda, CA,EUA), one unit of Taq polymerase and approximately30 ng of DNA. The amplifications were made in a ther-mocycler programmed for 40 cycles, each with the fol-lowing sequence: 15 seconds at 94◦C, 30 seconds at35◦C and 90 seconds at 72◦C. After the 40 cycles, astage of extension for 7 minutes to 72◦C was doneand, finally, the temperature was reduced to 4◦C. Af-ter the amplification, 3 μl of a mixture of bromophenolblue (0.25%), glycerol (60%) and water (39.75%) wereadded to each sample. The samples were then appliedin agarose gel (1.2%), which was submerged in TBEbuffer (Tris-borate 90 mM, EDTA 1 mM). The elec-trophoresis lasted approximately four hours, at 90 volts.At the end of the running, the gels were stained withethidium bromide and photographed under ultravioletlight.
Microsatellite markers
Two methods were used to obtain microsatellite mark-ers. In method 1, used in CEPEC’s laboratory (Brazil),the fragments were separated in 3% agarose gel andwere stained with ethidium bromide. While in method2, used in USDA/Miami (USA), the fragments wereseparated in 6% polyacrylamide gel and the markerswere detected by fluorescence.Method 1: The amplification reaction was done in atotal volume of 15 μL, having Tris-HCl 10 mM (pH8.3), KCl 50 mM, MgCl2 2.4 mM, 150 μM of eachof the dNTPs, 3 pM of each of the forward and back-ward primers, one unit of Taq polymerase and, approx-imately, 30 ng of DNA.
The amplifications were done in a thermocyclerprogrammed with the following sequence: 4 minutesat 94◦C +10 cycles (30 seconds at 94◦C + 60 secondsat 60◦C −1◦C at each cycle +90 seconds at 72◦C)+30 cycles (30 seconds at 94◦C + 60 seconds at 48◦C+90 seconds at 72◦C) +6 minutes at 72◦C. After theamplification, the temperature of the samples wasreduced to 4◦C, and 3 μl of a mixture of bromophenolblue (0.25%), glycerol (60%) and water (39.75%)were added to each sample. The samples were thenapplied to a 3% agarose gel, submerged in TBE buffer(Tris-borate 90 mM, EDTA 1 mM). The electrophore-sis lasted approximately four hours, at 90 volts. At theend of the running, the gels were stained with ethidiumbromide and photographed under ultraviolet light.Standards were used to estimate the weight of themarkers.
Method 2: The amplification reactions were donein a final volume of 15 μL, using the same com-ponents, concentrations and amplification program asfor method 1. However, after the amplification, 2 μLof the reactions were used for the electrophoresisin 6% polyacrylamide gel, with the marker detec-tion based on primers marked with fluorescent dye.For the detection of the markers a DNA ABI 377automatic DNA sequencer was used with the soft-ware GeneScan. Using the GENESCAN 500 marker,the weight of each marker, in base pairs, was esti-mated.
AFLP markers
The same 77 markers generated by Queiroz et al. (2003)were used in this study. The methods used are detailedby those authors.

230
Linkage map
The linkage map was constructed with markers thatsegregated according to a monogenic inheritance in F2,i.e., 3:1 for dominant markers (RAPD and AFLP) and1:2:1 for codominant markers (microsatellites). Chi-square tests were used to confirm the monogenic inher-itance of the markers, considering a significance levelof 5%.
The recombination frequencies, the distance be-tween markers and the position of them in the linkagegroup were determined using Joinmap (Van Ooijen &Voorrips 2001). A LOD score of 4.0 and a maximumof 40% of recombination were used. The recombina-tion frequency was converted to distance by Kosambi’smapping function (Kosambi, 1944).
QTL identification and mapping
The identification of marker loci associated to QTLsof resistance to witches’ broom was based on an anal-ysis of variance for the effect of individual markers onthe number of brooms (NVVC). The proportion of thephenotypic variance explained by individual and setsof markers was estimated by simple and multiple re-gressions (stepwise, with p ≤ 0.01), using SAS andJump 3.1.6.2 (SAS Institute Inc., Cary, NC). This wasin part done to allow comparisons with previous studies(Queiroz et al., 2003).
The position of the QTLs in the linkage groupswas determined based on the map information, usingthe composite interval method (Jansen, 1993; Zeng,1993, 1994) via QTL Cartographer (Basten et al., 1994,1999). The threshold value for mapping the QTLs wasdetermined by the expression LOD = χ2(n)α/2 ln(10),with n = 2 degrees of freedom and α = 0.01, resultinga LOD = 2.0. Two markers were used as cofactors incomposite interval mapping.
Results and discussion
Witches’ broom resistance
Most F2 individuals presented less than onebroom/tree/evaluation (Figure 1), being similar in re-sistance to the resistant parent, Scavina-6. Only fourindividuals presented more than 10 brooms, as the sus-ceptible parent, ICS-1. This suggests dominance forresistance, as pointed by early studies using Scavina-6 as one of the parents (Bartley 1981). Scavina-6 and
0
10
20
30
40
1 2 3 4 5 6 7 8 9 10 11
NVVC
0
10
20
30
40
1 2 3 4 5 6 7 8 9 10 11
NVVC
seerT
fo
reb
mu
N
Figure 1. Number of F2 cacao plants in different classes of number
of vegetative brooms (NVVC). The class 11 represents more than 10
brooms per plant.
its sibling (Scavina-12) are widely used as a source ofresistance to witches’ broom in several countries in-cluding Trinidad, Ecuador (Bartley 1983) and Brazil.
The repeatability for the number of brooms per treeper year, after correction for the trunk diameter, was44%; which is quite high considering the variations inclimate in the experimental period (1998–2002).
Linkage map
Three hundred and forty-two markers were used toconstruct the linkage map, being 33 microsatellites, 77AFLPs and 232 RAPDs. Among these, 196 were pub-lished by Queiroz et al. (2003). Approximately 13% ofthe markers deviated from the expected monogenic seg-regation, by the χ2 test (P < 0.05). Similar frequencyof markers deviating from Mendelian ratios has beenreported in other similar studies (Crouzillat et al., 1996;Risterucci et al., 2000, 2003; Queiroz et al., 2003).
Two hundred and forty-two, out of the 342 markersobtained, were mapped in 16 linkage groups accumu-lating 670 cM (Figure 2), using LOD = 4.0, r = 0.40and Kosambi’s function. Among the 242 markers, 24are microsatellites, 70 are AFLP and 148 are RAPD.Using the same mapping criteria, Queiroz et al. (2003)mapped 193 markers in 25 groups covering 1713 cM.The addition of 149 more markers in this study reducedthe number of linkage groups from 25 to 16 and, thus,the map size to 670 cM.
The difference between the number of linkagegroups found here (16 groups) and the haploid num-ber of chromosomes of Theobroma cacao (n = 10) canbe due to the nonsaturation of the map yet. However,around 92% of the markers are in the 10 main linkage

231
sac tcat .2 020
sZ1 .2 0 704
sa ccct g .8 01 0s acaca c. 781 3
s aac ca g.1 062 6
s acgca g .1380
iaa cc at .1 304
saa cc at .1 2 91 0
i acg ca g.1 331 6
m TcCIR 12 4
i O 03 9 0 00
i Q 01 3 5 02 1
iA C01 .69 50
iac ac ta .2 831 3
ia acca g.1 0 80
iAR0 4 .7 1013
sAE 06. 17 10 sAE 06 .21 4 0sAE 06. 14 30
0sac tcat .2 020
sZ1 .2 0 704
sa ccct g .8 01 0s acaca c. 781 3
s aac ca g.1 062 6
s acgca g .1380
iaa cc at .1 304
saa cc at .1 2 91 0
i acg ca g.1 331 6
m TcCIR 12 4
i O 03 9 0 00
i Q 01 3 5 02 1
iA C01 .69 50
iac ac ta .2 831 3
ia acca g.1 0 80
iAR0 4 .7 1013
sAE 06. 17 10 sAE 06 .21 4 0sAE 06. 14 30
0
iA H05 .9 8 00iM0 93 7 03sacac tc. 975saac ca g. 8 912sA V1 6.6 1 015iA U05 .11 7016sT 09 .15 3018iA N16 .11 70 iagcc at .8 219sZ 15 .13 6520mTc CIR4 023mTc CIR2 124iH 03.1 2 7026iAB 12 . 107 527iI18 .8 3028sAV 2 0. 14 0 029ia ca ct g .113 iI1 6 .9 1030iA V2 0 .8 5531iAF15 .9 0033sI0 6 129 0 i AL0 9. 13 4 035iZ1 9.11 4038sAB 1 2. 17 5 039ia ctc ac .42 641iAZ14 .6 00 sa cac ac .2 3 443sA B1 2.9 9 047iAE 07 . 214 054
sA V1 8.5 900sa ca ca c .3 072sZ4 .50 03sX 18 .1 5 4 56ia ctc ac .1 679
sA V1 4.9 4015iAZ12 .84 517sacgca t .7 818
mTcCIR 3 523
mTcCIR 3 028
mTcCIR 2 431
iA L04 .10 4038saggc at .1 0839
sA R15.1 38 043
sH0 88 6 00
iO 03 3 7 09sL10 5 9 01 0
iP 175 7 02 0s M 02 9052 1
sC1 31 2 302 6
iO 18 4 5 52 9
sK 03 8 753 3iP 173 4 03 5sN0 71 2 003 8
iO 18 7 2 54 2
m TcCIR 370
m TcCIR 611 1
iA V14 .71 0 sT02 .5001 7
iAL 0 4.6 202 0sJ1 3.8 602 3iAB 12. 14 352 5
iAU1 7 .5053 0
s AU 1 5. 15 4 04 2
sT01 9 200
sac cc ta .2 8 78
sJ 1 3.1 4 9 0 sT1 .90014ia ctca t. 6515sA X0 7 .8 2016sAB 0 4 .1 3 0518sA F0 6 .5 8521m TcCI R 2622iAL 09.1 2 1028ia g gc aa. 8629
sK0 8 .70 033
sZ15 .11 4 037sa gc ca t. 9039
sAU17 .9600
sAE 1 8.10 958
sT 12 .1 3 2 015
sY 20 .52 025
sa cac ac .31129ia ggc ac.14 932
saa g ctc .1 3 736ia ggcag .2 6338sag cc at .15 141i I18 .9 4043
iAH 14 .9 2548m TcCI R 3252iI17 .105 053m TcCI R 4356m TcCI R 1258sac ac tg.17 660
sZ 11 .7 4065
i AW 02 .72 069sAR 17.20 4073iP 0 811 0075sAF 0 8.8 6076
sAV 1 0.14 6583ia gcca g.17 785
s AE 0 6.5 850saa gct c. 8 65sAD 17.11 201 0saa gctc.26 41 4m TcC IR62 0i T02 .2 2 0 0 s AR1 0 .76 02 2sA V11 .114 0 iA L04 .123 02 3i D08 4 9 02 4sag cc at .21 02 8iJ18 .44 02 9iR 05 .9 603 0sAN 16.1 4 10 sAN 16 .1 10 03 1s AA 1 1.8 803 2i ag cc at .16 33 3ia acca g.2 883 4iAU15 .47 53 6sZ1 9 .64 0 iBG 04 .1 08 03 7iT08 .5 70 ia agc tc .3 953 9i actca t .1 53 sA F 16 .23 154 1i aa g ctc .2 6 64 3iA S19 .97 04 7iZ06 .4 704 8s acaca c. 834 9m TcCI R 1 05 0sX18 .14 305 2iAH18 .8 5 0 iT 12 .2 605 4m TcCI R 2 55 6iB B12 .11 005 7iAH15 .38 0 iAE 06 .9 506 1m TcCI R 4 26 4ia cac ac .26 1 m TcCI R 626 6iBG09 .58 06 8ia acca g.1 267 1ia agc ac .2 56 iAD 19 .96 57 5iAC01 .47 57 8ia ag ct c. 658 0
sAU 15 .78 50sAB 12 .3 504sAH 01 .96 08sAB 01 .5 851 1sS 1 0 .920 ia ggc ac .1 2 11 7iAV 19 .7 201 8sAV 11 .8 402 0sA I0 9.6 502 2sacacac.27 92 6iacaca c. 932 7sac tc ac .1 502 9sAH 09 .21 003 2mTcCI R6 03 3sAB 01 .9 503 5iT1 .1 0 2 03 6sactc at .1 33 ia ctc ac .14 93 7iA X0 7.4 8 0 sa a cca g.1223 8sY 18 .8004 0iA E12 .117 04 1iac tc ac .2 194 2sAH 18 .1 2 30 m Tc CI R 1 94 3iA X07 .10 204 5iF0 91 13 04 9sAR 16 .71 55 6
sG 067 006 6
iaccc ta .22 10
iA F 05 .1 4 05 iAH 09 .1 5 0 06iK 18 5 8 011iY 20 .97 017m TcCI R 2918iA L01 .1 0 9 0 sa gcc at .13 120i I04 .87 022sA B11 .77 523ia ag cac.24824ia gccat .8 526sacgca g.7 1027iA L02 .110 029iAR 1 7.3 9030sZ4 .13 5531iAV 18 .47 033sac tcat .8 035ia cac ac .28137iag cc at .10541sAL0 4.4 1042iacac ta.1 9843iY 18 .11 5047iJ18 .5 4053sA V18 .98 056
m TcCI R 2266
sa ctc a t.1 060
sJ 0 95 206
sZ 03.2 10 010
sa ctc tc .2 7816sa ctc a t.2 1620sa acc at .1 7 721sa ctc a t.3 1326sX 18. 109 027sA L04 .24 5 028sA U0 5 .9 8029sa ctc a t.3 55 ia cgc at .1 0 230sA I1 2 .7 9 032iacaca c .1 4533sZ0 6.4 7034iX0 5 .5 0536m TcCIR 5539sa cac ac .1 1341m TcCIR 5643m TcCIR 4647iY2 0 .8 0 051sZ 10.1 59 057
sAU1 7 .9600
sAE 1 8.10 958
sT 12 .1 3 2 015
sY 2 0 .5 2 025
sa cac ac .31129ia ggc ac.1 4 932
saa g ctc .1 3 736ia ggcag .2 6338sag cc at .1 5 141i I1 8 .9 4043
iAH 1 4 .9 2548m TcCI R 3252iI17 .10 5 053m TcCI R 4356m TcCI R 1258sac ac tg.1 7 660
sZ 11 .7 4065
i AW 02 .72 069sAR 17.2 0 4073iP 0 811 0075sAF 0 8.8 6076
sAV 1 0.14 6583ia gcca g.1 7 785
s AE 0 6.5 850saa gct c. 8 65sAD 17.11 201 0saa gctc.2 6 41 4m TcC IR62 0i T02 .2 2 0 0 s AR1 0 .7 6 02 2sA V11 .11 4 0 iA L04 .12 3 02 3i D08 4 9 02 4sag cc at .2 1 02 8iJ1 8 .4 4 02 9iR 05 .9 603 0sAN 16.1 4 10 sAN 16 .1 10 03 1s AA 1 1.8 803 2i ag cc at .1 6 33 3ia acca g.2 883 4iAU1 5 .4 7 53 6sZ1 9 .64 0 iBG 04 .1 08 03 7iT0 8 .5 70 ia agc tc .3 953 9i actca t .1 53 sA F 16 .2 3 154 1i aa g ctc .2 6 64 3iA S19 .97 04 7iZ0 6 .4 704 8s acaca c. 834 9m TcCI R 1 05 0sX18 .14 305 2iAH1 8 .8 5 0 iT 1 2 .2 605 4m TcCI R 2 55 6iB B12 .11 005 7iAH1 5 .3 8 0 iAE 06 .9 506 1m TcCI R 4 26 4ia cac ac .2 6 1 m TcCI R 626 6iBG0 9 .5 8 06 8ia acca g.1 267 1ia agc ac .2 56 iAD 19 .9 6 57 5iAC0 1 .4 7 57 8ia ag ct c. 658 0
sAU 15 .7 8 50sAB 1 2 .3 504sAH 01 .9 6 08sAB 0 1 .5 851 1sS 1 0 .920 ia ggc ac .1 2 11 7iAV 1 9 .7 201 8sAV 11 .8 402 0sA I0 9.6 502 2sacacac.2 7 92 6iaca ca c. 932 7sac tc ac .1 502 9sAH 09 .2 1 003 2mTcCI R6 03 3sAB 0 1 .9 503 5iT1 .1 0 2 03 6sactc at .1 33 ia ctc ac .1 4 93 7iA X0 7.4 8 0 sa a cca g.1 223 8sY 1 8 .8004 0iA E12 .11 7 04 1iac tc ac .2 194 2sAH 18 .1 2 30 m Tc CI R 1 94 3iA X0 7 .10 204 5iF0 91 13 04 9sAR 16 .7 1 55 6
sG 067 006 6
iaccc ta .2 2 10
iA F 05 .1 4 05 iAH 09 .1 5 0 06iK 18 5 8 01 1iY 2 0 .97 01 7m TcCI R 291 8iA L01 .1 0 9 0 sa gcc at .1 3 12 0i I0 4 .8 7 02 2sA B11 .77 52 3ia ag ca c.2 482 4ia gccat .8 52 6sa cgca g.7 102 7iA L02 .11 0 02 9iAR 1 7.3 903 0sZ4 .1 3 553 1iAV 1 8 .4 7 03 3sac tcat .8 03 5ia cac ac .2 813 7iag cc at .1 054 1sAL0 4.4 104 2iaca c ta.1 984 3iY 1 8 .11 504 7iJ1 8 .5 405 3sA V18 .98 05 6
m TcCI R 226 6
sa ctc a t.1 060
sJ 0 95 206
sZ 03.2 10 010
sa ctc tc .2 7816sa ctc a t.2 1620sa acc at .1 7 721sa ctc a t.3 1326sX 18. 109 027sA L04 .24 5 028sA U0 5 .9 8029sa ctc a t.3 55 ia cgc at .1 0 230sA I1 2 .7 9 032iacaca c .1 4533sZ0 6.4 7034iX0 5 .5 0536m TcCIR 5539sa cac ac .1 1341m TcCIR 5643m TcCIR 4647iY2 0 .8 0 051sZ 10.1 59 057
F
ED
C8b B
8a 10A9
3
7
12
54 /6
Figure 2. Linkage map of cacao (Theobroma cacao L.) based on segregation analysis of 342 markers, with LOD score 4.0 and maximum
frequency of recombination 40%. The linkage groups were sorted by size and numbered according to the reference map by Risterucci et al.
(2000) and Pugh et al. (2004). Capital letters (A-F) were used to identify groups with no match in the reference map.
groups. This was 63% in the preliminary map publishedby Queiroz et al. (2003).
The size of the map in Figure 2 is close to the size ofother cacao maps published. Lanaud et al. (1995), us-ing an F1 of UPA 402 × UF 676, developed a map with
10 linkage groups and 193 loci, covering 759 cM. Aftersaturation of this map by Risterucci et al. (2000), 885.4cM were covered. Crouzillat et al. (2000a,b), using an-other F1 progeny, Catongo × Pound 12, generated amap with 162 markers, covering 772 cM.
232
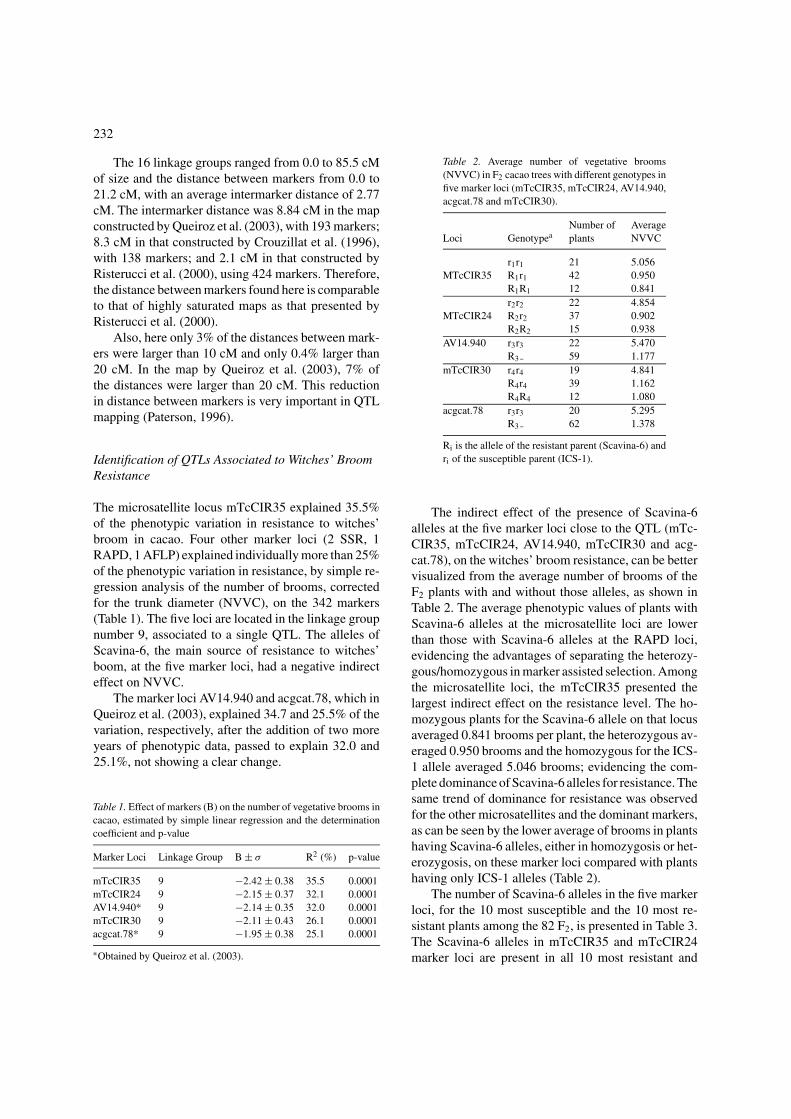
The 16 linkage groups ranged from 0.0 to 85.5 cMof size and the distance between markers from 0.0 to21.2 cM, with an average intermarker distance of 2.77cM. The intermarker distance was 8.84 cM in the mapconstructed by Queiroz et al. (2003), with 193 markers;8.3 cM in that constructed by Crouzillat et al. (1996),with 138 markers; and 2.1 cM in that constructed byRisterucci et al. (2000), using 424 markers. Therefore,the distance between markers found here is comparableto that of highly saturated maps as that presented byRisterucci et al. (2000).
Also, here only 3% of the distances between mark-ers were larger than 10 cM and only 0.4% larger than20 cM. In the map by Queiroz et al. (2003), 7% ofthe distances were larger than 20 cM. This reductionin distance between markers is very important in QTLmapping (Paterson, 1996).
Identification of QTLs Associated to Witches’ BroomResistance
The microsatellite locus mTcCIR35 explained 35.5%of the phenotypic variation in resistance to witches’broom in cacao. Four other marker loci (2 SSR, 1RAPD, 1 AFLP) explained individually more than 25%of the phenotypic variation in resistance, by simple re-gression analysis of the number of brooms, correctedfor the trunk diameter (NVVC), on the 342 markers(Table 1). The five loci are located in the linkage groupnumber 9, associated to a single QTL. The alleles ofScavina-6, the main source of resistance to witches’boom, at the five marker loci, had a negative indirecteffect on NVVC.
The marker loci AV14.940 and acgcat.78, which inQueiroz et al. (2003), explained 34.7 and 25.5% of thevariation, respectively, after the addition of two moreyears of phenotypic data, passed to explain 32.0 and25.1%, not showing a clear change.
Table 1. Effect of markers (B) on the number of vegetative brooms in
cacao, estimated by simple linear regression and the determination
coefficient and p-value
Marker Loci Linkage Group B ± σ R2 (%) p-value
mTcCIR35 9 −2.42 ± 0.38 35.5 0.0001
mTcCIR24 9 −2.15 ± 0.37 32.1 0.0001
AV14.940* 9 −2.14 ± 0.35 32.0 0.0001
mTcCIR30 9 −2.11 ± 0.43 26.1 0.0001
acgcat.78* 9 −1.95 ± 0.38 25.1 0.0001
∗Obtained by Queiroz et al. (2003).
Table 2. Average number of vegetative brooms
(NVVC) in F2 cacao trees with different genotypes in
five marker loci (mTcCIR35, mTcCIR24, AV14.940,
acgcat.78 and mTcCIR30).
Number of Average
Loci Genotypea plants NVVC
r1r1 21 5.056
MTcCIR35 R1r1 42 0.950
R1R1 12 0.841
r2r2 22 4.854
MTcCIR24 R2r2 37 0.902
R2R2 15 0.938
AV14.940 r3r3 22 5.470
R3 59 1.177
mTcCIR30 r4r4 19 4.841
R4r4 39 1.162
R4R4 12 1.080
acgcat.78 r3r3 20 5.295
R3 62 1.378
Ri is the allele of the resistant parent (Scavina-6) and
ri of the susceptible parent (ICS-1).
The indirect effect of the presence of Scavina-6alleles at the five marker loci close to the QTL (mTc-CIR35, mTcCIR24, AV14.940, mTcCIR30 and acg-cat.78), on the witches’ broom resistance, can be bettervisualized from the average number of brooms of theF2 plants with and without those alleles, as shown inTable 2. The average phenotypic values of plants withScavina-6 alleles at the microsatellite loci are lowerthan those with Scavina-6 alleles at the RAPD loci,evidencing the advantages of separating the heterozy-gous/homozygous in marker assisted selection. Amongthe microsatellite loci, the mTcCIR35 presented thelargest indirect effect on the resistance level. The ho-mozygous plants for the Scavina-6 allele on that locusaveraged 0.841 brooms per plant, the heterozygous av-eraged 0.950 brooms and the homozygous for the ICS-1 allele averaged 5.046 brooms; evidencing the com-plete dominance of Scavina-6 alleles for resistance. Thesame trend of dominance for resistance was observedfor the other microsatellites and the dominant markers,as can be seen by the lower average of brooms in plantshaving Scavina-6 alleles, either in homozygosis or het-erozygosis, on these marker loci compared with plantshaving only ICS-1 alleles (Table 2).
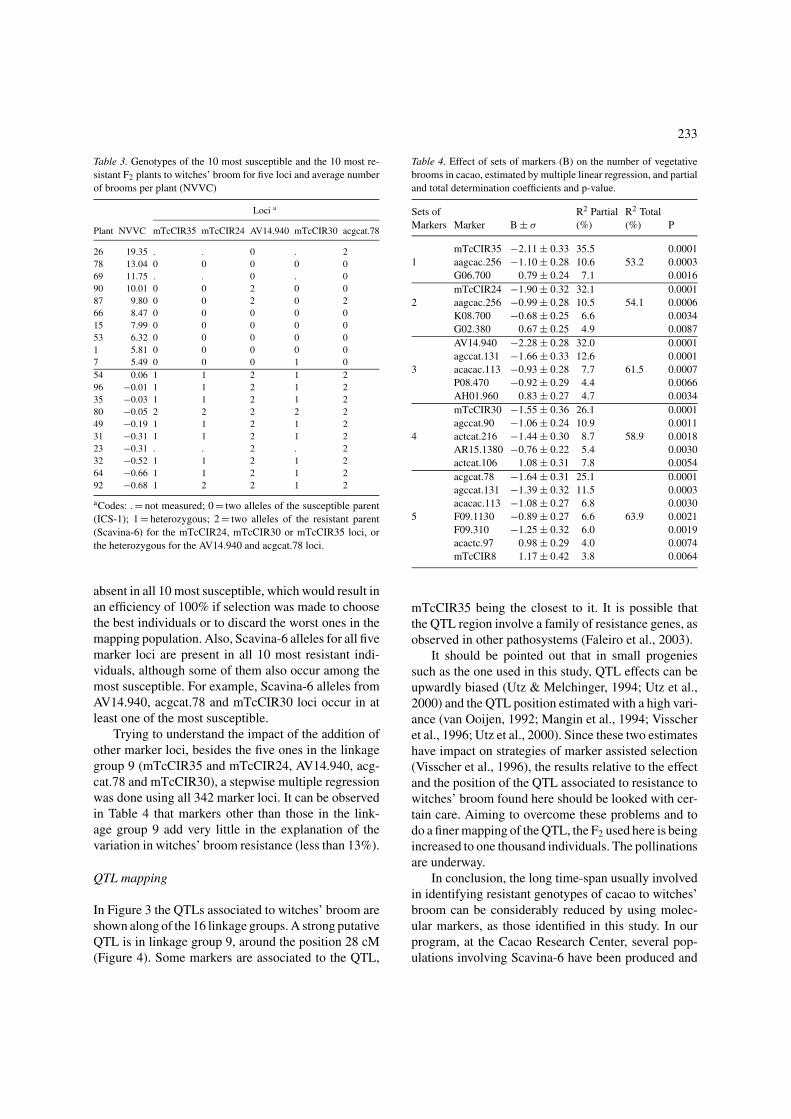
The number of Scavina-6 alleles in the five markerloci, for the 10 most susceptible and the 10 most re-sistant plants among the 82 F2, is presented in Table 3.The Scavina-6 alleles in mTcCIR35 and mTcCIR24marker loci are present in all 10 most resistant and
233
Table 3. Genotypes of the 10 most susceptible and the 10 most re-
sistant F2 plants to witches’ broom for five loci and average number
of brooms per plant (NVVC)
Loci a
Plant NVVC mTcCIR35 mTcCIR24 AV14.940 mTcCIR30 acgcat.78
26 19.35 . . 0 . 2
78 13.04 0 0 0 0 0
69 11.75 . . 0 . 0
90 10.01 0 0 2 0 0
87 9.80 0 0 2 0 2
66 8.47 0 0 0 0 0
15 7.99 0 0 0 0 0
53 6.32 0 0 0 0 0
1 5.81 0 0 0 0 0
7 5.49 0 0 0 1 0
54 0.06 1 1 2 1 2
96 −0.01 1 1 2 1 2
35 −0.03 1 1 2 1 2
80 −0.05 2 2 2 2 2
49 −0.19 1 1 2 1 2
31 −0.31 1 1 2 1 2
23 −0.31 . . 2 . 2
32 −0.52 1 1 2 1 2
64 −0.66 1 1 2 1 2
92 −0.68 1 2 2 1 2
aCodes: . = not measured; 0 = two alleles of the susceptible parent
(ICS-1); 1 = heterozygous; 2 = two alleles of the resistant parent
(Scavina-6) for the mTcCIR24, mTcCIR30 or mTcCIR35 loci, or
the heterozygous for the AV14.940 and acgcat.78 loci.
absent in all 10 most susceptible, which would result inan efficiency of 100% if selection was made to choosethe best individuals or to discard the worst ones in themapping population. Also, Scavina-6 alleles for all fivemarker loci are present in all 10 most resistant indi-viduals, although some of them also occur among themost susceptible. For example, Scavina-6 alleles fromAV14.940, acgcat.78 and mTcCIR30 loci occur in atleast one of the most susceptible.
Trying to understand the impact of the addition ofother marker loci, besides the five ones in the linkagegroup 9 (mTcCIR35 and mTcCIR24, AV14.940, acg-cat.78 and mTcCIR30), a stepwise multiple regressionwas done using all 342 marker loci. It can be observedin Table 4 that markers other than those in the link-age group 9 add very little in the explanation of thevariation in witches’ broom resistance (less than 13%).
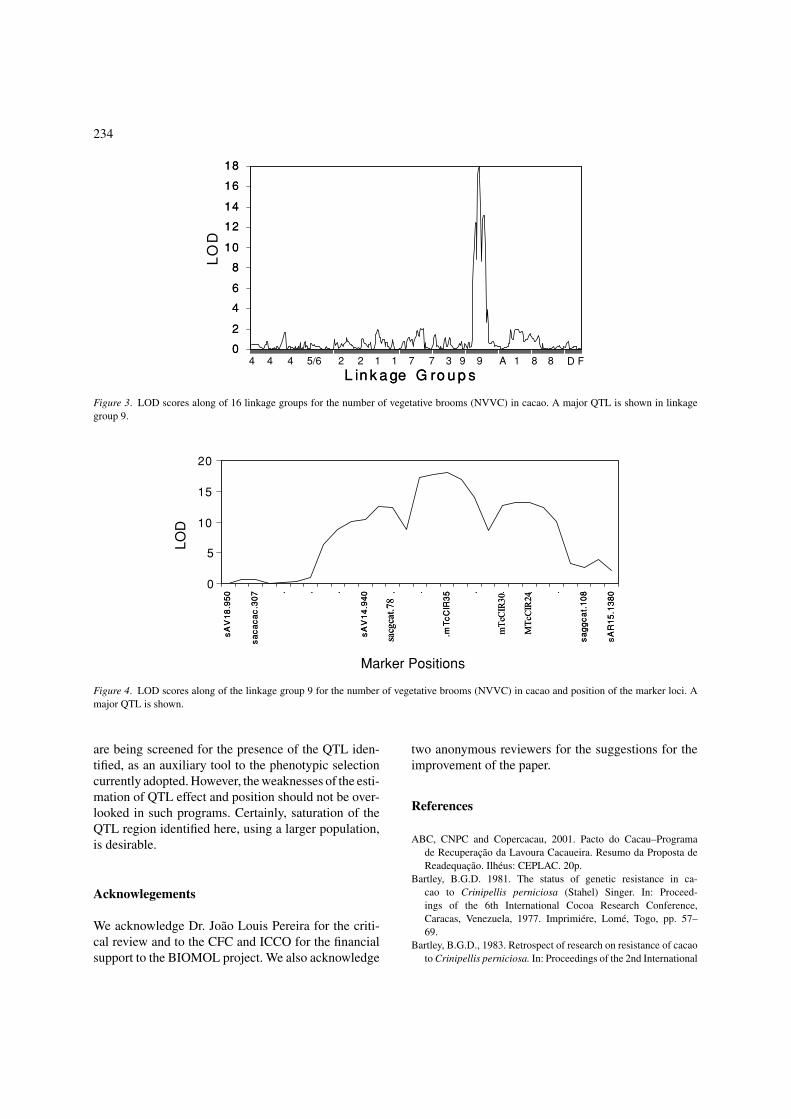
QTL mapping
In Figure 3 the QTLs associated to witches’ broom areshown along of the 16 linkage groups. A strong putativeQTL is in linkage group 9, around the position 28 cM(Figure 4). Some markers are associated to the QTL,
Table 4. Effect of sets of markers (B) on the number of vegetative
brooms in cacao, estimated by multiple linear regression, and partial
and total determination coefficients and p-value.
Sets of R2 Partial R2 Total
Markers Marker B ± σ (%) (%) P
mTcCIR35 −2.11 ± 0.33 35.5 0.0001
1 aagcac.256 −1.10 ± 0.28 10.6 53.2 0.0003
G06.700 0.79 ± 0.24 7.1 0.0016
mTcCIR24 −1.90 ± 0.32 32.1 0.0001
2 aagcac.256 −0.99 ± 0.28 10.5 54.1 0.0006
K08.700 −0.68 ± 0.25 6.6 0.0034
G02.380 0.67 ± 0.25 4.9 0.0087
AV14.940 −2.28 ± 0.28 32.0 0.0001
agccat.131 −1.66 ± 0.33 12.6 0.0001
3 acacac.113 −0.93 ± 0.28 7.7 61.5 0.0007
P08.470 −0.92 ± 0.29 4.4 0.0066
AH01.960 0.83 ± 0.27 4.7 0.0034
mTcCIR30 −1.55 ± 0.36 26.1 0.0001
agccat.90 −1.06 ± 0.24 10.9 0.0011
4 actcat.216 −1.44 ± 0.30 8.7 58.9 0.0018
AR15.1380 −0.76 ± 0.22 5.4 0.0030
actcat.106 1.08 ± 0.31 7.8 0.0054
acgcat.78 −1.64 ± 0.31 25.1 0.0001
agccat.131 −1.39 ± 0.32 11.5 0.0003
acacac.113 −1.08 ± 0.27 6.8 0.0030
5 F09.1130 −0.89 ± 0.27 6.6 63.9 0.0021
F09.310 −1.25 ± 0.32 6.0 0.0019
acactc.97 0.98 ± 0.29 4.0 0.0074
mTcCIR8 1.17 ± 0.42 3.8 0.0064
mTcCIR35 being the closest to it. It is possible thatthe QTL region involve a family of resistance genes, asobserved in other pathosystems (Faleiro et al., 2003).
It should be pointed out that in small progeniessuch as the one used in this study, QTL effects can beupwardly biased (Utz & Melchinger, 1994; Utz et al.,2000) and the QTL position estimated with a high vari-ance (van Ooijen, 1992; Mangin et al., 1994; Visscheret al., 1996; Utz et al., 2000). Since these two estimateshave impact on strategies of marker assisted selection(Visscher et al., 1996), the results relative to the effectand the position of the QTL associated to resistance towitches’ broom found here should be looked with cer-tain care. Aiming to overcome these problems and todo a finer mapping of the QTL, the F2 used here is beingincreased to one thousand individuals. The pollinationsare underway.
In conclusion, the long time-span usually involvedin identifying resistant genotypes of cacao to witches’broom can be considerably reduced by using molec-ular markers, as those identified in this study. In ourprogram, at the Cacao Research Center, several pop-ulations involving Scavina-6 have been produced and
234
0
2
4
6
8
10
12
14
16
18
L in k a ge G ro u p s
0
2
4
6
8
10
12
14
16
18
L in k a ge G ro u p s
DO
L
4 4 4 5/6 2 2 1 1 7 7 3 9 9 A 1 8 8 D F
Figure 3. LOD scores along of 16 linkage groups for the number of vegetative brooms (NVVC) in cacao. A major QTL is shown in linkage
group 9.
0
5
10
15
05
9.8
1V
As
70
3.c
ac
ac
as
. . . 04
9.4
1V
As
. . 53
R IC
cT
m.
. . . . 80
1. ta
cg
ga
s
08
31 .
51
RA
s
8
7.tacgcas
0
3R I
C cT
m
42
RICc
TM
20
05
9.8
1V
As
70
3.c
ac
ac
as
. . . 04
9.4
1V
As
. . 53
R IC
cT
m.
. . . . 80
1. ta
cg
ga
s
08
31 .
51
RA
s
8
7.tacgcas
0
3R I
C cT
m
42
RICc
TM
Marker Positions
LO
D
Figure 4. LOD scores along of the linkage group 9 for the number of vegetative brooms (NVVC) in cacao and position of the marker loci. A
major QTL is shown.
are being screened for the presence of the QTL iden-tified, as an auxiliary tool to the phenotypic selectioncurrently adopted. However, the weaknesses of the esti-mation of QTL effect and position should not be over-looked in such programs. Certainly, saturation of theQTL region identified here, using a larger population,is desirable.
Acknowlegements
We acknowledge Dr. Joao Louis Pereira for the criti-cal review and to the CFC and ICCO for the financialsupport to the BIOMOL project. We also acknowledge
two anonymous reviewers for the suggestions for theimprovement of the paper.
References
ABC, CNPC and Copercacau, 2001. Pacto do Cacau–Programa
de Recuperacao da Lavoura Cacaueira. Resumo da Proposta de
Readequacao. Ilheus: CEPLAC. 20p.
Bartley, B.G.D. 1981. The status of genetic resistance in ca-
cao to Crinipellis perniciosa (Stahel) Singer. In: Proceed-
ings of the 6th International Cocoa Research Conference,
Caracas, Venezuela, 1977. Imprimiere, Lome, Togo, pp. 57–
69.
Bartley, B.G.D., 1983. Retrospect of research on resistance of cacao
to Crinipellis perniciosa. In: Proceedings of the 2nd International

235
Workshop on the witches’ broom disease of cacao. CEPLAC,
Itabuna, Brazil, pp. 32–35.
Basten, C.J., B.S. Weir & Z.B. Zeng, 1994. Zmap-A QTL cartogra-
pher In: Smith C., J.S. Gavona, B. Benkel, J. Chesnais, W. Fairfull,
J.P. Gibson, B.W. Kennedy & E.B. Burnside (eds.). Proceedings
of the 5th World Congress on Genetics Applied to Livestock Pro-
duction: Computing Strategies and Software. Ontario, Canada,
pp. 65–66.
Basten, C.J., B.S. Weir & Z.B. Zeng, 1999. QTL cartographer, Ver-
sion 1.13. Departament of Statistics, North Carolina State Uni-
versity, Raleigh, NC, 132 p.
Clement, D., A.M. Risterucci, M. Ducamp, J. N’Goran & C. Lanaud,
2001. Cartographie genetique de caracteres impliques dans le ren-
dement et de caracteres des feves dans trois descendances derivees
de deux geniterurs Trinitario et dun geniteur Forastero haut ama-
zonien. In: Proceedings of the 13th International Cocoa Research
Conference, Kota Kinabalu, Malaysia, 2000. Cocoa Producer’s
Alliance, Lagos, Nigeria, pp. 91–100.
Crouzillat, D., E. Lecetau, V. Petiard, J. Moreira, J. Rodriguez, D.
Walker, W. Phillips, C. Ronning, R. Schnell, J. Osei & P. Fritz
1996. Theobroma cacao L.: a genetic linkage map and quantitative
trait loci analysis. Theor Appl Genet 93: 205–214.
Crouzillat, D., B. Menard, A. Mora, W. Phillips & V. Petiard, 2000a.
Quantitative trait analysis in Theobroma cacao using molecular
markers–Yield QTL detection and stability over 15 years. Eu-
phytica 114: 13–23.
Crouzillat, D., W. Phillips, P. Fritz & V. Petiard, 2000b. Quantita-
tive trait analysis in Theobroma cacao using molecular markers–
Inheritance of polygenic resistance to Phytophthora palmivora in
two related cacao populations. Euphytica 114: 25–36.
Doyle, J.J. & J.L. Doyle, 1990. Isolation of plant DNA from fresh
tissue. Focus 12: 13–15.
Faleiro, F.G., V.A. Ragagnin, I. Shuster, R.X. Correa, P.I. Good-God,
S.H. Brommonshenkel, M.A. Moreira & E.G. Barros, 2003. Ma-
peamento de genes de resistencia do feijoeiro-comum a ferrugem,
antracnose e mancha-angular com o auxılio de marcadores RAPD.
Fitopat Bras 28: 59–66.
Faleiro, F.G., I.S. Santos, R.C.S. Bahia, R.F. Santos, M.M. Yamada
& D. Anhert, 2002. Otimizacao da extracao e amplificacao de
DNA de Theobroma cacao L. visando a obtencao de marcadores
RAPD. Agrotropica 14: 31–34.
Jansen, R.C. 1993. Maximum likelihood in a generalized linear finite
mixture model by using the EM algorithm. Biometrics 49: 227–
231.
Kosambi, D.D. 1994. The estimation of map distances from recom-
bination values. Ann Eugen 12: 172–175.
Lanaud, C., A.M. Risterucci, A.K.J. N’Goran, D. Clement, M.H.
Flament, V. Laurent & M.A. Falque, 1995. Genetic linkage map
of Theobroma cacao L. Theor Appl Genet 91: 987–993.
Lanaud, C., I. Kebe, A.M. Risterucci, J.A.K. N’Goran, L. Grivet, M.
Tahi, C. Cilas, I. Pieretti, A. Eskes & D. Despreaux, 1997. Map-
ping quantitative trait loci (QTLs) for resistance to Phytophthorapalmivora in T. cacao. In: Plant & Animal Genome Conference,
5, Proceedings. Scherago International, San Diego, p. 137.
Mangin, B., B. Goffinet & A. Rebal, 1994. Constructing con-
fidence intervals for QTL location. Genetics 138: 1301–
1308.
Motilal, L.A., O. Sounigo, J.M. Thevenin, A.M. Risterucci, I.
Pieretti, J.L. Noyer & C. Lanaud, 2001. Theobroma cacao L.:
Genome map and QTLs for Phytophthora palmivora resistance.
In: Proceedings of the 13th International Cocoa Research Confer-
ence, Kota Kinabalu, Malaysia, 2000. Cocoa Producer’s Alliance,
Lagos, Nigeria, pp. 111–118.
Paterson, A.H. 1996. Genome mapping in plants. San Diego: Aca-
demic. 330p. Pereira S. L., A. Ram, I. M. Figueredo & L.C.C.
Almeida, 1989. Primeira ocorrencia da vassoura-de-bruxa na
principal regiao produtora de cacau do Brasil. Agrotropica 1: 79–
81.
Pugh, T., O. Fouet, A.M. Risterucci, P. Brottier, M. Abouladze, C.
Deletrez, B. Coutois, D. Clement, P. Larmande, J.A.K. Goran &
C. Lanaud, 2004. A new cacao linkage map based on codominant
markers: development and integration of 201 new microsatellite
markers, Theor Appl Genet 108: 1151–1161.
Queiroz, V.T., C.T. Guimaraes, D. Ahnert, T. Schuster, R.T. Daher,
M.G. Pereira, V.R.M. Miranda, L.L. Loguercio, E.G. Barros &
M.A. Moreira, 2003. Identification of a major QTL in cocoa
(Theobroma cacao L.) associated with resistance to witches’
broom disease. Pl Breed 122: 268–272.
Risterucci, A.M., L. Grivet, J.A.K. N’Goran, I. Pieretti, M.H. Fla-
ment & C.A. Lanaud, 2000. A high-density linkage map of Theo-broma cacao L. Theor Appl Genet 101: 948–955.
Risterucci A.M., D. Paulin, M. Ducamp, J.A.K. N’Goran & C.
Lanaud, 2003. Identification of QTLs related to cocoa resistance
to three species of Phytophthora. Theor Appl Genet 93: 205–214.
Sambrook J., E.F. Fritsch & T. Maniats, 1989. Molecular cloning: alaboratory manual. 2nd ed. New York: Cold Spring Harbor, Cold
Spring Harbor Laboratory. 653p.
Tanksley, S.D., N.D. Young, A.H. Paterson & M.W. Bonierble, 1989.
RFLP mapping in plant breeding: new tools for an old science.
Bio/Technology 7: 257–264.
Utz, H.F. & A.E. Melchinger, 1994. Comparison of different ap-
proaches to interval mapping of quantitative trait loci. In: van
Ooijen, J.W. and J. Jansen (eds), Biometrics in plant breeding :
applications of molecular markers. Proceedings of the 9th Meet-
ing of the Eucarpia Section Biometrics in Plant Breeding. Wa-
geningen, The Netherlands. pp. 195–204.
Utz, H.F., A.E. Melchinger, C.C. Shon, 2000. Bias and sampling error
of the estimated proportion of genotypic variance explained by
quantitative trait loci determined from experimental data in maize
using cross validation and validation with independent samples.
Genetics 154: 1839–1849.
Van Ooijen, J.W. 1992. Accuracy of mapping quantitative trait loci
in autogamous species. Theor Appl Genet 84: 803–811.
Van Ooijen J.W. & R.E. Voorrips, 2001. JoinMap©R
Version 3.0, Soft-
ware for the calculation of genetic linkage maps. Plant Research
International, Wageningen, the Netherlands. 51p.
Visscher, P.M.R., R. Thompson & C.S. Haley, 1996. Confidence
intervals in QTL mapping by bootstrapping. Genetics, 143: 1013–
1020.
Zeng, Z.B., 1993. Theoretical basis for the separation of multiple
linked gene effects in mapping quantitative trait loci. Proc Nat
Acad Sci USA 90: 10972–10976.
Zeng, Z.B. 1994. Precision mapping of quantitative trait loci.
Genetics 136: 1457–1468.