mapping poverty _ hispanic poverty in the united states
TRANSCRIPT

1
Hispanic Poverty in the United States
Juan Sebastian Roa
University of Maryland, College Park
School of Public Policy
October 12, 2016

2
Summary Findings
• Between 2014 and 2015 the median income of Hispanic-Origin households increased by 6.1% to $45,148, signaling the first increase since 2013.
• Data collected in 2015 shows that foreigners hold lower poverty rates than natives unless its foreign primary families and households, which have higher poverty rates than native families and native households at the 50%, 100%, and 200% poverty thresholds.
• Regardless of the nativity, female-headed families present the highest rates of poverty at all thresholds—with an estimated 1.9 million living in deep poverty.
• Native, Female-Headed Families present a 21.40% poverty rate; the highest rate in deep poverty compared to the poverty universe, persons in primary families, households, and male-headed families.
• Foreign, male-headed families held the lowest poverty rate in deep poverty at 3.20%.
• Foreign persons in the poverty universe, foreign persons in primary families, foreign primary families, foreign households and foreign female-headed families all have poverty rates of 50% or more under the 200% threshold.
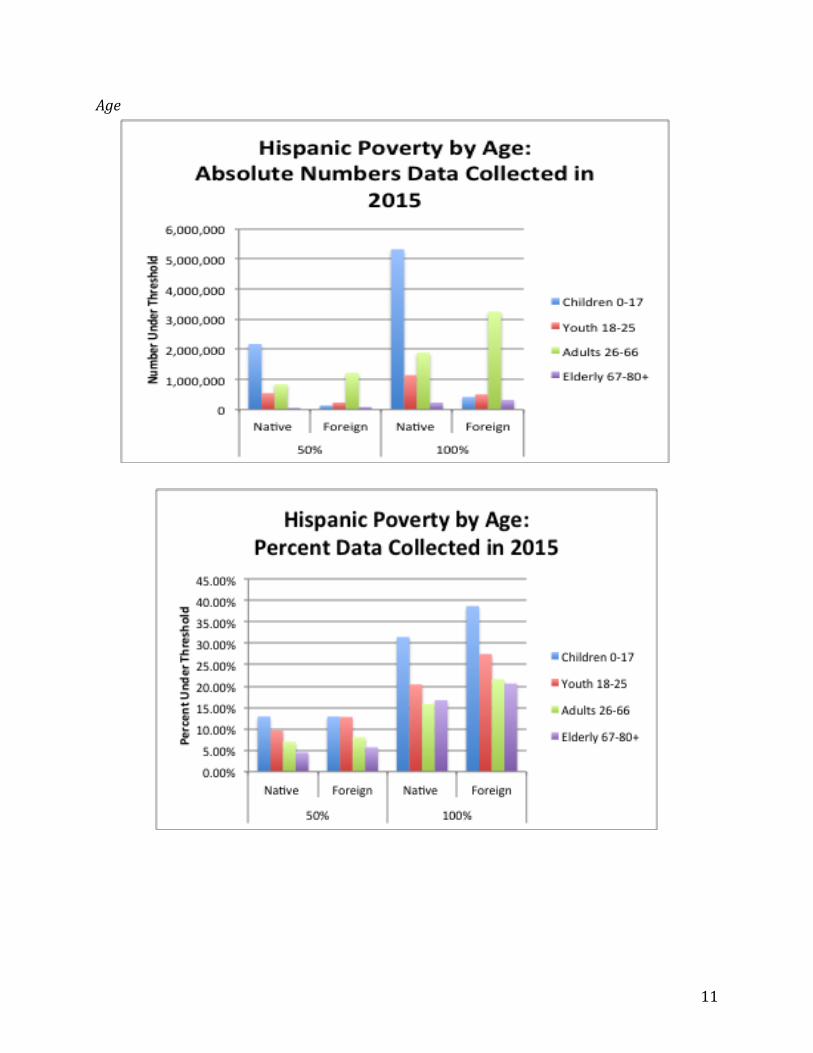
• When differentiating by age, Hispanic poverty shows that children 0-17 have the highest poverty rates at all thresholds regardless of their nativity.
• Other trends observed by age include foreigners, at all ages, holding higher poverty rates than natives- a different story told than when looking at persons, families and households as the units of analysis.
• 5.7% of the foreign, Hispanic elderly live in deep poverty compared to 4.5% of native, Hispanic elderly.
• In absolute numbers, the data show that native children, approximately 2.2 million, live in deep poverty.
• Native children have the highest absolute number below the 100% threshold, 5.3 million.
• Foreign children have 71.4% living under the 200% poverty threshold. The highest out of all the ages. Adults have 36.10% living under the 200% poverty threshold. The lowest out of all the ages.
• Hispanic children in families of non-citizens present the highest poverty rates while Hispanic children in families of naturalized
citizens present the lowest poverty rates (39.60% compared to 27.30%). The number of Hispanic children in families of citizens that live in poverty, 5.1 million, is higher than that of Hispanic children in families of non-citizens and naturalized citizens.
• The data shows that money income measures lower the poverty rates of natives, naturalized citizens, and non-citizens at the 50%, 100%, 150% and 200% thresholds.
• Under the 50% threshold, money income appears to reduce the percent of citizens in deep poverty by 5.8%, of naturalized citizens by 7.5%, and of non-citizens by 3.6%. In absolute numbers, that’s approximately 2.1 million citizens, 393 thousand naturalized citizens, and 600 thousand non-citizens that are taken out of deep poverty by using a money income measure.
• Out of the Public Assistance programs (including TANF and other cash assistance), SNAP, EITC, Social Security, and Free and Reduced Price School Lunches, EITC appears to have the greatest effect in reducing Hispanic poverty with the poverty rate declining by 4.1% due to this program.
• When looking at the effect of government programs on natives, naturalized citizens, and non-citizens, EITC has the greatest effect on citizens compared to all other programs. The poverty rate goes down 4.1% for citizens due to EITC. For naturalized citizens, Social Security had the greatest impact, lowering poverty rates by 6.7%. Lastly, for non-citizens EITC also had the greatest impact, reducing poverty by 5.1%.
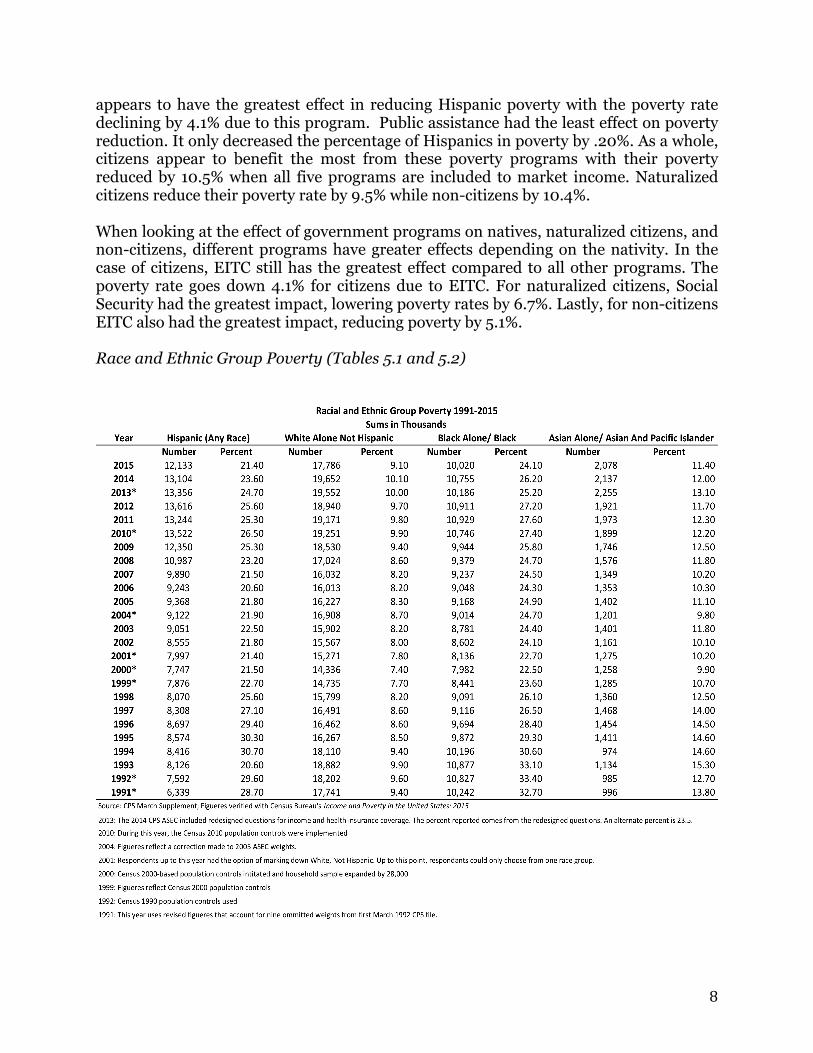
• Since 1991, the poverty rate for Hispanics has decreased by 7.3%, for Whites alone by only .30%, for Blacks alone by 8.6% and for Asians alone by 2.4%.
• Additionally, between 2008 and 2009, Hispanics appear the most affected by the recession with their poverty rates rising 2.1% compared to 0.8% for Whites, 1.1% for Blacks, and 0.7% for Asians; however, since 2009, the Hispanic poverty rate shows the highest reduction, -3.9%, compared to -0.3% for Whites, -1.7% for Blacks, and -1.1% for Asians.
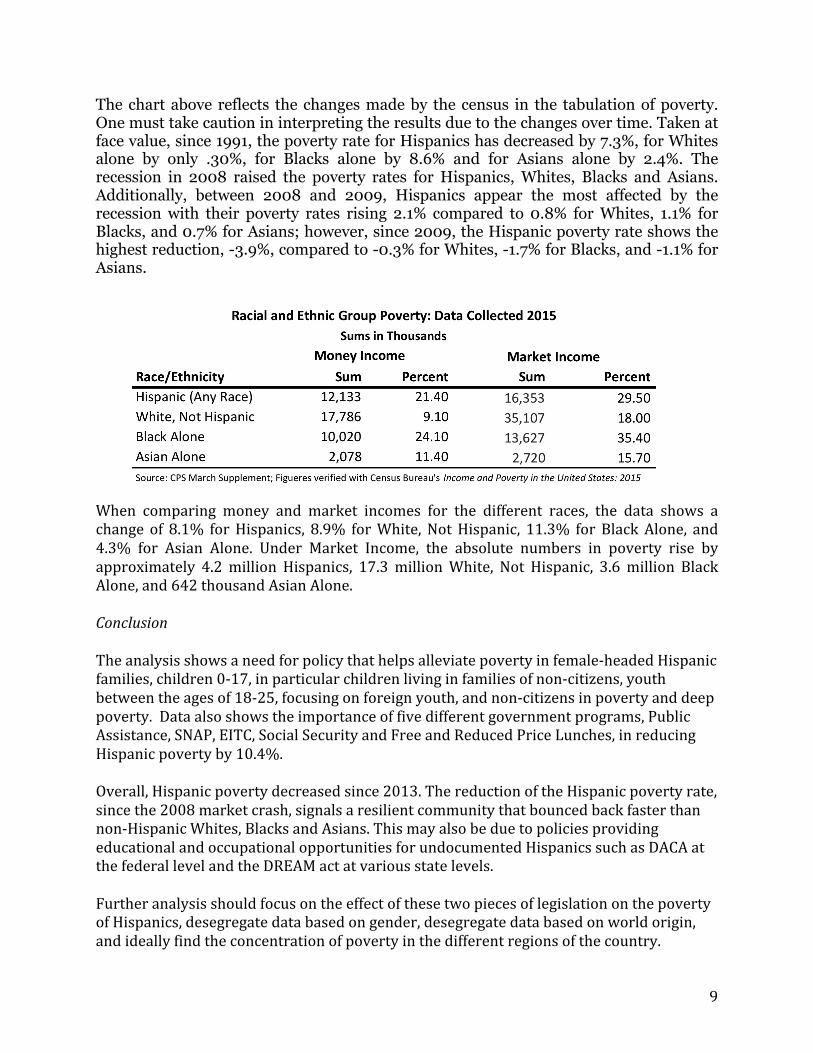
• Under Market Income, the absolute numbers in poverty rise by approximately 4.2 million Hispanics, 17.3 million White, Not Hispanic, 3.6 million Black Alone, and 642 thousand Asian Alone.

3
Profile of Hispanics in the United States To analyze the poverty of the Hispanic population it is important to first highlight its internal characteristics and statistics. In 2014, the American Community Survey reported an estimated 55.3 million Hispanics in the United States of which 64% classified as Mexican, 34.9% as foreign born, and 66.2 percent as White.1 The median age for a Hispanic in the United States is 28 years old, of which 49.5% are females and 46.1% over the ages of 18 are married. 14.4 % of the Hispanic Population above 25 years old has a bachelor’s degree or more while 61.7% hold a high school degree or less. With regards to earnings, the median annual household income in 2014 was $42,200 with median annual personal earnings reported as $22,400. Between 2014 and 2015 the median income of Hispanic-Origin households increased by 6.1% to $45,148, signaling the first increase since 2013. Approximately 40.2% reside in the West, 36.7 in the South, 14.0% in the Northeast and 9.2% in the Midwest with a majority of them, 27.1%, in California. In 2015, the Current Population Survey reports that 21.4% of Hispanic-origin people lived below the 100% federal poverty threshold—that’s approximately 12.1 million individuals not including unrelated individuals under the age of 15. There are approximately 36 million native Hispanics and 19.6 million foreign born Hispanics. Of the native population, 23.9% fall under the 100% federal poverty threshold compared to 23.4% of the foreign born population. Hispanic Poverty Units of Analysis (Table 1.1)
In order to get a better understanding of where poverty is concentrated the most in Hispanic families, one should look at the different persons, types of families and households. In order to account for the various structural and cultural advantages of native individuals compared to foreign individuals, the data represents three different thresholds that make distinctions between native and foreign. An important limitation to consider, but that does not heavily distort the results of the data, involves the foreign category including the count of naturalized citizens, which may have more social, 1 Pew Research Center tabulations for the year 2014 based on the American Community Survey of that year. The American Community Survey provides yearly information on the U.S. and its people through monthly surveys to
4
academic and cultural opportunities than non-citizens. For this reason, the following charts will delve deeper into the distinctions between natives, naturalized citizens and non-citizens. Data collected in 2015 shows that foreigners hold lower poverty rates than natives unless its foreign primary families and households, which have higher poverty rates than native families and native households at the 50%, 100%, and 200% poverty thresholds. Regardless of the nativity, female-headed families present the highest rates of poverty at all thresholds—with an estimated 1.9 million living in deep poverty. Deep Poverty. From the data presented, Native, Female-Headed Families present a 21.40% poverty rate; the highest rate in deep poverty compared to the poverty universe, persons in primary families, households, and male-headed families. Foreign, male-headed families held the lowest poverty rate in deep poverty at 3.20%. As a whole, there are 3,630,250 native Hispanics in the poverty universe that live in deep poverty compared to 1,685,567 foreign Hispanics. 100% Threshold. Native, female-headed families, under the 100% federal poverty level hold a poverty level of 41.90% compared to the 18.20% of native primary families and 21.20% of male-headed families. Similarly, foreign, female-headed families presented a poverty rate of 35.80% compared to 24.50% in primary families, and 15.30% in male-headed families. Again, under the 100% federal poverty threshold, we find that foreign, male-headed families hold the lowest poverty rate and native-female families hold the highest poverty rates. 200% Threshold. Foreign persons in the poverty universe, foreign persons in primary families, foreign primary families, foreign households and foreign female-headed families all have poverty rates of 50% or more under the 200% threshold. The only foreign group that does not have a majority under the 200% threshold is the male-headed families group at 40.60%. Contrary to the foreign groups, only persons in the poverty universe, persons in primary families, and female-headed families had a majority of their group under the 200% poverty threshold. The rest, primary families, households, and male-headed families did not have a majority of their groups under the 200% poverty threshold. Age (Table 2.1)
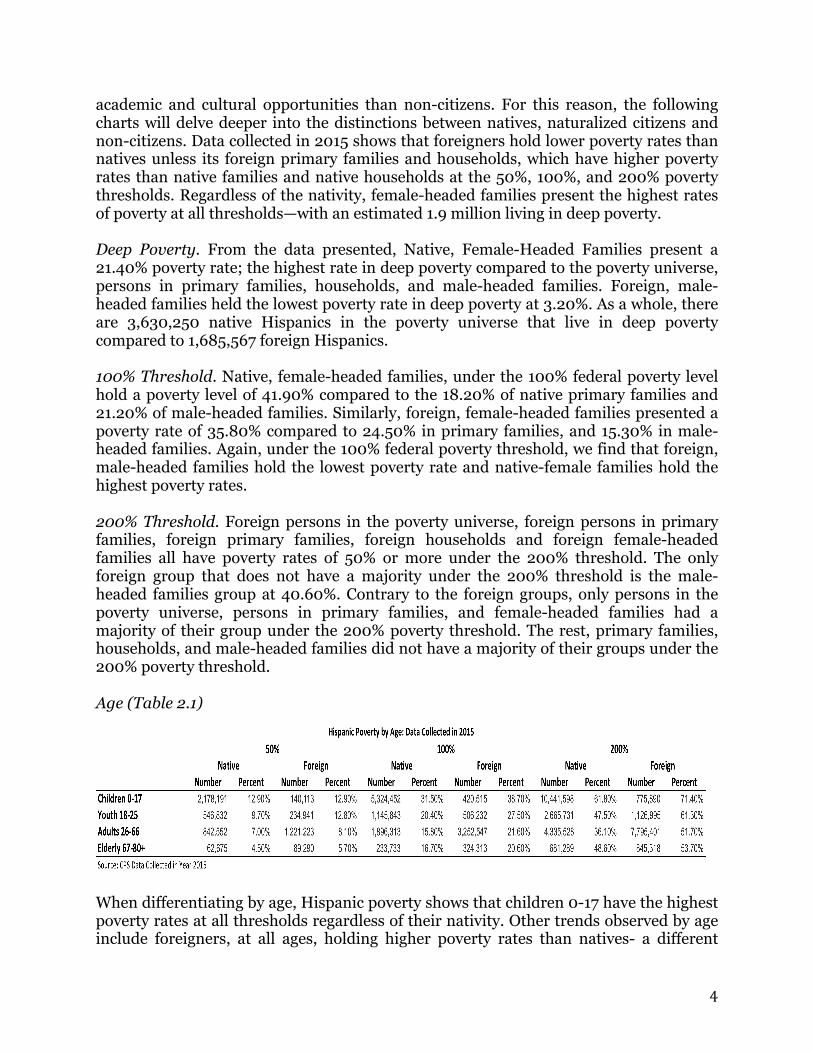
When differentiating by age, Hispanic poverty shows that children 0-17 have the highest poverty rates at all thresholds regardless of their nativity. Other trends observed by age include foreigners, at all ages, holding higher poverty rates than natives- a different

5
story told than when looking at persons, families and households as the units of analysis. This does not mean that one must infer natives are doing better. Looking at absolute numbers, as an example, we see that 2,178,191 native children live in poverty compared to 140,113 foreign children. An important consideration here includes the idea that foreigners and naturalized citizens have native children, in which case that would reflect a possible link between the high absolute numbers of native children 0-17 compared to the high absolute numbers of adults 26-66. Deep Poverty. 5.7% of the foreign, Hispanic elderly live in deep poverty compared to 4.5% of native, Hispanic elderly. In absolute numbers, the data show that native children, approximately 2.2 million, live in deep poverty. Native children and native youth hold higher absolute numbers living in deep poverty than foreign children and foreign youth; however, foreign adults and foreign elderly hold higher numbers in deep poverty than native adults and native elderly. This can signal that native children and youth may correspond to families in which adults and elderly are foreign leading to the high numbers of native children and youth living in deep poverty. 100% Threshold. Under this threshold, foreign children hold the highest poverty rate, 38.7%, compared to 15.8% of native adults. Native children have the highest absolute number below the 100% threshold, 5.3 million, while the native elderly have the lowest absolute number in poverty, 233,733, possibly due to lower numbers of elderly. Following the elderly, foreign children hold the lowest absolute number in poverty; 420,515. 200% Threshold. Foreign children have 71.4% living under the 200% poverty threshold; the highest out of all the ages. Adults have 36.10% living under the 200% poverty threshold; the lowest out of all the ages. Approximately 10.4 million native children live below this threshold; the highest compared to other age groups, while around 681,289 native elderly take part of the group with the lowest absolute number living under the 200% poverty threshold. The elderly, like in the previous thresholds, may not be a good unit of comparison; therefore, one should look at other children, adults, and youth. An estimated 775,890 foreign children and 1.1 million foreign youth lived below the 200% poverty level; the lowest following the absolute numbers of the elderly. Age- Children (Table 2.2)
Nativity can encompass subcategories such as citizens, naturalized citizens, and non-citizens. In this case, the data analyzes the poverty of children by looking at whether

6
they’re from families of naturalized citizens, citizens, or non-citizens. This allows for the decomposition of the 5.3 million native children and 420,515 foreign children living in poverty. This different perspective on the data shows that Hispanic children in families of non-citizens present the highest poverty rates while Hispanic children in families of naturalized citizens present the lowest poverty rates (39.60% compared to 27.30%). The number of Hispanic children in families of citizens that live in poverty, 5.1 million, is higher than that of Hispanic children in families of non-citizens and naturalized citizens. Nativity Detailed (Tables 3.1 and 3.2)
In brief, money income measures typically count government assistance while market income measures do not.2 Many undocumented, Hispanic families do not receive government assistance of one form or another. Even then, one can also say that some citizen families do not receive all of the government assistance they may be eligible to receive due to lack of information or language barriers. Despite the individual situations, looking at money vs. market income allows for a description of the effect that government programs have on the poverty rates of various groups. The data shows that money income measures lower the poverty rates of natives, naturalized citizens, and non-citizens at the 50%, 100%, 150% and 200% thresholds. In addition to this, non-citizens present higher poverty rates than citizens and naturalized citizens at all but the 50% threshold of Market Income. Deep Poverty. Under the 50% threshold, money income appears to reduce the percent of citizens in deep poverty by 5.8%, of naturalized citizens by 7.5%, and of non-citizens by 3.6%. In absolute numbers, that’s approximately 2.1 million citizens, 393 thousand
2 For detailed income components that are counted under both Money and Market income see http://www.census.gov/cps/data/incdef.html
7
naturalized citizens, and 600 thousand non-citizens that are taken out of deep poverty by using a money income measure. 100% Threshold. Under the 100% threshold, money income appears to reduce the percent of citizens in poverty by 6%, of naturalized citizens by 7.4%, and of non-citizens by 4.9%. In absolute numbers, that’s approximately 2.1 million citizens, 482 thousand naturalized citizens, and 637 thousand non-citizens that are taken out of poverty by using a money income measure. 150% Threshold. Money income appears to reduce the percent of citizens under the 150% threshold by 5.2%, of naturalized citizens by 6%, and of non-citizens by 5%. In absolute numbers, that’s approximately 1.8 million citizens, 400 thousand naturalized citizens, and 409 thousand non-citizens that are taken out of the 150% poverty threshold by using a money income measure. 200% Threshold. Money income appears to reduce the percent of citizens under the 200% threshold by 3.6%, of naturalized citizens by 4.1%, and of non-citizens by 3.2%. In absolute numbers, that’s approximately 1.3 million citizens, 300 thousand naturalized citizens, and 400 thousand non-citizens that are taken out of the 200% poverty threshold by using a money income measure. Government Programs (Table 4)
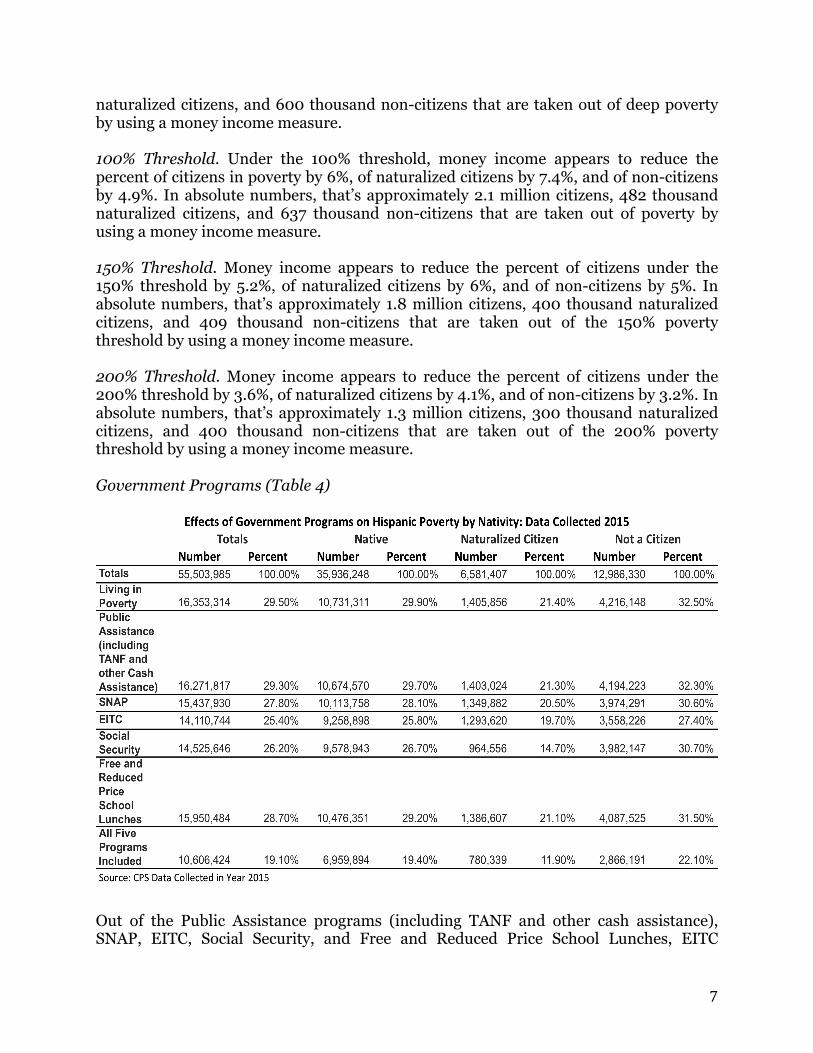
Out of the Public Assistance programs (including TANF and other cash assistance), SNAP, EITC, Social Security, and Free and Reduced Price School Lunches, EITC
8
appears to have the greatest effect in reducing Hispanic poverty with the poverty rate declining by 4.1% due to this program. Public assistance had the least effect on poverty reduction. It only decreased the percentage of Hispanics in poverty by .20%. As a whole, citizens appear to benefit the most from these poverty programs with their poverty reduced by 10.5% when all five programs are included to market income. Naturalized citizens reduce their poverty rate by 9.5% while non-citizens by 10.4%. When looking at the effect of government programs on natives, naturalized citizens, and non-citizens, different programs have greater effects depending on the nativity. In the case of citizens, EITC still has the greatest effect compared to all other programs. The poverty rate goes down 4.1% for citizens due to EITC. For naturalized citizens, Social Security had the greatest impact, lowering poverty rates by 6.7%. Lastly, for non-citizens EITC also had the greatest impact, reducing poverty by 5.1%. Race and Ethnic Group Poverty (Tables 5.1 and 5.2)
9
The chart above reflects the changes made by the census in the tabulation of poverty. One must take caution in interpreting the results due to the changes over time. Taken at face value, since 1991, the poverty rate for Hispanics has decreased by 7.3%, for Whites alone by only .30%, for Blacks alone by 8.6% and for Asians alone by 2.4%. The recession in 2008 raised the poverty rates for Hispanics, Whites, Blacks and Asians. Additionally, between 2008 and 2009, Hispanics appear the most affected by the recession with their poverty rates rising 2.1% compared to 0.8% for Whites, 1.1% for Blacks, and 0.7% for Asians; however, since 2009, the Hispanic poverty rate shows the highest reduction, -3.9%, compared to -0.3% for Whites, -1.7% for Blacks, and -1.1% for Asians. When comparing money and market incomes for the different races, the data shows a change of 8.1% for Hispanics, 8.9% for White, Not Hispanic, 11.3% for Black Alone, and 4.3% for Asian Alone. Under Market Income, the absolute numbers in poverty rise by approximately 4.2 million Hispanics, 17.3 million White, Not Hispanic, 3.6 million Black Alone, and 642 thousand Asian Alone. Conclusion The analysis shows a need for policy that helps alleviate poverty in female-‐headed Hispanic families, children 0-‐17, in particular children living in families of non-‐citizens, youth between the ages of 18-‐25, focusing on foreign youth, and non-‐citizens in poverty and deep poverty. Data also shows the importance of five different government programs, Public Assistance, SNAP, EITC, Social Security and Free and Reduced Price Lunches, in reducing Hispanic poverty by 10.4%. Overall, Hispanic poverty decreased since 2013. The reduction of the Hispanic poverty rate, since the 2008 market crash, signals a resilient community that bounced back faster than non-‐Hispanic Whites, Blacks and Asians. This may also be due to policies providing educational and occupational opportunities for undocumented Hispanics such as DACA at the federal level and the DREAM act at various state levels. Further analysis should focus on the effect of these two pieces of legislation on the poverty of Hispanics, desegregate data based on gender, desegregate data based on world origin, and ideally find the concentration of poverty in the different regions of the country.

10
Appendix: Graphs
Units of Analysis
11
Age

12
Nativity
0
2,000,000
4,000,000
6,000,000
8,000,000
10,000,000
12,000,000
14,000,000
16,000,000
18,000,000
Market Money Market Money Market Money
50% 100% 150%
Num
ber Below Thresholds
Hispanics in Poverty by Detailed Nativity and Type of Income: Absolute Numbers
Native
Naturalized Citizen
Not a Citizen
-‐5.80% -‐6.00%
-‐5.20%
-‐7.50% -‐7.40%
-‐6.00%
-‐3.60%
-‐4.90% -‐5.00%
-‐8.00%
-‐7.00%
-‐6.00%
-‐5.00%
-‐4.00%
-‐3.00%
-‐2.00%
-‐1.00%
0.00% Threshold Threshold Threshold
50% 100% 150%
Percent Difference
Differences between Market and Money Income Measures
Native
Naturalized Citizen
Not a Citizen

13
-‐2500000
-‐2000000
-‐1500000
-‐1000000
-‐500000
0 Threshold Threshold Threshold
50% 100% 150%
Num
ber Difference
Differences between Market and Money Income Measures
Native
Naturalized Citizen
Not a Citizen

14
Race and Hispanic Origin
Hispanic (Any Race), 28.70
White Alone Not Hispanic, 9.40
Black Alone/ Black , 32.70
Asian Alone/ Asian And Paci_ic Islander,
13.80
0.00
5.00
10.00
15.00
20.00
25.00
30.00
35.00
40.00
Percent
Year
Poverty Rate by Race and Hispanic Origin 1991-‐2015

15
References
Proctor, Bernadette D., Jessica L. Semega, and Melissa A. Kollar. "Income and Poverty in the United States: 2015." US Census Bureau Current Population Report P60-‐256 (2016).
Stepler, Renee, and Anna Brown. "Statistical portrait of Hispanics in the United States,
1980–2014." Pew Research Center. http://www.pewhispanic.org (2015).